Article

Diversity of Antimicrobial Peptides in Three Partially Sympatric Frog Species in Northeast Asia and Implications for Evolution

1
Department of Physiology, College of Wildlife and Protected Area, Northeast Forestry University, Harbin 150040, China
2
Department of Ecology, School of Life Sciences, Lanzhou University, Lanzhou 730000, China
3
BGI-Shenzhen, Shenzhen 518083, China
4
Beijing E-young Technology Company Limited, Beijing 100021, China
5
State Forestry and Grassland Administration Detecting Centre of Wildlife, Harbin 150040, China
6
State Forestry and Grassland Administration Research Center of Engineering Technology for Wildlife Conservation and Utilization, Harbin 150040, China
*
Author to whom correspondence should be addressed.
Genes 2020, 11(2), 158; https://doi.org/10.3390/genes11020158
Submission received: 23 December 2019 / Revised: 27 January 2020 / Accepted: 30 January 2020 / Published: 1 February 2020
(This article belongs to the Section Animal Genetics and Genomics)

Abstract

:
Antimicrobial peptides (AMPs) are evolutionarily ancient molecules that play an essential role in innate immunity across taxa from invertebrates to vertebrates. The evolution system of AMP system has not been well explained in the literature. In this study, we cloned and sequenced AMP transcriptomes of three frog species, namely Rana dybowskii, Rana amurensis, and Pelophylax nigromaculatus, which are partially sympatric in northeast Asia, but show different habitat preferences. We found that each species contained 7 to 14 families of AMPs and the diversity was higher in species with a large geographic range and greater habitat variation. All AMPs are phylogenetically related but not associated with the speciation process. Most AMP genes were under negative selection. We propose that the diversification and addition of novel functions and improvement of antimicrobial efficiency are facilitated by the expansion of family members and numbers. We also documented significant negative correlation of net charges and numbers of amino acid residues between the propiece and mature peptide segments. This supports the Net Charge Balance Hypothesis. We propose the Cut Point Sliding Hypothesis as a novel diversification mechanism to explain the correlation in lengths of the two segments.

1. Introduction

Amphibians live in humid or aquatic environments that support the growth of complex microbial communities, including pathogenic microbes. Unlike higher vertebrates whose bodies are well protected by a thick and hard keratin layer, this class of organisms has only one or two layers of mild keratinocyte cells on the body surface, making the skin highly permeable and vulnerable [1,2]. Such a weak physical barrier cannot provide guaranteed protection from pathogenic attacks. As compensation, amphibians have a powerful antiseptic barrier in the skin that is made up of antimicrobial peptides (AMPs), small cationic and amphipathic peptides highly efficient at destroying microbial pathogens [3,4]. These are synthesized, matured, and stored in granular glands, and dissolved in the mucosal layer from which they attack microbes that invade the skin [5,6].
AMPs are composed of ~10–60 amino acid residues, with a molecular mass of approximately 4000–6000. They occur naturally in all living beings and carry out highly specific biological activities, whose specificity is mainly based on and dependent on their primary sequences and, ultimately, on their conformational structure. They are cationic and amphipathic molecules, hydrophilic at the N end and hydrophobic at the C end. These cationic characteristics and amphipathicity are the key features conferring an antimicrobial capacity on AMPs [7]. AMPs are arranged in an α helix, β folding, and loop structures [8], and are stable in hot and acid environments [9]. They resist bacteria through mechanisms such as membrane interference, inhibition of nucleic acid synthesis, protein synthesis, and enzymatic activity [10]. In addition, many AMPs have antiviral, antifungal, antiprotozoal, and antitumoral capacities [11].
AMPs are highly diverse. Amphibian species might synthesize up to 66,000 different kinds of AMPs [12,13]. They can be sorted into different families according to their structure and physicochemical properties [14]. Variation of amino acid residues of family members often alters the secondary structure and physicochemical properties, and further shifts antimicrobial efficiency and spectrum. It is thus apparent that expansion of family characteristics and boosting of variation may improve defense capability. Gene duplication and focal point mutation are driven by positive selection [15,16]. Consequently, an anuran genome contains several gene families with a variable number of member genes encoding a large batch of AMPs. Meanwhile, regulatory events such as an increased mutation rate and multiple gene loci during expression further facilitate the diversity of the AMP profile [16,17]. An individual anuran may contain 10–20 AMPs of different lengths, net charges, hydrophobicity, structures, and antimicrobial spectra [18,19]. The expression profile can be contingent on environmental context; exposure to varied microbial communities can result in expression of AMP profiles that vary by species and quantity of AMPs [20].
The AMP system is the most important component of innate immunity in amphibians. Its evolution is thus an interesting and important subject. Hypotheses on the mechanism of evolution include positive (diversifying) selection [16], balancing selection [21], hypermutation [22], and domain shuffling or gene conversion among AMP genes [23]. However, these hypotheses have proven inadequate to describe the entire process of evolution of the AMP system. To complete the evolutionary picture, systematic studies are needed at the biochemical (structure-function relationship), cellular (signaling and expression regulation), physiological (immune efficiency), and ecological (relationship between AMP immunity and environmental microbial pressure) levels. Such studies could explain how selection pressure is placed on an AMP profile, how a single specific AMP responds to a type of selection pressure under the influence of regulatory mechanisms, and how its gene evolves under such selection. To achieve this, it essential to provide a full list of expressible AMP genes as the background/potential expression profile. However, most studies have been performed under specific environments that preclude expression of the full range of background expression profiles [16,22].
In this study, we examined three frog species of northeast Asia, viz. Amur brown frog (Rana amurensis), Dybowski’s frog (Rana dybowskii), and black-spotted frog (Pelophylax nigromaculatus). Although their geographic ranges partially overlap, their habitats are different. The range of R. dybowskii is limited to northeast Asia, including the Russian Far East, Korean Peninsula, Tsushima Island of Japan, and northeastern China. In contrast, R. amurensis is widely distributed in the Palearctic region across Siberia, the Russian Far East, the Korean peninsula, northern and central Mongolia, and northeastern China. P. nigromaculatus ranges from the Russian Far East and Turkmenia, northern to south China, the Korean Peninsula, and Japan [24]. P. nigromaculatus inhabits a wider variety of habitats than do the other two species. These species can share common habitats but also have discrete habitat preferences where their ranges overlap [25,26,27]. This makes them ideal models to study AMP evolution under variable ecological contexts. This study established the background AMP transcriptomes of the three species by sampling frogs from various habitats, predicted AMPs’ structural and physicochemical characteristics, and documented new findings that highlight novel evolutionary mechanisms. Meanwhile, we added a set of novel AMPs to the growing database for anurans, information that could benefit future biological studies and/or drug development.

2. Materials and Methods

2.1. Collection of Skin Tissues

A total of 12 adult frogs of each of our three study species were collected from various habitats in northeast China, including riverbanks (n = 3 for each species), paddy fields (n = 3 for each species), ponds in woodlands (n = 3 for each species), and natural saline-alkaline wetlands (n = 3 for P. nigromaculatus only because the other two species did not occupy this habitat). Three additional individuals of each species were captured from riverbanks and raised in the lab for 3 weeks in fully aerated fresh water. Water was replaced once each day and the frogs were fed mealworms. Three biological repetitions were evaluated for each habitat. The frogs were killed by pithing the spinal cord and brain. Dorsal skin was removed and immediately frozen in liquid nitrogen for storage prior to study.

2.2. Cloning of cDNA of Antimicrobial Peptide (AMP) Genes

A piece of frozen dorsal skin weighing about 100 mg was ground into powder in liquid nitrogen. Total RNA was extracted using the Trizol method (TRIzol, TaKaRa, Japan) according to the manufacturer’s instructions. After quantification using NanoPhotometer-N50 (Implen, Germany), all RNA extracts of each species were pooled equally. Complementary DNA (cDNA) was synthesized using an RNA PCR Kit (AMV) Ver3.0 (TaKaRa, Japan). Briefly, a universal primer PC: 5′-T23 (C/G/A)-3′ was used to synthesize the first-strand cDNA with input of 500 ng pooled total RNA in a 10 μL system following the instructions provided in the user manual of the kit. The reaction program consisted of 42 °C/30 min, 99 °C/5 min, and 5 °C/5 min.
A total of 10 degenerated forward primers, named PS1~PS10, were designed based on the conservative sequence in the signal peptide region of known anuran AMP genes using Primer-BLAST (NCBI), theoretically amplifying all families of AMPs of anurans. The universal primer PC was used as the reverse primer. All primer sequences are shown in Table 1. PCR amplifications were carried out using reverse transcription products as templates in a 50 μL system containing 10 μL 5× PCR buffer and 0.25 μL TaKaRa Ex Taq HS (5 U/μL) (TaKaRa, Japan), 1 μL (10 μmol/μL) forward primer, and 10 μL template. Thermal cycling program was 94 °C/2min, (94 °C/30s; Ta/30s; 72 °C/30s) for 35 cycles; 72 °C/5 min. PCR products were separated on 1.5% agarose gel. The target fragments were excised and recovered using DNA purification kit (AXYGEN, USA).
PCR products were ligated to the pMD-18T vector and transformed into Escherichia coli DN5α competent cells using a pMD-18T connection kit (TaKaRa, Japan). The competent cells were cultured for 12–16 h on LB medium containing 50 μg/mL Ampicillin. Single colonies were picked up and transferred to liquid LB medium for culture for about 2–3 h till OD600 reached 0.5. A sample of the bacteria solution measuring 1 μL was used as template for screening positive clones in the same PCR system as mentioned previously. Positive clones were sequenced using M13+/M13-primers using the BigDye Terminator v3.1 Cycle Sequencing Kit (Thermo Fisher Scientific, USA).

2.3. Prediction of Physicochemical Properties and Secondary Structure of Antimicrobial Peptides (AMPs)

For obtained sequences, vector sequence was removed from AMP sequence using the software EditSeq in the DNAstar software package (version 7.1.0, DNASTAR, Madison, Wisconsin, USA). All sequences were aligned and compared using MegAlign software in the same package. A cDNA sequence was determined using identical sequences from at least three different clones. Each cDNA sequence was blasted in the GenBank database (accessed on 20 October 2015). The signal peptide, acidic propiece, and mature peptide region was determined according to the annotation of homogeneous peptides. The amino acid logos of the mature peptides for all three frog species were created through the website WebLogo 3 [28]. Phylogenetic trees were constructed for all AMP cDNA sequences after the untranslated region was cut off. Trees were inferred by Akaike Information Criterion (AIC) for automatic model selection using PhyML-SMS on the Booster website [29]. The stability of phylogenetic trees was tested by bootstrap resampling analysis of 1000 replicates using BOOSTER [30], using only the branches with transfer bootstrap expectation (TBE) higher than 60. The tree was embellished at the EvolView website [31]. With reference to homologous sequences in GenBank, each clade with common characteristics, including length of each region, putative sequence, and secondary structure of matured peptide, was assigned to a family. For novel AMP sequences that had no homologous sequence registered in GenBank, we named them according to the nomenclature guideline [32]. All confirmed AMP gene sequences were deposited to the NCBI database. Meanwhile, DnaSP (version 6.12.03, Universitat de Barcelona, Barcelona, Spain) [33] was used to analyze the nucleotide diversity of the cDNA sequences of each AMP family for the three frog species, expressed as Mean Pi value ± SD.
The cDNA sequence of each AMP was translated into amino acid sequences using EditSeq software. Theoretical molecular weight, isoelectric point, hydrophilicity, and stability were calculated using the tools provided at the online website ExPASy [34]. Secondary structural characteristics and solubility were predicted by means of websites [35,36]. Then, the correlation between the length of acidic propiece and the length of mature peptide, and between the net charge of propiece and mature peptide were statistically analyzed by SPSS (version 19.0, IBM, Armonk, NY, USA)using 266 AMP amino acid sequences.
To test the selection pressure of genes in each AMP family, the ratio of nucleotide non-synonymous mutation rate (dN) to synonymous mutation rate (dS), dN/dS, usually expressed as omega (ω) was tested using the codemL program in PamL4.9h (version 4.9h, Ziheng Yang, University College London, London, England) under different codon substitution models M0 (one ratio) [37]. Using the same set of frog sequences, we also examined the transition (ts)/transversion (tv) values of the propiece and the mature peptide with the program codemL.

3. Results

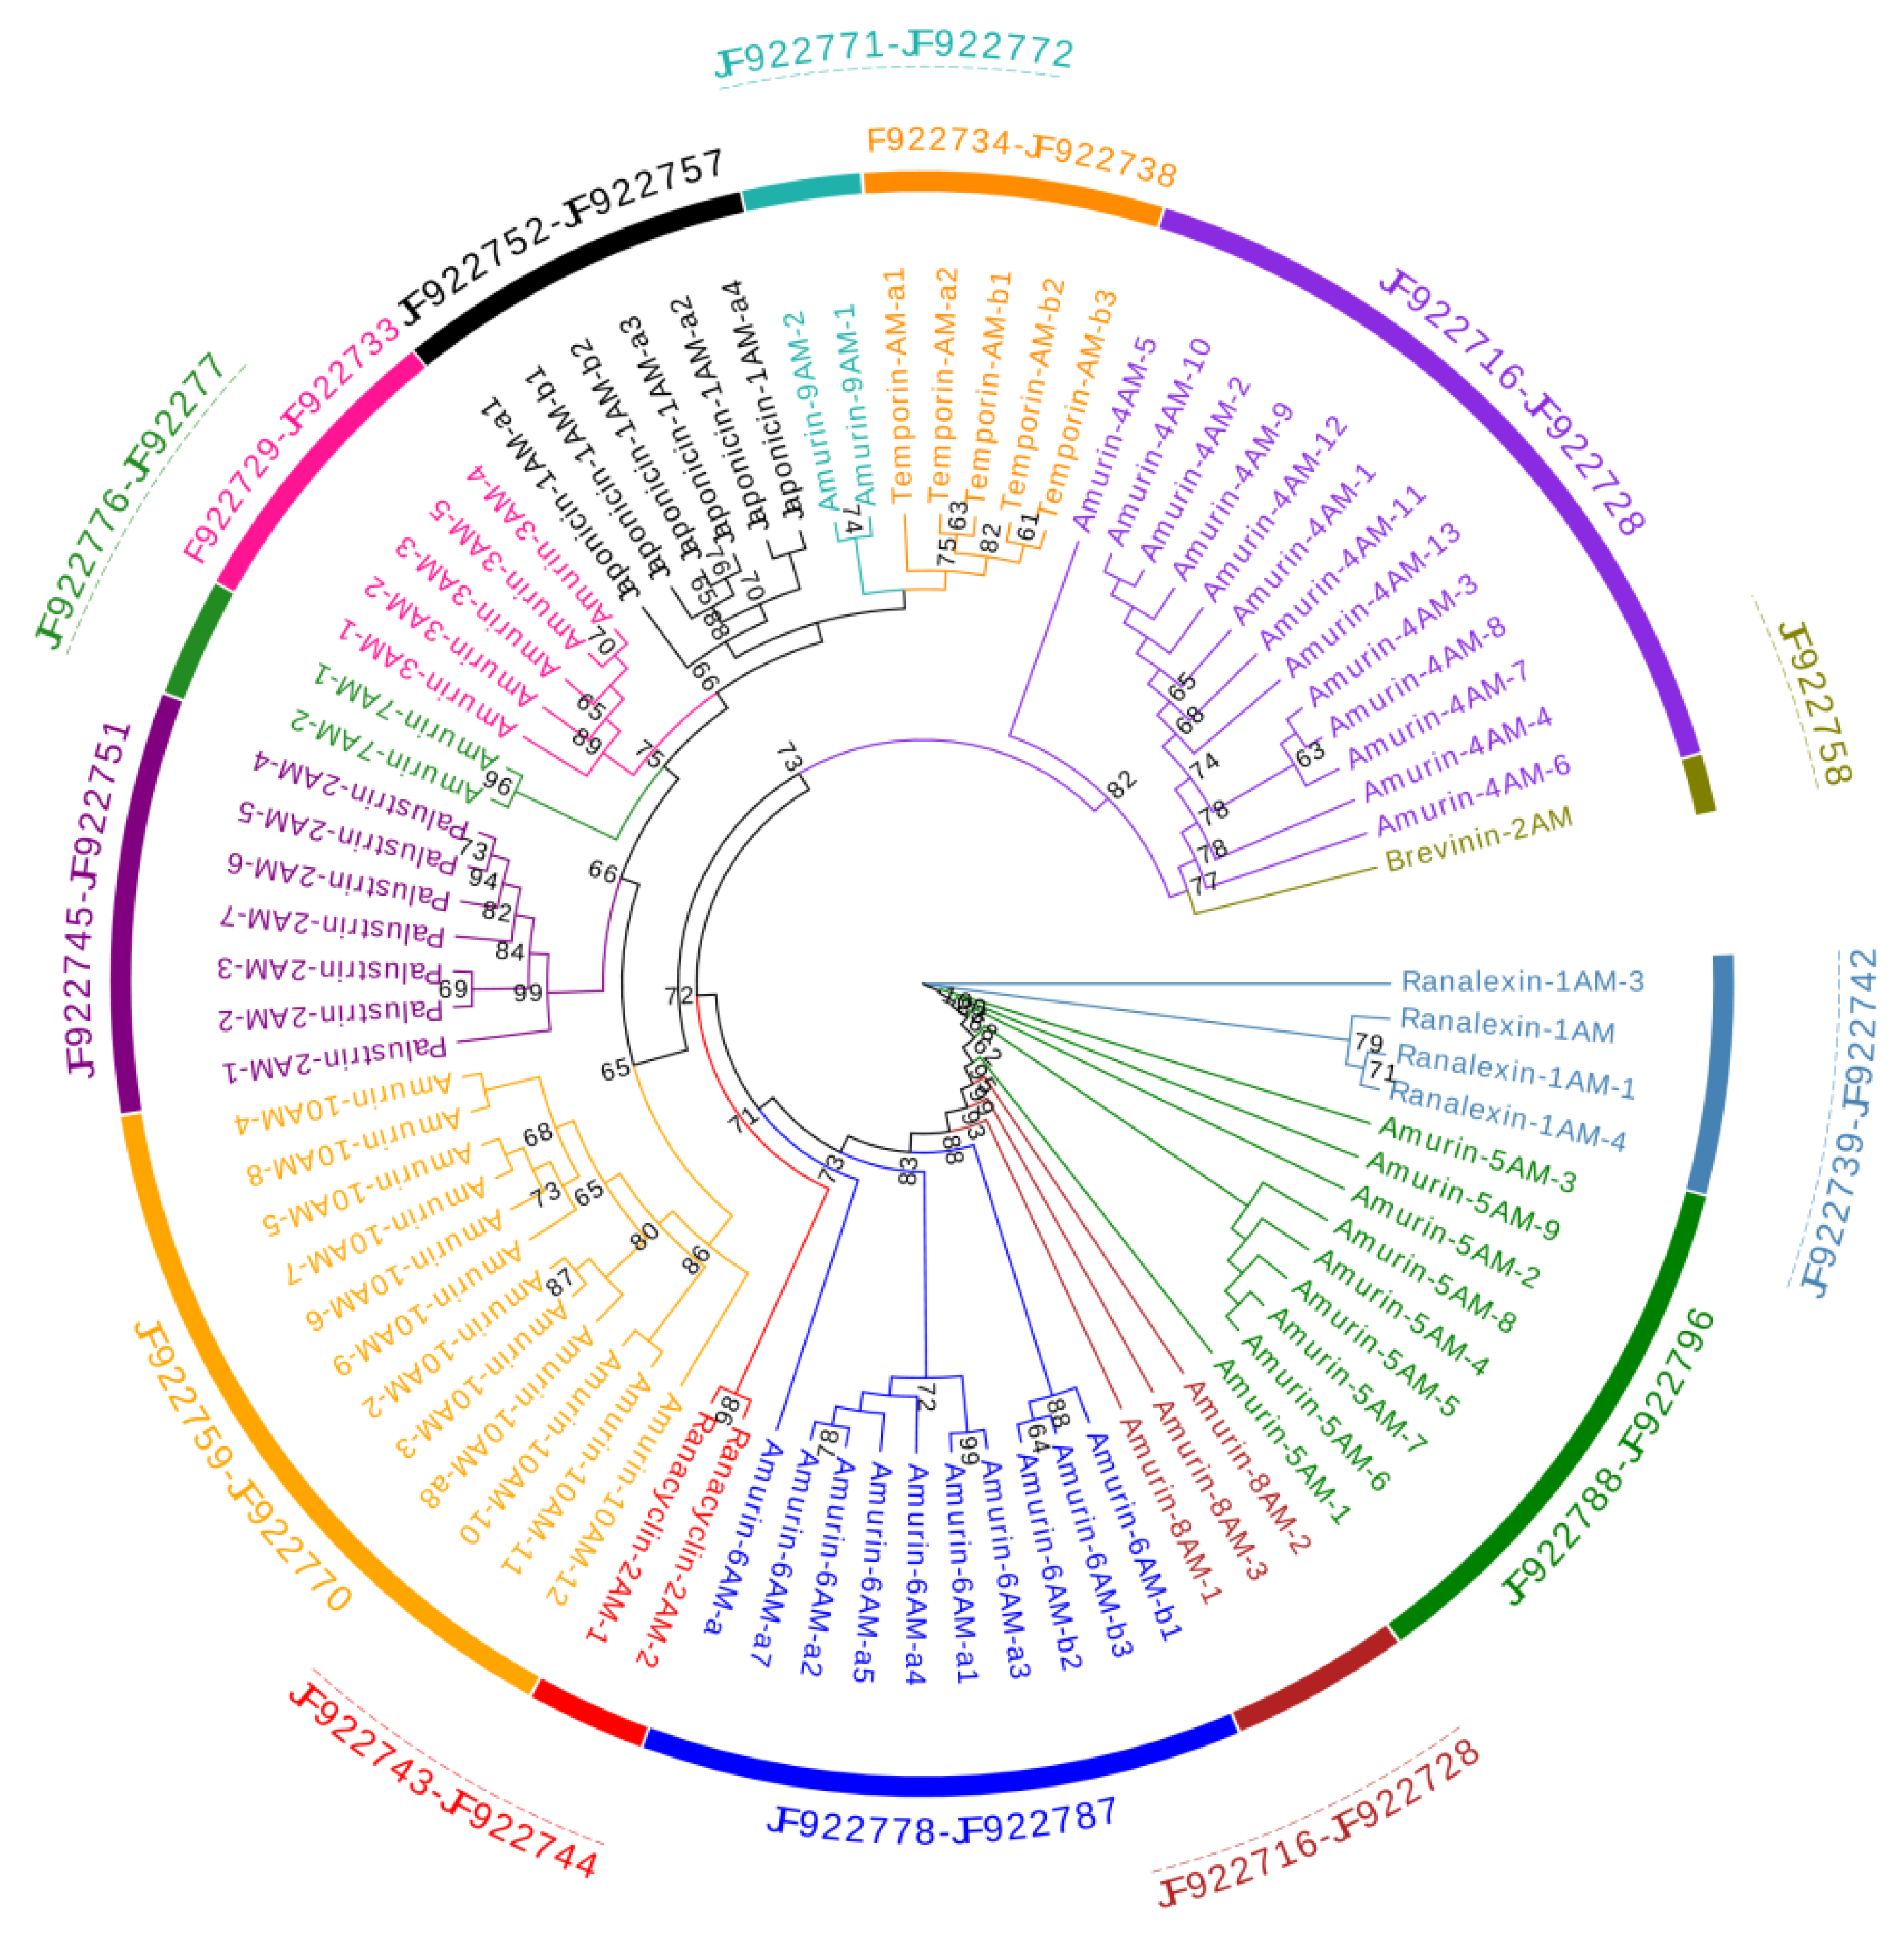
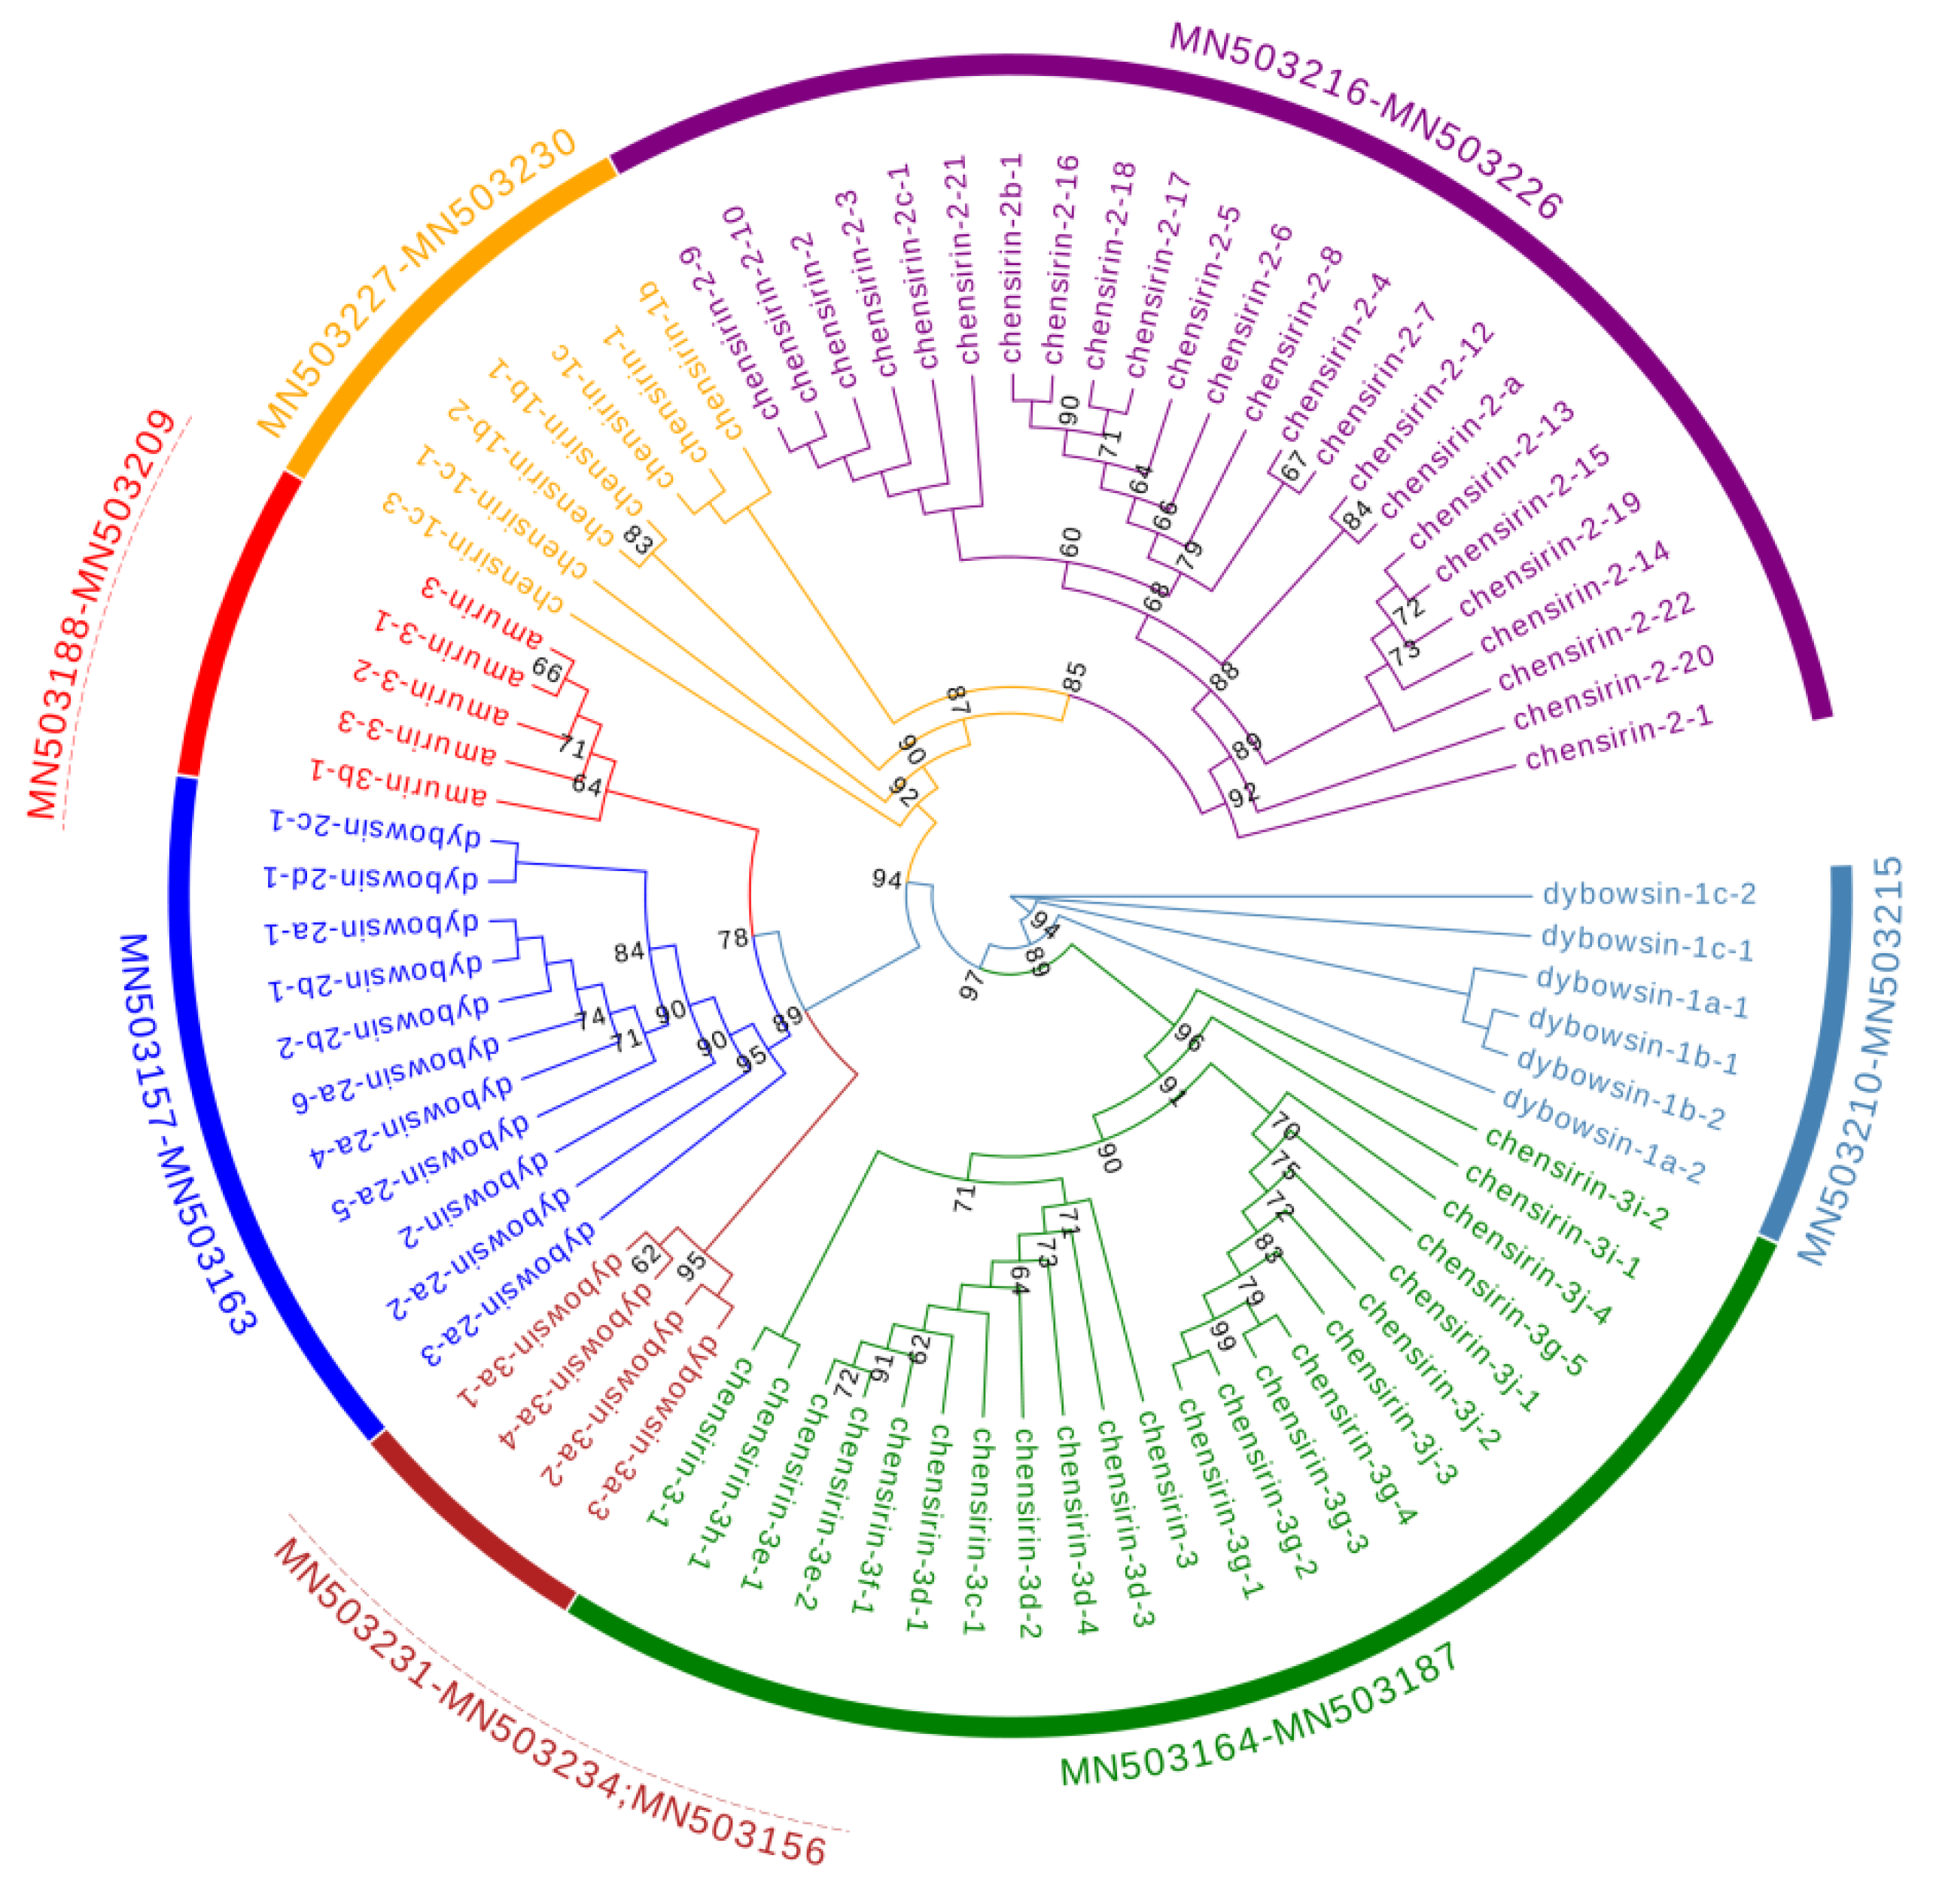
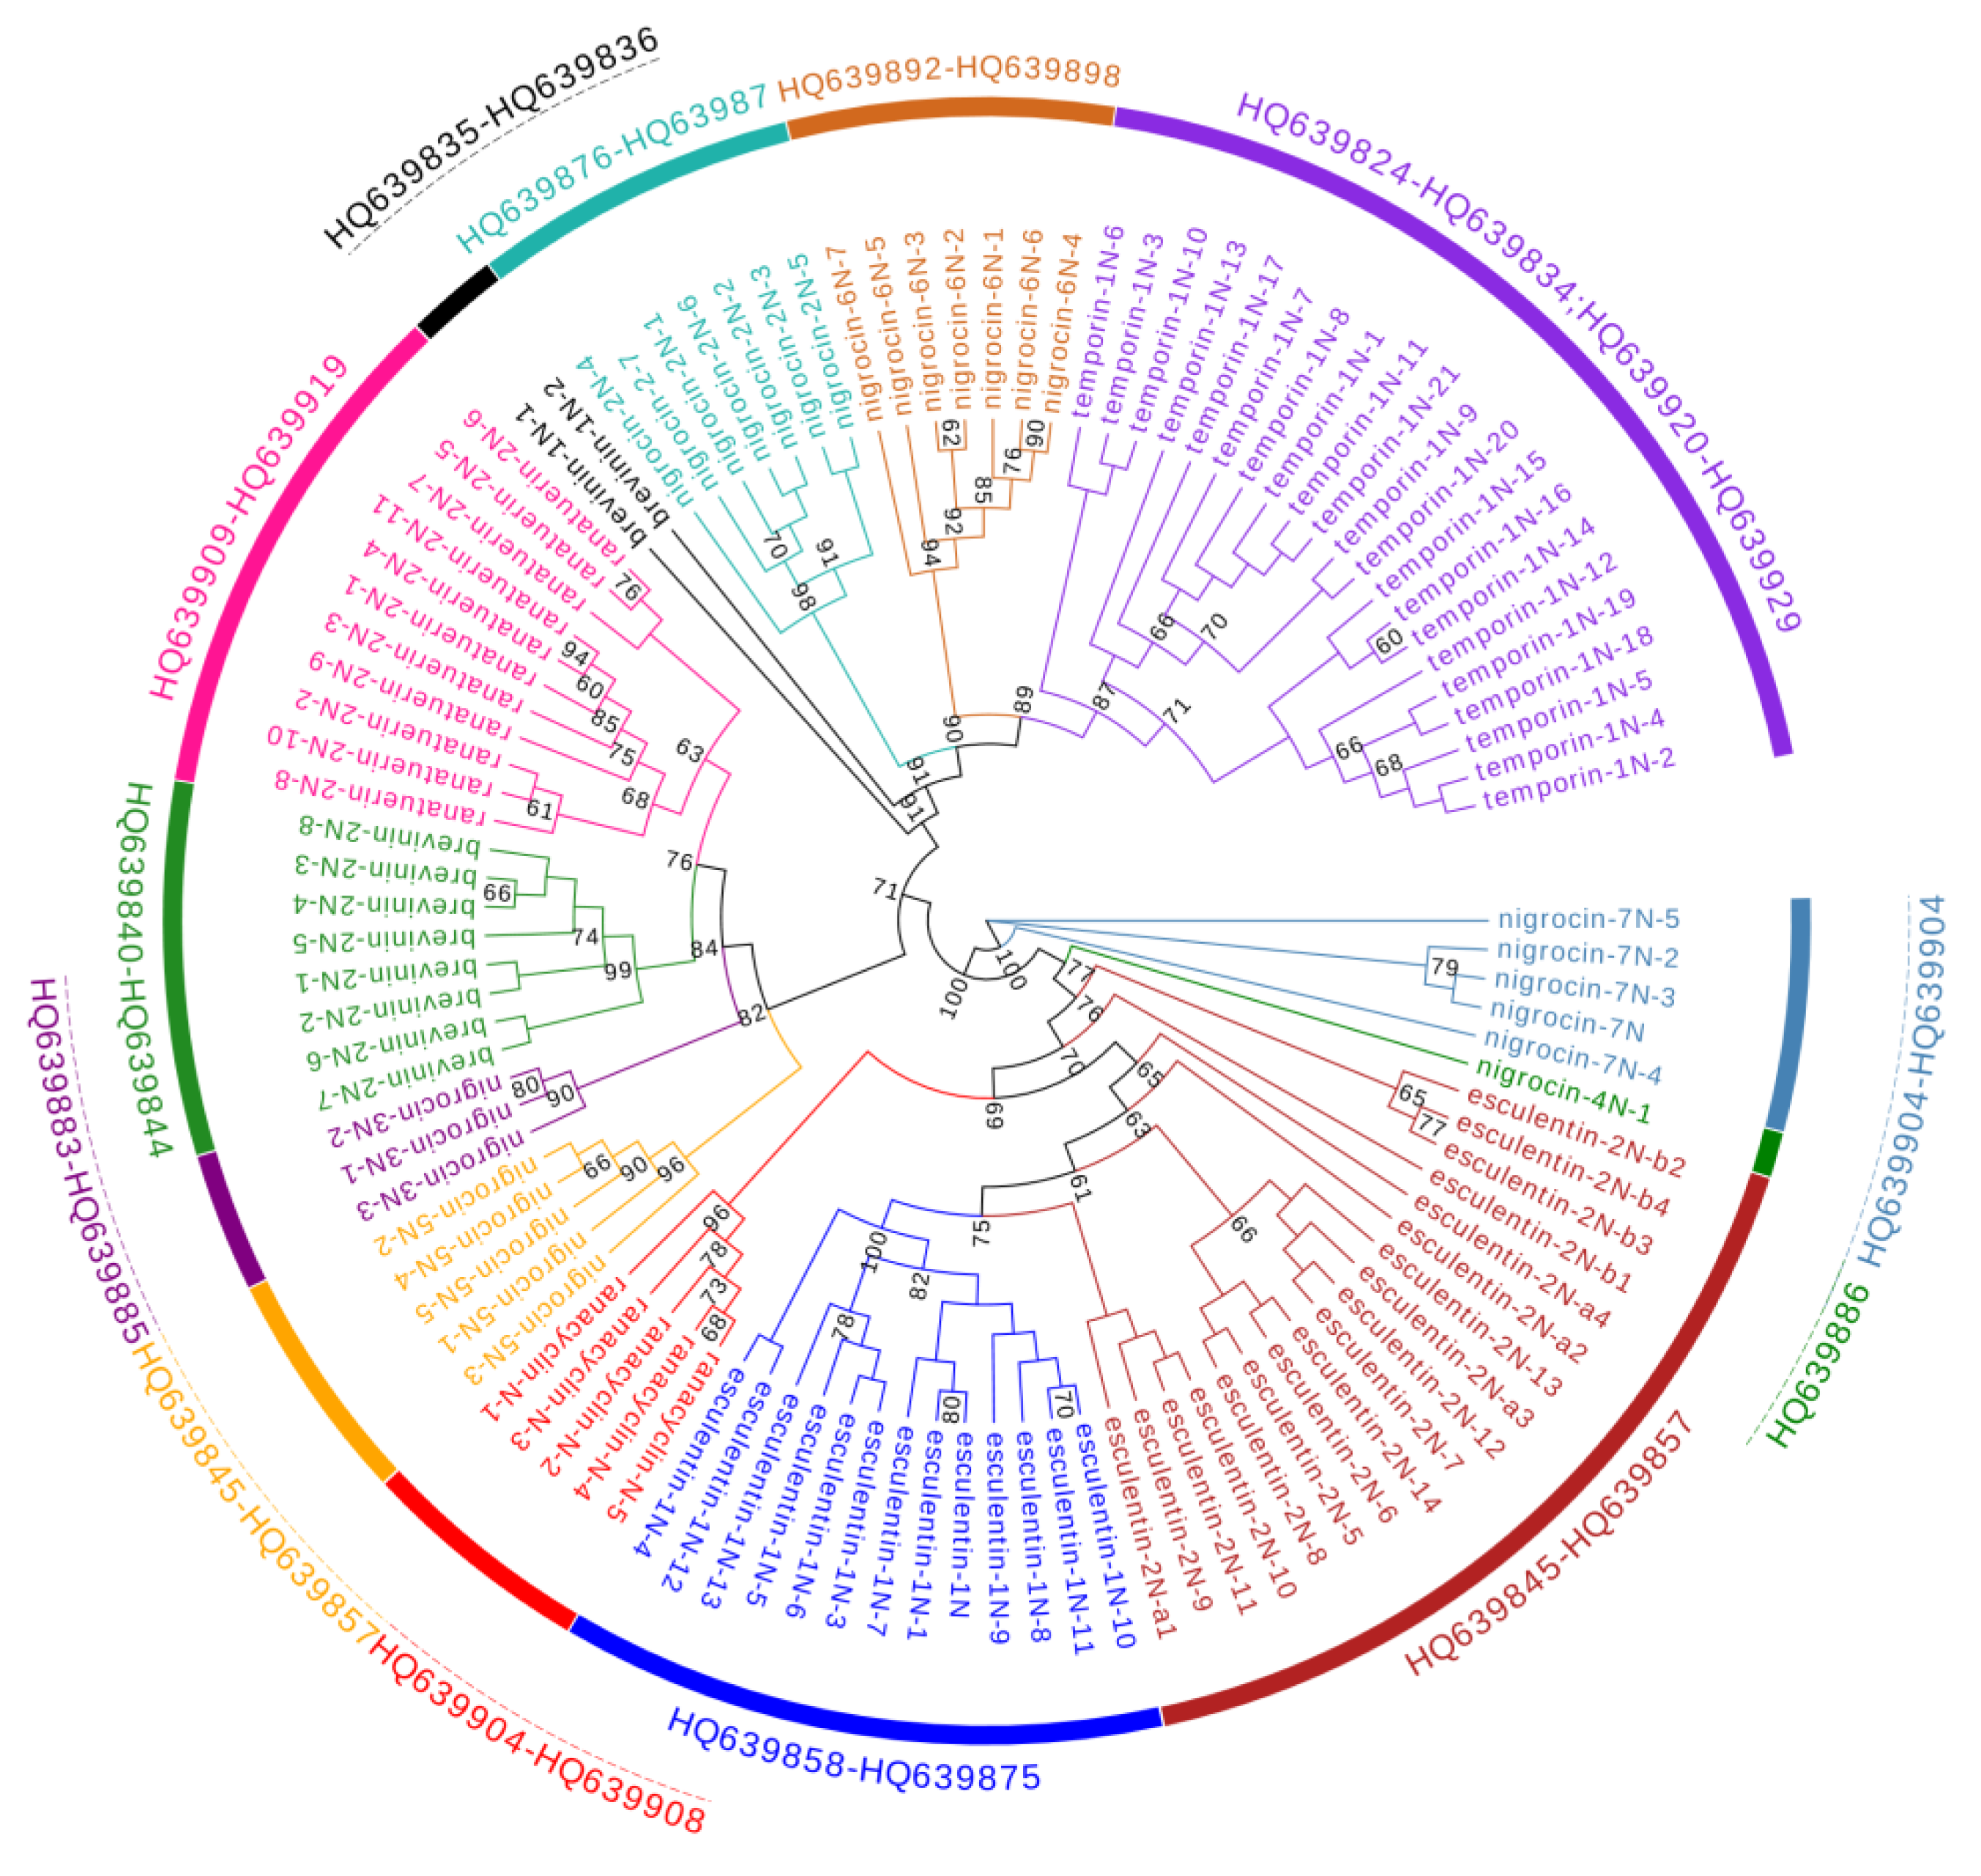
3.1. Cloning and Sequence Analysis of Antimicrobial Peptide (AMP) cDNAs

The total RNA extracted from the skin tissue showed two clear bands on 2% agarose gel under UV. The ratio of OD260/OD280 was around 2.0 and OD260/OD230 was greater than 1.8, demonstrating that the quality was high enough to support subsequent experiments. The total RNA of all samples was diluted to about 500 ng/μL with RNase-free water.
A total of 2718 positive clones were sequenced from the three frog species, 915 for R. amurensis, 879 for R. dybowskii, and 924 for P. nigromaculatus. A cDNA sequence was accepted for further analysis only if it possessed characteristics of AMP genes and was identical for at least three clones. In total, we obtained 81 cDNA sequences from R. amurensis, 79 sequences from R. dybowskii, and 106 sequences from P. nigromaculatus.
The phylogenetic tree (Figure 1) demonstrated that the 81 AMP cDNA sequences of R. amurensis fell into 14 clades. Deduced amino acid sequences of 6 clades were homologous to 6 reported AMP families namely brevinin-2AM, japonicin-1AM, palustrin-2AM, ranacyclin-2AM, ranalexin-1AM, and temporin-AM. We did not find AMP records homologous for the remaining eight clades. Their deduced amino acid sequences were different from each other with unique characters. Therefore, we assigned a family name to each according to the nomenclature guideline: amurin-3AM, amurin-4AM, amurin-5AM, amurin-6AM, amurin-7AM, amurin-8AM, amurin-9AM, amurin-10AM.
The 79 AMP cDNA sequences of R. dybowskii were clustered into 7 different clades, 4 of which were homologous to 4 AMP families, including chensirin-1, chensirin-2, chensirin-3, and amurin-3. Three clades had not been reported, and were named as dybowsin-1, dybowsin-2, and dybowsin-3 (Figure 2).
The 106 cDNA sequences of P. nigromaculatus were clustered to 13 clades (Figure 3). Seven clades corresponded to reported AMP families, namely brevinin-1N, brevinin-2N, esculentin-1, esculentin-2, ranacyclin-N, ranatuerin-2N, and temporin-1. The other six clades were novel AMPs, and were assigned family names, viz, nigrocin-2N, nigrocin-3N, nigrocin-4N, nigrocin-5N, nigrocin-6N, and nigrocin-7N.
All cDNA sequences were deposited to GenBank. The accession numbers were: JF922716-JF922796 for R. amurensis cDNAs, MN503156-MN503234 for R. dybowskii cDNAs, and HQ639845-HQ639834 for P. nigromaculatus cDNAs.

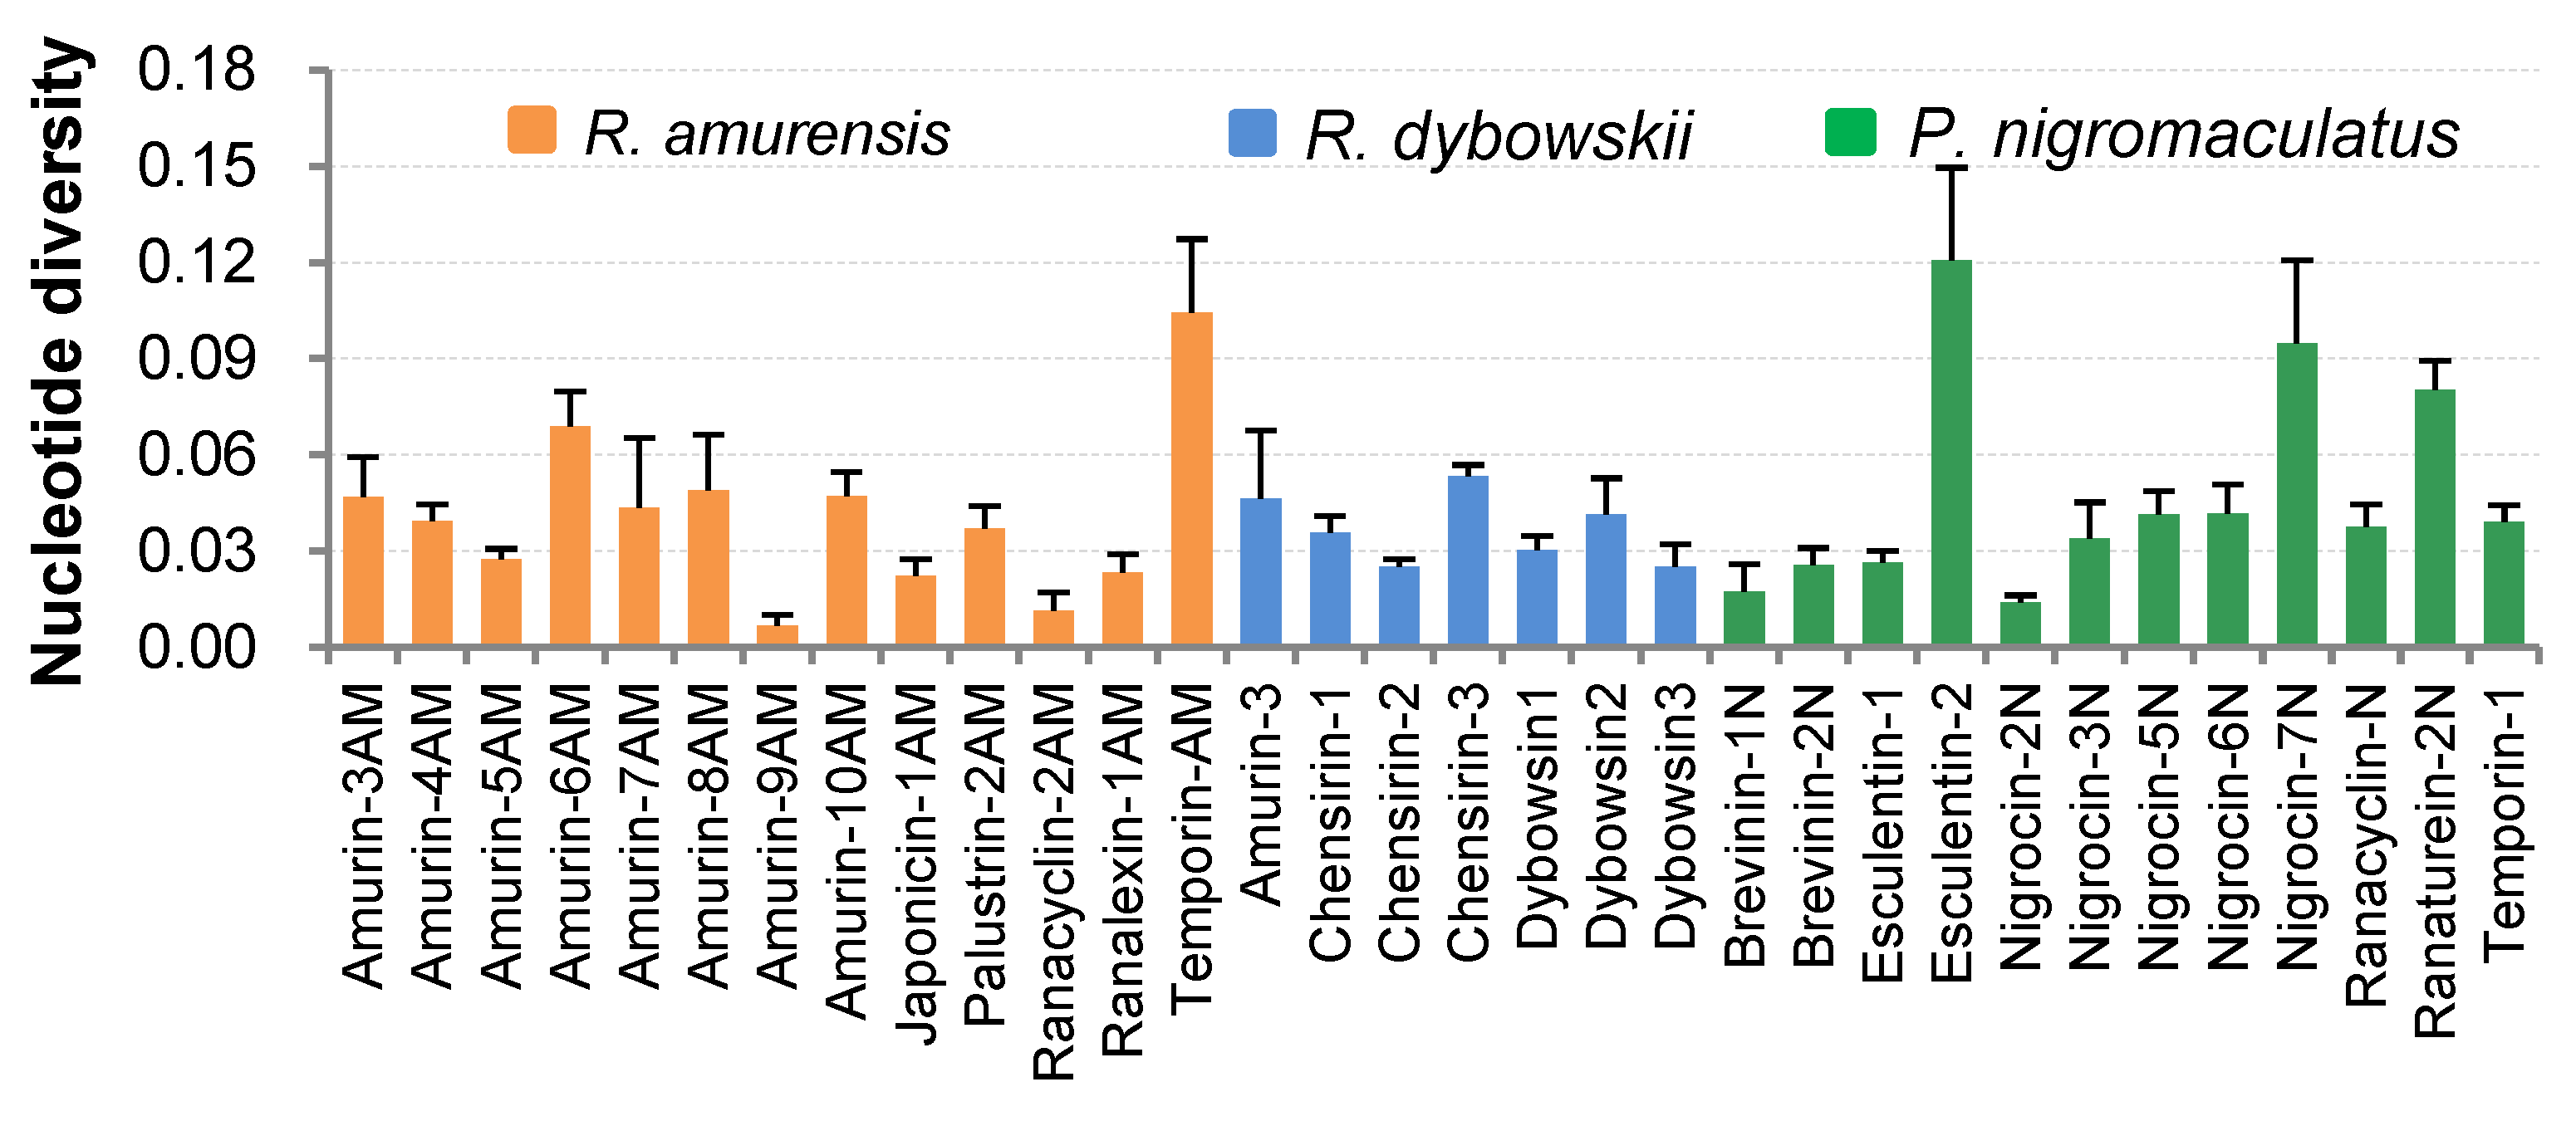
3.2. Nucleotide Diversity of Antimicrobial Peptide (AMP) Families

Except for nigrocin-4N in P. nigromaculatus and brevinin-2AM in R. amurensis, which had only one cDNA sequence each, nucleotide diversity (π) of the remaining 32 AMP families was analyzed (Figure 4). The average nucleotide diversity of all AMPs of R. amurensis ranged from 0.007 ± 0.003 to 0.104 ± 0.023, averaging 0.040 ± 0.010. The highest diversity was seen in the family temporin-AM (average 0.104 ± 0.0023), and the least in family amurin-9AM (0.007 ± 0.003). The nucleotide diversity of AMP families varied little even in R. dybowskii, for which π values ranged between 0.025 ± 0.002 and 0.053 ± 0.003, averaging 0.104 ± 0.023. For P. nigromaculatus, π values of 9 of 12 AMP families also varied little, ranging from 0.014 ± 0.002 to 0.042 ± 0.009 with a mean 0.031 ± 0.007. However, three families namely esculentin-2, nigrocin-7N, and ranaturein-2N had high variation and set the upper limit at 0.121 ± 0.029. The average π value of the three families was 0.099 ± 0.021.

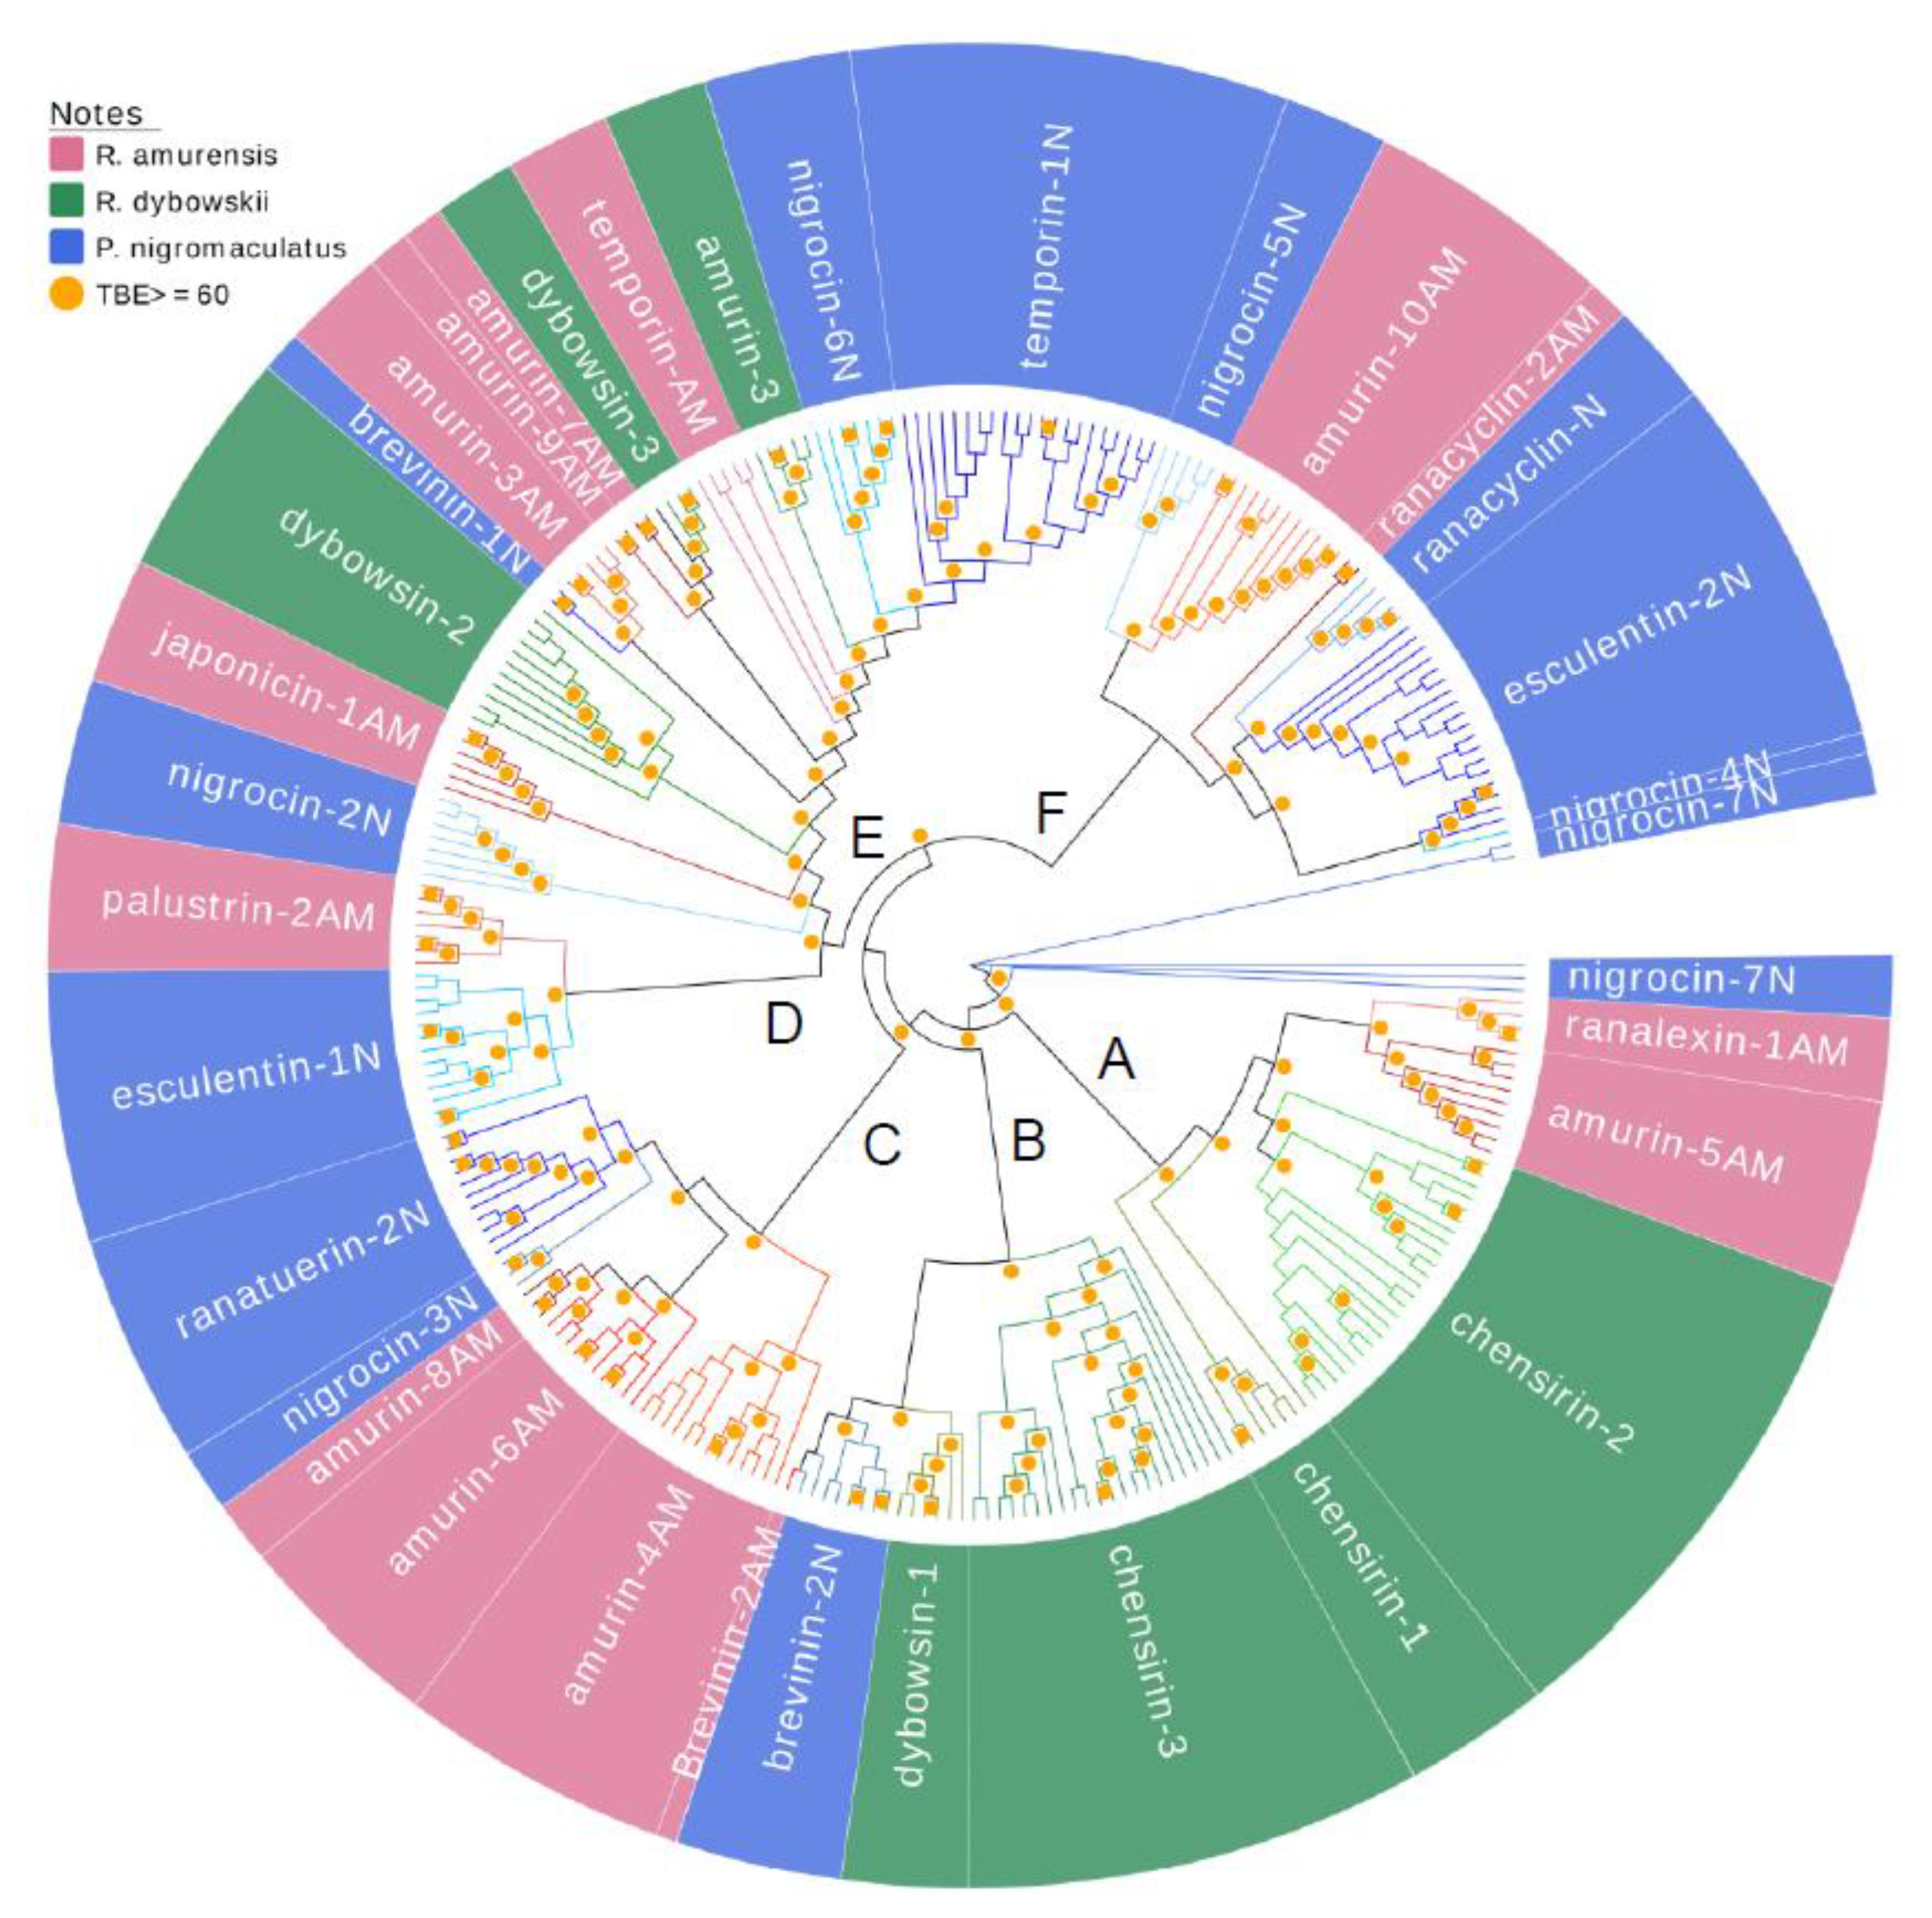
3.3. Divergence Pattern of Antimicrobial Peptides (AMPs) in Three Species

A comprehensive phylogenetic tree was constructed for all 266 AMP cDNAs cloned from the three frog species using the Neighbor-joining method (Figure 5). Similar to the cluster patterns in Figure 1, Figure 2 and Figure 3, the cDNAs of each family were perfectly clustered, and most branching was strongly supported by bootstrapping, shown as transfer bootstrap expectation (TBE) of 1000 replicates greater than 60. All main clades consisted of several families and showed both intra-specific and inter-specific diversification. For instance, clade A first diverged as a branch of family chensrin-1, then diverged into two clades, viz. the chensrin-2 clade and the ranalexin-1-amurin-5AM clade. The former clade was private to R. dybowskii and the later clade was private to R. amurensis but diverged intra-specifically into two families. Another example is clade B that split into two clades; one is the family chensrin-3 that diverged within the species R. dybowskii, and the other further diverged into two clades, dybowsin-1 that is private to R. dybowskii and brevinin-2N. However, a brevinine-2N gene further diverged inter-specifically to be brevinin-2AM that is possessed by R. amurensis. The most complex clade showing intra- and inter-specific divergence was clade E, in which all families presented deep sequence diversification within species and clades split into families belonging to different species.

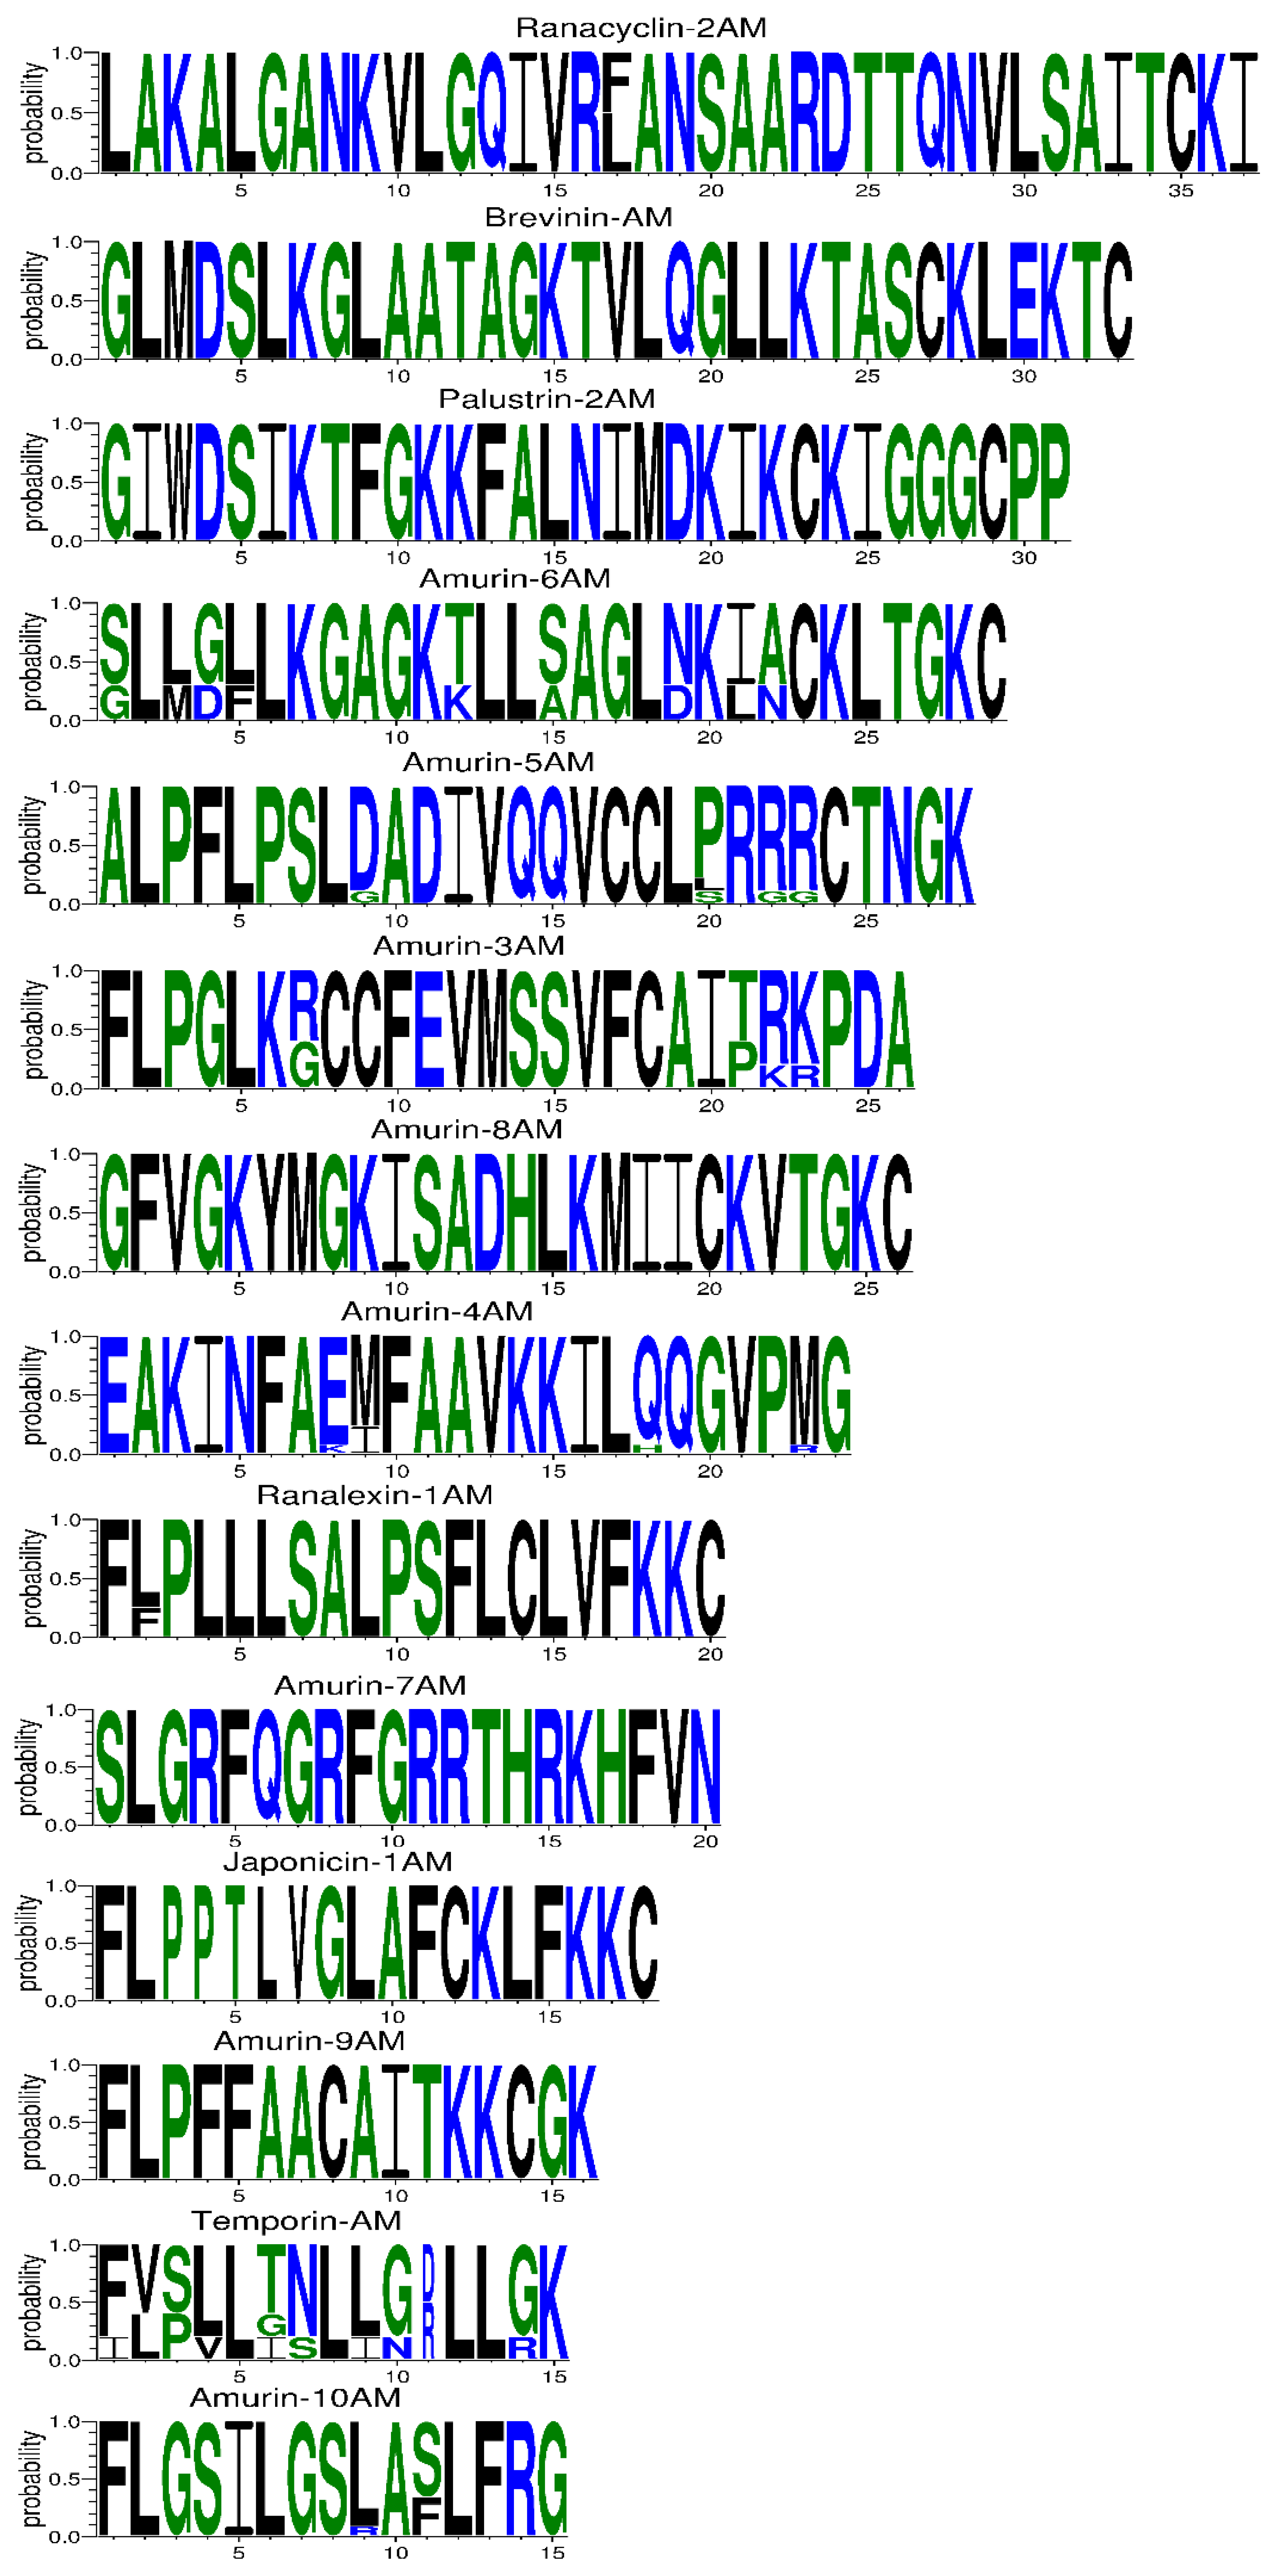
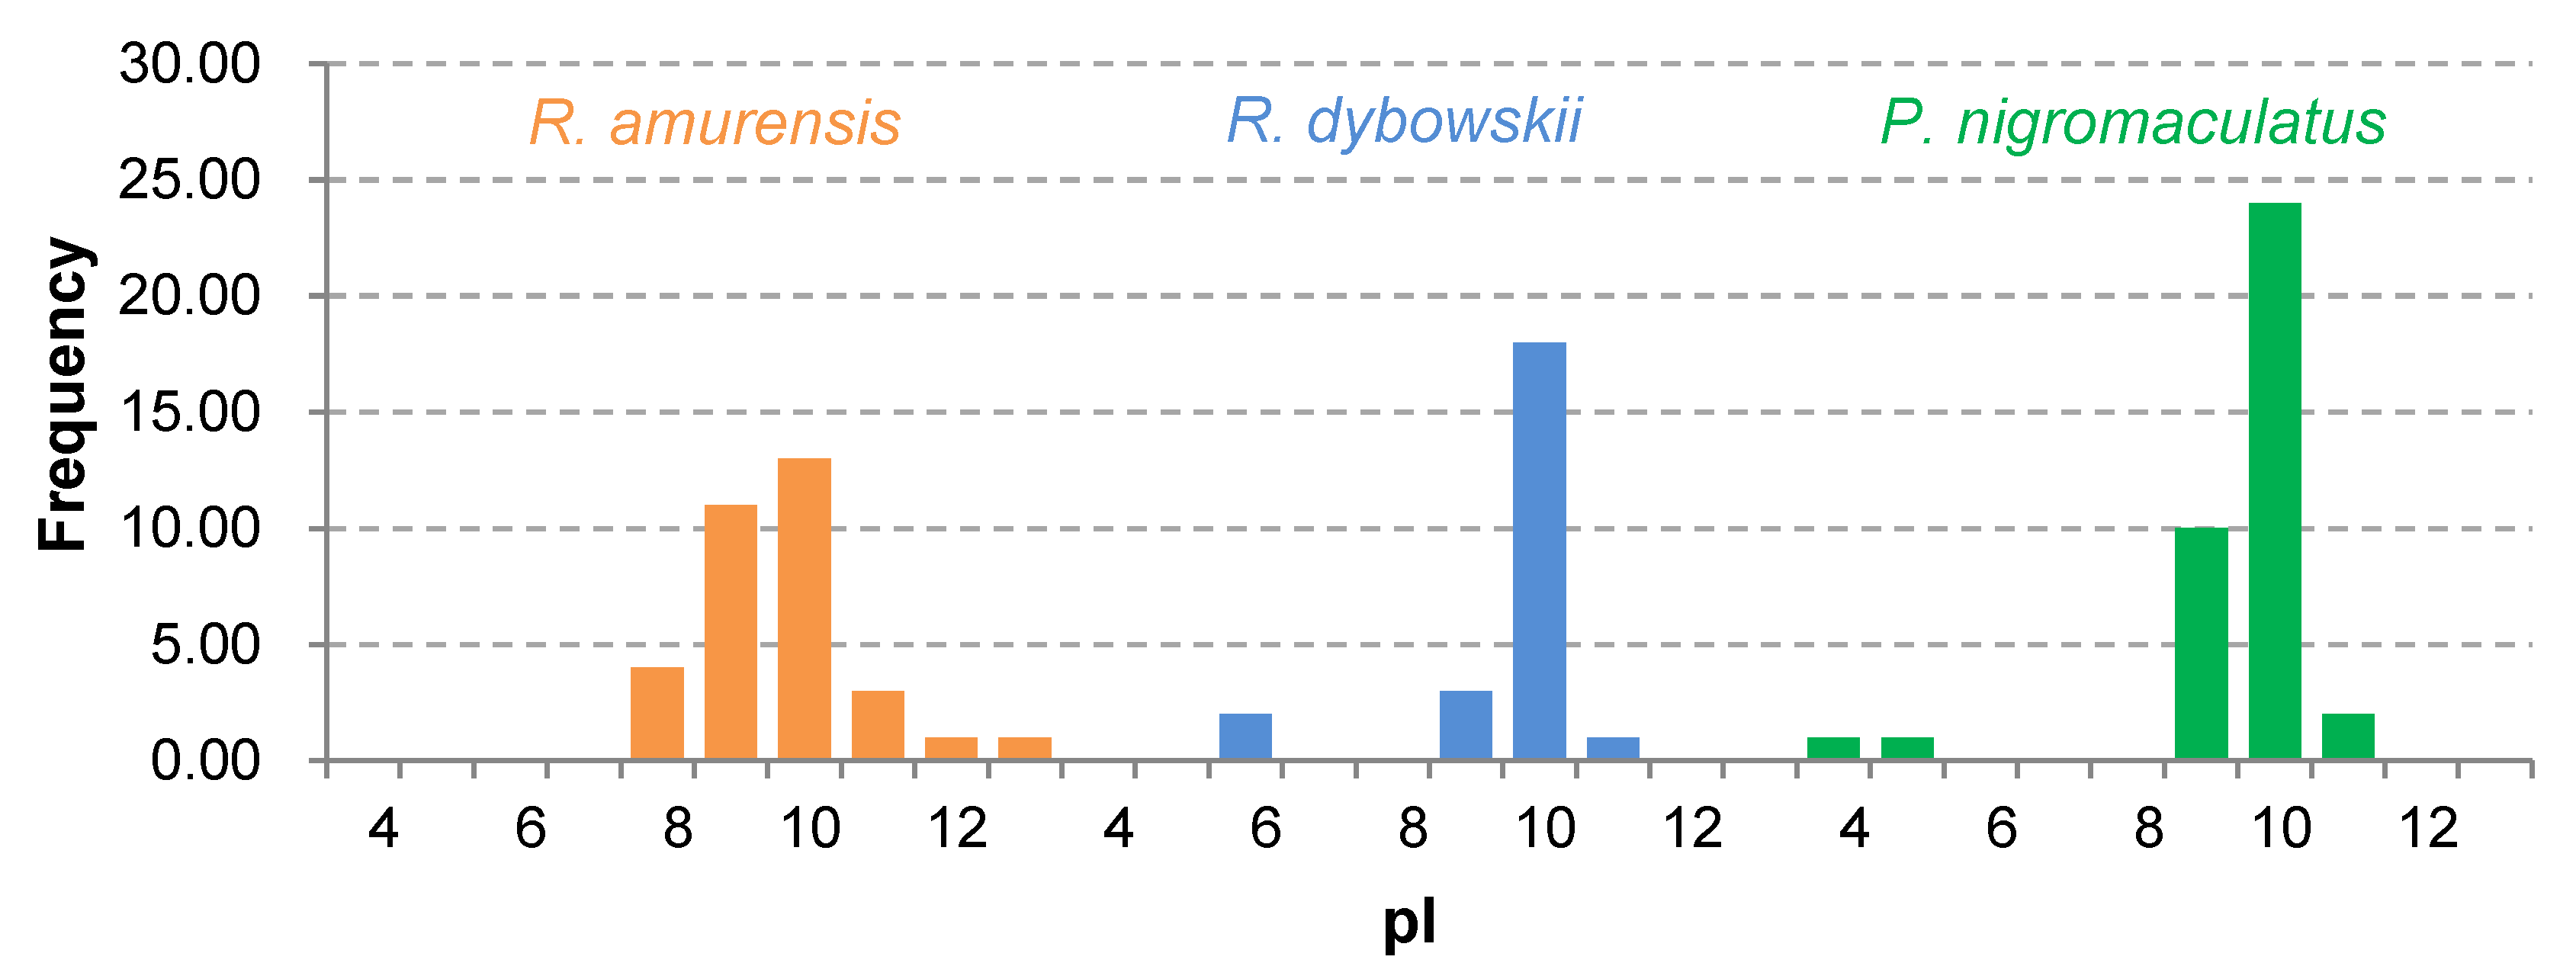
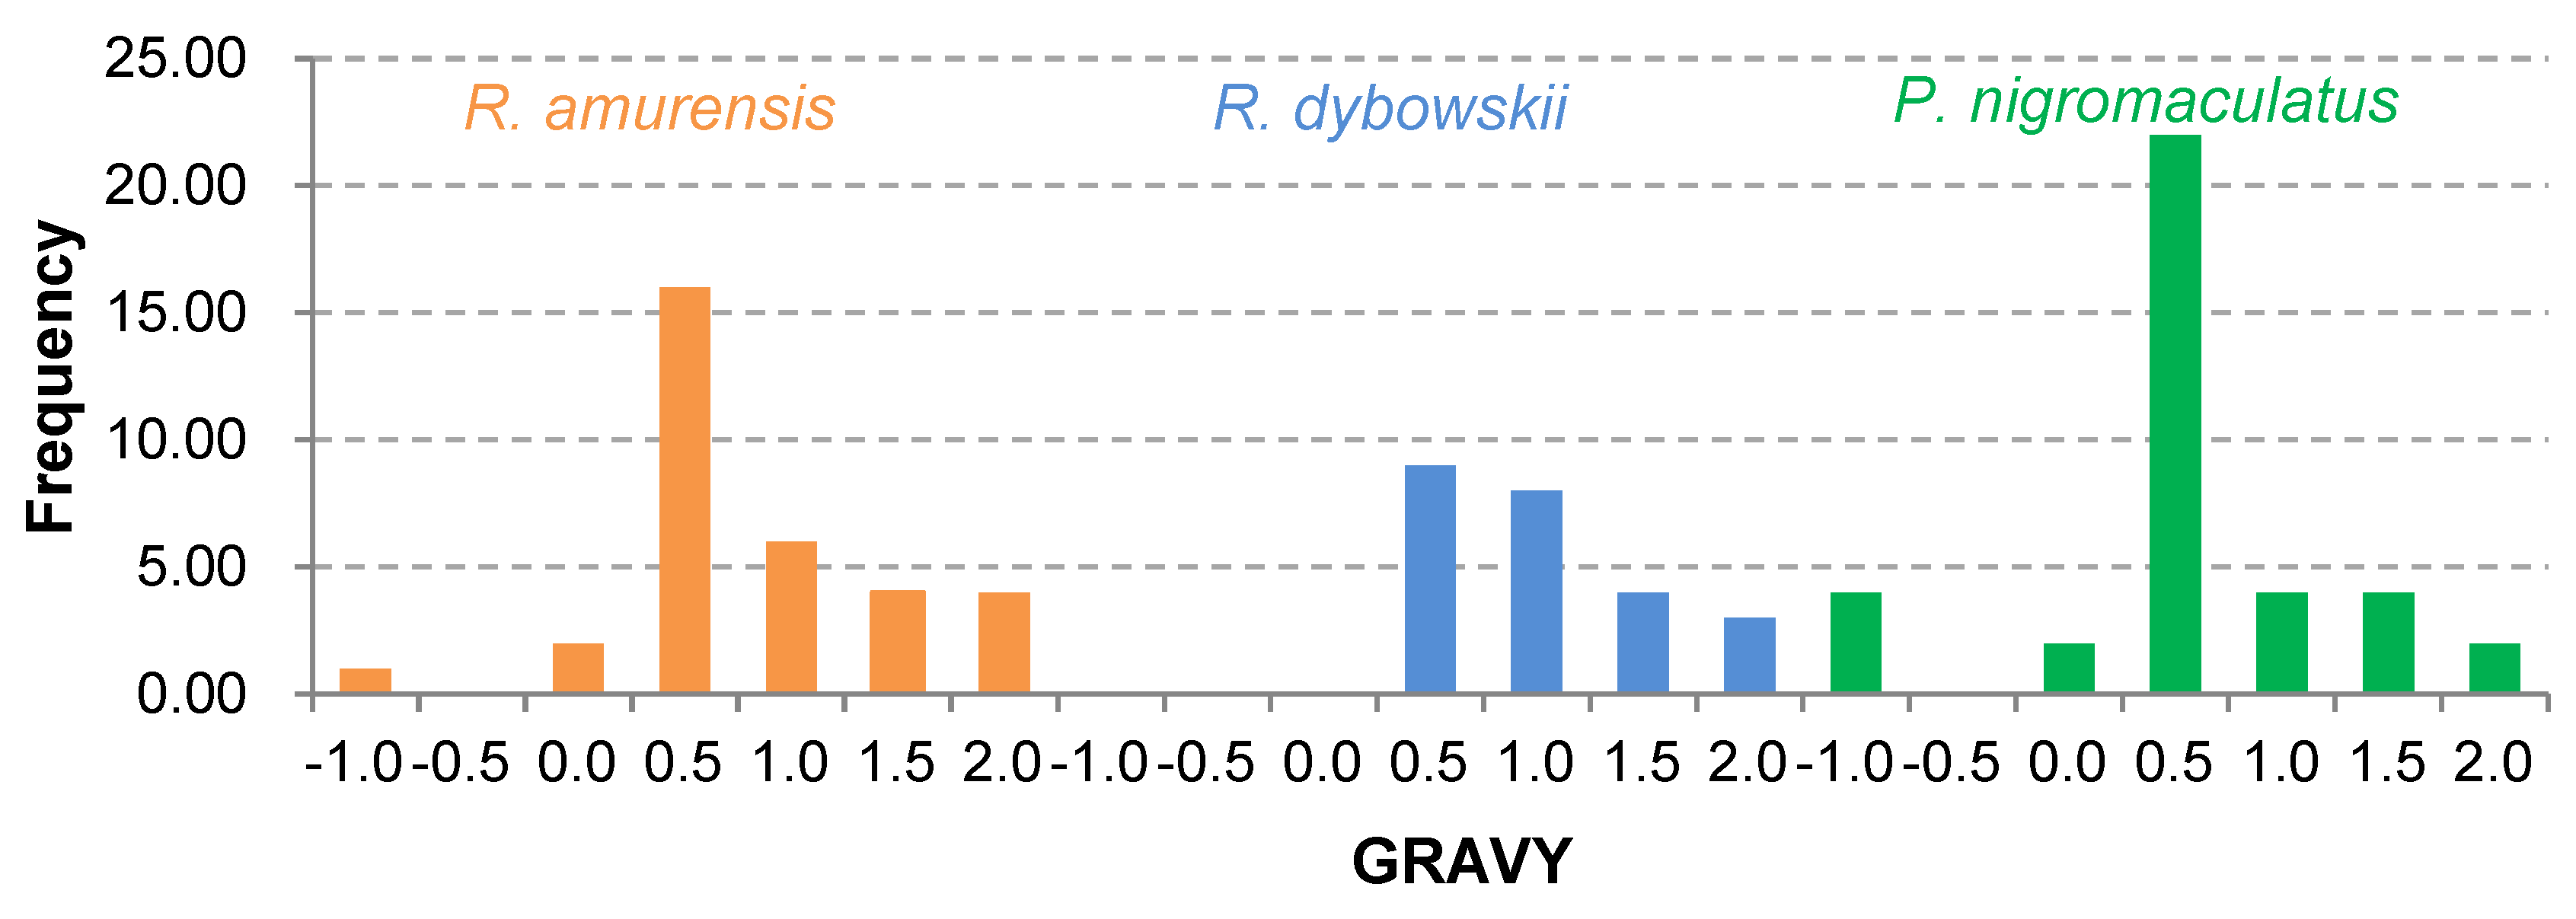
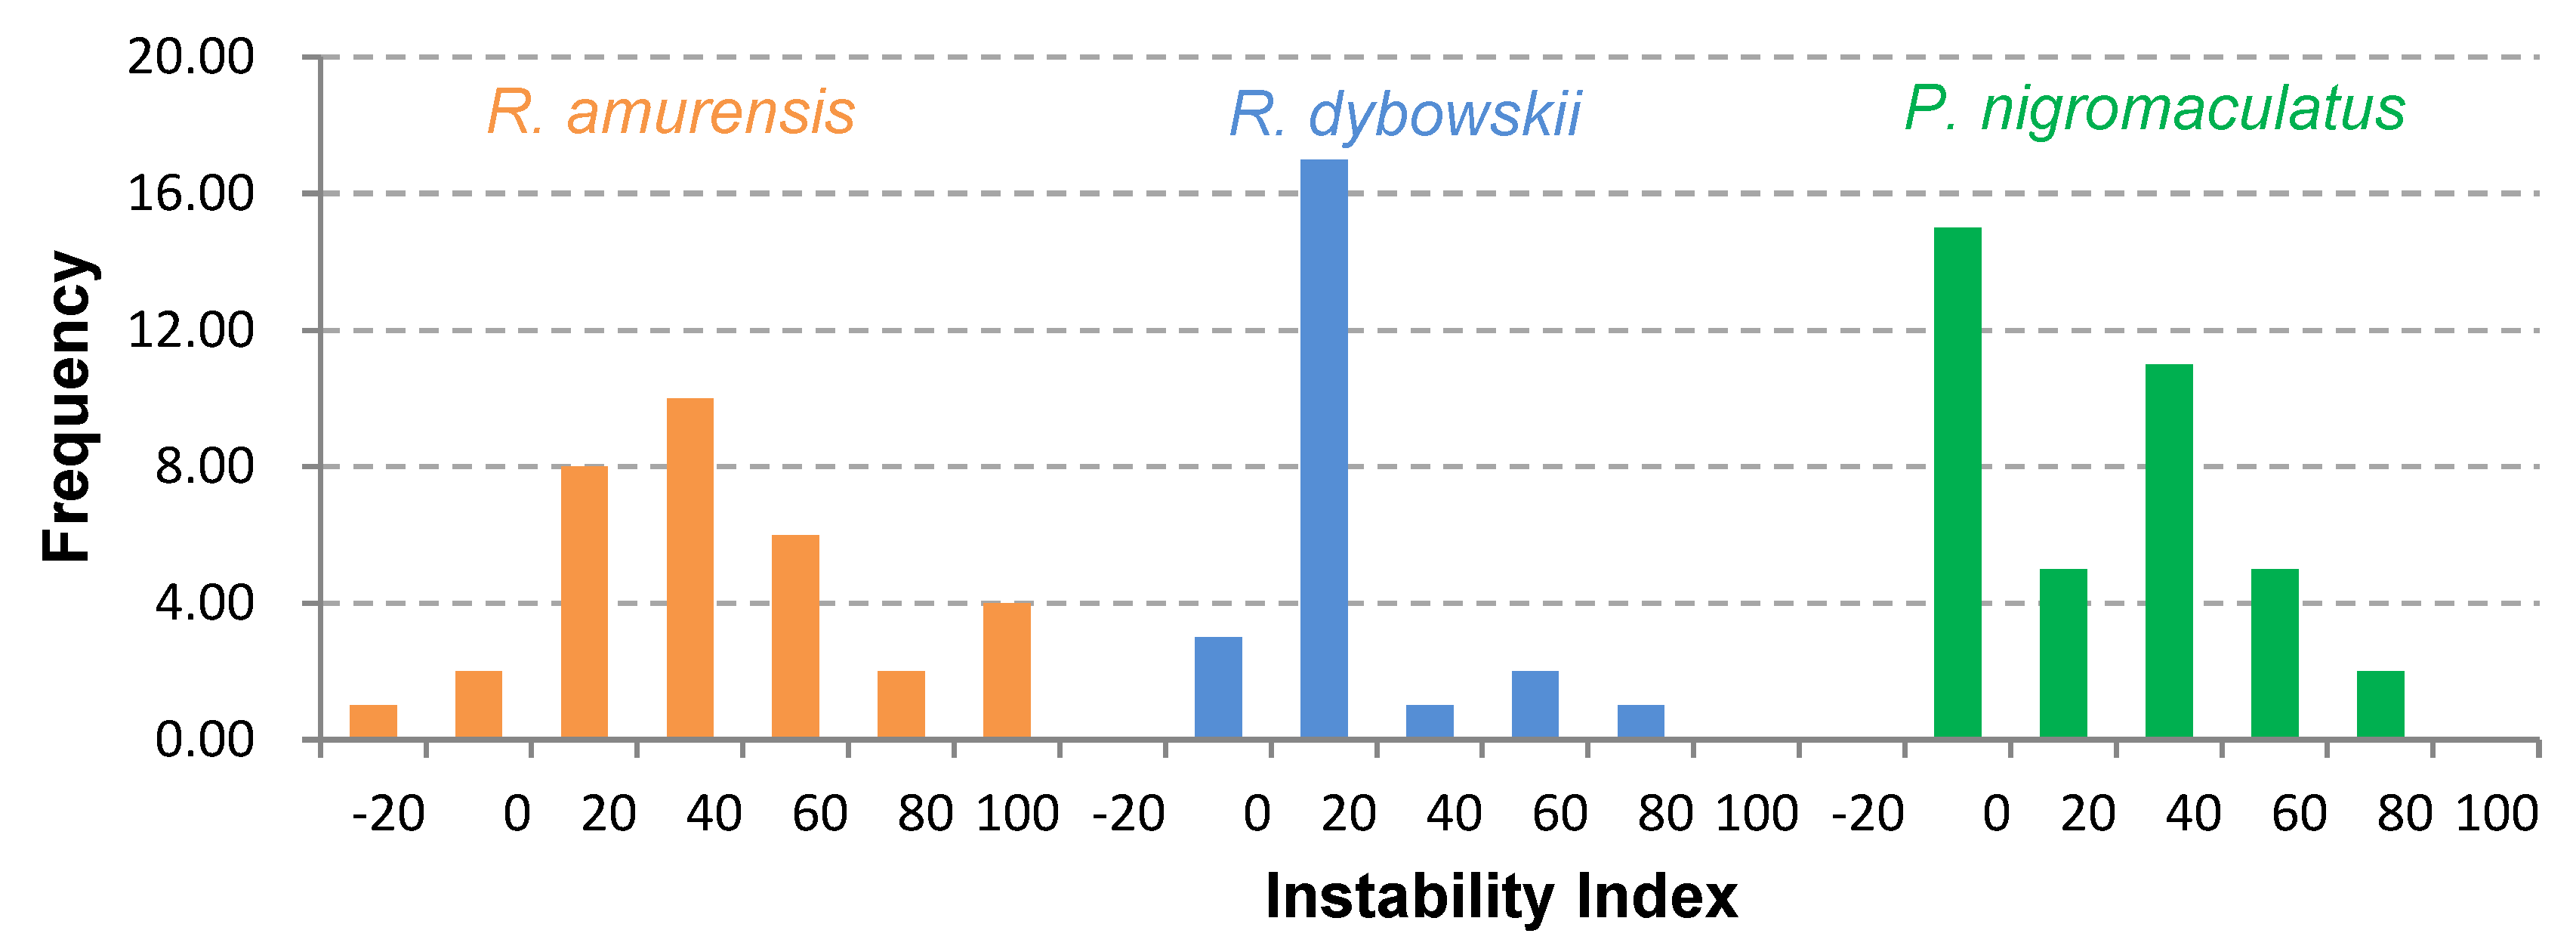
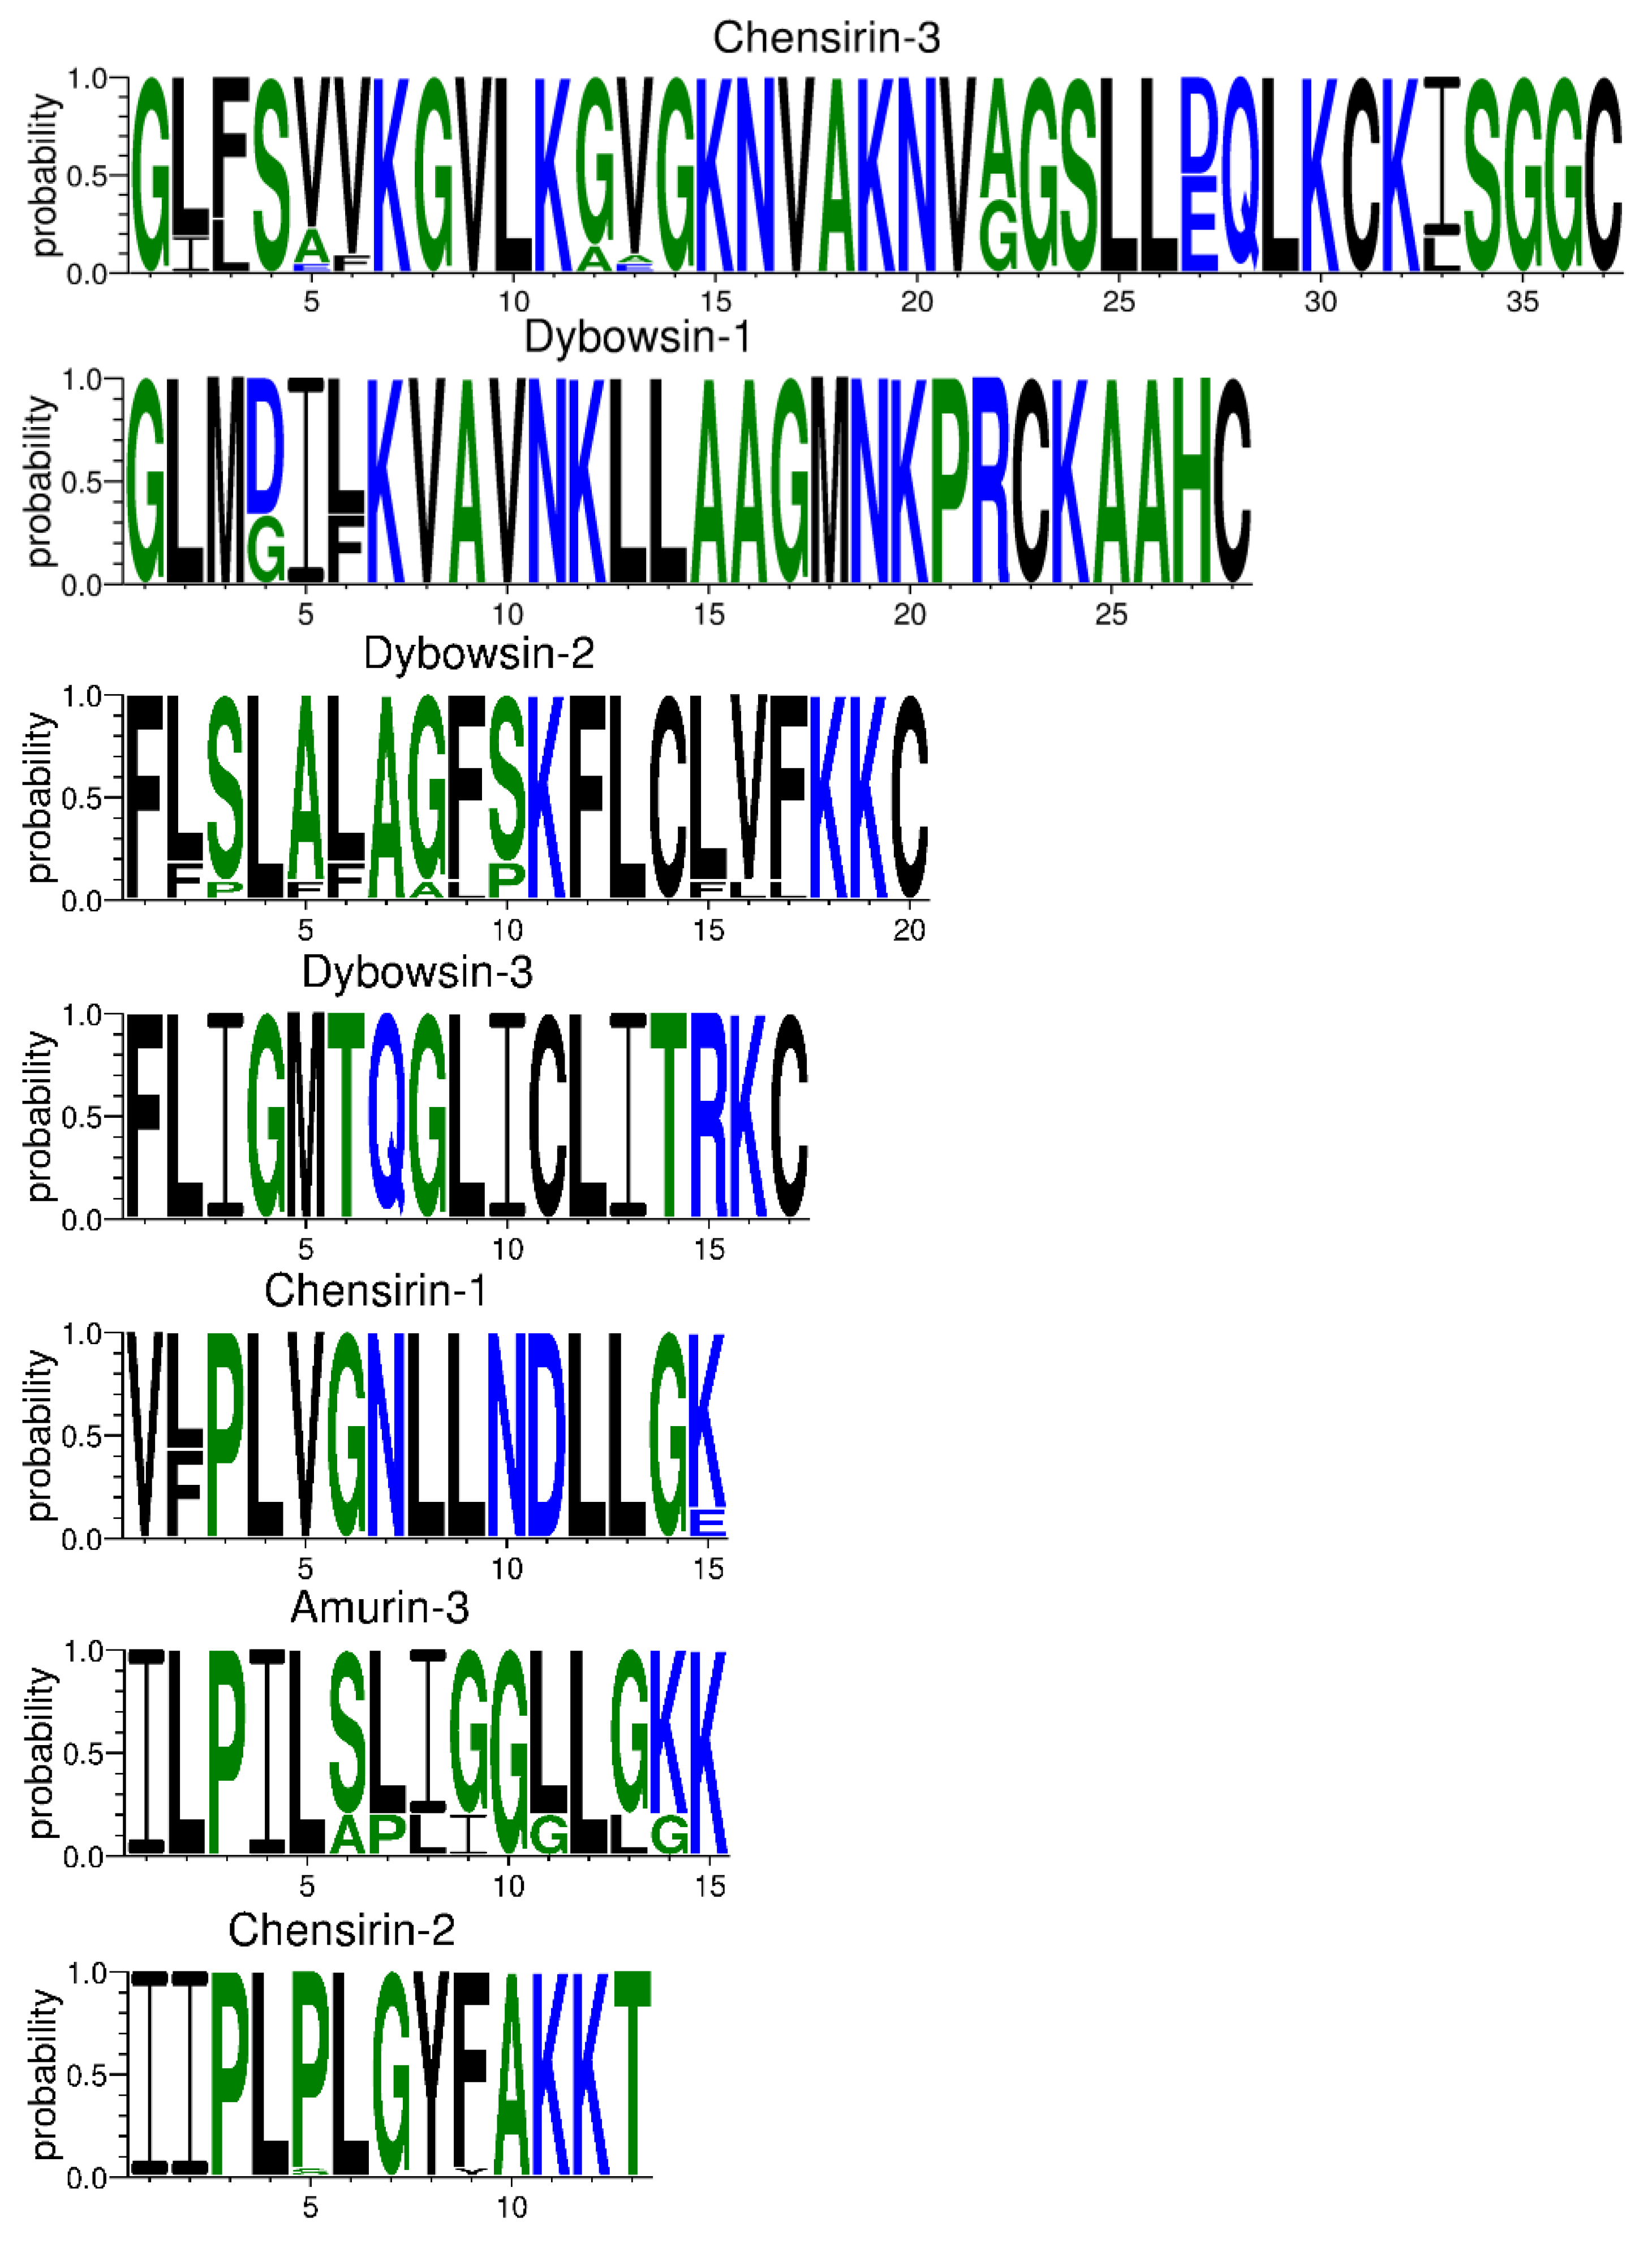
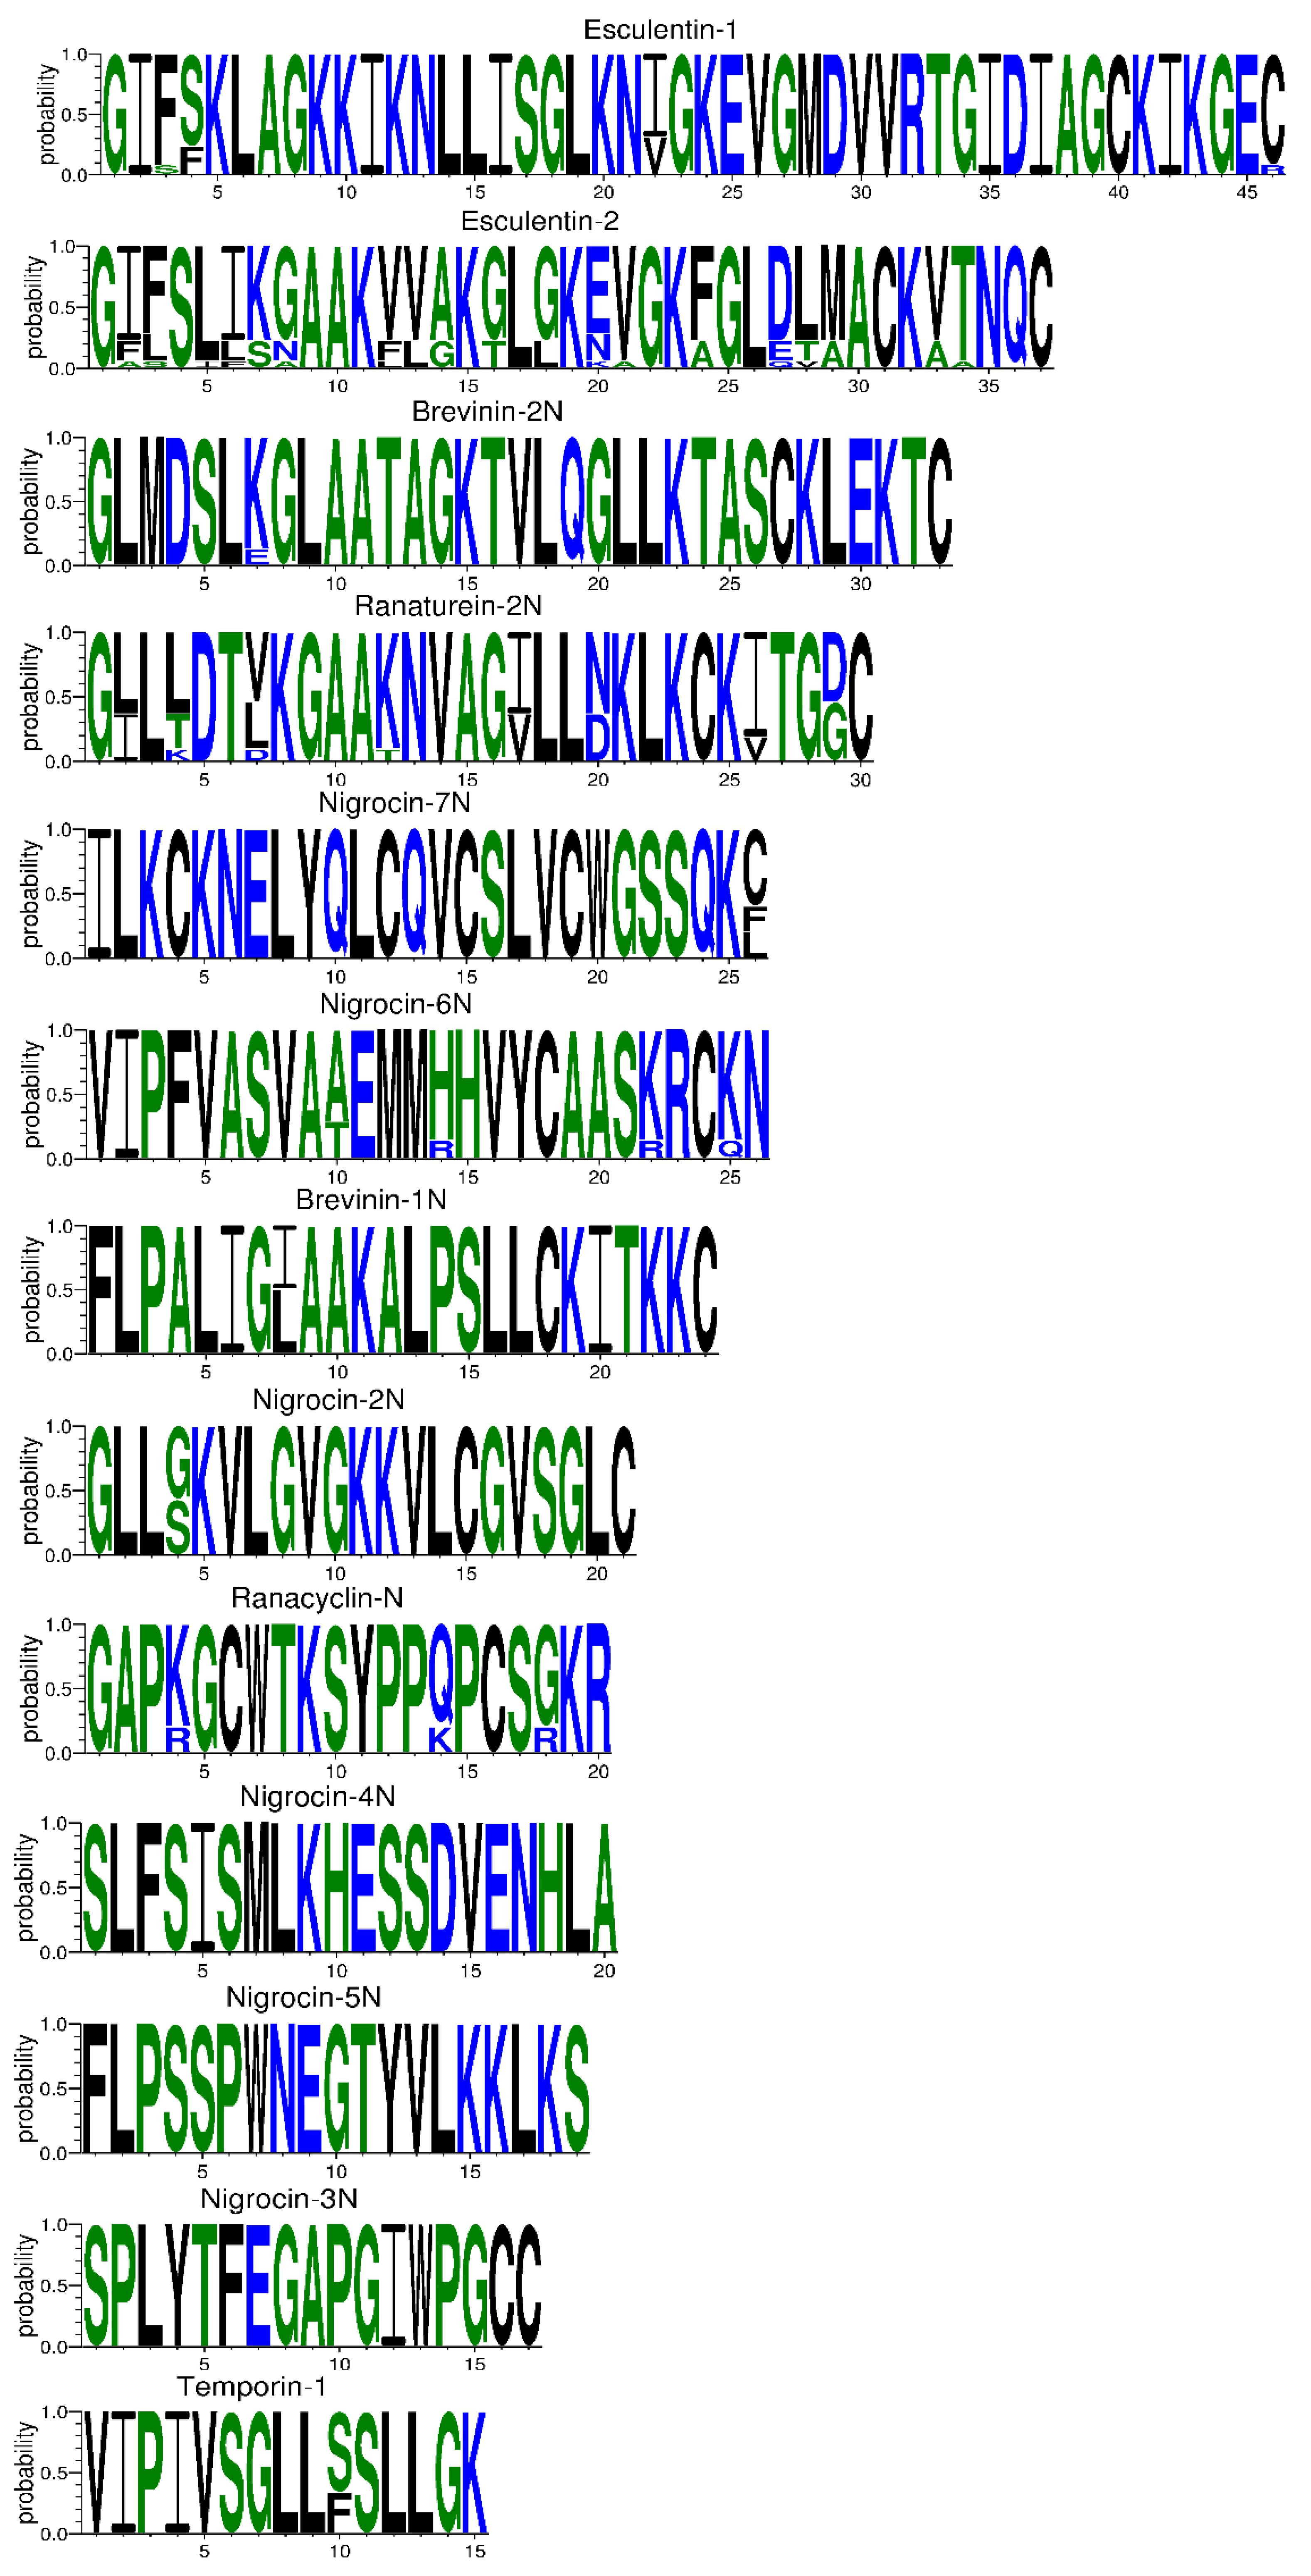
3.4. Prediction of Physicochemical Properties and Secondary Structure of Antimicrobial Peptides (AMPs)

The 81 AMP cDNA sequences isolated from R. amurensis encoded 33 mature peptides belonging to 14 families (Figure 6). They were rich in Leucine (L) and Glycine (G). Family amurin-3AM and amurin-4AM were also rich in hydrophobic amino acid residues Phenylalanine (F) and Alanine (A). The molecular weight of these mature peptides ranged from 1487.8 to 3857.5. The theoretical isoelectric point (pI) values ranged from 7.94 to 12.60, averaged 9.34 ± 1.06, suggesting that they are alkaline AMPs (Figure 7). All peptides showed hydrophobicity, except for amurin-7AM that showed strong hydrophilicity (GRAVY = −1.31) (Figure 8). The instability index varied widely (II = −23.21 to 87.83). Family amurin-5AM, amurin-3AM, and amurin-9AM had high instability index (74.29, 77.14, and 55.61, respectively), suggesting low stability. In contrast, all other families were stable with instability indices ranging from −23.21 to 42.19 (Figure 9). Prediction of secondary structure showed that 66.7% of mature peptides were in allα conformation, others were mixed (Table A1).
The 79 AMP cDNA sequences from R. dybowskii encoded 24 mature peptides of 7 families (Figure 10). All families were rich in Leucine (L), taking the total number of residues up to 40%. Except for family dybowsin-3 and chensirin-2, all families were also rich in Glycine (G). Family chensirin-3, dybowsin-1, dybowsin-2, and dybowsin-3 were enriched in hydrophobic amino acid residues, such as Valine (V), Alanine (A), Isoleucin (I), and Phenylalanine (F). The molecular weight ranged from 1406.8 to 3732.4. The pI ranged from 8.75 to 10.07, except for the family chensirin-1, whose pI was as low as 5.81 (Figure 7). All AMPs were hydrophobic with a compact pattern of pI values (Figure 8). Except for the family amurin-3 (53.31, 63.26) and chensirin-2 (43.01) that were predicted to be unstable, most of the AMPs showed high stability (Figure 9). The family chensirin-2 was in free curly structure, namely mixed, and all other AMPs were in all-α conformation (Table A2).
The 106 AMP cDNA sequences from P. nigromaculatus encoded 38 mature peptides of 13 families (Figure 11). All these families were rich in Leucine (L). Family nigrocin-6N was rich in hydrophobic amino acid residues Alanine (A); family nigrocin-4N and nigrocin-5N were rich in polar amino acid Serine (S). The molecular masses of these 38 AMPs ranged from 1495.8 to 4876.9, and the pI values ranged from 4.00 to 10.06. Except for the family nigrocin-3N (pI=4.00) and nigrocin-4N (pI = 5.26), the remaining 11 families were alkaline AMPs (pI = 8.02~10.06) (Figure 7). Most AMPs were hydrophobic, with families nigrocin-2N and temporin-1 displaying strong hydrophobicity, while families nigrocin-4N, nigrocin-5N, and ranacyclin-N showed hydrophilicity (Figure 8). The predicted values of instability indices for nigrocin-5N (50.12), nigrocin-6N (49.29), and ranacyclin-N (55.08) suggested poor stability, while the remaining families had extremely high stability (Figure 9). The secondary structure of mature peptides of family ranatuerin-2N, nigrocin-6N, esculentin-2, and nigrocin-4N was in all-α conformation (Table A3).

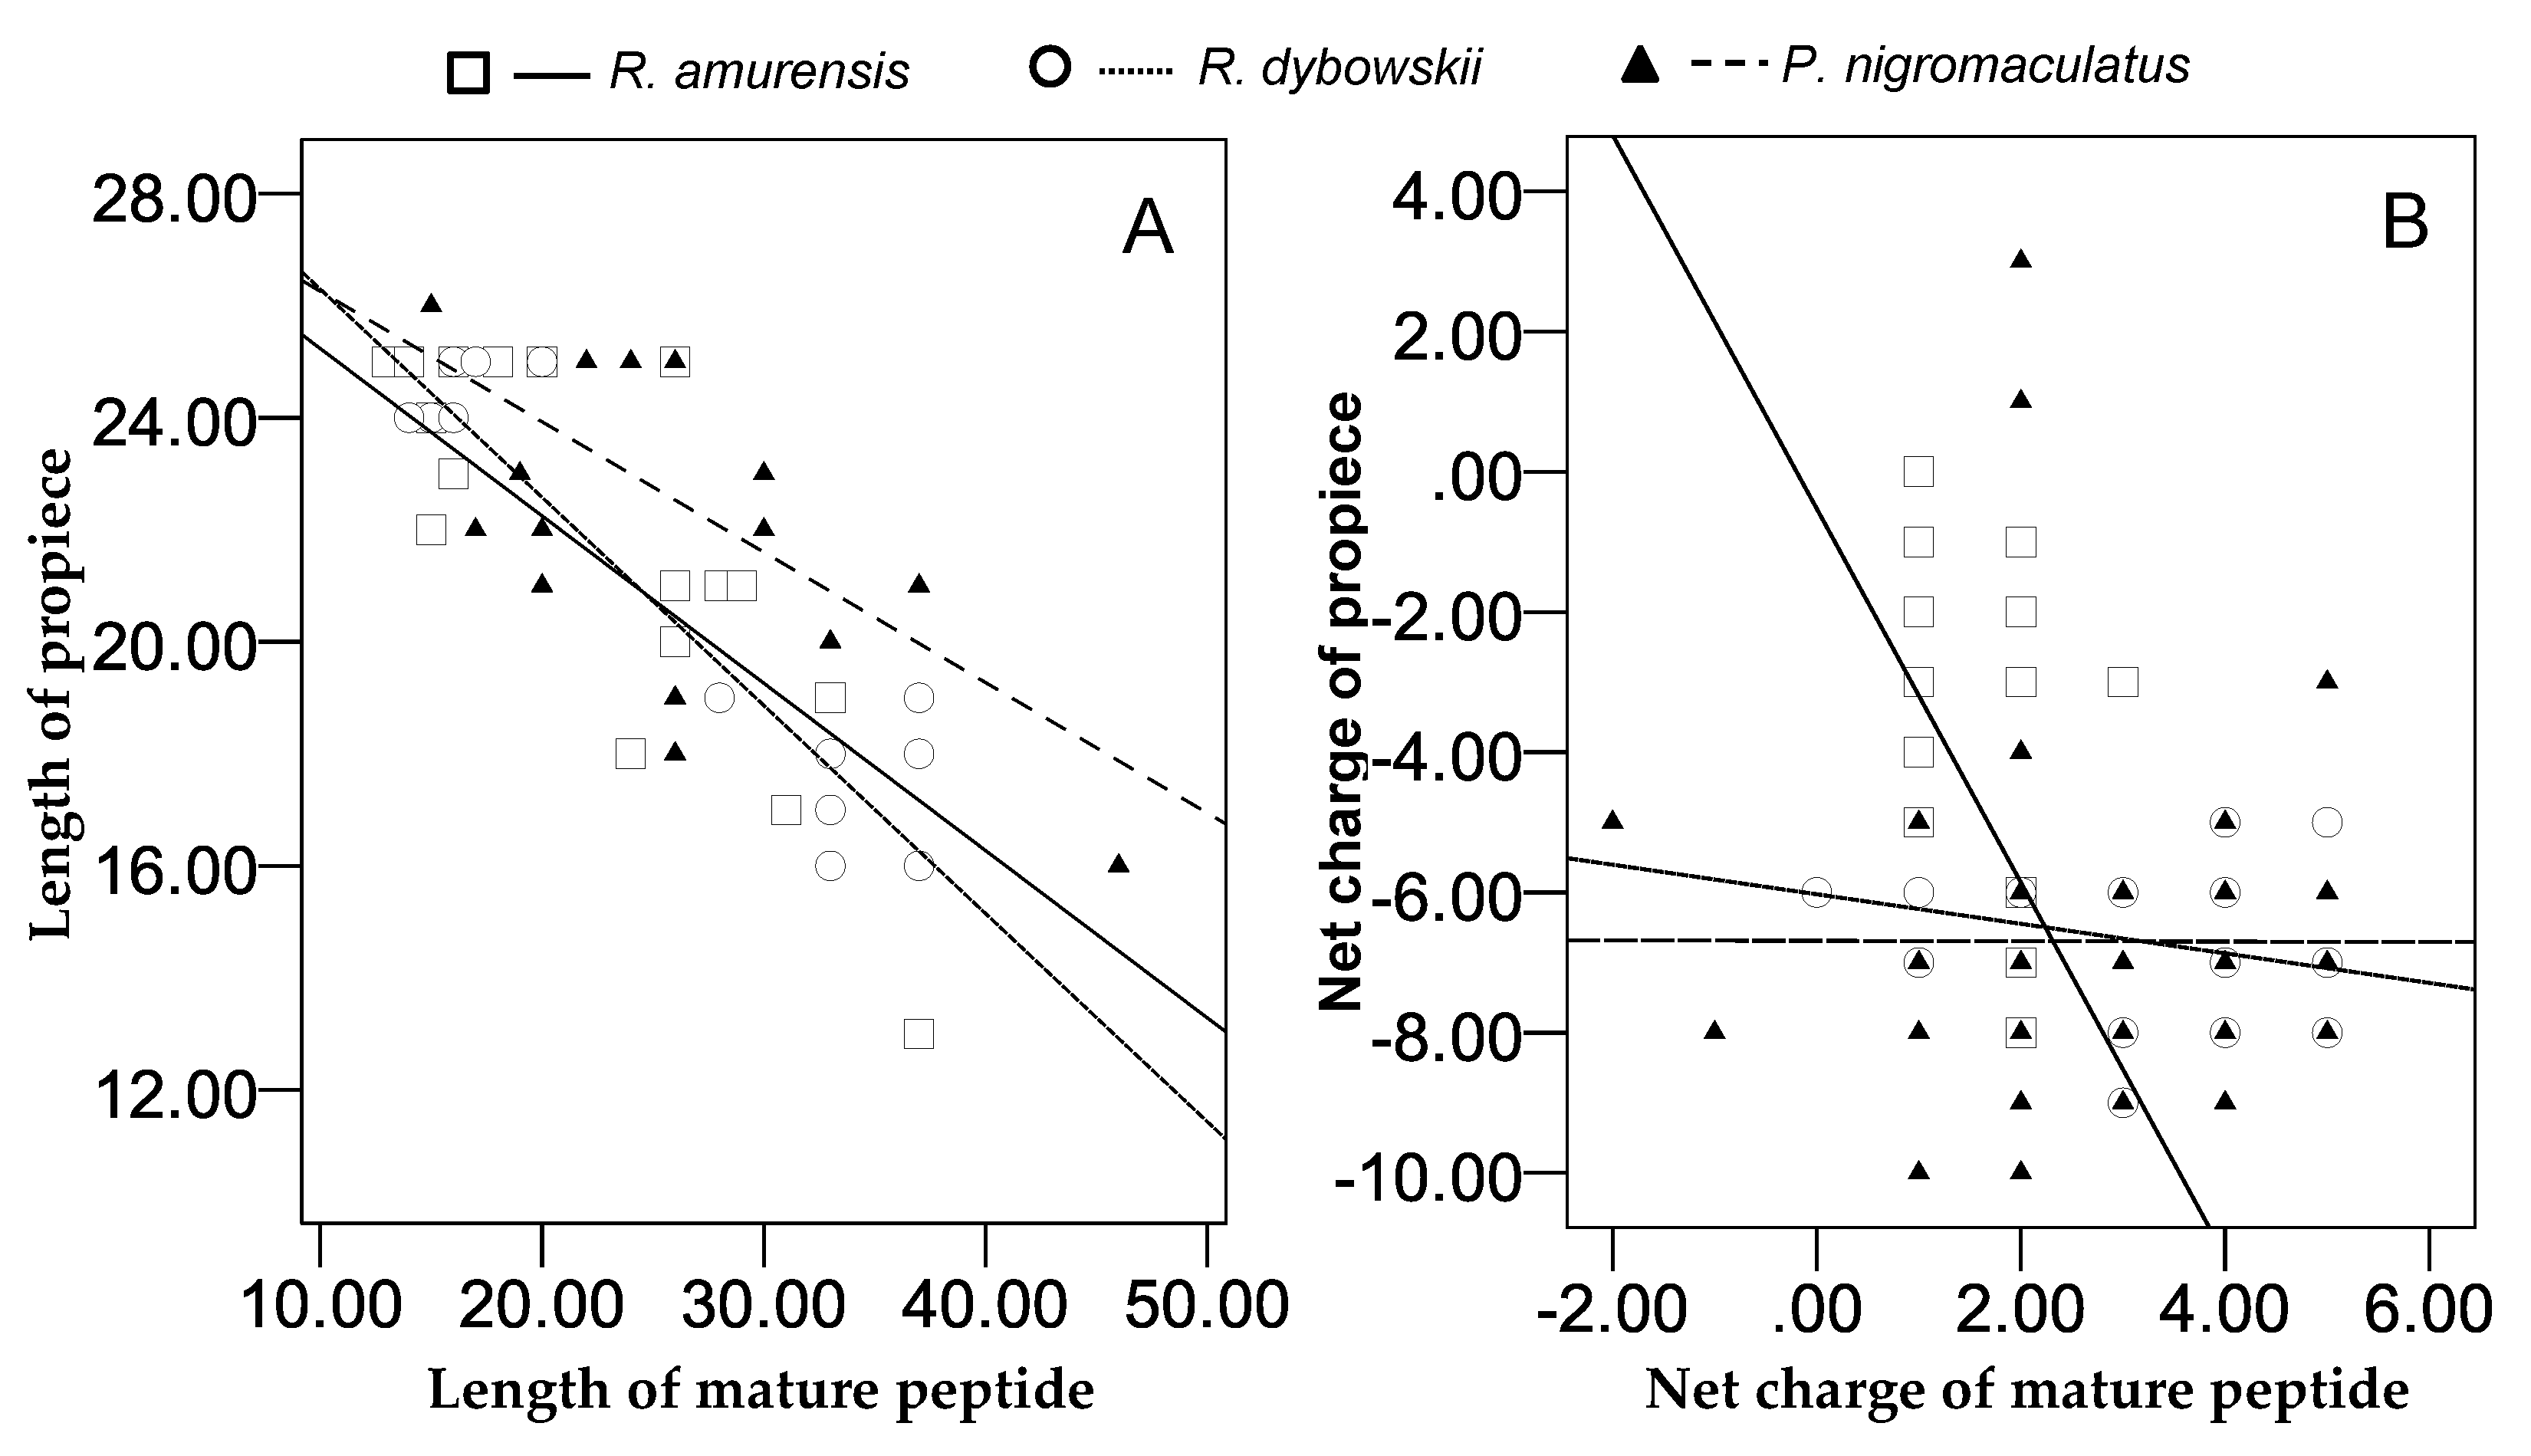
3.5. Relationship between Propieces and Mature Peptides

For all 266 cDNA sequences, the number of amino acid residues of the propiece was negatively correlated with that of the mature peptide of the same sequence (r = −0.762, p = 0.000). Similar significant correlation was recorded for cDNAs of each species (R. amurensis: r = −0.645, p = 0.000; R. dybowskii: r = −0.931, p = 0.000; and P. nigromaculatus: r = −0.858, p = 0.000) (Figure 12A).
The net charge numbers varied for mature peptides and propieces, with greatest variation in P. nigromaculatus, least in R. dybowskii, and middle in R. amurensis. For each species, we detected significant correlation of net charge numbers between propiece and mature peptide, negative correlation in R. amurensis (r = −0.399, p = 0.000) and R. dybowskii (r = −0.311, p = 0.005), and positive correlation in P. nigromaculatus (r = 0.155, p = 0.113) (Figure 12B). We did not detect significant correlation when data of the three species were pooled (r = −0.082, p = 0.182).

3.6. Pattern of Nucleotide Substitution

3.6.1. ts/tv Ratio of Propieces to Mature Peptides

The families brevinin-2AM in R. amurensis and nigrocin-4N in P. nigromaculatus each had only one sequence and were discarded from the analysis of nucleotide substitution. The ts/tv ratio of all AMP families varied greatly for all three species. The ratio of propiece of R. amurensis ranged from as low as 0 to as high as 6.33 with a mean of 2.06 ± 2.07; The ratio of mature peptides of this species ranged between 0.00 and 4.04, and averaged 1.70 ± 1.00; The ratio of whole AMP cDNA was 2.00 ± 1.63 on average with a range between 0.00 and 6.13. In R. dybowskii, the ratio was 1.05 ± 0.74 on average (0.00–1.63) for propiece, 2.70 ± 2.05 (0.78–7.31) for mature peptide, and 1.71 ± 0.53 (0.90–2.78) for the whole AMP cDNA. In P. nigromaculatus, the ratios of the two peptide sections were 1.51 ± 1.23 (0.23–4.73) and 3.35 ± 4.05 (0.00–12.92), respectively, and 3.08 ± 2.60 (1.70–11.32) for the whole AMP cDNA (Table 2). No significant correlation of ts/tv was detected between the propiece and the mature peptide for all three species (p > 0.05).

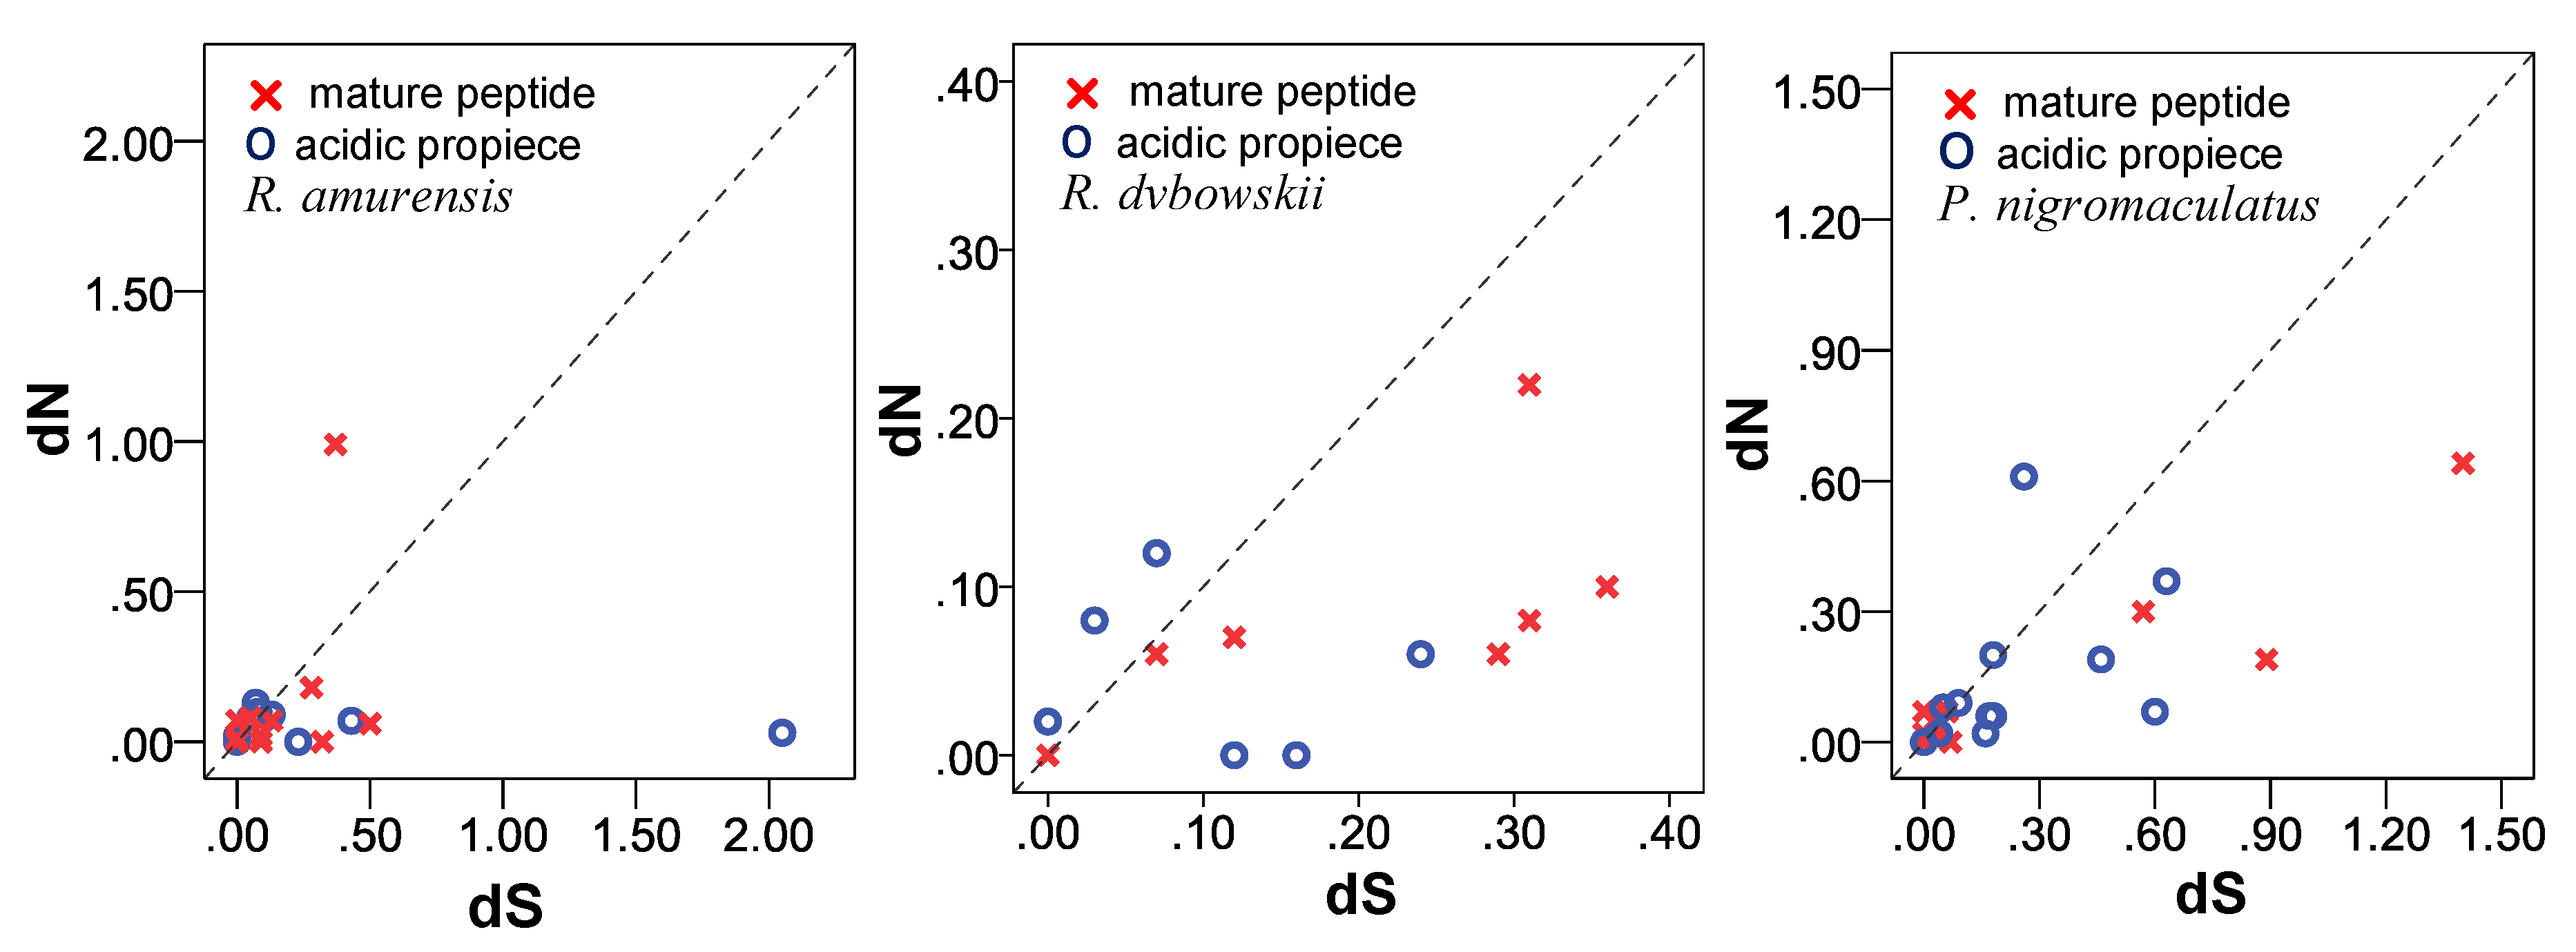
3.6.2. dN/dS Ratio of Propieces and Mature Peptides Region

The number of non-synonymous substitutions (dN) and the number of synonymous substitutions (dS) were counted for propiece, mature peptide, and whole cDNA for all families, but brevinin-2AM and nigrocin-4N had only one cDNA sequence. On the mature peptide region, the values of dN and dS were <1 (dN = 0.00~0.999 and dS = 0.00~0.89), except for family esculentin-2 (dS = 1.40). Similarly, for the acidic propiece region, dN value ranged from 0.00 to 0.61 and dS value ranged from 0.00 to 0.63, except for family amurin-6N (dS = 2.05).
To further visualize the selection mode of the propiece and mature peptide region, the dN was plotted against dS values for each family of the three species (Figure 13). The distribution of dN and dS values of R. amurensis in both propiece and mature peptide regions was relatively compact below 0.50, except for temporin-AM (dN = 0.99, mature peptide region) and amurin-6N (dS = 2.05, propiece region). For the mature peptide region, families amurin-3AM, amurin-5AM, ranacyclin-2AM, and temporin-AM plotted above the neutral line ω = 1, while families amurin-4AM, amurin-6AM, amurin-7AM, amurin-8AM, amurin-9AM, amurin-10AM, japonicin-1AM, palustrin-2AM, and ranalexin-1AM plotted below the neutral line ω = 1. For the acidic propiece region, families amurin-3AM, amurin-4AM, amurin-5AM, amurin-8AM, amurin-9AM, amurin-10AM, and japonicin-1AM plotted above the line ω = 1, while families amurin-6AM, amurin-7AM, palustrin-2AM, ranacyclin-2AM, ranalexin-1AM and temporin-AM plotted below the neutral line. The pattern of dN and dS values suggests that the mature peptide and acidic propiece region were all differentially selected.
The distribution of dN and dS values of R. dybowskii was relatively compact and <0.40 for both propiece and mature peptide regions. All data for the mature peptide region plotted below the ω = 1 line, except for the family dyowsin-3 (ω = 1), suggesting that most AMPs were under negative selection in this region. In contrast for the acidic propiece region, families dyowsin-1, dyowsin-2, dyowsin-3, and chensirin-3 plotted above the ω = 1 line, while families amurin-3, chensirin-1, and chensirin-2 plotted below the neutral line ω = 1, suggesting that this region was differentially selected.
The range of dN and dS values for P. nigromaculatus was relatively wide, from 0.00 to 1.40. The data of the mature peptide region for families brevinin-1N, esculentin-1, nigrocin-2N, nigrocin-6N, and ranacyclin-N plotted above the ω = 1 line, while that for families brevinin-2N, esculentin-2, nigrocin-3N, nigrocin-5N, nigrocin-7N ranaturein-2N, and temporin-1 plotted below the neutral line ω = 1. Similarity for the acidic propiece region, families esculentin-2, nigrocin-5N, nigrocin-7N, ranacyclin-N and temporin-1 plotted above the ω = 1 line, and families brevinin-1N, brevinin-2N, esculentin-1, nigrocin-2N, nigrocin-3N, nigrocin-6N and ranaturein-2N plotted below the neutral line ω = 1. This suggested that the mature peptide and acidic propiece regions were differentially selected.

4. Discussion

4.1. Interspecific Variation of antimicrobial peptide (AMP) Composition

Each AMP has an antimicrobial spectrum, and the spectra of different AMPs can overlap to form a broad, enhanced spectrum covering almost all microbial pathogens, given that the AMP system is highly diverse [38,39]. By this means, frogs may successfully protect themselves from complex environmental pathogen communities. In this study, we obtained 266 AMP cDNA sequences from the skin of R. amurensis, R. dybowskii, and P. nigromaculatus. The three species varied greatly in AMP composition, with 14 families in R. amurensis, 7 families in R. dybowskii and 13 families in P. nigromaculatus (see Table A1, Table A2 and Table A3). AMPs of each family had similar structure and physicochemical properties, while the structure and physicochemical properties varied greatly from family to family (Table A1, Table A2 and Table A3, Figure 7, Figure 8 and Figure 9). This demonstrates that the three species sympatric to northeast China use different sets of highly diverse AMPs to cope with similar microbial environments.
All three frog species exhibited two levels of AMP diversity, within-family diversity, and among-family diversity. Nucleotide variation (Figure 4) and amino acid residue variation was recorded within families. Change of amino acid residue may result in alteration of the antimicrobial spectrum and efficiency [40,41]. However, family members are often highly homologous. Therefore, the within-family variation of mature peptides may not significantly contribute to expansion of the antimicrobial spectrum. Instead, it might contribute to enhancement of antimicrobial efficiency against a specific group of pathogens with a few more alternative agents. The number of family members varied from family to family (Table A1, Table A2 and Table A3), suggesting frogs have differential antimicrobial efficiency against different pathogens instead of indiscriminate defense. This strategy allows them to reduce energy costs for weak enemies and focus on deadly pathogens.
In contrast, among-family diversity showed great divergence of structure and physicochemical properties (Figure 7, Figure 8 and Figure 9). Such divergence contributes to expansion of the antimicrobial spectrum [42,43]. For each species, all AMP families were phylogenetically related (Figure 1, Figure 2 and Figure 3), suggesting the expansion of AMP genes by duplication and diversification [44]. It was posited that such duplication is driven by positive selection where variants benefit the animal with the enhanced and expanded antimicrobial spectrum [17,22]. However, we detected only a few families that were subject to positive selection, while most families were under either near neutral or various degree of negative selection (Figure 13). Negative selection suggests that the present forms and physicochemical properties are essential to cope with present pathogenic attacks, and changes may reduce the antimicrobial spectrum and efficiency, leading to reduction of individual fitness. When the defense network made up with such essential AMPs is adequate, the importance of some other AMPs could be reduced and selection pressure against mutations could decline. Given modification by mutation that leads to addition of novel functions that improve fitness, the AMPs would shift to be under positive selection. Apparently, negative selection can be relaxed only if the number of AMP variants is large enough, enabling some of them to become functional backups of others. In this scenario, gene duplication events, i.e., addition of family members and numbers, would have more essential evolutionary significance than diversification events.
This expectation was supported by the results of our study. As stated above, these species can share common habitat but also have discrete habitat preferences in areas where their ranges overlap. The range size and habitat variability of the three species rank in increasing order as R. dybowskii, R. amurensis, and P. nigromaculatus. AMP diversity detected here (Table A1, Table A2 and Table A3) ranked in the same order, least in R. dybowskii (79 cDNA sequences encoding 24 mature peptides of 7 families), medium in R. amurensis (81 cDNA sequences encoding 33 mature peptides of 14 families), and greatest in P. nigromaculatus (106 cDNA sequences encoding 38 mature peptides of 13 families). The frogs of all three species were trapped in various habitats and a group of each species was raised in clean water. The degenerate primers for RT-PCR could theoretically amplify all families of AMPs of anurans and large numbers of clones were sequenced for each species. Therefore, we believe the transcripts of each species could represent the greatest AMP diversity although the isolation might not have exhausted all. The association between AMP diversity and habitat variability strongly implies gene duplication is the fundamental approach of adaptive evolution of the whole AMP system.
Time-calibrated phylogenetic analysis showed that P. nigromaculatus separated from the genus Rana about 46.57 mya, and R. amurensis and R. dybowskii substantially separated around 13.25 mya [45]. However, our phylogenetic analysis showed that diversification of AMP was not associated with this speciation process (Figure 5). AMPs of P. nigromaculatus did not exhibit early separation from those of the two Rana species. Instead, the same clade was shared by different species, but further diverged into species-specific families. This pattern suggests the evolution rate of AMPs of each family and among families is dynamic and strongly influenced by variation in habitat (pathogenic communities). During co-evolution between AMPs and pathogenic microorganisms [46], each may have chances to shift from being under negative selection to neutral or positive selection based upon the dynamics of pathogenic pressure. This, in turn affects the dynamics of evolution rates.

4.2. Correlation between Propieces and Mature Peptides

The knowledge of mammalian α-defensins showed that the anionic propiece could prevent autocytotoxicity by neutralizing the cationicity of the mature peptide [47]. Therefore, there was a negative linear relationship between the net negative charge of the propiece and the positive net charge of the mature peptide [48]. We observed a weak but significant negative linear correlation of net charges between propiece and mature peptide in R. amurensis (r = −0.399, P=0.000) and R. dybowskii (r = −0.311, p = 0.005), but not in P. nigromaculatus (r = 0.155, p = 0.113). Our results also showed correlation to be associated with diversity of AMPs as the ranges of net charges varied greatly for the two segments in all three species. These results suggest that the “Net Charge Balance Hypothesis” is generally supported, but the requirements to prevent AMPs’ autocytotoxicity by charge neutralization are not strict. This greatly relaxes natural selection against amino acid substitutions, highlighting an important mechanism for retention of high diversity of both mature peptide and propiece.
Interestingly, we found a strong negative linear correlation between the length of propiece and the length of mature peptide for the 266 AMP genes (r = −0.762, p = 0.000), and the same relationship was observed in each species (Figure 12A). This could not be explained with the Net Charge Balance Hypothesis, because the number of amino acid residues is not necessarily associated with net charges. Instead, we expect that the cut point between propiece and mature peptide for maturation (often KR, ER, and RR) may be occasionally cancelled by mutation and occasionally appear again at another position due to mutation, but the new mature peptide and propiece cropped by this means still maintain AMP characteristics and functions. We did not go deep into the Cut Point Sliding Hypothesis in the present study but it should be further tested in future studies.

5. Conclusions

The three partially sympatric anuran species were characterized by high diversity of AMPs. All AMPs were phylogenetically related but not associated with speciation. Diversification driving addition of favored functions and efficiency depends on the expansion of family members and numbers. Cut Point Sliding might be a new mechanism of diversification.

Author Contributions

Conceptualization, Y.C.X. and Q.W.; methodology, R.X., J.J.J., Q.Z., and Y.C.X.; validation, R.X., X.P.L., and Y.M.; formal analysis, Y.C.X. and Q.W.; writing—original draft preparation, Y.C.X. and Q.W.; writing—review and editing, Y.C.X. and Q.W.; supervision, Y.C.X.; project administration, Y.C.X.; funding acquisition, Y.C.X. All authors have read and agreed to the published version of the manuscript.

Funding

This research was funded by the Fundamental Research Funds for the Central Universities (2018) and the National Natural Science Foundation of China (31370393).

Acknowledgments

The authors are grateful to Tian Ming Lan, Huan Liu, Guan Qun Liu, Hui Yi Li, and Yong Jie Zhang for their help with sample collection. We also thank Jacob Njaramba Ngatia and Tom D. Dahmer for their kind assistance in preparing the manuscript.

Conflicts of Interest

The funders had no role in the design of the study; in the collection, analyses, or interpretation of data; in the writing of the manuscript, or in the decision to publish the results.

Appendix A

Table A1. The physicochemical and structural properties of mature peptides from R. amurensis.
NO.AFMWpIMature PeptidesIIGRAVYSS
1Ranacyclin-2AM3823.5010.31LAKALGANKVLGQIVRLANSAARDTTQNVLSAITCKI0.850.38all-α
CHHHHCCHHHHHHHHHHHHHHHHHHHHHHHHHHHCCC
3857.5010.31LAKALGANKVLGQIVRFANSAARDTTQNVLSAITCKI0.850.35all-α
CHHHHCCHHHHHHHHHHHHHHHHHHHHHHHHHHHCCC
2Brevinin-2AM3351.009.24GLMDSLKGLAATAGKTVLQGLLKTASCKLEKTC22.430.27all-α
CCHHHHHHHHHHHHHHHHHHHHHHHHHHCCCCC
3Palustrin-2AM3367.009.51GIWDSIKTFGKKFALNIMDKIKCKIGGGCPP35.26−0.03all-α
CHHHHHHHHCHHHHHHHHHHHHCCCCCCCCC
4Amurin-6AM2872.509.90SLLGLLKGAGKTLLSAGLNKIACKLTGKC9.550.60all-α
CHHHHHHHHHHHHHHHCCHHHHHHHCCCC
3007.709.51GLMDFLKGAGKKLLAAGLDKLNCKLTGKC−23.210.18all-α
CCCHHHHHHCHHHHHHCCCCCCEEECCCC
5Amurin-5AM3114.608.71ALPFLPSLDADIVQQVCCLPRRRCTNGK85.130.01mixed
CCCCCCCCCCHHHHHHHHCCCCCCCCCC
3015.508.00ALPFLPSLDADIVQQVCCLPRGRCTNGK41.190.16mixed
CCCCCCCCCCHHHHHHHHCCCCCCCCCC
3015.508.00ALPFLPSLDADIVQQVCCLPRRGCTNGK61.640.16mixed
CCCCCCCCCCHHHHHHHHCCCCCCCCCC
3104.608.71ALPFLPSLDADIVQQVCCLSRRRCTNGK87.830.04mixed
CCCCCCCCCCHHHHHHHHCCCCCCCCCC
3130.708.71ALPFLPSLDADIVQQVCCLLRRRCTNGK87.830.21all-α
CCCCCCCCCHHHHHHHHHHHHCCCCCCC
3056.609.22ALPFLPSLGADIVQQVCCLPRRRCTNGK82.100.13mixed
CCCCCCCCCCHHHHHHHHCCCCCCCCCC
6Amurin-3AM2947.508.70FLPGLKRCCFEVMSSVFCAITRRPDA77.140.45mixed
CCCCCHHHHHHHHHHHHHEECCCCCC
2919.508.68FLPGLKRCCFEVMSSVFCAITRKPDA44.800.47mixed
CCCCHHHHHHHHHHHHHHEECCCCCC
2816.407.95FLPGLKGCCFEVMSSVFCAIPRKPDA24.990.59mixed
CCCCCCHHHHHHHHHHHHEECCCCCC
2788.307.94FLPGLKGCCFEVMSSVFCAIPKKPDA27.890.62mixed
CCCCCCHHHHHHHHHHHHECCCCCCC
7Amurin-8AM2828.509.51GFVGKYMGKISADHLKMIICKVTGKC6.400.33mixed
CCCHHHCCCCCHHHHHHHHHEECCCC
8Amurin-4AM2621.108.59EAKINFAEMFAAVKKILQQGVPMG29.560.26all-α
CCCCCHHHHHHHHHHHHHHCCCCC
2646.109.70EAKINFAEMFAAVKKILQQGVPRG26.03-0.01all-α
CCCCCHHHHHHHHHHHHHHCCCCC
2603.108.59EAKINFAEIFAAVKKILQQGVPMG37.590.37all-α
CCCCCHHHHHHHHHHHHHHCCCCC
2611.1010.00EAKINFAKIFAAVKKILHQGVPMG4.430.36all-α
CCCCCHHHHHHHHHHHHHHCCCCC
9Ranalexin-1AM2286.908.90FFPLLLSALPSFLCLVFKKC40.511.62all-α
CCHHHHHHHHHHHHHHHHCC
2252.808.90FLPLLLSALPSFLCLVFKKC40.511.67all-α
CCHHHHHHHHHHHHHHHHCC
10Amurin-7AM2456.8012.52SLGRFQGRFGRRTHRKHFVN32.95-1.31mixed
CCCCCCCCCCCCCHHHHHCC
11Japonicin-1AMa2025.509.39FLPPTLVGLAFCKLFKKC13.061.03all-α
CCCCHHHHHHHHHHHHHC
1517.909.39FLGLAFCKLFKKC−8.861.12all-α
CCCCHHHHHHHHC
12Amurin-9AM1745.109.39FLPFFAACAITKKCGK55.610.79all-α
CCCHHHHHHHHHHHCC
13Temporin –Ama1705.108.75ILPLLGNLLNDLLRK42.190.68all-α
CCCHHHHHHHHHHHC
1639.1011.00FLPVLISLIGRLLGK29.351.56all-α
CCHHHHHHHHHHHCC
1487.808.75FVSLLTNLLGLLGK−7.511.44all-α
CHHHHHHHHHHHCC
14Amurin-10AM1537.809.75FLGSILGSLASLFRG16.511.27all-α
CCHHHHHHHHHHHCC
1640.9012.00FLGSILGSRAFLFRG29.350.95mixed
CCCHHHCCCEEEECC
1597.909.75FLGSILGSLAFLFRG16.511.51all-α
CCHHHHHHHHHHHCC
AF (AMP Family); MW (Molecular Weight); The upper line is deduced amino acid sequence of mature peptide, and the lower line is the computed secondary structure wherein C stands for random coil, E stands for extended strand, H stands for helix [35]; II (Instability index) provides an estimate of the stability of the protein in a test tube, stable when II is below 40 and instable if II is above 40 [49]; GRAVY (Grand average of hydropathy) value is calculated by adding the hydropathy value for each residue and dividing by the length of the sequence, with a positive value indicating hydrophobicity and negative value indicating hydrophilicity [50]. SS (Secondary structure), sorted as all-α when H% >45% and E% <5%, all-β when H%<5% and E% >45%, α-β when H% >30% and E% >20% and mixed for all other situations [36].
Table A2. The physicochemical and structural properties of mature peptides from R. dybowskii.
NO.AFMWpIMature PeptidesIIGRAVYSS
1Chensirin-33732.469.51GLFSEVKGVLKGVGKNVAKNVAGSLLEQLKCKISGGC6.640.27all-α
CCHHHHHHHHHHHCHHHHHHHHHHHHHHHHCHCCCCC
3674.429.79GLFSVVKGVLKAAGKNVAKNVGGSLLEQLKCKISGGC7.060.41all-α
CCHHHHHHHHHHHCHHHHHHHHHHHHHHHHCHCCCCC
3702.489.79GLFSVVKGVLKGVGKNVAKNVAGSLLEQLKCKISGGC1.430.47all-α
CCHHHHHHHHHHHCHHHHHHHHHHHHHHHHCHCCCCC
3702.489.79GLFSVVKGVLKAVGKNVAKNVGGSLLEQLKCKISGGC4.760.47all-α
CCHHHHHHHHHHHCHHHHHHHHHHHHHHHHCHCCCCC
3289.999.60GLFSVVKGVLKGVGKNVAGSLLEQLKCKISGGC0.390.57all-α
CCCHHHHHHHHHHHHHHHHHHHHHHHCHCCCCC
3319.979.24GLFSVVKGVLKGEGKNVAGSLLEQLKCKISGGC0.680.34all-α
CCCCHHHHHHHHCCHHHHHHHHHHHHCHCCCCC
3213.899.60GILSAVKGVLKGVGKNVAGSLLDQLKCKLSGGC−2.180.53all-α
CCHHHHHHHHHHHHHHHHHHHHHHHHHHHCCCC
3289.999.60GLLSVFKGVLKGVGKNVAGSLLDQLKCKISGGC−9.130.56all-α
CCHHHHHHHHHHHHHHHHHHHHHHHHCHECCCC
3275.969.60GLFSVVKGVLKGVGKNVAGSLLDQLKCKISGGC−5.450.57all-α
CCCHHHHHHHHHHHHHHHHHHHHHHHCHECCCC
2Dybowsin-12908.6410.07GLMGILKVAVNKLLAAGMNKPRCKAAHC12.890.46all-α
CCCCHHHHHHHHHHHHCCCCHHHCCCCC
3000.699.70GLMDIFKVAVNKLLAAGMNKPRCKAAHC6.710.31all-α
CCCCHHHHHHHHHHHHCCCCHHHCCCCC
2966.689.70GLMDILKVAVNKLLAAGMNKPRCKAAHC15.920.35all-α
CCCHHHHHHHHHHHHHCCCCHHHCCCCC
3Dybowsin-22361.939.39FFSLAFAGFPKFLCFLFKKC11.621.26mixed
CCCCCCCCCCHHHHHHHHHC
2312.009.39FLPLFFAALPKFLCLVLKKC34.151.60all-α
CCHHHHHHHHHHHHHHHHCC
2235.829.39FLSLALAGFSKFLCLVFKKC11.621.47all-α
CCCHHHHHHHHHHHHHHHCC
2269.839.39FFSLALAGFSKFLCLVFKKC11.621.42all-α
CCCHHHHHCHHHHHHHHHCC
4Dybowsin-31910.428.96FLIGMTQGLICLITRKC14.611.21mixed
CCCCCCHHHHHHHECCC
5Chensirin-11611.945.81VFPLVGNLLNDLLGK5.190.89all-α
CCCCHHHHHHHHHCC
1577.935.81VLPLVGNLLNDLLGK5.190.96all-α
CCCCHHHHHHHHHCC
6Amurin-3.1487.938.75ILPILAPLIGGLLGK63.261.73all-α
CCCHHHHHHHHHCCC
1406.828.75ILPILSLIGGLLGK53.311.79all-α
CCHHHHHHHHHCCC
7Chensirin-21450.789.70IIPLSLGYFAKKT0.480.66mixed
CCCCCHHHCECCC
1476.829.53IIPLPLGYYAKKT43.010.29mixed
CCCCCCCCCCCCC
1460.829.70IIPLPLGYFAKKT15.300.60mixed
CCCCCCCCCCCCC
AF (AMP Family); MW (Molecular Weight); The upper line is deduced amino acid sequence of mature peptide, and the lower line is the computed secondary structure wherein C stands for random coil, E stands for extended strand, H stands for helix [35]; II (Instability index) provides an estimate of the stability of the protein in a test tube, stable when II is below 40 and instable if II is above 40 [49]; GRAVY (Grand average of hydropathy) value is calculated by adding the hydropathy value for each residue and dividing by the length of the sequence, with a positive value indicating hydrophobicity and negative value indicating hydrophilicity [50]. SS (Secondary structure), sorted as all-α when H% >45% and E% <5%, all-β when H%<5% and E% >45%, α-β when H% >30% and E% >20% and mixed for all other situations [36].
Table A3. The physicochemical and structural properties of mature peptides from P. nigromaculatus.
NO.AFMWpIMature PeptidesIIGRAVYSS
1Esculentin-14816.849.63GIFSKLAGKKIKNLLISGLKNIGKEVGMDVVRTGIDIAGCKIKGEC3.250.23mixed
CCCCCCCCCHHHHHHHHHHHHHHHHHHHHHHHHCCCECCEEECCCC
4876.949.63GIFFKLAGKKIKNLLISGLKNIGKEVGMDVVRTGIDIAGCKIKGEC−0.010.30mixed
CCCCCCCCCHHHHHHHHHHHHHHHHHHHHHHHHCCCCCCEEECCCC
4756.759.63GISSKLAGKKIKNLLISGLKNIGKEVGMDVVRTGIDIAGCKIKGEC7.440.15mixed
CCCCCCCCHHHHHHHHHHHHHHHHHHCHHHHHHCCCECCEEECCCC
4802.829.63GIFSKLAGKKIKNLLISGLKNVGKEVGMDVVRTGIDIAGCKIKGEC−8.140.22mixed
CCCCCCCCCHHHHHHHHHHHHHHHHHHHHHHHHCCCECCEEECCCC
4869.8910.02GIFSKLAGKKIKNLLISGLKNIGKEVGMDVVRTGIDIAGCKIKGER−6.300.07mixed
CCCCCCCCCHHHHHHHHHHHHHHHHHCHHHHHHCCCECCEEEECCC
2Esculentin-23782.479.60GFLSLLSNAAKFLGKTLLKNVGKAGLETAACKATNQC9.600.27all-α
CHHHHHHHHHHHHHHHHHHHHHHHHHHHHHHHHCCCC
3794.689.93GIFSLIKGAAKVVAKGLGKKVGKFGLDLMACKVTNQC−10.730.51all-α
CCCHHHHHHHHHHHHHHHHHHHHHHHHHHHEECCCCC
3795.629.51GIFSLIKGAAKVVAKGLGKEVGKFGLDLMACKVTNQC−8.440.52all-α
CCCHHHHHHHHHHHHHHHHHHHHHHHHHHHHHCCCCC
3735.529.51GISSLIKGAAKVVAKGLGKEVGKFGLDLMACKVTNQC−3.230.43all-α
CCCHHHHHHHHHHHHHHHHHHHHHHHHHHHHHHCCCC
3602.319.90GALSIFSAAAKLLGKTLLKNAGKAGLQVAACKAANQC12.830.54all-α
CHHHHHHHHHHHHHHHHHHHHHHHHHHHHHHHHHCCC
3Brevinin-2N3351.988.02GLMDSLEGLAATAGKTVLQGLLKTASCKLEKTC27.570.28all-α
CCHHHHHHHHHHHHHHHHHHHHHHHHCCCCCCC
3351.049.24GLMDSLKGLAATAGKTVLQGLLKTASCKLEKTC22.430.27all-α
CCHHHHHHHHHHHHHHHHHHHHHHHHHHCCCCC
Ranaturein-2N3001.649.24GILTDTLKGAAKNVAGVLLDKLKCKITGGC−10.280.42all-α
CCCHHHHHHHHHHHHHHHHHHCCCEECCCC
3001.649.24GILKDTLKGAATNVAGVLLDKLKCKITGGC−18.120.42all-α
CCCHHHHHHHHHHHHHHHHHHHCCEECCCC
3012.719.60GILLNTLKGAAKNVAGVLLDKLKCKITGGC−8.100.57all-α
CCHHHHHHHHHHHHHHHHHHHCCCEECCCC
3070.749.24GLLLDTVKGAAKNVAGILLNKLKCKITGDC−1.800.47all-α
CCHHHHHHHHHHHHHHHHHHHCCCEECCCC
3086.708.79GLLLDTDKGAAKNVAGILLNKLKCKITGDC−3.670.21all-α
CCCCHHHHHHHHHHHHHHHHHCCCEECCCC
3056.729.24GLLLDTVKGAAKNVAGILLNKLKCKVTGDC−4.630.46all-α
CCHHHHHHHHHHHHHHHHHHHCCCEECCCC
5Nigrocin-6N2893.458.86VIPFVASVATEMMHHVYCAASKRCKN53.880.35all-α
CCCHHHHHHHHHHHHHHHHHHHHCCC
2921.428.05VIPFVASVATEMMHHVYCAASRRCQN67.880.35all-α
CCCHHHHHHHHHHHHHHHHHHHHHCC
2882.479.39VIPFVASVAAEMMRHVYCAASKRCKN28.950.40all-α
CCCHHHHHHHHHHHHHHHHHHHHCCC
2863.428.86VIPFVASVAAEMMHHVYCAASKRCKN46.480.45all-α
CCCHHHHHHHHHHHHHHHHHHHHCCC
6Nigrocin-7N2987.608.50ILKCKNELYQLCQVCSLVCWGSSQKL24.630.30mixed
CCCCHHHHHHHHHHHHEEEECCCCCC
2977.588.40ILKCKNELYQLCQVCSLVCWGSSQKC27.890.25mixed
CCCCHHHHHHHHHHHHEEEECCCCCC
3021.628.50ILKCKNELYQLCQVCSLVCWGSSQKF27.890.26mixed
CCCCHHHHHHHHHHHHEEEECCCCCC
7Brevinin-1N2513.229.70FLPALIGIAAKALPSLLCKITKKC34.611.12all-α
CCCHHHHHHHHHHHHHHHHHHHCC
2513.229.70FLPALIGLAAKALPSLLCKITKKC38.151.09all-α
CCCHHHHHHHHHHHHHHHHHHHCC
8Nigrocin-2N2030.569.39GLLSKVLGVGKKVLCGVSGLC−6.651.21all-α
CCCHHHHCCCCEEEECCCCCC
2000.539.39GLLGKVLGVGKKVLCGVSGLC−10.691.23all-α
CCCCHHHCCCCEEEECCCCCC
9Nigrocin-4N2244.505.26SLFSISMLKHESSDVENHLA24.52−0.09all-α
CCCCEEECCCCCCHHHHHHC
10Ranacyclin-N2148.499.70GAPKGCWTKSYPPQPCSGKR58.31−1.25mixed
CCCCCCCCCCCCCCCCCCCC
2148.539.90GAPKGCWTKSYPPKPCSGKR35.28−1.27mixed
CCCCCCCCCCCCCCCCCCCC
2247.6210.06GAPKGCWTKSYPPQPCSRKR72.19−1.46mixed
CCCCCCCCCCCCCCCCCCCC
2176.509.85GAPRGCWTKSYPPQPCSGKR54.54−1.28mixed
CCCCCCCCCCCCCCCCCCCC
11Nigrocin-5N2194.569.53FLPSSPWNEGTYVLKKLKS50.12−0.48mixed
CCCCCCCCCCHHHHHHCCC
12Nigrocin-3N1798.064.00SPLYTFEGAPGIWPGCC38.860.28mixed
CCCCEECCCCCCCCCCC
13Temporin-11555.968.72VIPIVSGLLFSLLGK−3.911.83all-α
CCCHHHHHHHHHHCC
1495.878.72VIPIVSGLLSSLLGK8.931.59all-α
CCCHHHHHHHHHHCC
AF (AMP Family); MW (Molecular Weight); The upper line is deduced amino acid sequence of mature peptide, and the lower line is the computed secondary structure wherein C stands for random coil, E stands for extended strand, H stands for helix [35]; II (Instability index) provides an estimate of the stability of the protein in a test tube, stable when II is below 40 and instable if II is above 40 [49]; GRAVY (Grand average of hydropathy) value is calculated by adding the hydropathy value for each residue and dividing by the length of the sequence, with a positive value indicating hydrophobicity and negative value indicating hydrophilicity [50]. SS (Secondary structure), sorted as all-α when H% >45% and E% <5%, all-β when H%<5% and E% >45%, α-β when H% >30% and E% >20% and mixed for all other situations [36].

References

  1. Haslam, I.S.; Roubos, E.W.; Mangoni, M.L.; Yoshizato, K.; Vaudry, H.; Kloepper, J.E.; Pattwell, D.M.; Maderson, P.F.; Paus, R. From frog integument to human skin: dermatological perspectives from frog skin biology. Biol. Rev. Camb. Philos. Soc. 2014, 89, 618–655. [Google Scholar] [CrossRef] [PubMed]
  2. Varga, J.F.A.; Bui-Marinos, M.P.; Katzenback, B.A. Frog skin innate immune defences: sensing and surviving pathogens. Front. Immunol. 2018, 9, 3128. [Google Scholar] [CrossRef] [PubMed]
  3. Gill, D.; Nicholas, B.; Aaron, W.; Kisich, K.O. The roles of antimicrobial peptides in innate host defense. Curr. Pharm. Des. 2009, 15, 2377–2392. [Google Scholar] [CrossRef] [Green Version]
  4. Pukala, T.L.; Bowie, J.H.; Maselli, V.M.; Musgrave, I.F.; Tyler, M.J. Host-defence peptides from the glandular secretions of amphibians: structure and activity. Nat. Prod. Rep. 2006, 23, 368–393. [Google Scholar] [CrossRef]
  5. Toledo, R.C.; Jared, C. Cutaneous granular glands and amphibian venoms. Comp. Biochem. Physiol. Part A Physiol. 1995, 111, 1–29. [Google Scholar] [CrossRef]
  6. Woodhams, D.C. Antimicrobial peptide defenses in Amphibian skin. Integr. Comp. Biol. 2005, 45, 137–142. [Google Scholar] [CrossRef] [Green Version]
  7. Dennison, S.; Wallace, J.; Harris, F.; Phoenix, D. Amphiphilic α-helical antimicrobial peptides and their structure/function relationships. Protein Pept. Lett. 2005, 12, 31–39. [Google Scholar] [CrossRef] [Green Version]
  8. WimLey, W.C.; Hristova, K. Antimicrobial peptides: successes, challenges and unanswered questions. J. Membr. Biol. 2011, 239, 27–34. [Google Scholar] [CrossRef] [Green Version]
  9. Chan, D.I.; Prenner, E.J.; Vogel, H.J. Tryptophan- and arginine-rich antimicrobial peptides: structures and mechanisms of action. Biochim. Et Biophys. Acta 2006, 1758, 1184–1202. [Google Scholar] [CrossRef] [Green Version]
  10. Brogden, K.A. Antimicrobial peptides: pore formers or metabolic inhibitors in bacteria? Nat. Rev. Microbiol. 2005, 3, 238–250. [Google Scholar] [CrossRef]
  11. Kamysz, W. Are antimicrobial peptides an alternative for conventional antibiotics? Nucl. Med. Rev. Cent. East. Eur. 2005, 8, 78–86. [Google Scholar] [PubMed]
  12. Ladram, A.; Nicolas, P. Antimicrobial peptides from frog skin: biodiversity and therapeutic promises. Front. Biosci. 2016, 21, 1341–1371. [Google Scholar] [CrossRef] [PubMed] [Green Version]
  13. Patocka, J.; Nepovimova, E.; Klimova, B.; Wu, Q.; Kuca, K. Antimicrobial peptides: Amphibian host defense peptides. Curr. Med. Chem. 2018. [Google Scholar] [CrossRef] [PubMed]
  14. Nicolas, P.; El Amri, C. The dermaseptin superfamily: A gene-based combinatorial library of antimicrobial peptides. Biochim. Et Biophys. Acta Biomembr. 2009, 1788, 1537–1550. [Google Scholar] [CrossRef] [Green Version]
  15. Tennessen, J.A. Enhanced synonymous site divergence in positively selected vertebrate antimicrobial peptide genes. J. Mol. Evol. 2005, 61, 445–455. [Google Scholar] [CrossRef]
  16. Tennessen, J.A. Molecular evolution of animal antimicrobial peptides: widespread moderate positive selection. J. Evol. Biol. 2005, 18, 1387–1394. [Google Scholar] [CrossRef]
  17. Duda, T.F.; Damien, V.; Pierre, N. Roles of diversifying selection and coordinated evolution in the evolution of amphibian antimicrobial peptides. Mol. Biol. Evol. 2002, 19, 858–864. [Google Scholar] [CrossRef] [Green Version]
  18. Conlon, J.M.; Iwamuro, S.; King, J.D. Dermal cytolytic peptides and the system of innate immunity in Anurans. Ann. N. Y. Acad. Sci. 2009, 1163, 75–82. [Google Scholar] [CrossRef]
  19. Conlon, J.M. The contribution of skin antimicrobial peptides to the system of innate immunity in anurans. Cell Tissue Res. 2011, 343, 201–212. [Google Scholar] [CrossRef]
  20. Ponti, D.; Mignogna, G.M.L.; De, B.D.; Simmaco, M.; Barra, D. Expression and activity of cyclic and linear analogues of esculentin-1, an anti-microbial peptide from Amphibian skin. FEBS J. 2010, 263, 921–927. [Google Scholar] [CrossRef] [Green Version]
  21. Tennessen, J.A.; Blouin, M.S. Balancing selection at a frog antimicrobial peptide locus: fluctuating immune effector alleles? Mol. Evol. 2008, 25, 2669–2680. [Google Scholar] [CrossRef] [PubMed] [Green Version]
  22. Vanhoye, D.; Bruston, F.; Nicolas, P.; Amiche, M. Antimicrobial peptides from hylid and ranin frogs originated from a 150-million-year-old ancestral precursor with a conserved signal peptide but a hypermutable antimicrobial domain. Eur. J. Biochem. 2003, 270, 2068–2081. [Google Scholar] [CrossRef] [PubMed]
  23. Lee, W.H.; Li, Y.; Lai, R.; Li, S.; Zhang, Y.; Wang, W. Variety of antimicrobial peptides in the Bombina maxima toad and evidence of their rapid diversification. Eur. J. Immunol. 2005, 35, 1220–1229. [Google Scholar] [CrossRef] [PubMed]
  24. AmphibiaWeb Provides Information on Amphibian Declines, Natural History, Conservation, and Taxonomy. Available online: http://amphibiaweb.org (accessed on 1 December 2019).
  25. Zhang, X.L.; Bi, J.-H.; Zhang, X.D.; Ma, Y.-W. New distribution of Rana dybowskii from Inner Mongolia. J. Inn. Mong. Norm. Univ. 2017, 46, 715–716, 721. [Google Scholar] [CrossRef]
  26. Lee, J.E.; Dong, Y.Y.R.K. Genetic relationships of Rana amurensis based on mitochondrial cytochrome b gene sequences. Korean J. Biol. Sci. 1999, 3, 303–309. [Google Scholar] [CrossRef]
  27. Ma, D.; Liu, H.-T.; Ji, Y.-J.; Shi, C.-M.; Yang, Y.-H.; Zhang, D.-X. Black-spotted pond frog (Pelophylax nigromaculatus) on the Chinese Loess Plateau represents a cryptic species: evidence from molecular phylogeny and ecological niche modeling. J. Syst. Evol. 2015, 53, 339–350. [Google Scholar] [CrossRef]
  28. WebLogo is a Web-based Application Designed to Make the Generation of Sequence Logos Easy and Painless. Available online: http://weblogo.threeplusone.com/ (accessed on 4 March 2019).
  29. Lefort, V.; Longueville, J.E.; Gascuel, O. SMS: smart model selection in PhyML. Mol. Biol. Evol. 2017, 34, 2422–2424. [Google Scholar] [CrossRef] [Green Version]
  30. Lemoine, F.; Domelevo Entfellner, J.B.; Wilkinson, E.; Correia, D.; Davila Felipe, M.; De Oliveira, T.; Gascuel, O. Renewing Felsenstein’s phylogenetic bootstrap in the era of big data. Nature 2018, 556, 452–456. [Google Scholar] [CrossRef]
  31. EvolView is an Easy-to-use Online Tool for Displaying, Managing and Customizing Phylogenetic Trees. Available online: https://www.evolgenius.info/evolview/ (accessed on 2 May 2018).
  32. Amiche, M.; Ladram, A.; Nicolas, P. A consistent nomenclature of antimicrobial peptides isolated from frogs of the subfamily Phyllomedusinae. Peptides 2008, 29, 2074–2082. [Google Scholar] [CrossRef]
  33. Rozas, J.; Sanchez-DelBarrio, J.C.; Messeguer, X.; Rozas, R. DnaSP, DNA polymorphism analyses by the coalescent and other methods. Bioinformatics 2003, 19, 2496–2497. [Google Scholar] [CrossRef]
  34. ProtParam is a Tool which Allows the Computation of Various Physical and Chemical Parameters for a Given Protein Stored in Swiss-Prot or TrEMBL or for a User Entered Protein Sequence. Available online: http://www.expasy.org/ (accessed on 12 May 2017).
  35. PSSpred (Protein Secondary Structure Prediction) is a Simple Neural Network Training Algorithm for Accurate Protein Secondary Structure Prediction. Available online: https://zhanglab.ccmb.med.umich.edu/PSSpred/ (accessed on 5 April 2018).
  36. PredictProtein: An Open Resource for Online Prediction of Protein Structural and Functional Features. Available online: https://www.predictprotein.org (accessed on 16 January 2012).
  37. Yang, Z. PAML: A program package for phylogenetic analysis by maximum likelihood. Comput. Appl. Biosci. 1997, 13, 555–556. [Google Scholar] [CrossRef] [PubMed]
  38. Mor, A.; Hani, K.; Nicolas, P. The vertebrate peptide antibiotics dermaseptins have overlapping structural features but target specific microorganisms. J. Biol. Chem. 1994, 269, 31635–31641. [Google Scholar] [PubMed]
  39. Yu, G.; Baeder, D.Y.; Regoes, R.R.; Rolff, J. Combination effects of antimicrobial peptides. Antimicrob. Agents Chemother. 2016, 60, 1717–1724. [Google Scholar] [CrossRef] [PubMed] [Green Version]
  40. Kindrachuk, J.; Paur, N.; Reiman, C.; Scruten, E.; Napper, S. The PhoQ-activating potential of antimicrobial peptides contributes to antimicrobial efficacy and is predictive of the induction of bacterial resistance. Antimicrob. Agents Chemother. 2007, 51, 4374–4381. [Google Scholar] [CrossRef] [Green Version]
  41. Mishra, B.; Wang, G. The importance of amino acid composition in natural AMPs: An evolutional, structural, and functional perspective. Front. Immunol. 2012, 3, 221. [Google Scholar] [CrossRef] [Green Version]
  42. Kumar, P.; Kizhakkedathu, J.; Straus, S. Antimicrobial peptides: diversity, mechanism of action and strategies to improve the activity and biocompatibility in vivo. Biomolecules 2018, 8, 4. [Google Scholar] [CrossRef] [Green Version]
  43. Schmitt, P.; Rosa, R.D.; Destoumieux-Garzón, D. An intimate link between antimicrobial peptide sequence diversity and binding to essential components of bacterial membranes. Biochim. Et Biophys. Acta BBA Biomembr. 2016, 1858, 958–970. [Google Scholar] [CrossRef]
  44. Tennessen, J.A.; Blouin, M.S. Selection for antimicrobial peptide diversity in frogs leads to gene duplication and low allelic variation. J. Mol. Evol. 2007, 65, 605–615. [Google Scholar] [CrossRef]
  45. Wiens, J.J.; Sukumaran, J.; Pyron, R.A.; Brown, R.M. Evolutionary and biogeographic origins of high tropical diversity in old world frogs. Evol. Int. J. Org. Evol. 2009, 63, 1217–1231. [Google Scholar] [CrossRef]
  46. Ferrer-Admetlla, A.; Bosch, E.; Sikora, M.; Marques-Bonet, T.; Ramirez-Soriano, A.; Muntasell, A.; Navarro, A.; Lazarus, R.; Calafell, F.; Bertranpetit, J.; et al. Balancing selection is the main force shaping the evolution of innate immunity genes. J. Immunol. 2008, 181, 1315–1322. [Google Scholar] [CrossRef] [Green Version]
  47. Michaelson, D.; Rayner, J.; Couto, M.; Ganz, T. Cationic defensins arise from charge-neutralized propeptides: A mechanism for avoiding leukocyte autocytotoxicity? J. Leukoc. Biol. 1992, 51, 634–639. [Google Scholar] [CrossRef] [PubMed]
  48. Hughes, A.L.; Yeager, M. Coordinated amino acid changes in the evolution of mammalian defensins. J. Mol. Evol. 1997, 44, 675–682. [Google Scholar] [CrossRef] [PubMed]
  49. Guruprasad, K.; Reddy, B.V.B.; Pandit, M.W. Correlation between stability of a protein and its dipeptide composition: A novel approach for predicting in vivo stability of a protein from its primary sequence. Protein Eng. 1990, 4, 155–161. [Google Scholar] [CrossRef] [PubMed]
  50. Kyte, J.; Doolittle, R.F. A simple method for displaying the hydropathic character of a protein. J. Mol. Biol. 1982, 157, 105–132. [Google Scholar] [CrossRef] [Green Version]
Figure 1. A phylogenetic tree of antimicrobial peptide (AMP) genes identified from R. amurensis. The tree was constructed based on the sequence of acidic propiece and mature peptide region. Numbers in the figure are confidence values with bootstrap 1000 replicates; only values ≥60 are shown.
Genes 11 00158 g001
Figure 2. A phylogenetic tree of antimicrobial peptide (AMP) genes identified from R. dybowskii. The tree was constructed based on the sequence of acidic propiece and mature peptide region. Numbers in the figure are confidence values with bootstrap 1000 replicates; only values ≥60 are shown.
Genes 11 00158 g002
Figure 3. A phylogenetic tree of antimicrobial peptide (AMP)genes identified from P. nigromaculatus. Numbers in the figure are confidence values with bootstrap 1000 replicates; only values ≥60 are shown.
Genes 11 00158 g003
Figure 4. Nucleotide diversity (±SD) of antimicrobial peptide (AMP) families identified from the three anuran species.
Genes 11 00158 g004
Figure 5. A phylogenetic tree of all antimicrobial peptide (AMP) genes identified from three anuran species, namely R. amurensis (pink), R. dybowskii (green) and P. nigromaculatus (blue). Orange dots in the figure are confidence values with transfer bootstrap expectation (TBE) 1000 replicates; only values ≥60 are shown.
Genes 11 00158 g005
Figure 6. The primary structure of mature peptides of 14 AMP families from R. amurensis. The blue letters represent hydrophilic residues, including Arginine (R), Lysine (K), Aspartic acid (D), Glutamic acid (E), Asparagine (N), Glutamine (Q); the green letters represent neutral residues, namely Serine (S), Glycine (G), Histidine (H), Threonine (T), Alanine (A), and Proline (P); the black letters represent hydrophobic residues, including Tyrosine (Y), Valine (V), Leucine (L), Isoleucine (I), Phenylalanine (F), Tryptophane (W), Methionine (M), and Cysteine (C).
Genes 11 00158 g006
Figure 7. Frequency distribution of theoretical isoelectric points (pI) of antimicrobial peptides (AMPs) isolated from the three anuran species.
Genes 11 00158 g007
Figure 8. Frequency distribution of hydrophobicity predicted for all antimicrobial peptides (AMPs) isolated from the three anuran species.
Genes 11 00158 g008
Figure 9. Frequency distribution of Instability index (II) values of all antimicrobial peptides (AMPs) isolated from the three anuran species.
Genes 11 00158 g009
Figure 10. The primary structure of mature peptides of 7 antimicrobial peptide (AMP) families from R. dybowskii. The blue letters represent hydrophilic residues, including Arginine (R), Lysine (K), Aspartic acid (D), Glutamic acid (E), Asparagine (N), Glutamine (Q); the green letters represent neutral residues namely Serine (S), Glycine (G), Histidine (H), Threonine (T), Alanine (A), and Proline (P); the black letters represent hydrophobic residues, including Tyrosine (Y), Valine (V), Leucine (L), Isoleucine (I), Phenylalanine (F), Tryptophane (W), Methionine (M), and Cysteine (C). 63.6% sequences (14 out of 22) of chensirin-3 had deletion of a short fragment spanning site 19 to 22; 80.0% sequences (1 out of 5) of amurin-3 had an amino acid deletion at site 15.
Genes 11 00158 g010
Figure 11. The primary structure of mature peptides of 13 antimicrobial peptide (AMP) families from P. nigromaculatus. The blue letters represent hydrophilic residues, including Arginine (R), Lysine (K), Aspartic acid (D), Glutamic acid (E), Asparagine (N), Glutamine (Q); the green letters represent neutral residues, namely Serine (S), Glycine (G), Histidine (H), Threonine (T), Alanine (A), and Proline (P); the black letters represent hydrophobic residues, including Tyrosine (Y), Valine (V), Leucine (L), Isoleucine (I), Phenylalanine (F), Tryptophane (W), Methionine (M), and Cysteine (C).
Genes 11 00158 g011
Figure 12. Relationship between the acidic propiece and the mature peptide of antimicrobial peptides (AMPs) identified from three anuran species. A: The linear correlation between the length (the number of amino acid residues) of the propiece and the mature peptide (R. amurensis: r = −0.645, p = 0.000; R. dybowskii: r = −0.931, p = 0.000; P. nigromaculatus: r = −0.858, p = 0.000); B: linear correlation between the net charges of the propiece and the mature peptide (R. amurensis: r = −0.399, p = 0.000; R. dybowskii: r = −0.311, p = 0.005; P. nigromaculatus: r = 0155, p = 0.113).
Genes 11 00158 g012
Figure 13. Plots of dN against dS of the propiece and the mature peptide region for three anuran species. The broken line is the neutral line (ω = 1).
Genes 11 00158 g013
Table 1. Primer sequences used for antimicrobial peptides’ (AMPs’) amplification.
PrimerSequence (5′–3′)Ta
PS1GGGAC(C/A) ATCAACTTATCTTGT54 °C
PS2GGGACCATCTCCTT(A/G)TCTCTCTGT54 °C
PS3GGGAT(G/C)ATCTCCTTA(A/T)CTCTCTGT56 °C
PS4GGAACCATCTC(A/G)TCTCTCTGT55 °C
PS5GGGACCATCAACTTCTCTCTCTGT57 °C
PS6GGGACCATCAACTT(A/T)TCT(C/T)T(C/T/A)TGT55 °C
PS7GGGACCATCTCCTTATC(T/G)CT(C/T)TG54 °C
PS8GGGACCATCA(G/C)CTTACT(C/T)TGT56 °C
PS9GGGACCATC(G/T)CCCT(T/A)TCTCTCTG55 °C
PS10GGG(A/G)TC(A/G)TCTC(G/C)TTATCTCTCTGT55 °C
PCTTTTTTTTTTTTTTTTTTTTTTT(C/G/A)50 °C
Table 2. The ts/tv ratios of propiece and mature peptide of antimicrobial peptides (AMPs)AMPs in three anuran species.
SpeciesAMP familyts/tv
PropieceMature PeptideWhole AMP *
R. amurensisAmurin-3AM5.312.602.43
Amurin-4AM1.911.571.43
Amurin-5AM--6.13
Amurin-6AM0.081.281.37
Amurin-7AM0.692.040.63
Amurin-8AM2.27-1.62
Amurin-9AM0.001.990.00
Amurin-10AM-1.322.16
Japonicin-1AM-2.002.72
Palustrin-2AM6.331.011.76
Ranacyclin-2AM2.000.000.00
Ranalexin-1AM1.910.834.39
Temporin-AM0.094.041.32
Brevinin-AM///
R. dybowskiiAmurin-31.520.921.58
Chensirin-1-1.881.83
Chensirin-2-7.310.90
Chensirin-31.630.781.38
Dybowsin-10.002.712.78
Dybowsin-2-3.291.66
Dybowsin-3-2.003.20
P. nigromaculatusBrevinin-1N2.000.001.77
Brevinin-2N0.23-3.56
Esculentin-11.39-1.70
Esculentin-21.172.0811.32
Nigrocin-2N--1.72
Nigrocin-3N0.91-2.36
Nigrocin-5N4.730.001.38
Nigrocin-6N0.695.831.74
Nigrocin-7N0.983.563.57
Ranacyclin-N-1.181.63
Ranaturein-2N0.681.223.04
Temporin-12.3612.922.43
Nigrocin-4N///
- indicates tv was 0 and the ratio was absent; * whole AMPs here included partial signal peptide, whole propiece, and whole mature peptide; / indicates the ratio could not be calculated because the family had only one cDNA sequence.

