Article

You Had Me at “MAGIC”!: Four Barley MAGIC Populations Reveal Novel Resistance QTL for Powdery Mildew

by
Fluturë Novakazi
1,
Lene Krusell
2,
Jens Due Jensen
3,
Jihad Orabi
3,
Ahmed Jahoor
1,3,
Therése Bengtsson
1,* and
on behalf of the PPP Barley Consortium
1
Department of Plant Breeding, Swedish University of Agricultural Sciences, P.O. Box 101, 23053 Alnarp, Sweden
2
Sejet Plant Breeding, Nørremarksvej 67, 8700 Horsens, Denmark
3
Nordic Seed A/S, Kornmarken 1, 8464 Galten, Denmark
*
Author to whom correspondence should be addressed.
The PPP Barley Consortium are listed in acknowledgments.
Genes 2020, 11(12), 1512; https://doi.org/10.3390/genes11121512
Submission received: 10 November 2020 / Revised: 11 December 2020 / Accepted: 15 December 2020 / Published: 18 December 2020
(This article belongs to the Special Issue Powdery Mildew Resistance Genetics)

Abstract

:
Blumeria graminis f. sp. hordei (Bgh), the causal agent of barley powdery mildew (PM), is one of the most important barley leaf diseases and is prevalent in most barley growing regions. Infection decreases grain quality and yields on average by 30%. Multi-parent advanced generation inter-cross (MAGIC) populations combine the advantages of bi-parental and association panels and offer the opportunity to incorporate exotic alleles into adapted material. Here, four barley MAGIC populations consisting of six to eight founders were tested for PM resistance in field trials in Denmark. Principle component and STRUCTURE analysis showed the populations were unstructured and genome-wide linkage disequilibrium (LD) decay varied between 14 and 38 Mbp. Genome-wide association studies (GWAS) identified 11 regions associated with PM resistance located on chromosomes 1H, 2H, 3H, 4H, 5H and 7H, of which three regions are putatively novel resistance quantitative trait locus/loci (QTL). For all regions high-confidence candidate genes were identified that are predicted to be involved in pathogen defense. Haplotype analysis of the significant SNPs revealed new allele combinations not present in the founders and associated with high resistance levels.

1. Introduction

Cultivated barley (Hordeum vulgare ssp. vulgare L.) is mainly grown for fodder and brewing purposes [1], and has the advantage that it can be cultivated under harsh conditions and at high altitudes [1,2]. Nevertheless, pests and diseases still pose a threat. One of the most wide-spread diseases in cereals is powdery mildew (PM) caused by the obligate Ascomycota pathogen Bgh [3]. In Europe, it is a disease that can lead to yield losses of up to 30% as well as reduced grain quality [4]. Bgh epidemics are currently controlled by chemicals and by breeding for resistant barley cultivars, where the latter constitutes the most economically and environmentally sound method. Several important resistance (R) genes in barley have been described, and are used by barley breeders to develop resistant cultivars. These are Mla, Mlat, MlGa, Mlk, Mlnn, Mlra on chromosome 1H [5,6,7], MlLa and MlMor on chromosome 2H [7,8,9], Mlg and MlBo on chromosome 4H [7,10], Mlj on chromosome 5H [11], Mlh on chromosome 6H [7], mlt and Mlf on chromosome 7H [11] and many more, some of which are derived from wild (H. v. ssp. spontaneum) and bulbous barley (H. bulbosum) [12]. All these R genes have in common that they are major, race-specific genes, and therefore, prone to be easily overcome by the pathogen within a few years and not considered durable [12].
One major race-specific resistance locus is the gene cluster Mla on chromosome 1H [7]. The Mla locus shows suppressed recombination but high rates of polymorphism that are based on point mutations and indels [6,13,14]. This gene has over 30 described specificities [15,16,17,18] and was mapped to the telomeric end of chromosome 1HS [6]. Wei et al. [6] showed that the Mla specificities Mla6, Mla13, Mla14 and Ml-Ru3 co-segregate and narrowed the interval down to a 240 kb region. They identified eight coiled-coil nucleotide-binding-site leucine-rich-repeats (CC-NBS-LRR) resistance gene homologues located in the Mla region that cluster into three families (RGH1, RGH2, RGH3) [6,19]. Six Mla specificities have been cloned, Mla1, Mla6, Mla7, Mla10, Mla12 and Mla13 and it was shown that some Mla specificities require additional genes in order to express full resistance, such as Rar1 (required for Mla-specified resistance 1) [20,21,22,23,24].
The big exception to race-specific genes is the Mildew resistance locus o (Mlo) [25]. It was first described by Freisleben and Lein [26], who X-rayed the barley cultivar ‘Haisa’ and identified three genotypes that were completely resistant against three Bgh isolates. After that, many more mutants were induced in various genetic backgrounds [27] and to date more than 40 mlo alleles are known [28]. Additionally, in the 1970s it was confirmed that the mutation can also occur spontaneously, after it was found in Ethiopian landrace collections from the 1930s [27]. Through a loss-of-function mutation, mlo plants inherit resistance against a wide range of PM isolates by formation of cell wall appositions that prevent the fungus from penetrating the epidermal cell walls [25]. However, in order to function mlo requires two genes, Ror1 and Ror2, required for mlo-specified resistance [29]. The mlo gene is recessively inherited and located in the middle of the long arm of chromosome 4H [25,27]. The coded protein is a seven transmembrane protein with an extracellular N-terminal segment and an intracellular C-terminal domain, has a highly conserved gene structure and shows a monophyletic origin that is restricted to the plant kingdom [30,31]. Since its discovery, mlo has been widely used in resistance breeding against PM and still shows durability in the field [32]. Despite its success story, mlo has several drawbacks. It shows a pleiotropic effect, i.e., necrotic leaf lesions occur spontaneously, which lead to a decrease in kernel size and yield due to reduced photosynthesis [32]. However, the biggest drawback is the trade-off between PM resistance and resistance towards non-biotrophic pathogens. Barley plants carrying mlo resistance show enhanced susceptibility towards diseases like the rice blast pathogen Magnaporthe grisea [33], spot blotch disease caused by Bipolaris sorokiniana [34] and Ramularia leaf spot caused by Ramularia collo-cygni [35]. Especially, Ramularia leaf spot epidemics have increased in the past decades in all major barley growing regions and the disease has become a major threat for barley production [36]. This emphasizes the need for the continuous search for novel sources of resistance from diverse barley germplasm, as well as, the need to pyramid resistance genes against different diseases into adapted and semi-adapted genetic backgrounds.
One powerful method to detect QTL (quantitative trait locus/loci) associated with traits of interest is genome-wide association studies (GWAS) [37]. An advantage of GWAS is that unrelated populations can be analysed, thereby increasing the number of recombination events and allelic diversity that can be exploited and at the same time increasing the mapping resolution [38]. In contrast, in QTL mapping, bi-parental populations are prerequisite limiting the number of analysed alleles to two per locus [39]. Nevertheless, this also comes with the disadvantage that unrelated or uncontrolled populations often have more complex population structures that will hamper true allelic effects [40]. Additionally, markers with minor allele frequency (MAF) < 1% and low frequency 1%  ≤  MAF  <  5% are excluded from the analysis, in order to account for possible false positive associations, resulting in low power for detecting rare alleles [40].
Multi-parent advanced generation inter-cross (MAGIC) populations for GWAS can be considered the golden mean between unrelated and bi-parental populations, as they combine the advantages of both [41,42]. MAGIC populations typically consist of 4, 8 or 16 founders (parents), which are inter-crossed in funnels for several generations, followed by inter-crossing of individuals from different funnels and subsequently development recombinant inbred line (RIL) or doubled haploid (DH) production [41,42]. Since MAGIC populations are derived from only a few founders allele frequencies are much higher than in unrelated populations, thus, increasing the chance of detecting rare alleles [42]. By inter-crossing all founders with each other, genetic recombination and variation as well as the number of polymorphisms is increased, while linkage disequilibrium (LD) decay is decreased, allowing for higher mapping precision and resolution compared to bi-parental populations. Additionally, inter-crossing can yield individuals with novel allele combinations that are not present in the parent lines [41]. If the founders are carefully chosen, the phenotypic and genotypic diversity can be increased for the traits of interest compared to bi-parental populations [41]. Moreover, pyramiding of genes for traits of interest can be done while developing MAGIC populations without the need for backcrossing [42]. If the selected founders consist of adapted material, the produced RILs can be used as breeding lines or released directly as cultivars [41,42]. Finally, RILs can be used to develop near isogenic lines (NILs) which can further be used for fine mapping [42]. Several examples of QTL detection using MAGICs have been reported in recent years spanning over a variety of plant species including crops such as cotton [43], sorghum [44], Brassica juncea [45], rice [46,47,48,49], wheat [50,51,52,53], maize [54], and barley [55].
The most commonly used GWAS model, for both quantitative and qualitative traits, is the single-locus model. However, the single-locus model disregards the presence of multiple QTL, which may lead to less statistical power, biased effect estimates and increased Type I and Type II errors [56]. Consequently, a number of multi-locus models have been suggested that may increase the power in QTL detection [56].
Considering the advantages of MAGICs, four Nordic spring barley MAGIC populations have been developed, pyramiding resistance towards diseases such as leaf scald (LS), net type net blotch (NTNB), fusarium head blight (FHB), leaf rust (LR), and PM. These MAGIC populations were evaluated for PM resistance under field conditions, at two locations in Denmark, in 2017 and 2018. Eight founders were used for each of the four populations, selected based on previous knowledge of their disease resistance and yield performance. The founders included in this study consist of breeding lines, cultivars and landraces. Landraces harbor valuable sources for tolerance and resistance to both biotic and abiotic stress. For instance, earlier screenings of landraces have led to the detection of novel sources of resistance to PM [9,57,58,59,60,61].
Here we report of three putatively new QTL located on chromosomes 1HL, 4HS and 5HS and allele combinations associated with PM resistance in Nordic spring barley, detected using a multi-locus genome-wide association approach in GAPIT (Genome Association and Prediction Integrated Tool). Data for PM resistance of 474 Doubled haploid (DH) lines, i.e., MAGIC progenies was collected from three environments in Denmark.

2. Materials and Methods

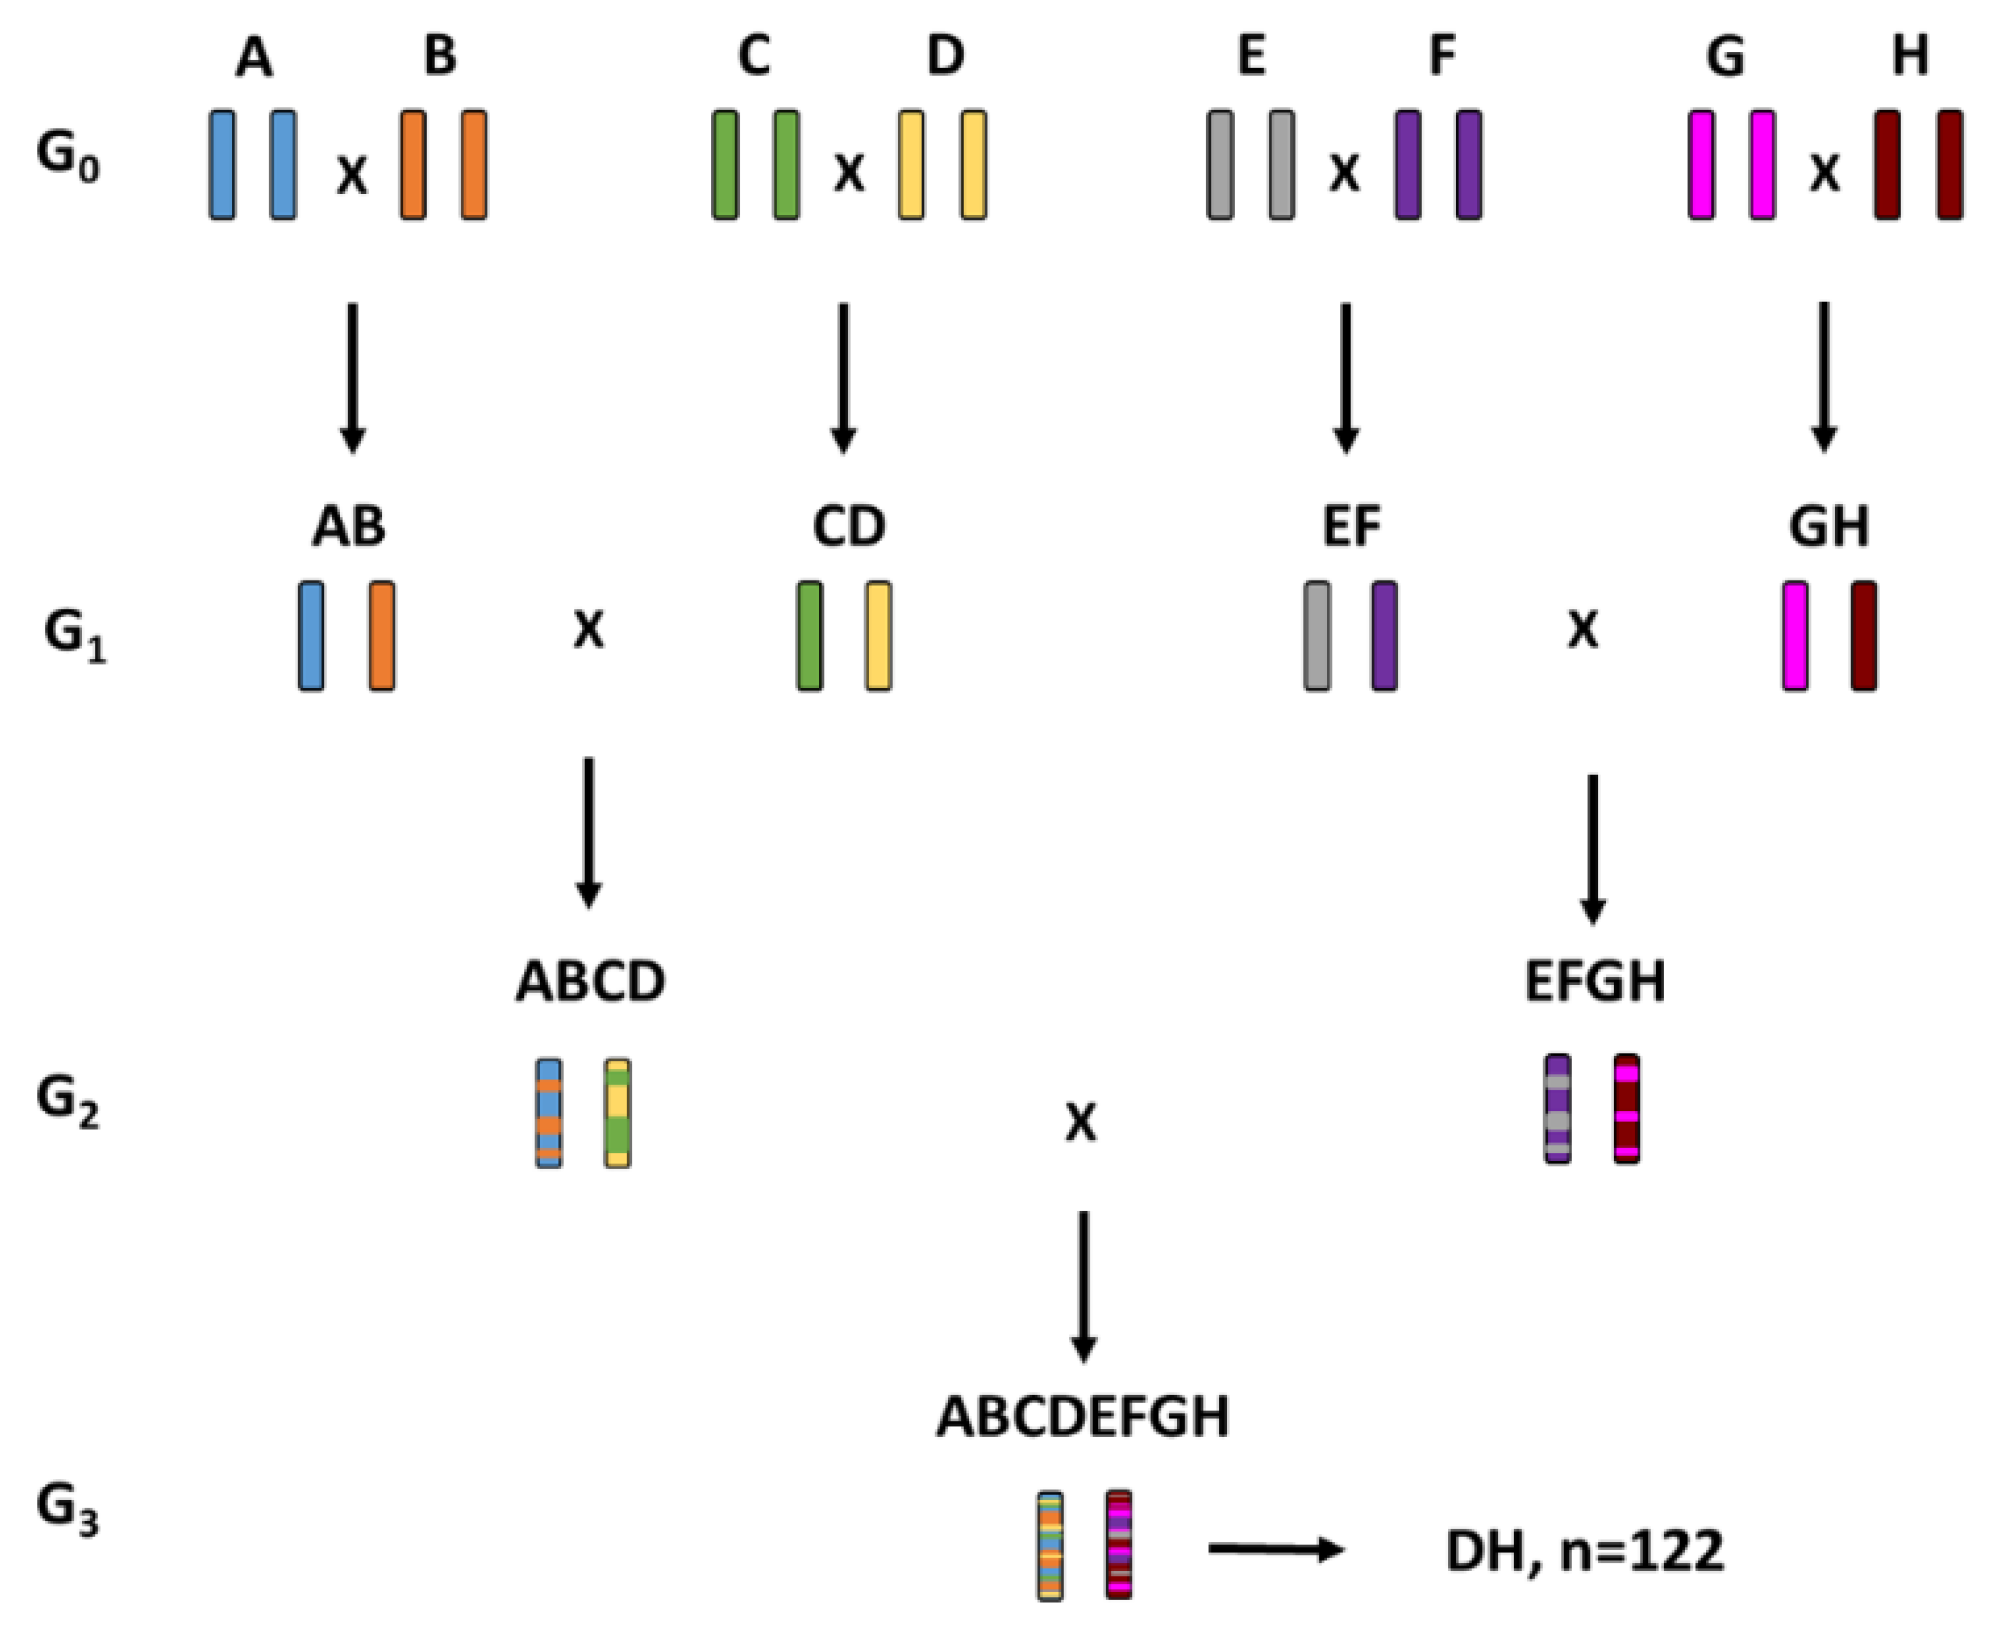
2.1. Multi-Parent Advanced Generation Inter-Cross (MAGIC) Populations

A barley panel of 490 genotypes, consisting of progenies and founders from four multi-parent populations, was investigated in this study. The founders consisted of cultivars (9), breeding lines (4) and landraces (4) (Table 1) with desirable traits for diseases such as scald, leaf rust, Fusarium and spot form of net blotch and PM [62]. One goal was to pyramid resistances into adapted background. Therefore, cultivars such as RGT Planet and SJ 11198 were included as founders. These lines have the mlo-11 allele, as well as other desirable agronomic traits such as yield and adaptation. The MAGIC populations were developed, using half diallel mating of eight founders (Figure 1). Doubled Haploid (DH) lines were developed from the G3 progenies at Sejet Plant Breeding, Boreal Ltd. and Nordic Seed. MAGIC 1 yielded n = 122 progenies, MAGIC 2 n = 29, MAGIC 3 n = 81 and MAGIC 4 yielded n = 303 progenies (Table 2). Since only a low number of progenies could be developed for MAGIC 2 and seven of eight founders were the same for MAGIC 1 and MAGIC 2, these two populations were treated as one in all subsequent analyses. All analyses were performed for each population separately, i.e., MAGIC 1 + 2, MAGIC 3 and MAGIC 4, and across populations.

2.2. Field Trials and Phenotypic Evaluation

Field trials were conducted at two locations in Denmark, Dyngby (2017, 2018) and Horsens (2018) (Table 3). They were set up in an α lattice design with one and two replications in Horsens and Dyngby, respectively. Since PM is ubiquitous, trials rely on natural inoculation. The disease assessment was conducted when pressure on susceptible founder lines like ‘Fairytale’ was optimal. Disease severity was observed at two time-points at each location, except in Dyngby 2018, where only one observation was performed due to serious drought and consequently low disease severity.
Powdery mildew severity was assessed using a rating scale from 1–9, where 1 represents no infection and 9 high susceptibility.

2.3. Statistical Analysis

Descriptive statistics were calculated for each population for all observations separately and combined, using the psych software package v. 1.8.12 [63] in R [64]. The frequency distribution was calculated in R for each population using the mean values of each line across environments. The pairwise Spearman Rank correlations were calculated in R using mean values from replicates of each line, observation time, field location, and year, respectively.
Analysis of variance (ANOVA model III, with Satterthwaite’s method) were performed using the lmer function in the lme4 R package [65], to estimate the relative contributions of genotype, environment, and genotype by environment interactions. The model assumed the genotype, environment, and genotype by environment effect to be fixed, and the observations nested within the environments to be random.
The best linear unbiased predictors (BLUPs) for PM were calculated across the three environments for each population, using the lme function in the nlme R package [66], assuming all effects to be random. Phenotypic data across the three environments were estimated as
yijk = µ + gi + enj + r(j)k + eijk
where yijk is the kth observation of the ith genotype in the jth environment, μ is the common intercept, gi is the random effect of the ith genotype, enj is the effect of the jth environment, r(j)k is the effect of the kth observation in environment j, and eijk is the corresponding error. The BLUPs for each population and across populations were then used as phenotype values for the association mapping.
The broad sense heritability (H2) was estimated as:
H 2   =   V G V G   +   V G E e +   V R e o
where VG is genotypic variance component, VGE is variance component of genotype x environment, VR is residual variance component, and e and o are the numbers of environments and observations, respectively.

2.4. Genotyping and SNP Filtering

The barley panel was genotyped with the SNP&SEQ Technology Platform, Uppsala (www.genotyping.se) using the 50K Illumina Infinium iSelect genotyping array for barley with 44 040 working SNP assays [67]. Leaf samples from seedlings were freeze-dried and homogenized prior to DNA extractions, using a QIAcube HT extraction and the QIAamp 96 DNA QIAcube HT Kit (Qiagen, Hilden, Germany), as previously described in Åhman and Bengtsson [68].
Prior to subsequent analyses, all heterozygote calls were set to missing, the SNPs were filtered for call rate (≥95%) and monomorphic and unmapped markers were removed. This resulted in 27 407 SNPs for MAGIC 1 + 2, 24 093 SNPs for MAGIC 3 and 24 997 SNPs for MAGIC 4 and 31 667 SNPs for the whole panel for analyses. For GWAS the SNPs were further filtered for MAF ≤ 0.05, resulting in 25 068 polymorphic SNPs for MAGIC 1 + 2, 18 103 SNPs for MAGIC 3, 19 072 SNPs for MAGIC 4 and 24 638 polymorphic SNPs for the whole panel to be used in the association mapping. The physical positions based on the barley reference genome [67,69] were retrieved using the online tool BARLEYMAP (http://floresta.eead.csic.es/barleymap/) [70].

2.5. Population Structure and LINKAGE Disequilibrium

Population structure was determined based on a Bayesian clustering approach using STRUCTURE v. 2.3.4 [71]. STRUCTURE was run ten times for each hypothetical number of sub-groups (K), between one and ten. The ploidy level was set to 2 and the Markov Chain Monte Carlo (MCMC) was set to 5000 burn-in phases and 10 000 NUMREPS. The most likely number of sub-groups (K) were determined based on the Delta K method [72] using Structure Harvester v0.6.94 [73]. STRUCTURE analysis was performed for each population individually and for the whole panel.
Principal component analysis (PCA) was performed using the build-in function prcomp in R v 4.0.2 and plotted with the package ggfortify.
Linkage disequilibrium (LD) was estimated using the function LD.decay from the package sommer v 2.9 in R v 4.0.2 [74] by calculating the squared allele frequency correlation r2 between marker pairs. Markers with a minor allele frequency (MAF) below 0.05 were excluded. The intra-chromosomal LD decay was calculated by plotting r2 values against the physical distance with a second-degree smoothed loess curve fitted using the build-in R function loess with span set to 0.1. The 95th percentile of the LD distribution between unlinked markers was calculated and considered as threshold when estimating LD decay [55]. LD decay was estimated for each chromosome per population, genome-wide per population and genome-wide for the whole panel.

2.6. Association Mapping

GWAS were performed using four models: general linear model (GLM), mixed linear model (MLM) [75], multiple loci mixed linear model (MLMM) [76] and fixed and random model circulating probability unification (FarmCPU) [77] using GAPIT [78]. To find the best model–covariate combination to account for population structure, the kinship matrix (K) calculated in GAPIT with the Van Raden method [79], the ancestry coefficient data (Q matrix) obtained from STRUCTURE and the principal component analysis (PCA) covariates from GAPIT, were incorporated into the models. The different models were compared, where possible, based on (i) the least deviation from the expected p-values, (ii) highest number of groups, (iii) high −2 log likelihood value (–2LL) and (iv) lowest variance error. Manhattan plots were generated with the R package CMPlot.
The Bonferroni threshold for significant associations was calculated based on the number of effective markers (MAGIC 1 + 2 n = 4226, MAGIC 3 n = 1618, MAGIC 4 n = 1999, MAGIC 1 to 4 n = 4923) with α = 0.05 [80].

2.7. Candidate Gene Indentification and Haplotype Formation

Candidate genes, their locations and annotations were retrieved from the BARLEYMAP website [70] (http://floresta.eead.csic.es/barleymap/). The gene search around the peak markers was increased according to the LD decay of the respective chromosome.
Haplotypes were constructed for each population based on the respective significant markers.

3. Results

3.1. Panel Evaluation

All data concerning analysis of phenotypic data are found in Figure S1 and Table S1. Phenotypic results showed a wide range of variability for mildew severity in all four panels. The frequency distribution for MAGIC 1 + 2 was right skewed with a mean infection severity of 3.11 and over 70 lines showing infection scores between 1 and 3. MAGIC 3 showed an almost normal distribution with a mean infection severity of 4.03. Frequency distribution for MAGIC 4 was slightly right skewed with a mean infection severity of 4.04 and about 50 lines showing infection scores <3. The frequency distribution across all environments and panels (MAGIC 1 to 4) was slightly right skewed with a mean infection severity of 3.80. The broad sense heritability was very high for all populations as well as for the combined panel (MAGIC 1 to 4) and ranged from H2 = 0.96 to H2 = 0.98 (Figure S1). Significant correlations (p ≤ 0.05) were found between all observations per panel. The observations Horsens_18_1 and Horsens_18_2 showed the lowest correlation in all panels (rs ≈ 0.2). Furthermore, Horsens_18_1 showed generally low correlation with Dyngby_17_1 and Dungby_17_2 in all panels. All other observation combinations showed moderate to high correlations (0.4 and above) (Figure S1).
Analysis of variance (ANOVA) revealed that in all populations the genotype had a significant effect (p < 0.0001), whereas no significance was observed for the environment or the genotype by environment interaction (Table S1).

3.2. Population Structure and Linkage Disequilibrium

STRUCTURE analysis identified an optimal k value of 2 for each population tested (Figure S2). In the case of MAGIC 1 + 2, MAGIC 3 and MAGIC 4 the identification of two sub-populations can be ascribed to the fact that the STRUCTURE software assumes at least two sub-populations. For MAGIC 1 + 2 n = 24 individuals grouped to K1 and n = 100 to K2, with n = 10 individuals showing admixed ancestry (<0.75). For MAGIC 3 n = 16 individuals grouped to K1, n = 31 to K2 and n = 36 were admixed. K2 included all founders of MAGIC 3. For MAGIC 4 n = 120 individuals grouped to K1, n = 100 and n = 59 were admixed. All founders of MAGIC 4 showed admixed ancestry. In the combined panel (MAGIC 1 to 4) STRUCTURE analysis revealed as well an optimal k = 2 (Figure 2c). One hundred and fifty-four (154) individuals grouped to K1, n = 265 grouped to K2 and n = 71 showed admixed ancestry. Of the 265 individuals belonging to sub-population K2, 257 were lines from MAGIC 4. The remaining eight lines were from MAGIC 1 and the founder ‘Fairytale’. Principle component analysis (PCA) showed all individual populations are unstructured and do not cluster according to row-type. The first two components explained 17.96%, 14.84% and 13.46% of the phenotypic variation for MAGIC 1 + 2, MAGIC 3 and MAGIC 4, respectively. (Figure S2). PCA for the complete panel (MAGIC 1 to 4) showed most lines belonging to MAGIC 4, seven lines belonging to MAGIC 1 and one parent forming one cluster and all other lines forming another (Figure 2a), thereby, confirming STRUCTURE analysis results. Nonetheless, it is a weak population structure, where the first two components explain 13.06%.
LD decay in MAGIC 1 + 2 varied from 7 Mbp (3H) to 19 Mbp (7H) per chromosome and was estimated at 14 Mbp across chromosomes (Table 4, Figure S3). Genome-wide LD decay for MAGIC 3 dropped at 38 Mbp and varied from 31 Mbp (5H) to 140 Mbp (6H) per chromosome (Table 4, Figure S3). MAGIC 4 showed a genome-wide LD decay of 33 Mbp and chromosome-wide LD decays of 28 Mbp (3H) to 497 Mbp (7H) (Table 4, Figure S3). The genome-wide LD decay across all populations was estimated at 19 Mbp (Figure 2b). The LD decay per chromosome varied from 15 Mbp (3H) to 32 Mbp (7H) (Table 4, Figure S3).

3.3. Model Selection

Based on the Bayesian information criterion (BIC) and maximum log likelihood values, implemented in the model selection option in GAPIT, no principal component was included in the GWAS. Based on the model selection criteria, the best model for MAGIC 1 + 2, MAGIC 3 and MAGIC 4 was FarmCPU including only the kinship (K) (Figure 3, Figure S4). The best model for the combined panel was MLMM + K.

3.4. Marker Trait Associations (MTAs)

The output from the GWAS based on the optimal model for each population can be found in Table S2, the corresponding Manhattan plots are shown in Figure 3.
A total of 20 MTAs were detected, corresponding to 11 distinct loci, located on chromosomes 1H, 2H, 3H, 4H, 5H and 7H (Table 5, Figure 3). The first QTL, Qrbg_1H_1, is located on chromosomes 1H between 6.9 and 10.2 Mbp and was detected in all populations. LOD values ranged from 7.9 (JHI_Hv50k_2016_14683) to 15.8 (SCRI_RS_148733) (Table 5). Close to the first QTL a second QTL, Qrbg_1H_2 was detected, located at 18.4 Mbp. This MTA was significant in MAGIC 1 to 4 (Table 5). The third QTL on chromosome 1H, designated Qrbg_1H_3, is located at 492 Mbp and was detected for MAGIC 4 only, with a LOD value of 6.5. Qrbg_2H_1 was detected in MAGIC 3 and MAGIC 4 and the peak markers are located on chromosome 2H at 52.0 and 122 Mbp (Table 5). The second region on chromosome 2H, Qrbg_2H_2, is located at 754 to 765 Mbp and was detected in MAGIC 3, MAGIC 4 and MAGIC 1 to 4, their LOD values ranged from 5.9 to 10.5 (Table 5). Qrbg_3H_1 and Qrbg_4H_1 were identified in MAGIC 1 + 2 and MAGIC 3, respectively, and are located on chromosome 3H at 21 Mbp and on chromosome 4H at 12.2 Mbp. Qrbg_4H_2 was identified for MAGIC 1 + 2 and MAGIC 1 to 4 and is located on the long arm of chromosome 4H at 621 to 623 Mbp. The peak marker JHI_Hv50k_2016_265870 was significant in both populations and had LOD values of 32.2 and 26.5 (Figure 3, Table 5). On chromosome 5H two QTL were identified (Table 5). The first designated Qrbg_5H_1 is located at 396 kbp and was significant in MAGIC 1 + 2. The second QTL, Qrbg_5H_1, was identified in MAGIC 3 and is located at 272 Mbp. The last region, Qrbg_7H_1, is located on chromosome 7H and was significant in MAGIC 4 and MAGIC 1 to 4 (Table 5). The peak markers JHI_Hv50k_2016_444783 and JHI_Hv50k_2016_449746 are located at 9.4 (LOD 21.5) and 14.7 Mbp (LOD 25.9), respectively.
The p-value for the significance threshold for MAGIC 1 + 2, MAGIC 3, MAGIC 4 and MAGIC 1 to 4 resulted in logarithm of odds (LOD) values of 4.93, 4.51, 4.6 and 4.99, respectively.
MAGIC 3 showed the highest mean MAF with 0.29 (Table S2). MAGIC 1 + 2 and MAGIC 4 had mean MAF of 0.26 and 0.27, respectively. In the combined panel (MAGIC 1 to 4), the mean MAF was lowest with 0.25.

3.5. Candidate Genes for the Identified QTL

The number of annotated genes located in the 11 QTL associated with PM resistance varied between 119 (Qrbg_5H_1) and 883 (Qrbg_7H_1) (Table S3). All regions contained genes that are directly involved in plant defense. In all regions, at least one leucine-rich repeat (LRR) is located and in all regions, except Qrbg_5H_2, at least one disease resistance protein is located. In many regions, peroxidases, pectinases, chitinases, cellulose and callose synthases are found (Table S3). The peak markers of Qrbg_4H_2 are located close to the MLO protein.

3.6. Allele Combinations

In order to find lines with favourable allele combinations, haplotypes were formed based on the significant markers for each population. Table 5 shows, which founder contributed the positive allele for each QTL and how many lines carry this allele. Haplotype formation for MAGIC 1 + 2 revealed 14 different haplotypes (Table S4). Five lines had all four positive alleles (TGAT) and significantly reduced BLUP values. However, all lines (n = 46) having the positive allele for Qrbg_4H_2 showed significantly reduced BLUP values between −1.4 and −1.6 (Table S4). This allele is inherited from founders ‘RGT Planet’ and ‘SJ 111998’ (Table 5). Significant SNPs for MAGIC 3 combined into 21 haplotypes. No lines had all five positive alleles (Table S4). Eleven lines, including the founders ‘Fairytale’, ‘Iron’ and ‘RGT Planet’ combined four positive alleles and had significantly reduced BLUP values ranging between −1.6 and −2.2 (Table S4). The positive allele of Qrbg_5H_2 seemed to have the largest influence on disease reduction. This allele was inherited from founders ‘Brage’, ‘Fairytale’, ‘Iron’ and ‘RGT Planet’ (Table 5).
Five lines including the founder ‘Nordic’ showed all negative alleles (CCCTA) and had significantly increased BLUPs (Table S4). Haplotype formation for MAGIC 4 revealed 22 different haplotypes (Table S4). Five lines combined all five positive alleles (ATGAC) and showed reduced BLUPs of –1.7 (Table S4). Especially lines (n = 32) with the positive allele from Qrbg_7H_1 showed high resistance (Table 5, Table S4). This allele comes from founder ‘Gaffelbyg’, who despite having only one positive allele (GCACC) has a BLUP of –1.6 (Table S4). Two and six lines have four and three positive alleles and show the lowest mean BLUPs with –2.2 and –2.0, respectively (Table S4). Thirty lines combined all five negative alleles (GCACT) and had significantly increased BLUP values (Table S4). However, lines (n = 208), including the founders ‘Krasnodarskij 35’ and ‘Nordic’, that combined the negative alleles of Qrbg_2H_2 and Qrbg_7H_1 all showed increased BLUPs (Table S4).

4. Discussion

MAGIC populations offer the advantages of higher allele frequencies and lower LD decay as compared to bi-parental populations and unstructured populations in contrast to diversity panels [41,42]. In the present study four barley MAGIC populations, were investigated for PM resistance at two locations in Denmark, Dyngby (2017, 2018) and Horsens (2018). The absence of population structure allowed the combining of the four MAGIC populations in the subsequent analysis, in order to increase the population size and therefore the power for detecting QTL for resistance towards PM. The initial goal was to produce at least n = 200 DH lines per MAGIC population. Unfortunately, this was not possible for MAGICs 1, 2 and 3. Successful DH line production is very dependent on the genotype [81]. Hence, in order to avoid the risk of producing low numbers of MAGIC progenies, recombinant inbred lines (RILs) should preferably be produced by the single-seed descent method. Population size is an important factor when it comes to the power to detect QTL, which in return is linked to the frequency of an allele [42]. In bi-parental populations, allele frequencies for segregating QTL are 0.5 and power to detect a QTL is maximized. In diversity panels, rare alleles occur at lower frequencies, which decreases the power to detect these alleles significantly [42]. Generally, in MAGIC populations the number of SNPs with low MAF should be very low and in populations consisting of eight founders, any allele would ideally be present at 12.5% [42]. Founder lines of MAGIC 3 are all cultivars, hence, the higher MAF compared to the other MAGIC populations was expected, since cultivars are generally genetically more similar to each other compared to landraces. Of the 24,093 informative SNPs for MAGIC 3, 27.85% had MAF lower than 0.125 and 24.86% had MAF lower than 0.05. The higher diversity of the founders of MAGIC 1 + 2 is reflected in a lower mean MAF compared to MAGIC 3 and MAGIC 4. In the combined panel (MAGIC 1 to 4), the lowest MAF was observed, which was to be expected, since this panel is the most diverse compared to the separate populations. Ongom and Ejeta (2018) reported a mean MAF of 0.15 in a sorghum MAGIC population. However, this population consists of 19 founders, which explains the lower mean MAF. Nonetheless, the majority of the SNPs in the present study had high MAF and were therefore suitable for GWAS.
LD decay can be a measure of a population’s genetic diversity, i.e., the lower the LD decay, the higher the diversity [82]. MAGIC 1 + 2 had the lowest LD decay per chromosome and genome-wide. Six out of the nine founders of MAGIC 1 + 2 are landraces and breeding lines, which presumable are more diverse than cultivars [83] and resulted in low LD decays compared to the other populations. In contrast, the founders of MAGIC 3 are all cultivars, mainly from Europe, and this population showed the highest LD decays. LD decay of MAGIC 4 ranged between those of MAGIC 1 + 2 and MAGIC 3. The founders of MAGIC 4 consist of one landrace, one breeding line and four cultivars, with the line ‘Fairytale’ having served as a founder three times in the crossing scheme. This could have led to a decreased diversity and an increased LD decay. LD is broken down by recombination [84]. Combining the four MAGIC populations results in a set with an increased number of recombination events, which consequently decreases LD decay. Unfortunately, based on the currently available data it is not possible to compare LD decay with other barley MAGIC populations, since the previously published papers on barley MAGICs were calculated on genetic maps [55].
Several barley resistance genes distributed across all seven chromosomes against PM have been described [12]. The most famous resistance gene against PM is mlo. This recessively inherited gene is located distally on the long arm of chromosome 4H [85] and confers complete and broad spectrum resistance against a wide range of Bgh isolates [27]. This region was also identified in the present study (Qrbg_4H_2). Two founders, ‘RGT Planet’ and ‘SJ 111998’, carry the mlo11 allele and this region was significantly associated with PM resistance in GWAS with MAGIC 1 + 2 and MAGIC 1 to 4. Qrbg_4H_2 is located between 621 and 623 Mbp and the MLO protein (HORVU4Hr1G082710) is located between the peak markers. Moreover, haplotypes carrying the positive allele had significantly reduced BLUP values, emphasizing the major effect of mlo. Even though ‘RGT Planet’ is also a founder of MAGIC 3, we did not detect Qrbg_4H_2 in this population. This could be due to the small population size of MAGIC 3 and the fact that the peak marker JHI_Hv50k_2016_265870 detected in MAGIC 1 + 2 and MAGIC 1 to 4 had a MAF < 0.05.
The resistance gene cluster Mla located on chromosome 1H is another major resistance locus against PM [6]. This gene has been detected in many other studies [86,87,88,89,90,91,92] and was also detected in the present study. The region Qrbg_1H_1 was significant in all populations and is located on chromosome 1HS between 6.9 and 10.2 Mbp. Several LRR and disease resistance proteins are located in this region, as well as one coiled-coil NBS-LRR (HORVU1Hr1G003700) between the two significant markers JHI-Hv50k-2016-7757 (6 976 974 bp) and BOPA2_12_30918 (8 935 905 bp). Only 8 Mbp away from another region Qrbg_1H_2 at 18.3 Mbp was detected. The significant marker JHI_Hv50k_2016_14683 is not in linkage with the markers from region Qrbg_1H_1 and, therefore, represents a distinct QTL. We hypothesize this region to correspond to the resistance locus Mlk, which was reported to be located about 7.7 cM from Mla [16]. A third QTL, Qrbg_1H_3, was identified on chromosome 1H at 492 Mbp. Based on the available data, no corresponding QTL has to our knowledge been described located in this region, hence, this region can be considered as a putatively novel resistance QTL. Qrbg_1H_3 was only detected in GWAS for MAGIC 4. Nonetheless, several peroxidases, callose and cellulose synthases, chitinases, as well as LRRs and disease resistance proteins are located close to the peak marker. All these proteins are known to be involved in plant defense [93,94,95,96,97], hence, supporting the region to be a true resistance QTL.
On chromosome 2H two SNPs (Qrbg_2H_1) that were significant for GWAS in MAGIC 3 and MAGIC 4, were identified located at 52 and 122 Mbp. Haplotype analysis showed that the SNPs alone had only a minor effect on disease reduction and the positive allele for Qrbg_2H_1 was easily masked when negative alleles were present for the other QTL (Table S4). Nonetheless, close to the peak marker JHI-Hv50k-2016-87627 disease resistance proteins and WRKY transcription factors are located [95]. Several studies have identified QTL for resistance on the short arm of chromosome 2H. Von Korff et al. [91] identified three QTL on chromosome 2H for PM resistance located between 17 and 146 cM, named lang1031Qrbg.S42-2H.a, Qrbg.S42-2H.b, Qrbg.S42-2H.c. Shtaya et al. [98] detected a QTL at 100.5 cM designated Rbgq1 and Aghnoum et al. [90] detected two QTL, Rbgq7 and Rbgq8, located around 25–40 cM and 50–70 cM, respectively. Schweizer and Stein [99] identified several meta-quantitative trait loci between 0 and 80 cM on chromosome 2HS. Based on the available data it is not possible to say, if these regions and the one identified in the current study correspond to the same QTL, however it is very likely. The second QTL detected on chromosome 2HL is located between 754 to 765 Mbp and was detected in GWAS with MAGIC 3, MAGIC 4 and MAGIC 1 to 4. This region corresponds to the resistance QTL MlLa [8,100] and was introgressed from Hordeum laevigatum [101]. This gene is known to confer intermediate resistance towards PM and was detected in many studies [8,86,90,91,99]. Hoseinzadeh et al. [102] identified and fine-mapped a resistance QTL derived from the Ethiopian landrace ‘HOR2573’. This QTL mapped to the resistance gene MlLa and was, therefore, designated MlLa-H. They were able to map the QTL to an 850 kb interval between 762.8 and 763.7 Mbp and identify four leucine-rich repeats as candidate genes [102]. The four candidate genes, HORVU2Hr1G126250, HORVU2Hr1G126380, HORVU2Hr1G126440 and HORVU2Hr1G126510, are located between the two peak markers JHI-Hv50k-2016-142889 (757 Mbp) and JHI-Hv50k-2016-147232 (765 Mbp) in the present study.
Qrbg_3H_1 was detected in MAGIC 1 + 2 located on chromosome 3HS at 21 Mbp. In the proximity of the peak marker BOPA2_12_30192 there is a LRR protein (HORVU3Hr1G010070) and two disease resistance proteins (HORVU3Hr1G010310, HORVU3Hr1G010990). Aghnoum et al. [90] detected a QTL, Rbgq10, for PM resistance on chromosome 3H at 11.8 cM that could coincide with the region identified in the present study, further investigation has to be conducted to verify this.
Two putatively new resistance QTL were detected on chromosomes 4HS (Qrbg_4H_1) and 5HS (Qrbg_5H_1), respectively. The QTL on chromosome 4HS was identified in MAGIC 3 and the peak marker JHI-Hv50k-2016-230367 is located at 12.2 Mbp. Several LRRs are located in proximity to the peak marker (Table S3). Resistance genes on chromosome 4H against PM have been described only on the long arm of this chromosome and correspond to the resistance genes mlo and Mlg [10,25,85,99,103]. To our knowledge, no resistance locus located on the short arm of chromosome 4H has been reported. Similarly, the locus Qrbg_5H_1 identified on chromosome 5HS at 396 kb does not correspond to any previously reported loci on this chromosome [99]. Three disease resistance proteins (HORVU5Hr1G001030, HORVU5Hr1G001060, HORVU5Hr1G001080) are located about 3 Mbp away from the peak marker, and two serine threonine-protein kinases (HORVU5Hr1G000140, HORVU5Hr1G000240) are located within 600 kb from the peak marker (Table S3). Serine threonine-protein kinases have been shown to be involved in plant signaling pathways and in plant defense [104].
Qrbg_5H_2 was identified in GWAS for MAGIC 1 + 2 and is located on chromosome 5H at 272 Mbp. Only one LRR (HORVU5Hr1G037990) is located in proximity to the peak marker, however, other studies have reported resistance QTL for PM in this region before [90,91] and this locus most likely coincides with the semi-dominant resistance gene Mlj, derived from H. vulgare ssp. spontaneum, first reported by Schönfeld et al. [11]. The same study reported another QTL on chromosome 7HS, also derived from H. vulgare. ssp. spontaneum, designated mlt [11]. The mlt gene is recessively inherited and confers major race-specific resistance towards PM [11,105]. In a study with a cross between the PM resistant Spanish landrace ‘SBCC97’ and the susceptible cultivar ‘Plaisaint’ a resistance QTL corresponding to mlt was detected [58]. In subsequent studies the gene was fine-mapped [106,107]. In the latter study, the authors mapped the locus to a 4 Mbp interval between 9 and 13 Mbp. Amongst others, they identified disease resistance proteins, LRR, and NBS-LRR as putative candidate genes [107]. This QTL coincides with the locus Qrbg_7H_1 (9.4–14.7 Mbp) detected in the present study. Four NBS-LRR and one disease resistance protein are located less than 400 kb away from the peak marker JHI-Hv50k-2016-444783.
Fifteen lines of MAGIC 1 + 2 showed haplotypes that were not found in the founders and had mean BLUPs lower than the best founders. Five lines even have the positive alleles (TGAT) for all four QTL detected in this population. All fifteen lines carry the positive allele for mlo, which might have overshadowed the effect of the other QTL. However, the lines carrying all positive alleles show that pyramiding of resistance QTL is possible and these five lines carry the putatively new resistance QTL Qrbg_5H_1. In MAGIC 4, 16 lines had haplotypes not shared with any of the founders and were more resistant than the most resistant founder ‘Gaffelbyg’. Five lines carried all five positive alleles (ATGAC), however, the highest effect on resistance was conferred by QTL Qrbg_1H_1 (Mla) and Qrbg_7H_1 (mlt). Nonetheless, seven out of the 16 most resistant lines, carried the positive allele for the putatively new locus Qrbg_1H_2 in addition to Mla and mlt and could be used for further analysis and trait pyramiding. Generally, haplotype analysis showed that MAGIC populations are a good tool for breeding lines with new allele combinations that exceed the founders’ performances, as was proposed in Huang et al. [41].

5. Conclusions

In the present study, four barley MAGIC populations were screened for PM resistance under field conditions. Phenotypic analysis showed high variation between the lines and a significant effect of the genotype. Genetic analysis of the populations revealed no population structure and suitable LD decay combined with a high number of informative SNPs, showing high suitability for conducting GWAS. GWAS identified 11 QTL associated with PM resistance. Three out of the 11 QTL are putatively new resistance loci as strongly supported by the identified candidate genes. Additional haplotype analysis revealed lines with new allele combinations and high resistance levels compared to the founders.
Further studies on lines carrying the positive alleles for these putatively new loci with different isolates have to be conducted to test the nature of these putatively new resistance loci and to determine whether they confer race or non-race specific resistance.

Supplementary Materials

The following are available online at https://www.mdpi.com/2073-4425/11/12/1512/s1, Figure S1: Frequency distribution of phenotypic results and correlation plots for all environments and populations. Figure S2: Principle component analysis and STRUCTURE output for each individual populations. Figure S3: LD decay plots for each individual MAGIC population per chromosome and across chromosomes and for the combined panel (MAGIC 1 to 4) for each chromosome. Figure S4: Manhattan and QQ-plots for each individual MAGIC population and the combined panel (MAGIC 1 to 4) for different models and covariate combinations. Table S1: Descriptive statistics for all environments and populations and Analysis of variance (ANOVA) for all populations. Table S2: Results of genome-wide association studies (GWAS) for each individual population and the respective best model. Table S3: Predicted genes located in the identified QTL regions. Table S4: Haplotype analysis for each individual population based on the respective significant markers.

Author Contributions

Conceptualization, The PPP Barley Consortium; methodology, The PPP Barley Consortium; software, F.N. and T.B.; validation, L.K. and J.D.J.; formal analysis, F.N. and T.B.; resources, The PPP Barley Consortium; data curation, F.N. and T.B.; writing—original draft preparation, F.N. and T.B.; writing—review and editing, F.N., T.B., L.K., J.D.J., J.O., A.J. and The PPP Barley Consortium; visualization, F.N. and T.B.; project administration, A.J.; funding acquisition, The PPP Barley Consortium. All authors have read and agreed to the published version of the manuscript.

Funding

We thank NordGen and the Nordic Council of Ministers (NMR) for administration and financial support of this study that was conducted within a larger project, Public Private Partnership (PPP) for Pre-breeding in barley. This research was funded by NMR, grant number PPP_1802 and with in-kind from the private partners.

Acknowledgments

We thank NordGen and the Nordic Council of Ministers (NMR) for administration and financial support of this study that was conducted within a larger project, Public Private Partnership (PPP) for Pre-breeding in barley II. Genotyping was performed by the SNP&SEQ Technology Platform at Uppsala University in Uppsala (www.genotyping.se). This facility is part of the National Genomics Infrastructure supported by the Swedish Research Council for Infrastructures and Science for Life Laboratory, Sweden. The SNP&SEQ Technology Platform is also supported by the Knut and Alice Wallenberg Foundation. The PPP Barley Consortium: Inger Åhman, Department of Plant Breeding, Swedish University of Agricultural Sciences, P.O. Box 101, 230 53 Alnarp, Sweden, Therése Bengtsson, Department of Plant Breeding, Swedish University of Agricultural Sciences, P.O. Box 101, 230 53 Alnarp, Sweden, Fluturë Novakazi, Department of Plant Breeding, Swedish University of Agricultural Sciences, P.O. Box 101, 230 53 Alnarp, Sweden, Outi Manninen, Boreal Plant Breeding Ltd., Myllytie 10, 31600 Jokioinen, Finland, Merja Veteläinen, Boreal Plant Breeding Ltd., Myllytie 10, 31600 Jokioinen, Finland, Mika Isolahti, Boreal Plant Breeding Ltd., Myllytie 10, 31600 Jokioinen, Finland, Muath Alsheikh, Graminor A/S, Hommelstadvegen 60, 2322 Ridabu, Norway, Stein Bergersen, Graminor A/S, Hommelstadvegen 60, 2322 Ridabu, Norway, Constantin Jansen, Graminor A/S, Hommelstadvegen 60, 2322 Ridabu, Norway, Susanne Windju, Graminor A/S, Hommelstadvegen 60, 2322 Ridabu, Norway, Marja Jalli, Natural Resources Institute Finland (Luke), Tietotie 4, 31600 Jokioinen, Finland, Juho Hautsalo, Natural Resources Institute Finland (Luke), Survontie 9, 40500 Jyväskylä, Finland, Ahmed Jahoor, NordicSeed A/S, Kornmarken 1, 8464 Galten, Denmark (project leader), Jens Due Jensen, Nordic Seed A/S, Kornmarken 1, 8464Galten, Denmark, Jihad Orabi, Nordic Seed A/S, Kornmarken 1, 8464 Galten, Denmark, Nana Vagndorf Nordestgaard, Nordic Seed A/S, Kornmarken 1, 8464 Galten, Denmark, Lene Krusell, Sejet Plant Breeding, Nørremarksvej 67, 8700 Horsens, Denmark, Rasmus Lund Hjortshøj, Sejet Plant Breeding, Nørremarksvej 67, 8700 Horsens, Denmark, Charlotte Damgård Robertsen, Sejet Plant Breeding, Nørremarksvej 67, 8700 Horsens, Denmark, Magnus Göransson, The Agricultural University of Iceland, Faculty of Land and Animal Resources, Hvanneyri, 311 Borgarnes, Iceland.

Conflicts of Interest

The authors declare that the research was conducted in the absence of any commercial or financial relationships that could be construed as a potential conflict of interest.

References

  1. Langridge, P. Economic and Academic Importance of Barley. In The Barley Genome; Stein, N., Muehlbauer, G.J., Eds.; Springer International Publishing: Cham, Germany, 2018; pp. 1–10. ISBN 978-3-319-92528-8. [Google Scholar]
  2. Hilmarsson, H.S.; Göransson, M.; Lillemo, M.; Kristjánsdóttir, Þ.A.; Hermannsson, J.; Hallsson, J.H. An overview of barley breeding and variety trials in Iceland in 1987–2014. Icel. Agric. Sci. 2017, 30, 13–28. [Google Scholar] [CrossRef]
  3. Glawe, D.A. The powdery mildews: A review of the world’s most familiar (yet poorly known) plant pathogens. Annu. Rev. Phytopathol. 2008, 46, 27–51. [Google Scholar] [CrossRef] [PubMed]
  4. Czembor, J.H. Resistance to powdery mildew in selections from Moroccan barley landraces. Euphytica 2002, 125, 397–409. [Google Scholar] [CrossRef]
  5. Schüller, C.; Backes, G.; Fischbeck, G.; Jahoor, A. RFLP markers to identify the alleles on the Mla locus conferring powdery mildew resistance in barley. Theor. Appl. Genet. 1992, 84, 330–338. [Google Scholar] [CrossRef] [PubMed]
  6. Wei, F.; Gobelman-Werner, K.; Morroll, S.M.; Kurth, J.; Mao, L.; Wing, R.; Leister, D.; Schulze-Lefert, P.; Wise, R.P. The Mla (powdery mildew) resistance cluster is associated with three NBS-LRR gene families and suppressed recombination within a 240-kb DNA interval on chromosome 5S (1HS) of barley. Genetics 1999, 153, 1929–1948. [Google Scholar] [PubMed]
  7. Jørgensen, J.H.; Wolfe, M. Genetics of powdery mildew resistance in barley. Crit. Rev. Plant Sci. 1994, 13, 97–119. [Google Scholar] [CrossRef]
  8. Giese, H.; Holm-Jensen, A.G.; Jensen, H.P.; Jensen, J. Localization of the Laevigatum powdery mildew resistance gene to barley chromosome 2 by the use of RFLP markers. Theor. Appl. Genet. 1993, 85, 897–900. [Google Scholar] [CrossRef]
  9. Piechota, U.; Czembor, P.C.; Słowacki, P.; Czembor, J.H. Identifying a novel powdery mildew resistance gene in a barley landrace from Morocco. J. Appl. Genet. 2019, 60, 243–254. [Google Scholar] [CrossRef] [Green Version]
  10. Görg, R.; Hollricher, K.; Schulze-Lefert, P. Functional analysis and RFLP-mediated mapping of the Mlg resistance locus in barley. Plant J. 1993, 3, 857–866. [Google Scholar] [CrossRef]
  11. Schönfeld, M.; Ragni, A.; Fischbeck, G.; Jahoor, A. RFLP mapping of three new loci for resistance genes to powdery mildew (Erysiphe graminis f. sp. hordei) in barley. Theor. Appl. Genet. 1996, 93, 48–56. [Google Scholar] [CrossRef]
  12. Dreiseitl, A. Specific resistance of barley to powdery mildew, its use and beyond. A concise critical review. Genes 2020, 11, 971. [Google Scholar] [CrossRef] [PubMed]
  13. Mejlhede, N.; Kyjovska, Z.; Backes, G.; Burhenne, K.; Rasmussen, S.K.; Jahoor, A. EcoTILLING for the identification of allelic variation in the powdery mildew resistance genes mlo and Mla of barley. Plant Breed. 2006, 125, 461–467. [Google Scholar] [CrossRef] [Green Version]
  14. Seeholzer, S.; Tsuchimatsu, T.; Jordan, T.; Bieri, S.; Pajonk, S.; Yang, W.; Jahoor, A.; Shimizu, K.K.; Keller, B.; Schulze-Lefert, P. Diversity at the Mla powdery mildew resistance locus from cultivated barley reveals sites of positive selection. Mol. Plant Microbe Interact. 2010, 23, 497–509. [Google Scholar] [CrossRef] [PubMed] [Green Version]
  15. Giese, H.; Jørgensen, J.H.; Jensen, H.P.; Jensen, J. Linkage relationships of ten powdery mildew resistance genes on barley chromosome 5. Hereditas 1981, 95, 43–50. [Google Scholar] [CrossRef]
  16. Giese, H. Powdery mildew resistance genes in the Ml-a and Ml-k regions on barley chromosome 5. Hereditas 1981, 95, 51–62. [Google Scholar] [CrossRef]
  17. Kintzios, S.; Jahoor, A.; Fischbeck, G. Powdery-mildew-resistance genes Mla29 and Mla32 in H. spontaneum derived winter-barley ines. Plant Breed. 1995, 266, 265–267. [Google Scholar] [CrossRef]
  18. Jahoor, A.; Fischbeck, G. Identification of New Genes for Mildew Resistance of Barley at the Mia Locus in Lines Derived from Hordeum spontaneum. Plant Breed. 1993, 110, 116–122. [Google Scholar] [CrossRef]
  19. Wei, F.; Wing, R.A.; Wise, R.P. Genome dynamics and evolution of the Mla (powdery mildew) resistance locus in barley. Plant Cell 2002, 14, 1903–1917. [Google Scholar] [CrossRef] [Green Version]
  20. Halterman, D.; Zhou, F.; Wei, F.; Wise, R.P.; Schulze-lefert, P. The MLA6 coiled-coil, NBS-LRR protein confers AvrMla6—Dependent resistance specificity to Blumeria graminis f. sp. hordei in barley and wheat. Plant J. 2001, 25, 335–348. [Google Scholar] [CrossRef] [Green Version]
  21. Halterman, D.A.; Wei, F.; Wise, R.P. Powdery mildew-induced Mla mRNAs are alternatively spliced and contain multiple upstream open reading frames. Plant Physiol. 2003, 131, 558–567. [Google Scholar] [CrossRef] [Green Version]
  22. Shen, Q.H.; Zhou, F.; Bieri, S.; Haizel, T.; Shirasu, K.; Schulze-Lefert, P. Recognition specificity and RAR1/SGT1 dependence in barley Mla disease resistance genes to the powdery mildew fungus. Plant Cell 2003, 15, 732–744. [Google Scholar] [CrossRef] [PubMed] [Green Version]
  23. Zhou, F.; Kurth, J.; Wei, F.; Elliott, C.; Valè, G.; Yahiaoui, N.; Keller, B.; Somerville, S.; Wise, R.; Schulze-lefert, P. Cell-Autonomous Expression of Barley Mla1 Confers Race-Specific Resistance to the Powdery Mildew Fungus via a Rar1—Independent Signaling Pathway. Plant Cell 2001, 13, 337–350. [Google Scholar] [CrossRef] [PubMed] [Green Version]
  24. Halterman, D.A.; Wise, R.P. A single-amino acid substitution in the sixth leucine-rich repeat of barley MLA6 and MLA13 alleviates dependence on RAR1 for disease resistance signaling. Plant J. 2004, 38, 215–226. [Google Scholar] [CrossRef] [PubMed]
  25. Büschges, R.; Hollricher, K.; Panstruga, R.; Simons, G.; Wolter, M.; Frijters, A.; Van Daelen, R.; Van der Lee, T.; Diergaarde, P.; Groenendijk, J.; et al. The barley Mlo gene: A novel control element of plant pathogen resistance. Cell 1997, 88, 695–705. [Google Scholar] [CrossRef] [Green Version]
  26. Freisleben, R.; Lein, A. Über die Auffindung einer mehltauresistenten Mutante nach Röntgenbestrahlung einer anfälligen reinen Linie von Sommergerste. Naturwissenschaften 1942, 30, 608. [Google Scholar] [CrossRef]
  27. Jørgensen, J.H. Discovery, characterization and exploitation of Mlo powdery mildew resistance in barley. Euphytica 1992, 63, 141–152. [Google Scholar] [CrossRef]
  28. Reinstädler, A.; Müller, J.; Czembor, J.H.; Piffanelli, P.; Panstruga, R. Novel induced mlo mutant alleles in combination with site-directed mutagenesis reveal functionally important domains in the heptahelical barley Mlo protein. BMC Plant Biol. 2010, 10, 31. [Google Scholar] [CrossRef] [Green Version]
  29. Freialdenhoven, A.; Peterhansel, C.; Kurth, J.; Kreuzaler, F.; Schulze-Lefert, P. ldentification of Genes Required for the Function of Non-Race-Specific. Plant Cell 1996, 8, 5–14. [Google Scholar] [CrossRef] [Green Version]
  30. Devoto, A.; Piffanelli, P.; Nilsson, I.M.; Wallin, E.; Panstruga, R.; Von Heijne, G.; Schulze-Lefert, P. Topology, subcellular localization, and sequence diversity of the Mlo family in plants. J. Biol. Chem. 1999, 274, 34993–35004. [Google Scholar] [CrossRef] [Green Version]
  31. Devoto, A.; Hartmann, H.A.; Piffanelli, P.; Elliott, C.; Simmons, C.; Taramino, G.; Goh, C.S.; Cohen, F.E.; Emerson, B.C.; Schulze-Lefert, P.; et al. Molecular phylogeny and evolution of the plant-specific seven-transmembrane MLO family. J. Mol. Evol. 2003, 56, 77–88. [Google Scholar] [CrossRef]
  32. Kusch, S.; Panstruga, R. Mlo-based resistance: An apparently universal “weapon” to defeat powdery mildew disease. Mol. Plant Microbe Interact. 2017, 30, 179–189. [Google Scholar] [CrossRef] [PubMed] [Green Version]
  33. Jarosch, B.; Kogel, K.H.; Schaffrath, U. The ambivalence of the barley Mlo locus: Mutations conferring resistance against powdery mildew (Blumeria graminis f. sp. hordei) Enhance susceptibility to the rice blast fungus Magnaporthe grisea. Mol. Plant Microbe Interact. 1999, 12, 508–514. [Google Scholar] [CrossRef] [Green Version]
  34. Kumar, J.; Hückelhoven, R.; Beckhove, U.; Nagarajan, S.; Kogel, K.H. A compromised Mlo pathway affects the response of barley to the necrotrophic fungus Bipolaris sorokiniana (teleomorph: Cochliobolus sativus) and its toxins. Phytopathology 2001, 91, 127–133. [Google Scholar] [CrossRef] [PubMed] [Green Version]
  35. McGrann, G.R.D.; Stavrinides, A.; Russell, J.R.; Corbitt, M.M.; Booth, A.; Chartrain, L.; Thomas, W.T.B.; Brown, J.K.M. A trade off between mlo resistance to powdery mildew and increased susceptibility of barley. J. Exp. Bot. 2014, 65, 1025–1037. [Google Scholar] [CrossRef] [Green Version]
  36. Havis, N.D.; Brown, J.K.M.; Clemente, G.; Frei, P.; Jedryczka, M.; Kaczmarek, J.; Kaczmarek, M.; Matusinsky, P.; McGrann, G.R.D.; Pereyra, S.; et al. Ramularia collo-cygni—An emerging pathogen of barley crops. Phytopathology 2015, 105, 895–904. [Google Scholar] [CrossRef] [Green Version]
  37. Alqudah, A.M.; Sallam, A.; Stephen Baenziger, P.; Börner, A. GWAS: Fast-forwarding gene identification and characterization in temperate Cereals: Lessons from Barley—A review. J. Adv. Res. 2020, 22, 119–135. [Google Scholar] [CrossRef]
  38. Rafalski, J.A. Association genetics in crop improvement. Curr. Opin. Plant Biol. 2010, 13, 174–180. [Google Scholar] [CrossRef]
  39. Cavanagh, C.R.; Morell, M.; Mackay, I.; Powell, W. From mutations to MAGIC: Resources for gene discovery, validation and delivery in crop plants. Curr. Opin. Plant Biol. 2008, 11, 215–221. [Google Scholar] [CrossRef]
  40. Huang, X.; Han, B. Natural Variations and Genome-Wide Association Studies in Crop Plants. Annu. Rev. Plant Biol. 2014, 65, 531–551. [Google Scholar] [CrossRef]
  41. Huang, B.E.; Verbyla, K.L.; Verbyla, A.P.; Raghavan, C.; Singh, V.K.; Gaur, P.; Leung, H.; Varshney, R.K.; Cavanagh, C.R. MAGIC populations in crops: Current status and future prospects. Theor. Appl. Genet. 2015, 128, 999–1017. [Google Scholar] [CrossRef]
  42. Scott, M.F.; Ladejobi, O.; Amer, S.; Bentley, A.R.; Biernaskie, J.; Boden, S.A.; Clark, M.; Dell’Acqua, M.; Dixon, L.E.; Filippi, C.V.; et al. Multi-parent populations in crops: A toolbox integrating genomics and genetic mapping with breeding. Heredity 2020, 125, 396–416. [Google Scholar] [CrossRef] [PubMed]
  43. Islam, M.S.; Thyssen, G.N.; Jenkins, J.N.; Zeng, L.; Delhom, C.D.; McCarty, J.C.; Deng, D.D.; Hinchliffe, D.J.; Jones, D.C.; Fang, D.D. A MAGIC population-based genome-wide association study reveals functional association of GhRBB1_A07 gene with superior fiber quality in cotton. BMC Genom. 2016, 17, 903. [Google Scholar] [CrossRef] [PubMed] [Green Version]
  44. Ongom, P.O.; Ejeta, G. Mating design and genetic structure of a multi-parent advanced generation intercross (MAGIC) population of sorghum (Sorghum bicolor (L.) moench). G3 Genes Genomes Genet. 2018, 8, 331–341. [Google Scholar] [CrossRef] [PubMed] [Green Version]
  45. Yan, W.; Zhao, H.; Yu, K.; Wang, T.; Khattak, A.N.; Tian, E. Development of a multiparent advanced generation intercross (MAGIC) population for genetic exploitation of complex traits in Brassica juncea: Glucosinolate content as an example. Plant Breed. 2020, 319, 779–789. [Google Scholar] [CrossRef]
  46. Bandillo, N.; Raghavan, C.; Muyco, P.A.; Sevilla, M.A.L.; Lobina, I.T.; Dilla-Ermita, C.J.; Tung, C.W.; McCouch, S.; Thomson, M.; Mauleon, R.; et al. Multi-parent advanced generation inter-cross (MAGIC) populations in rice: Progress and potential for genetics research and breeding. Rice 2013, 6, 1–15. [Google Scholar] [CrossRef] [Green Version]
  47. Meng, L.; Wang, B.; Zhao, X.; Ponce, K.; Qian, Q.; Ye, G. Association mapping of ferrous, zinc, and aluminum tolerance at the seedling stage in Indica rice using MAGIC populations. Front. Plant Sci. 2017, 8, 1–15. [Google Scholar] [CrossRef] [Green Version]
  48. Meng, L.; Zhao, X.; Ponce, K.; Ye, G.; Leung, H. QTL mapping for agronomic traits using multi-parent advanced generation inter-cross (MAGIC) populations derived from diverse elite indica rice lines. Field Crop. Res. 2016, 189, 19–42. [Google Scholar] [CrossRef] [Green Version]
  49. Ogawa, D.; Nonoue, Y.; Tsunematsu, H.; Kanno, N.; Yamamoto, T.; Yonemaru, J.I. Discovery of QTL alleles for grain shape in the Japan-MAGIC rice population using haplotype information. G3 Genes Genomes Genet. 2018, 8, 3559–3565. [Google Scholar] [CrossRef]
  50. Huang, B.E.; George, A.W.; Forrest, K.L.; Kilian, A.; Hayden, M.J.; Morell, M.K.; Cavanagh, C.R. A multiparent advanced generation inter-cross population for genetic analysis in wheat. Plant Biotechnol. J. 2012, 10, 826–839. [Google Scholar] [CrossRef]
  51. Sannemann, W.; Lisker, A.; Maurer, A.; Léon, J.; Kazman, E.; Cöster, H.; Holzapfel, J.; Kempf, H.; Korzun, V.; Ebmeyer, E.; et al. Adaptive selection of founder segments and epistatic control of plant height in the MAGIC winter wheat population WM-800. BMC Genom. 2018, 19, 1–16. [Google Scholar] [CrossRef]
  52. Stadlmeier, M.; Hartl, L.; Mohler, V. Usefulness of a multiparent advanced generation intercross population with a greatly reduced mating design for genetic studies in winter wheat. Front. Plant Sci. 2018, 871, 1–12. [Google Scholar] [CrossRef] [Green Version]
  53. Mackay, I.J.; Bansept-Basler, P.; Bentley, A.R.; Cockram, J.; Gosman, N.; Greenland, A.J.; Horsnell, R.; Howells, R.; O’Sullivan, D.M.; Rose, G.A.; et al. An eight-parent multiparent advanced generation inter-cross population for winter-sown wheat: Creation, properties, and validation. G3 Genes Genomes Genet. 2014, 4, 1603–1610. [Google Scholar] [CrossRef] [Green Version]
  54. Dell’Acqua, M.; Gatti, D.M.; Pea, G.; Cattonaro, F.; Coppens, F.; Magris, G.; Hlaing, A.L.; Aung, H.H.; Nelissen, H.; Baute, J.; et al. Genetic properties of the MAGIC maize population: A new platform for high definition QTL mapping in Zea mays. Genome Biol. 2015, 16, 1–23. [Google Scholar] [CrossRef] [PubMed] [Green Version]
  55. Sannemann, W.; Huang, B.E.; Mathew, B.; Léon, J. Multi-parent advanced generation inter-cross in barley: High-resolution quantitative trait locus mapping for flowering time as a proof of concept. Mol. Breed. 2015, 35, 86. [Google Scholar] [CrossRef]
  56. Zhang, Y.M.; Jia, Z.; Dunwell, J.M. Editorial: The applications of new multi-locus gwas methodologies in the genetic dissection of complex traits. Front. Plant Sci. 2019, 10, 1–6. [Google Scholar] [CrossRef] [PubMed] [Green Version]
  57. Czembor, P.C.; Czembor, J.H. DNA polymorphisms among near-isogenic lines for powdery-mildew-resistant genes in barley detected by primers targeting resistance-gene analogs. Can. J. Plant Pathol. 2002, 24, 499–503. [Google Scholar] [CrossRef]
  58. Silvar, C.; Dhif, H.; Igartua, E.; Kopahnke, D.; Gracia, M.P.; Lasa, J.M.; Ordon, F.; Casas, A.M. Identification of quantitative trait loci for resistance to powdery mildew in a Spanish barley landrace. Mol. Breed. 2010, 25, 581–592. [Google Scholar] [CrossRef] [Green Version]
  59. Ge, X.; Deng, W.; Lee, Z.Z.; Lopez-Ruiz, F.J.; Schweizer, P.; Ellwood, S.R. Tempered mlo broad-spectrum resistance to barley powdery mildew in an Ethiopian landrace. Sci. Rep. 2016, 6, 29558. [Google Scholar] [CrossRef]
  60. Abdel-Ghani, A.H.; Al-Ameiri, N.S.; Karajeh, M.R. Resistance of barley landraces and wild barley populations to powdery mildew in Jordan. Phytopathol. Mediterr. 2008, 47, 92–97. [Google Scholar] [CrossRef]
  61. Řepková, J.; Dreiseitl, A.; Lízal, P.; Kyjovská, Z.; Teturová, K.; Psotková, R.; Jahoor, A. Identification of resistance genes against powdery mildew in four accessions of Hordeum vulgare ssp. spontaneum. Euphytica 2006, 151, 23–30. [Google Scholar] [CrossRef]
  62. Bengtsson, T.; Åhman, I.; Manninen, O.; Reitan, L.; Christerson, T.; Due Jensen, J.; Krusell, L.; Jahoor, A.; Orabi, J.; Jensen, J.D.; et al. A novel QTL for powdery mildew resistance in nordic spring barley (Hordeum vulgare L. ssp. vulgare) revealed by genome-wide association study. Front. Plant Sci. 2017, 8, 1954. [Google Scholar] [CrossRef] [PubMed]
  63. Revelle, W. Psych: Procedures for Personality and Psychological Research; Northwestern University: Evanston, IL, USA, 2014; Volume 165, pp. 1–10. [Google Scholar]
  64. R Core Team. R: A Language and Environment for Statistical Computing; R Foundation for Statistical Computing: Vienna, Austria, 2017. [Google Scholar]
  65. Bates, D.; Mächler, M.; Bolker, B.M.; Walker, S.C. Fitting linear mixed-effects models using lme4. J. Stat. Softw. 2015, 67. [Google Scholar] [CrossRef]
  66. Pinheiro, J.; Bates, D.; DebRoy, S.; Sarkar, D.; EISPACK authors; Heisterkamp, S.; Van Willigen, B.; R Core Team. nlme: Linear and Nonlinear Mixed Effects Models; R Package Version 3; 2020; pp. 1–149. Available online: https://cran.r-project.org/package=nlme (accessed on 29 May 2020).
  67. Bayer, M.M.; Rapazote-Flores, P.; Ganal, M.; Hedley, P.E.; Macaulay, M.; Plieske, J.; Ramsay, L.; Russell, J.R.; Shaw, P.D.; Thomas, W.T.B.; et al. Development and evaluation of a barley 50k iSelect SNP array. Front. Plant Sci. 2017, 8, 1792. [Google Scholar] [CrossRef] [PubMed] [Green Version]
  68. Åhman, I.; Bengtsson, T. Introgression of resistance to Rhopalosiphum padi L. from wild barley into cultivated barley facilitated by doubled haploid and molecular marker techniques. Theor. Appl. Genet. 2019, 132, 1397–1408. [Google Scholar] [CrossRef] [Green Version]
  69. Mascher, M.; Gundlach, H.; Himmelbach, A.; Beier, S.; Twardziok, S.O.; Wicker, T.; Radchuk, V.; Dockter, C.; Hedley, P.E.; Russell, J.R.; et al. A chromosome conformation capture ordered sequence of the barley genome. Nature 2017, 544, 427–433. [Google Scholar] [CrossRef] [Green Version]
  70. Cantalapiedra, C.P.; Boudiar, R.; Casas, A.M.; Igartua, E.; Contreras-Moreira, B. BARLEYMAP: Physical and genetic mapping of nucleotide sequences and annotation of surrounding loci in barley. Mol. Breed. 2015, 35, 1–11. [Google Scholar] [CrossRef]
  71. Pritchard, J.K.; Stephens, M.; Donelly, P. Inference of Population Structure Using Multilocus Genotype Data. Genetics 2000, 155, 945–959. [Google Scholar]
  72. Evanno, G.; Regnaut, S.; Goudet, J. Detecting the number of clusters of individuals using the software STRUCTURE: A simulation study. Mol. Ecol. 2005, 14, 2611–2620. [Google Scholar] [CrossRef] [Green Version]
  73. Earl, D.A.; von Holdt, B.M. STRUCTURE HARVESTER: A website and program for visualizing STRUCTURE output and implementing the Evanno method. Conserv. Genet. Resour. 2012, 4, 359–361. [Google Scholar] [CrossRef]
  74. Covarrubias-Pazaran, G. Genome-Assisted Prediction of Quantitative Traits Using the R Package sommer. PLoS ONE 2016, 11, e0156744. [Google Scholar] [CrossRef] [Green Version]
  75. Zhang, Z.; Ersoz, E.; Lai, C.Q.; Todhunter, R.J.; Tiwari, H.K.; Gore, M.A.; Bradbury, P.J.; Yu, J.; Arnett, D.K.; Ordovas, J.M.; et al. Mixed linear model approach adapted for genome-wide association studies. Nat. Genet. 2010, 42, 355–360. [Google Scholar] [CrossRef] [PubMed] [Green Version]
  76. Segura, V.; Vilhjálmsson, B.J.; Platt, A.; Korte, A.; Seren, Ü.; Long, Q.; Nordborg, M. An efficient multi-locus mixed-model approach for genome-wide association studies in structured populations. Nat. Genet. 2012, 44, 825–830. [Google Scholar] [CrossRef] [PubMed] [Green Version]
  77. Liu, X.; Huang, M.; Fan, B.; Buckler, E.S.; Zhang, Z. Iterative Usage of Fixed and Random Effect Models for Powerful and Efficient Genome-Wide Association Studies. PLoS Genet. 2016, 12, 1–24. [Google Scholar] [CrossRef] [PubMed]
  78. Lipka, A.E.; Tian, F.; Wang, Q.; Peiffer, J.; Li, M.; Bradbury, P.J.; Gore, M.A.; Buckler, E.S.; Zhang, Z. GAPIT: Genome association and prediction integrated tool. Bioinformatics 2012, 28, 2397–2399. [Google Scholar] [CrossRef] [Green Version]
  79. Van Raden, P.M. Efficient methods to compute genomic predictions. J. Dairy Sci. 2008, 91, 4414–4423. [Google Scholar] [CrossRef] [Green Version]
  80. Li, M.X.; Yeung, J.M.Y.; Cherny, S.S.; Sham, P.C. Evaluating the effective numbers of independent tests and significant p-value thresholds in commercial genotyping arrays and public imputation reference datasets. Hum. Genet. 2012, 131, 747–756. [Google Scholar] [CrossRef] [Green Version]
  81. Andersen, S.B.; Due, I.K.; Olesen, A. The Response of Anther Culture in a Genetically Wide Material of Winter Wheat (Triticum aestivum L.). Plant Breed. 1987, 99, 181–186. [Google Scholar] [CrossRef]
  82. Milner, S.G.; Jost, M.; Taketa, S.; Mazón, E.R.; Himmelbach, A.; Oppermann, M.; Weise, S.; Knüpffer, H.; Basterrechea, M.; König, P.; et al. Genebank genomics highlights the diversity of a global barley collection. Nat. Genet. 2019, 51, 319–326. [Google Scholar] [CrossRef] [Green Version]
  83. Nordborg, M.; Borevitz, J.O.; Bergelson, J.; Berry, C.C.; Chory, J.; Hagenblad, J.; Kreitman, M.; Maloof, J.N.; Noyes, T.; Oefner, P.J.; et al. The extent of linkage disequilibrium in Arabidopsis thaliana. Nat. Genet. 2002, 30, 190–193. [Google Scholar] [CrossRef]
  84. Flint-Garcia, S.A.; Thornsberry, J.M.; Edward IV, S.B. Structure of Linkage Disequilibrium in Plants. Annu. Rev. Plant Biol. 2003, 54, 357–374. [Google Scholar] [CrossRef] [Green Version]
  85. Hinze, K.; Thompson, R.D.; Ritter, E.; Salamini, F.; Schulze-lefert, P. Restriction fragment length polymorphism-mediated targeting of the ml-o resistance locus in barley (Hordeum vulgare). Proc. Natl. Acad. Sci. USA 1991, 88, 3691–3695. [Google Scholar] [CrossRef] [PubMed] [Green Version]
  86. Berger, G.L.; Liu, S.; Hall, M.D.; Brooks, W.S.; Chao, S.; Muehlbauer, G.J.; Baik, B.K.; Steffenson, B.; Griffey, C.A. Marker-trait associations in Virginia Tech winter barley identified using genome-wide mapping. Theor. Appl. Genet. 2013, 126, 693–710. [Google Scholar] [CrossRef] [PubMed]
  87. Caldo, R.A.; Nettleton, D.; Wise, R.P. Interaction-dependent gene expression in Mla-specified response to barley powdery mildew. Plant Cell 2004, 16, 2514–2528. [Google Scholar] [CrossRef] [PubMed] [Green Version]
  88. Soldánová, M.; Ištvánek, J.; Řepková, J.; Dreiseitl, A. Newly discovered genes for resistance to powdery mildew in the subtelomeric region of the short arm of barley chromosome 7H. Czech J. Genet. Plant Breed. 2013, 49, 95–102. [Google Scholar] [CrossRef] [Green Version]
  89. Yun, S.J.; Gyenis, L.; Hayes, P.M.; Matus, I.; Smith, K.P.; Steffenson, B.J.; Muehlbauer, G.J. Quantitative trait loci for multiple disease resistance in wild barley. Crop Sci. 2005, 45, 2563–2572. [Google Scholar] [CrossRef]
  90. Aghnoum, R.; Marcel, T.C.; Johrde, A.; Pecchioni, N.; Schweizer, P.; Niks, R.E. Basal host resistance of barley to powdery mildew: Connecting quantitative trait loci and candidate genes. Mol. Plant Microbe Interact. 2010, 23, 91–102. [Google Scholar] [CrossRef] [PubMed] [Green Version]
  91. Von Korff, M.; Wang, H.; Léon, J.; Pillen, K. AB-QTL analysis in spring barley. I. Detection of resistance genes against powdery mildew, leaf rust and scald introgressed from wild barley. Theor. Appl. Genet. 2005, 111, 583–590. [Google Scholar] [CrossRef]
  92. Schmalenbach, I.; Körber, N.; Pillen, K. Selecting a set of wild barley introgression lines and verification of QTL effects for resistance to powdery mildew and leaf rust. Theor. Appl. Genet. 2008, 117, 1093–1106. [Google Scholar] [CrossRef] [Green Version]
  93. Panstruga, R.; Parker, J.E.; Schulze-lefert, P. SnapShot: Plant Immune Response Pathways. Cell 2009, 136, 6–8. [Google Scholar] [CrossRef] [Green Version]
  94. Kumar, M.; Brar, A.; Yadav, M.; Chawade, A.; Vivekanand, V.; Pareek, N. Chitinases—Potential Candidates for Enhanced Plant Resistance towards Fungal Pathogens. Agriculture 2018, 8, 88. [Google Scholar] [CrossRef] [Green Version]
  95. Pandey, S.P.; Somssich, I.E. The role of WRKY transcription factors in plant immunity. Plant Physiol. 2009, 150, 1648–1655. [Google Scholar] [CrossRef] [PubMed] [Green Version]
  96. Chowdhury, J.; Schober, M.S.; Shirley, N.J.; Singh, R.R.; Jacobs, A.K.; Douchkov, D.; Schweizer, P.; Fincher, G.B.; Burton, R.A.; Little, A. Down-regulation of the glucan synthase-like 6 gene (HvGsl6) in barley leads to decreased callose accumulation and increased cell wall penetration by Blumeria graminis f. sp. hordei. New Phytol. 2016, 212, 434–443. [Google Scholar] [CrossRef] [PubMed] [Green Version]
  97. González, A.M.; Marcel, T.C.; Kohutova, Z.; Stam, P.; van der Linden, C.G.; Niks, R.E. Peroxidase profiling reveals genetic linkage between peroxidase gene clusters and basal host and non-host resistance to rusts and mildew in barley. PLoS ONE 2010, 5, e10495. [Google Scholar] [CrossRef] [Green Version]
  98. Shtaya, M.J.Y.; Marcel, T.C.; Sillero, J.C.; Niks, R.E.; Rubiales, D. Identification of QTLs for powdery mildew and scald resistance in barley. Euphytica 2006, 151, 421–429. [Google Scholar] [CrossRef] [Green Version]
  99. Schweizer, P.; Stein, N. Large-scale data integration reveals colocalization of gene functional groups with meta-QTL for multiple disease resistance in barley. Mol. Plant Microbe Interact. 2011, 24, 1492–1501. [Google Scholar] [CrossRef] [PubMed] [Green Version]
  100. Hilbers, S.; Fischbeck, G.; Jahoor, A. Localization of the Laevigatum Resistance Gene MlLa against Powdery Mildew in the Barley Genome by the Use of RFLP Markers. Plant Breed. 1992, 109, 335–338. [Google Scholar] [CrossRef]
  101. Dros, J. The creation and maintenance of two spring barley varieties. Euphytica 1957, 6, 45–48. [Google Scholar] [CrossRef]
  102. Hoseinzadeh, P.; Ruge-Wehling, B.; Schweizer, P.; Stein, N.; Pidon, H. High Resolution Mapping of a Hordeum bulbosum-Derived Powdery Mildew Resistance Locus in Barley Using Distinct Homologous Introgression Lines. Front. Plant Sci. 2020, 11, 1–13. [Google Scholar] [CrossRef] [Green Version]
  103. Kurth, J.; Kolsch, R.; Simons, V.; Schulze-Lefert, P. A high-resolution genetic map and a diagnostic RFLP marker for the Mlg resistance locus to powdery mildew in barley. Theor. Appl. Genet. 2001, 102, 53–60. [Google Scholar] [CrossRef]
  104. Afzal, A.J.; Wood, A.J.; Lightfoot, D.A. Plant Receptor-Like Serine Threonine Kinases: Roles in Signaling and Plant Defense. Mol. Plant Microbe Interact. 2008, 21, 507–517. [Google Scholar] [CrossRef] [Green Version]
  105. Backes, G.; Schwarz, G.; Wenzel, G.; Jahoor, A. Comparison between QTL analysis of powdery mildew resistance in barley based on detached primary leaves and on field data. Plant Breed. 1996, 115, 419–421. [Google Scholar] [CrossRef]
  106. Silvar, C.; Perovic, D.; Scholz, U.; Casas, A.M.; Igartua, E.; Ordon, F. Fine mapping and comparative genomics integration of two quantitative trait loci controlling resistance to powdery mildew in a Spanish barley landrace. Theor. Appl. Genet. 2012, 124, 49–62. [Google Scholar] [CrossRef] [PubMed] [Green Version]
  107. Silvar, C.; Perovic, D.; Nussbaumer, T.; Spannagl, M.; Usadel, B.; Casas, A.; Igartua, E.; Ordon, F. Towards Positional Isolation of Three Quantitative Trait Loci Conferring Resistance to Powdery Mildew in Two Spanish Barley Landraces. PLoS ONE 2013, 8, e67336. [Google Scholar] [CrossRef] [PubMed] [Green Version]
Figure 1. Crossing scheme of the eight-founder barley MAGIC populations, exemplary for MAGIC 1. Capital letters correspond to A: Ylitornion, B: GN 06075, C: Lavrans, D: RGT Planet, E: MBR 1012, F: Iron, G: JLB06-034. The name of each generation (G) can be found on the left side of the scheme indicated by a G followed by a lower-case number. DH means doubled haploid and n indicates the number of DH lines produced.
Genes 11 01512 g001
Figure 2. Analyses of population structure and linkage disequilibrium (LD) decay for the combined panel, MAGIC 1 to 4. (a) Principle component analysis (PCA) plot of the first two components, colored according to population; (b) genome-wide LD decay plot, with r2 plotted against the physical position (Mbp), the horizontal line represents the LD decay threshold (c) Population structure revealed by STRUCTURE analysis.
Genes 11 01512 g002
Figure 3. Manhattan plots of the best model and respective quantile–quantile (QQ) plots for each spring barley MAGIC population. The x-axis shows the seven barley chromosomes with physical positions, the y-axis displays the −log10 (p)-values. The red horizontal line represents the Bonferroni adjusted significance threshold –log10 (p) with values of 4.93 (MAGIC 1 + 2), 5.1 (MAGIC 3), 4.6 (MAGIC 4), and 4.99 (MAGIC 1 to 4), corresponding to an experiment wise error rate of 0.05.
Genes 11 01512 g003
Table 1. Founders of the four barley MAGIC populations.
LetterPedigreeTypeCountry of OriginRow Type
AYlitornionLandraceFinlandSix-rowed
BGN 06075Breeding lineNorwaySix-rowed
CLavransCultivarNorwaySix-rowed
DRGT PlanetCultivarFranceTwo-rowed
EMBR 1012LandraceFormer YugoslaviaSix-rowed
FIronCultivarPolandTwo-rowed
GJLB06-034LandraceJordanTwo-rowed
HGN 09096Breeding lineNorwaySix-rowed
ISJ 111998Breeding lineDenmarkTwo-rowed
JChevronCultivarSwitzerlandSix-rowed
KOlveCultivarNorwayTwo-rowed
LBrageCultivarNorwaySix-rowed
MKrasnodarskij 35CultivarSoviet UnionTwo-rowed
NNordicCultivarUSSix-rowed
OFairytaleCultivarDenmarkTwo-rowed
PGN 09005Breeding lineNorwaySix-rowed
QGaffelbygLandraceDenmarkSix-rowed
Table 2. Crossing scheme for the four barley MAGIC populations.
PopulationCrossesNo of Progenies
MAGIC 1((A × B) × (C × D)) × ((E × F) × (G × H))122
MAGIC 2((A × B) × (C × D)) × ((E × F) × (G × I))29
MAGIC 3((J × D) × (K × L)) × ((M × F) × (N × O))81
MAGIC 4((P × O) × (Q × O)) × ((M × F) × (N × O))303
Capital letters correspond to: A: Ylitornion, B: GN 06075, C: Lavrans, D: RGT Planet, E: MBR 1012, F: Iron, G: JLB06-034, H: GN 09096, I: SJ 111998, J: Chevron, K: Olve, L: Brage, M: Krasnodarskij 35, N: Nordic, O: Fairytale, P: GN 09005, Q: Gaffelbyg.
Table 3. Field evaluation details.
EnvironmentLocationEntityYearSowing DayReplicationsObservation Day
1DyngbyNordic Seed20178 April21 June and 21 June
2DyngbyNordic Seed201814 April225 June
3HorsensSejet Plant Breeding201813 April125 May and 15 June
Table 4. Linkage disequilibrium decay (Mbp) for each of the four barley MAGIC populations.
ChromosomeMAGIC 1 + 2MAGIC 3MAGIC 4MAGIC 1 to 4
1H15 605617
2H14402317
3H7442815
4H12453416
5H13312919
6H1214042920
7H193349732
Genome-wide14383319
Table 5. Quantitative trait locus/loci (QTL) for powdery mildew resistance identified in genome-wide association studies in four barley MAGIC populations, markers significantly associated with these regions and their physical locations, as well as founders and lines carrying the positive alleles. Complete lists can be found in Tables S2 and S4.
QTLSNPChromosomePosition (bp)p-ValueLODMAFEffectMAGIC PopulationFounder with pos. AlleleLines with pos. Allele
Qrbg_1H_1JHI_Hv50k_2016_77571H6,976,9746.06 × 1098.2180.306−0.3761 + 2GN06075, GN09096, Iron, Lavrans37
BOPA2_12_309181H8,935,9051.45 × 101312.8400.343-1 to 4Brage, Fairytale, GN06075, Iron, Krasnordarskij 35, Lavrans, SJ111998315
JHI_Hv50k_2016_100191H9,240,4111.63 × 101211.7880.313−0.5313Iron25
SCRI_RS_1487331H10,236,7031.55 × 101615.8090.1510.4294Fairytale, GN09005, Iron, Krasnordarskij 35233
Qrbg_1H_2JHI_Hv50k_2016_146831H18,358,1901.19 × 1087.9260.233-1 to 4Chevron, Gaffelbyg, GN06075, GN09096, Iron, Lavrans, Nordic, Ylitornion101
Qrbg_1H_3JHI_Hv50k_2016_378001H492,560,3093.28 × 1076.4840.299−0.1694Nordic82
Qrbg_2H_1BOPA1_7623_8182H52,014,0302.29 × 1054.6400.1470.2044Krasnordarskij 35, Nordic39
JHI_Hv50k_2016_876272H122,769,3273.56 × 1076.4480.289−0.3323Fairytale, Iron, Olve, RGT Planet20
Qrbg_2H_2JHI_Hv50k_2016_1417952H754,879,1703.34 × 101110.4760.206−0.3604Fairytale, GN09005, Iron57
JHI_Hv50k_2016_1428892H757,857,5561.00 × 1065.9990.3490.2863Fairytale, Iron, Krasnordarskij 35, Olve, RGT Planet49
JHI_Hv50k_2016_1472322H765,628,8006.32 × 1098.2000.204-1 to 4Fairytale, JLB06-03498
Qrbg_3H_1BOPA2_12_301923H21,019,7401.46 × 1065.8350.276−0.2581 + 2GN06075, GN09096, JLB06-034, Lavrans, RGT Planet, SJ11199891
Qrbg_4H_1JHI_Hv50k_2016_2303674H12,239,1109.93 × 1065.0030.253−0.2853Brage, Chevron, Fairytale, Krasnordarskij 35, RGT Planet16
Qrbg_4H_2JHI_Hv50k_2016_2658704H621,555,2756.47 × 103332.1890.358−1.3381 + 2RGT Planet, SJ11199846
3.24 × 102726.4890.102-1 to 4GN09005, RGT Planet, SJ11199847
JHI_Hv50k_2016_2671534H623,655,6756.28 × 1076.2020.397-1 to 4Gaffelbyg, GN09005, Iron, JLB06-034, RGT Planet, SJ111998, Ylitornion187
Qrbg_5H_1JHI_Hv50k_2016_2769995H396,6823.26 × 1065.4870.403−0.3161 + 2JLB06-034, RGT Planet, SJ11199851
Qrbg_5H_2SCRI_RS_1663745H272,385,7657.58 × 1076.1200.2890.3883Brage, Fairytale, Iron, RGT Planet57
Qrbg_7H_1JHI_Hv50k_2016_4447837H9,411,7452.97 × 102221.5280.065-1 to 4Gaffelbyg31
JHI_Hv50k_2016_4497467H14,735,6781.40 × 102625.8550.118−0.8324Gaffelbyg32
Publisher’s Note: MDPI stays neutral with regard to jurisdictional claims in published maps and institutional affiliations.

