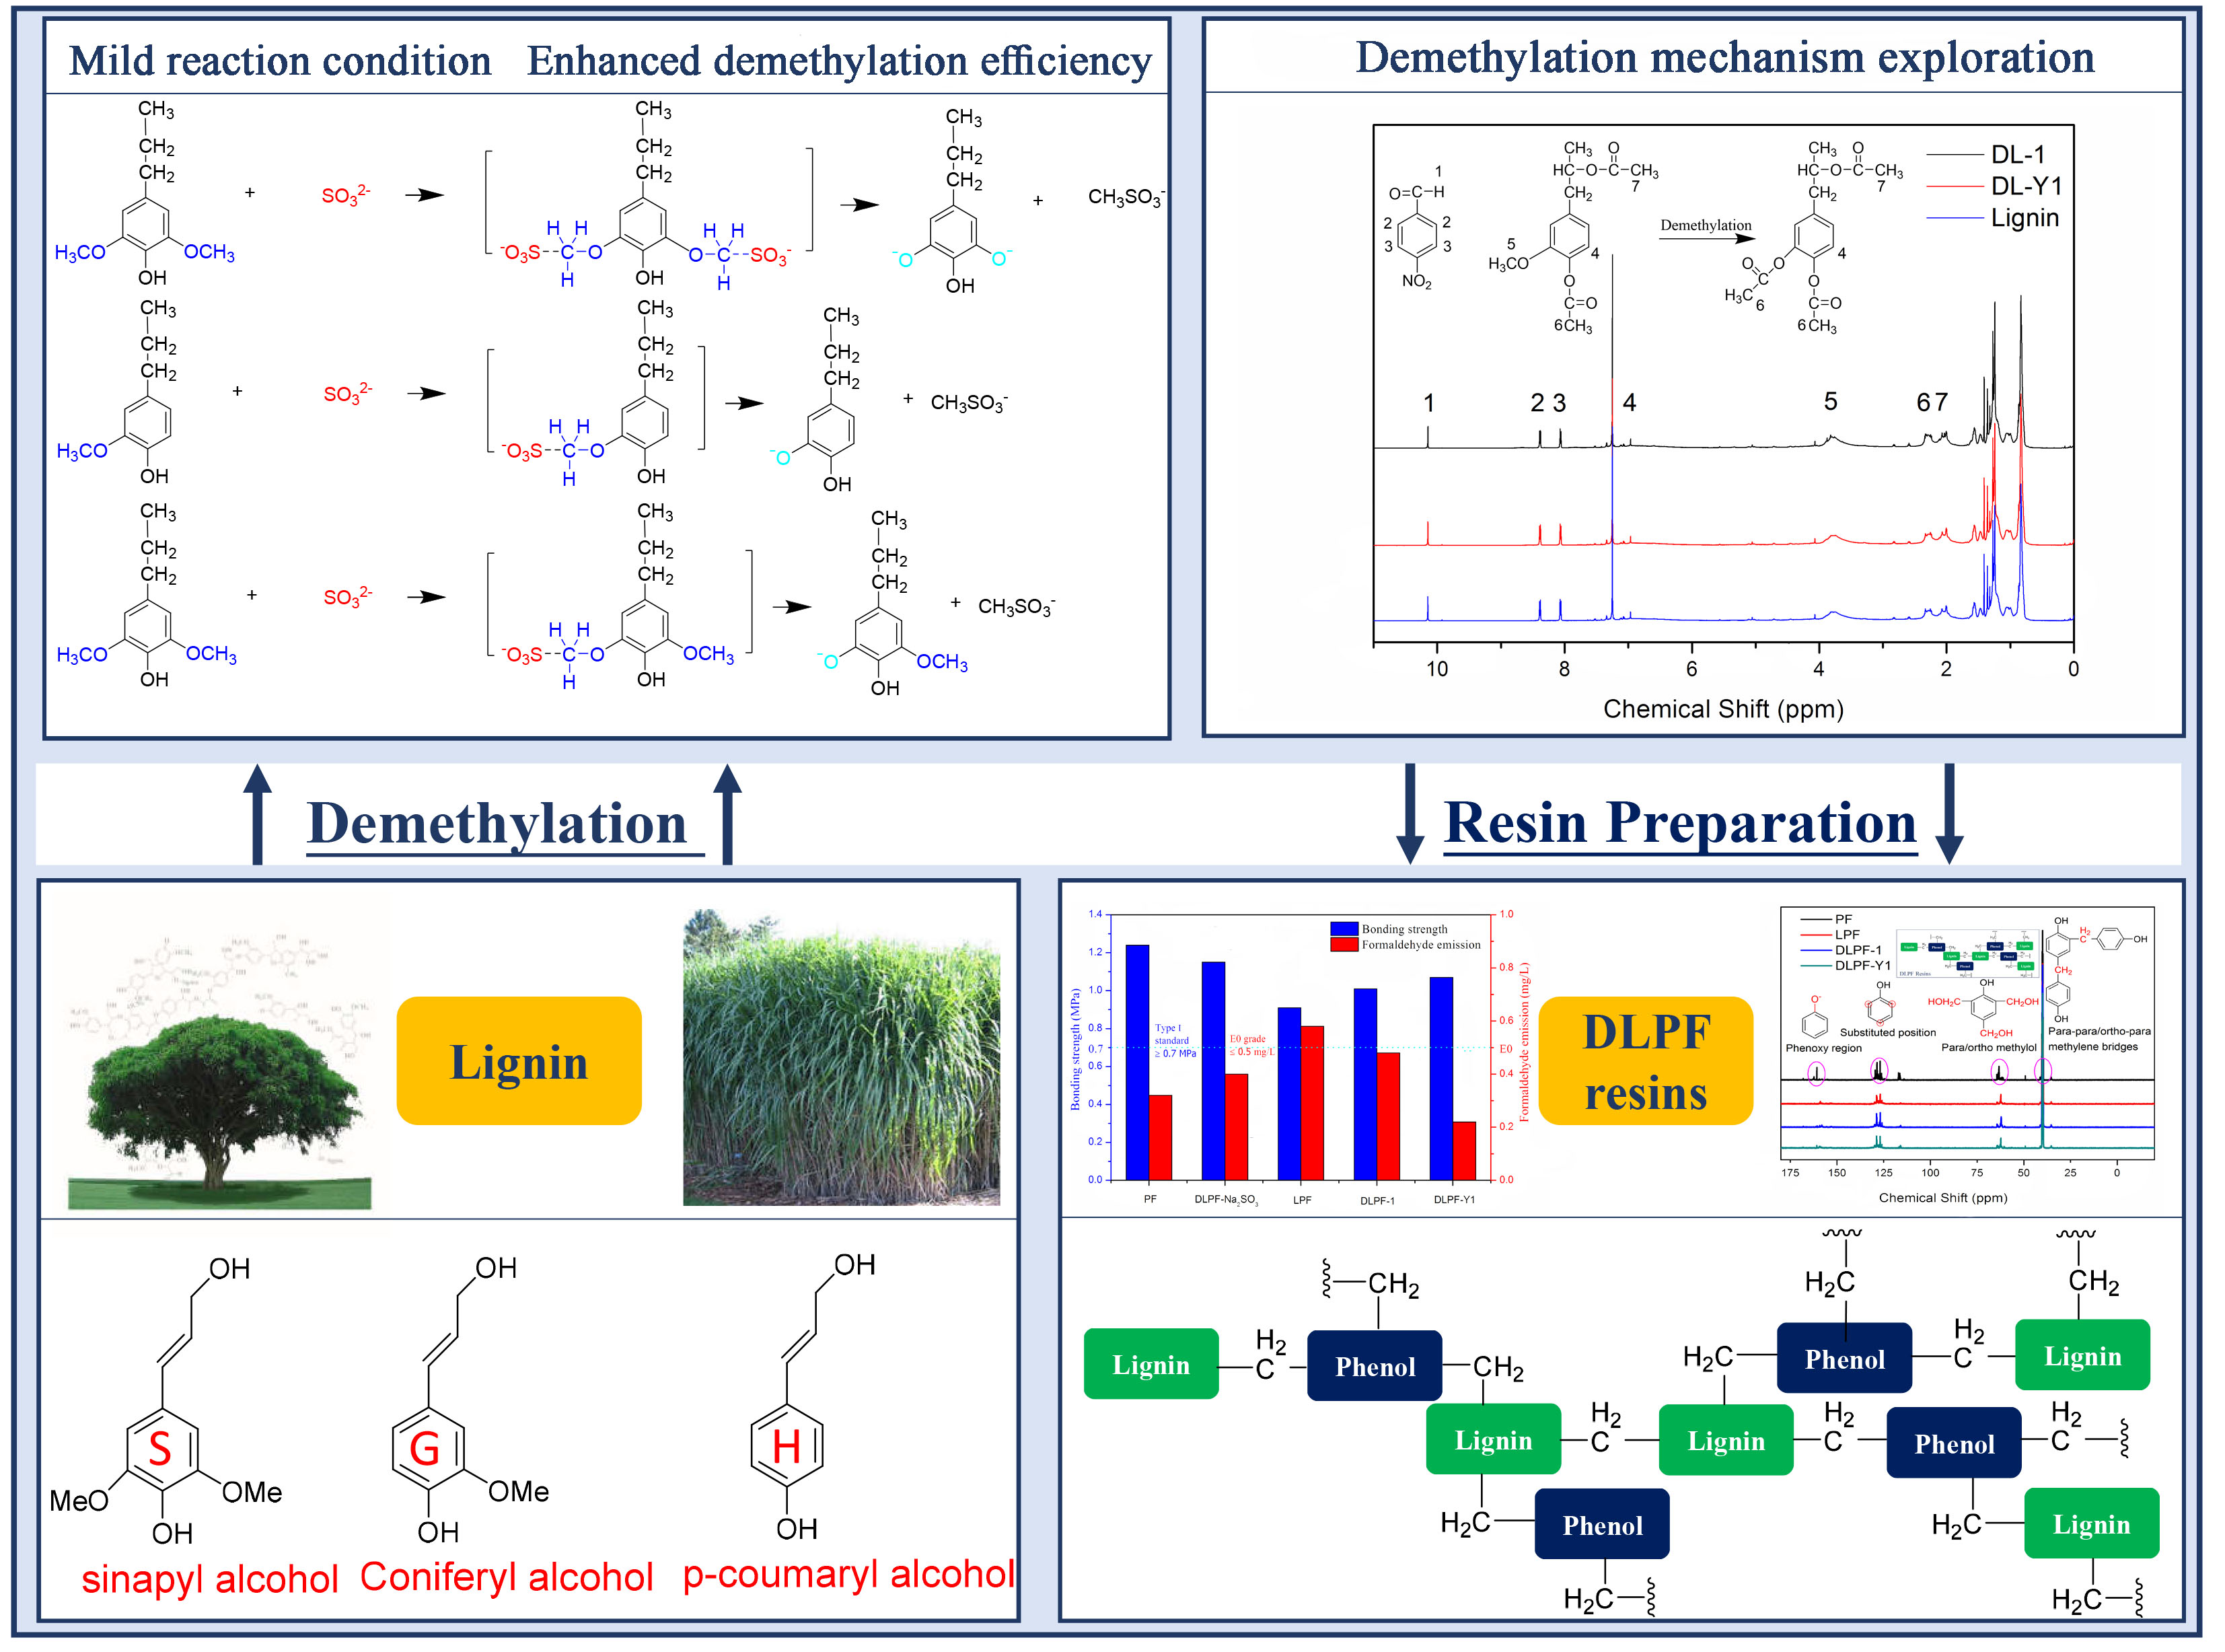
3.1. Demethylation and Characterization of Lignin
Demethylation of lignin was conducted under atmospheric pressure and low temperature, aiming to enhance demethylation efficiency and lignin reactivity for the preparation of fast curing bio-based phenolic resins. Na
2SO
3 was used as the demethylation catalyst, and three reaction parameters (reaction temperature, reaction time, and demethylation catalyst dosage) were studied. Reference to the experimental design theory, the orthogonal array L9 (3
4) was selected to arrange the test program (
Table 2). Plywood bonding strength is a significant property of phenolic resins, which can be used as an indicator of reaction reactivity between lignin and formaldehyde. In our hypothesis, plywood bonded by LPF resins possess low bonding strength because of the low reactivity of the original lignin, while plywood bonded by DLPF resins would exhibit high bonding strength due to the high reactivity of lignin benefited from the demethylation reaction. Hence, the bonding strength of plywood bonded by phenolic resins was selected as the criterion of each test.
As seen in
Table 2, ten experimental runs were tested, namely experiment 1 to 9, and the optimal combination test. K1, K2, and K3 stand for the estimates value (level 1–3) of bonding strength of the three investigated factors A, B, and C, respectively; k1, k2, and k3 stand for the general average of level 1–3; R stands for the range (the influence of variables on the results). The order of influence of each variable on the bonding strength appears to be A > C > B. Thus, the reaction temperature has the greatest influence and the reaction time has the smallest influence on the demethylation of lignin. The optimum level of each variable is A1, B2, and C3. Therefore, the optimum reaction conditions were as follows: reaction temperature is 80 °C, reaction time is 60 min, and demethylation catalyst dosage is 15%. As seen, the bonding strength of plywood bonded by DLPF resins all meet the standard for exterior-grade panels. In addition, the bonding strength of plywood prepared under the optimum reaction condition (Y1) was the highest, followed by the test 1 (experiment 1 in
Table 2). The formaldehyde emission and the relative absorbance of methoxyl groups of each test were also investigated. For most of the tests, the formaldehyde emission of plywood bonded by DLPF resins was below 0.5 mg/L reaching the E
0 grade, and the DL-Y1 products possessed the lowest relative absorbance values of methoxyl groups.
In view of the aforementioned discussion, the original lignin, DL-1 (DL products in test 1), and DL-Y1 (DL products in the optimum reaction condition test) were selected for further study. They were characterized by 1H-NMR and FT-IR measurement to study its chemical structure changes during the demethylation process. Prior to the 1H-NMR analysis, lignin was acetylated to enhance its solubility in organic solvent. The aromatic and aliphatic hydroxyl groups in the nine-carbon unit of lignin were all transformed into acetyl groups with the addition of excess acetic anhydride. Thus, the obtained acetylated lignin could be used for the quantitative analysis of hydrogen-containing functional groups by 1H-NMR spectroscopy.
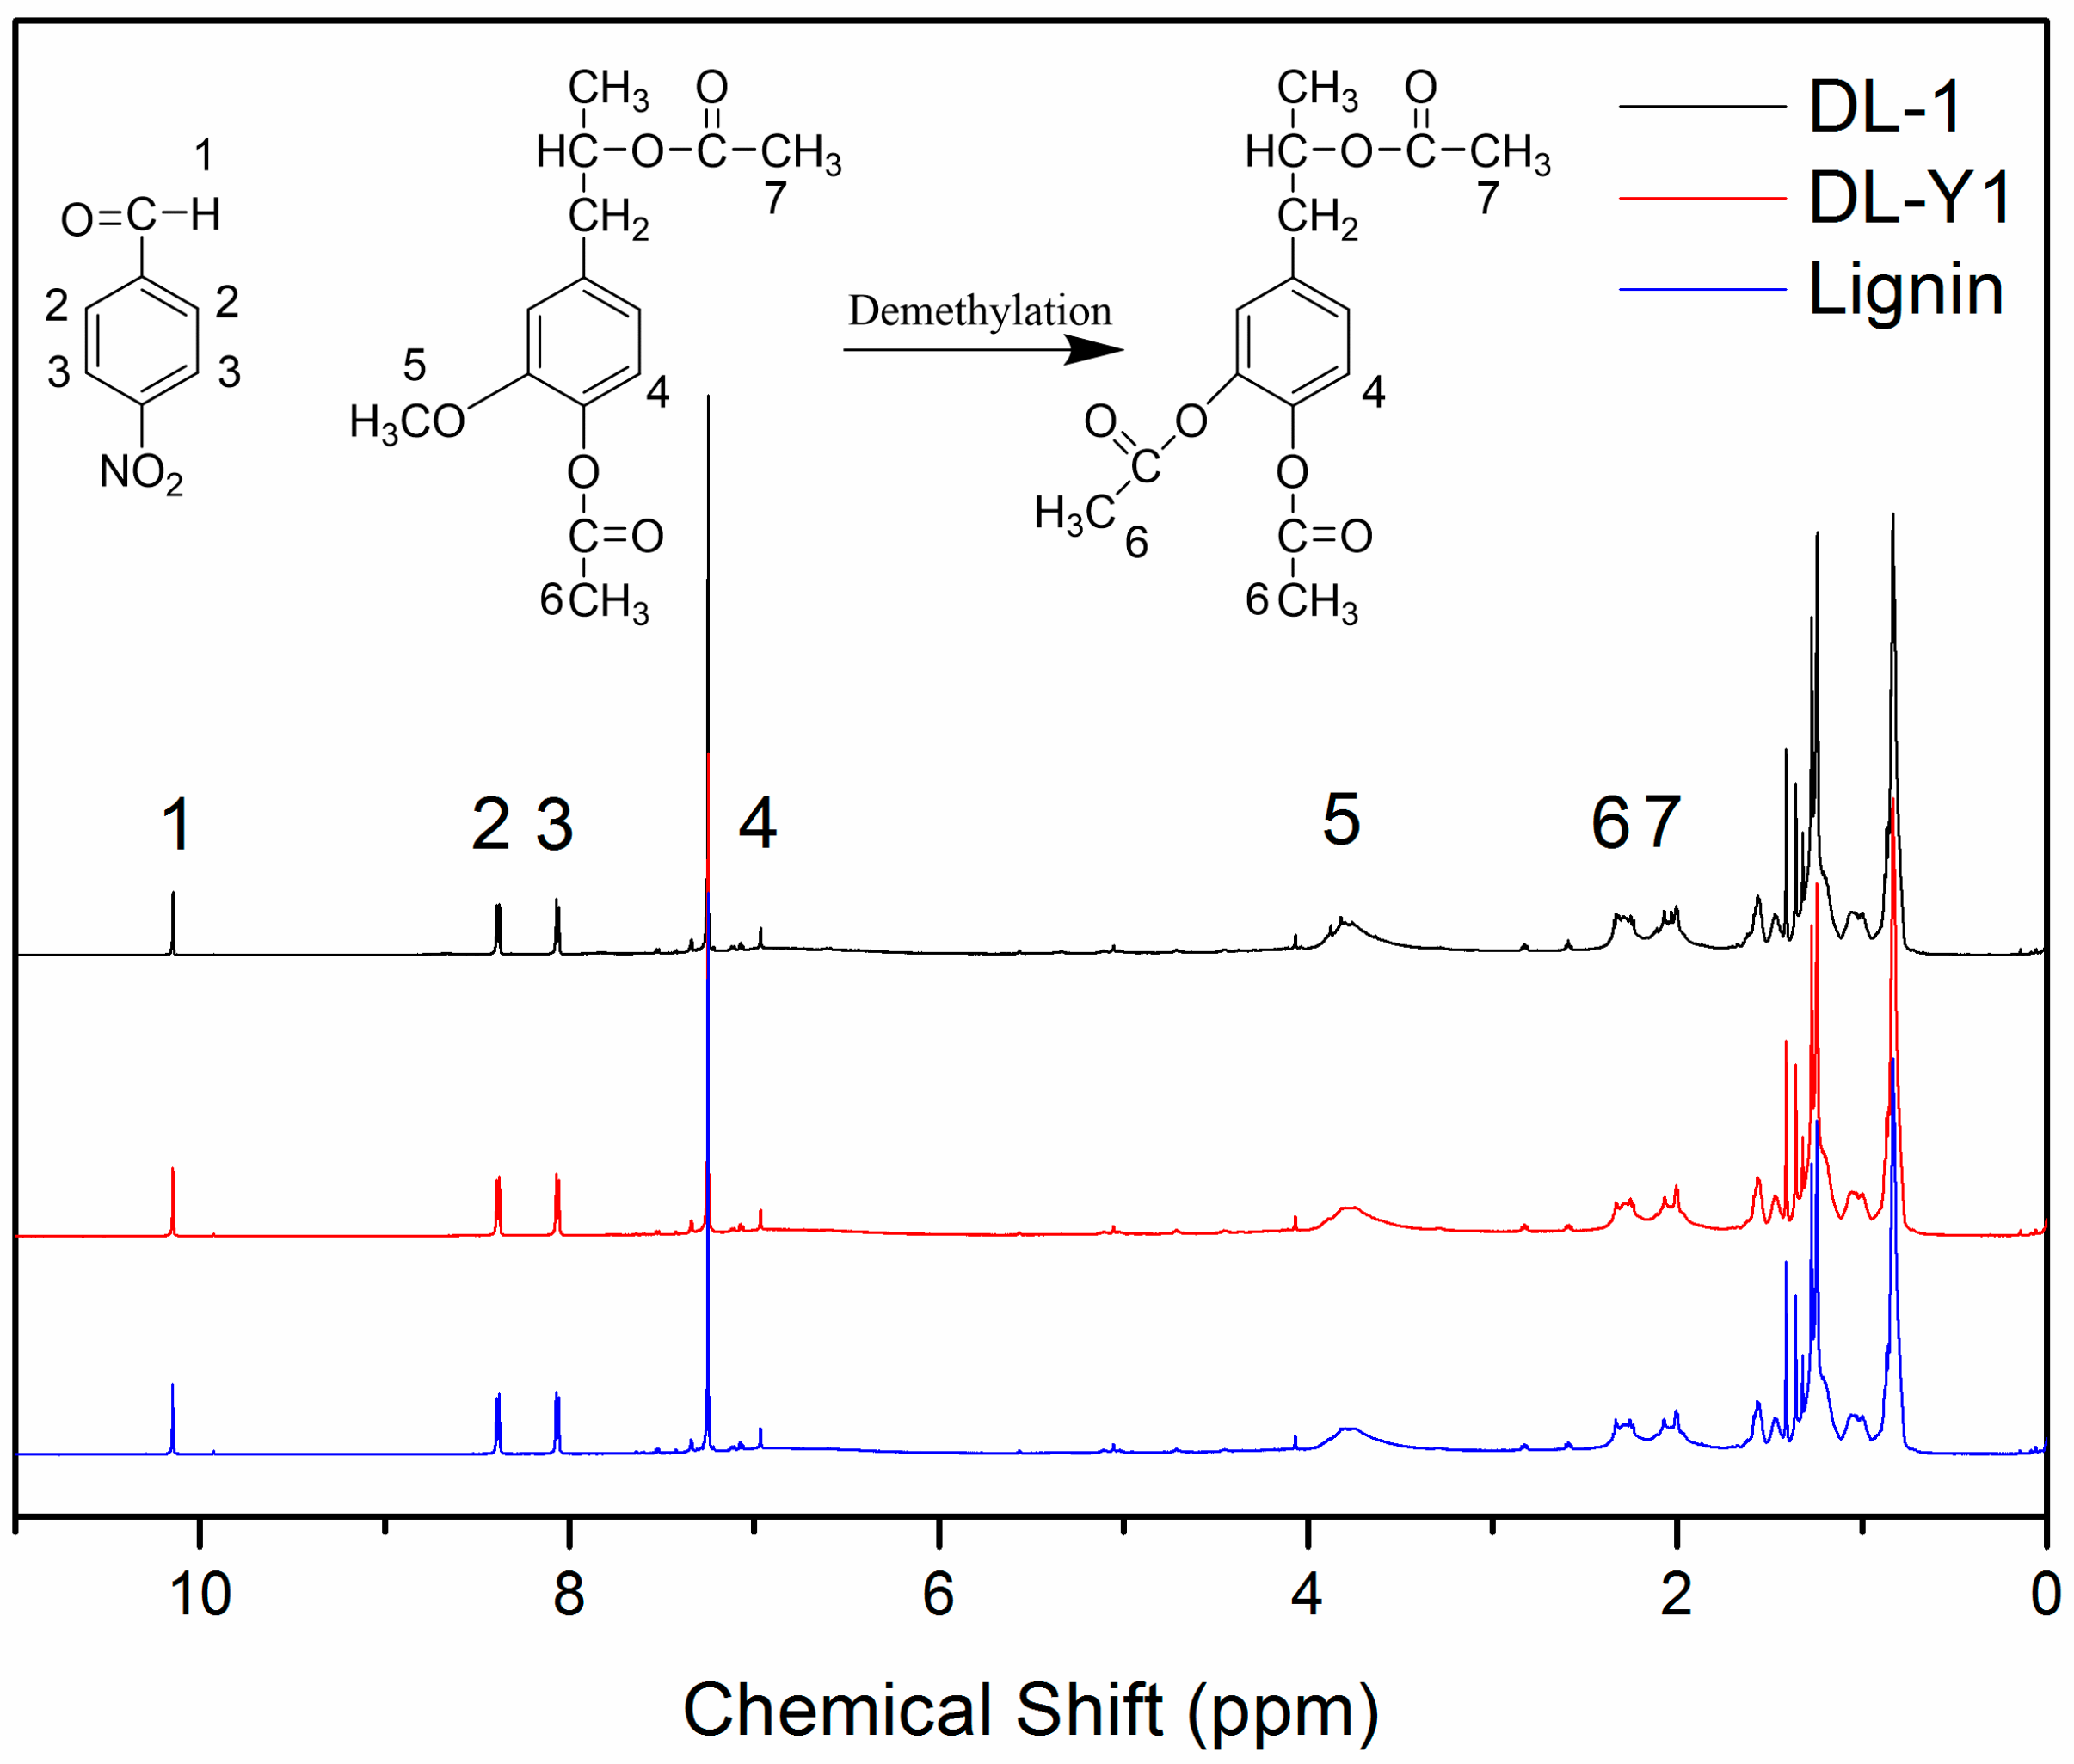
The
1H-NMR spectra of acetylated lignin are shown in
Figure 1. The proton signals observed at 10.15 ppm (peak 1) can be attributed to the protons in the –CHO of p-nitrobenzaldehyde, and the proton signals present at 8.39 ppm (peak 2) and 8.07 ppm (peak 3) are related to the aromatic protons in p-nitrobenzaldehyde. Protons attributed to the aliphatic moiety in lignin can be observed between 0.8 ppm and 1.5 ppm; and the protons related to the aromatic protons in S and G units exhibited between 6.0 ppm and 8.0 ppm [
27]. It should be pointed out that the proton signals observed at 6.96 ppm (peak 4) were assigned to the active proton at C5 position in the nine-carbon unit of lignin [
12]. The existence of such a proton signal (6.69 ppm) indicated that lignin used in this approach possessed active sites for methylolation reaction with formaldehyde. The proton signals at around 3.82 ppm (peak 5) were assigned to the methoxyl groups in lignin, which are closely related to proportion of G: S [
27,
28]. The protons in –CH
3 of the aromatic and aliphatic acetyl groups were observed at 2.27 ppm (peak 6) and 2.03 ppm (peak 7), respectively [
27]. As can be seen in
Figure 1, peak 5 was observed in all
1H-NMR spectra, indicating the existence of methoxyl groups in all of the tested lignin. While the decreased intensity of peak 5 in the spectra of DL products indicated that some methoxyl groups were demethylated under the mild reaction condition. Compared to the original lignin, the proton signal intensity of peak 6 slightly increased, which could be attributed to the increase of aromatic acetyl group content in the tested DL products. These phenomena observed in the
1H-NMR spectra revealed that with the addition of demethylation catalyst, methoxyl groups in the nine-carbon unit of lignin were attacked by nucleophiles, and some methoxyl groups were converted to phenolic hydroxyl groups by a nucleophilic substitution reaction, resulting in DL products with higher content of phenolic hydroxyl groups and lower content of methoxyl groups.
A quantitative analysis method was adopted to accurately investigate the chemical structure changes of lignin demethylated under mild condition using Na
2SO
3 as the demethylation catalyst. As seen in
Figure 1, the intensity and/or the area of peak 2 and peak 3 were similar to each other. Therefore, peak 2 and peak 3 were used as internal standard for the evaluation of specific functional group content. The calculation process and the calculated results for evaluating the relative content of specific functional groups are shown in
Table 3. As seen, the aromatic protons in p-nitrobenzaldehyde exhibited similar molar amount in the three tested samples (0.69 m mol/g for lignin, 0.70 m mol/g for DL-1, and 0.71 m mol/g for DL-Y1), which was caused by the same mass fraction of
p-nitrobenzaldehyde in 1 g of lignin. The methoxyl group content in lignin was 1.93 m mol/g, while the methoxyl group content in DL-1 and DL-Y1 was 1.82 m mol/g and 1.09 m mol/g, respectively. With the demethylation of lignin, the content of aromatic acetyl groups increased from 0.53 m mol/g (acetylated lignin) to 0.58 m mol/g (acetylated DL-1) and 0.76 m mol/g (acetylated DL-Y1), respectively. In addition, the total content of acetyl groups in the acetylated DL was higher than that in the acetylated lignin. As mentioned above, the aromatic acetyl groups emerged by the acetylation reaction of phenolic hydroxyl groups in lignin, and the aliphatic acetyl groups were formed by acetylation reaction of aliphatic hydroxyl groups. Therefore, the content of aromatic and aliphatic acetyl groups in the acetylated lignin was the same with the phenolic and aliphatic hydroxyl group content. Thus, with the addition of demethylation catalyst, the phenolic hydroxyl group content increased from 0.56 m mol/g (lignin) to 0.61 m mol/g (DL-1) and 0.82 m mol/g (DL-Y1), respectively. Furthermore, the total hydroxyl group content in DL was higher than that in lignin. These results confirmed that the methoxyl groups in lignin were transformed in phenolic hydroxyl groups by demethylation reaction under mild condition, and the optimum reaction condition facilitated more rapid demethylation reaction. Wu et al. [
24] reported that the methoxyl groups content in soda lignin decreased by about 41.4% after demethylating in autoclave at 220 °C for 10 min. In our approach, the methoxyl groups content decreased by about 43.5%, which was slightly higher than the results reported by Wu et al. In addition, the demethylation of lignin in our approach was performed at mild condition without the use of high pressure and high temperature. Therefore, the demethylation method in this approach had improved demethylation efficiency and the DL products were supposed to have an enhanced reactivity. Moreover, the demethylation of lignin using sodium sulfite as a catalyst under mild condition is an efficient, environmentally friendly, and cost-effect demethylation technique.
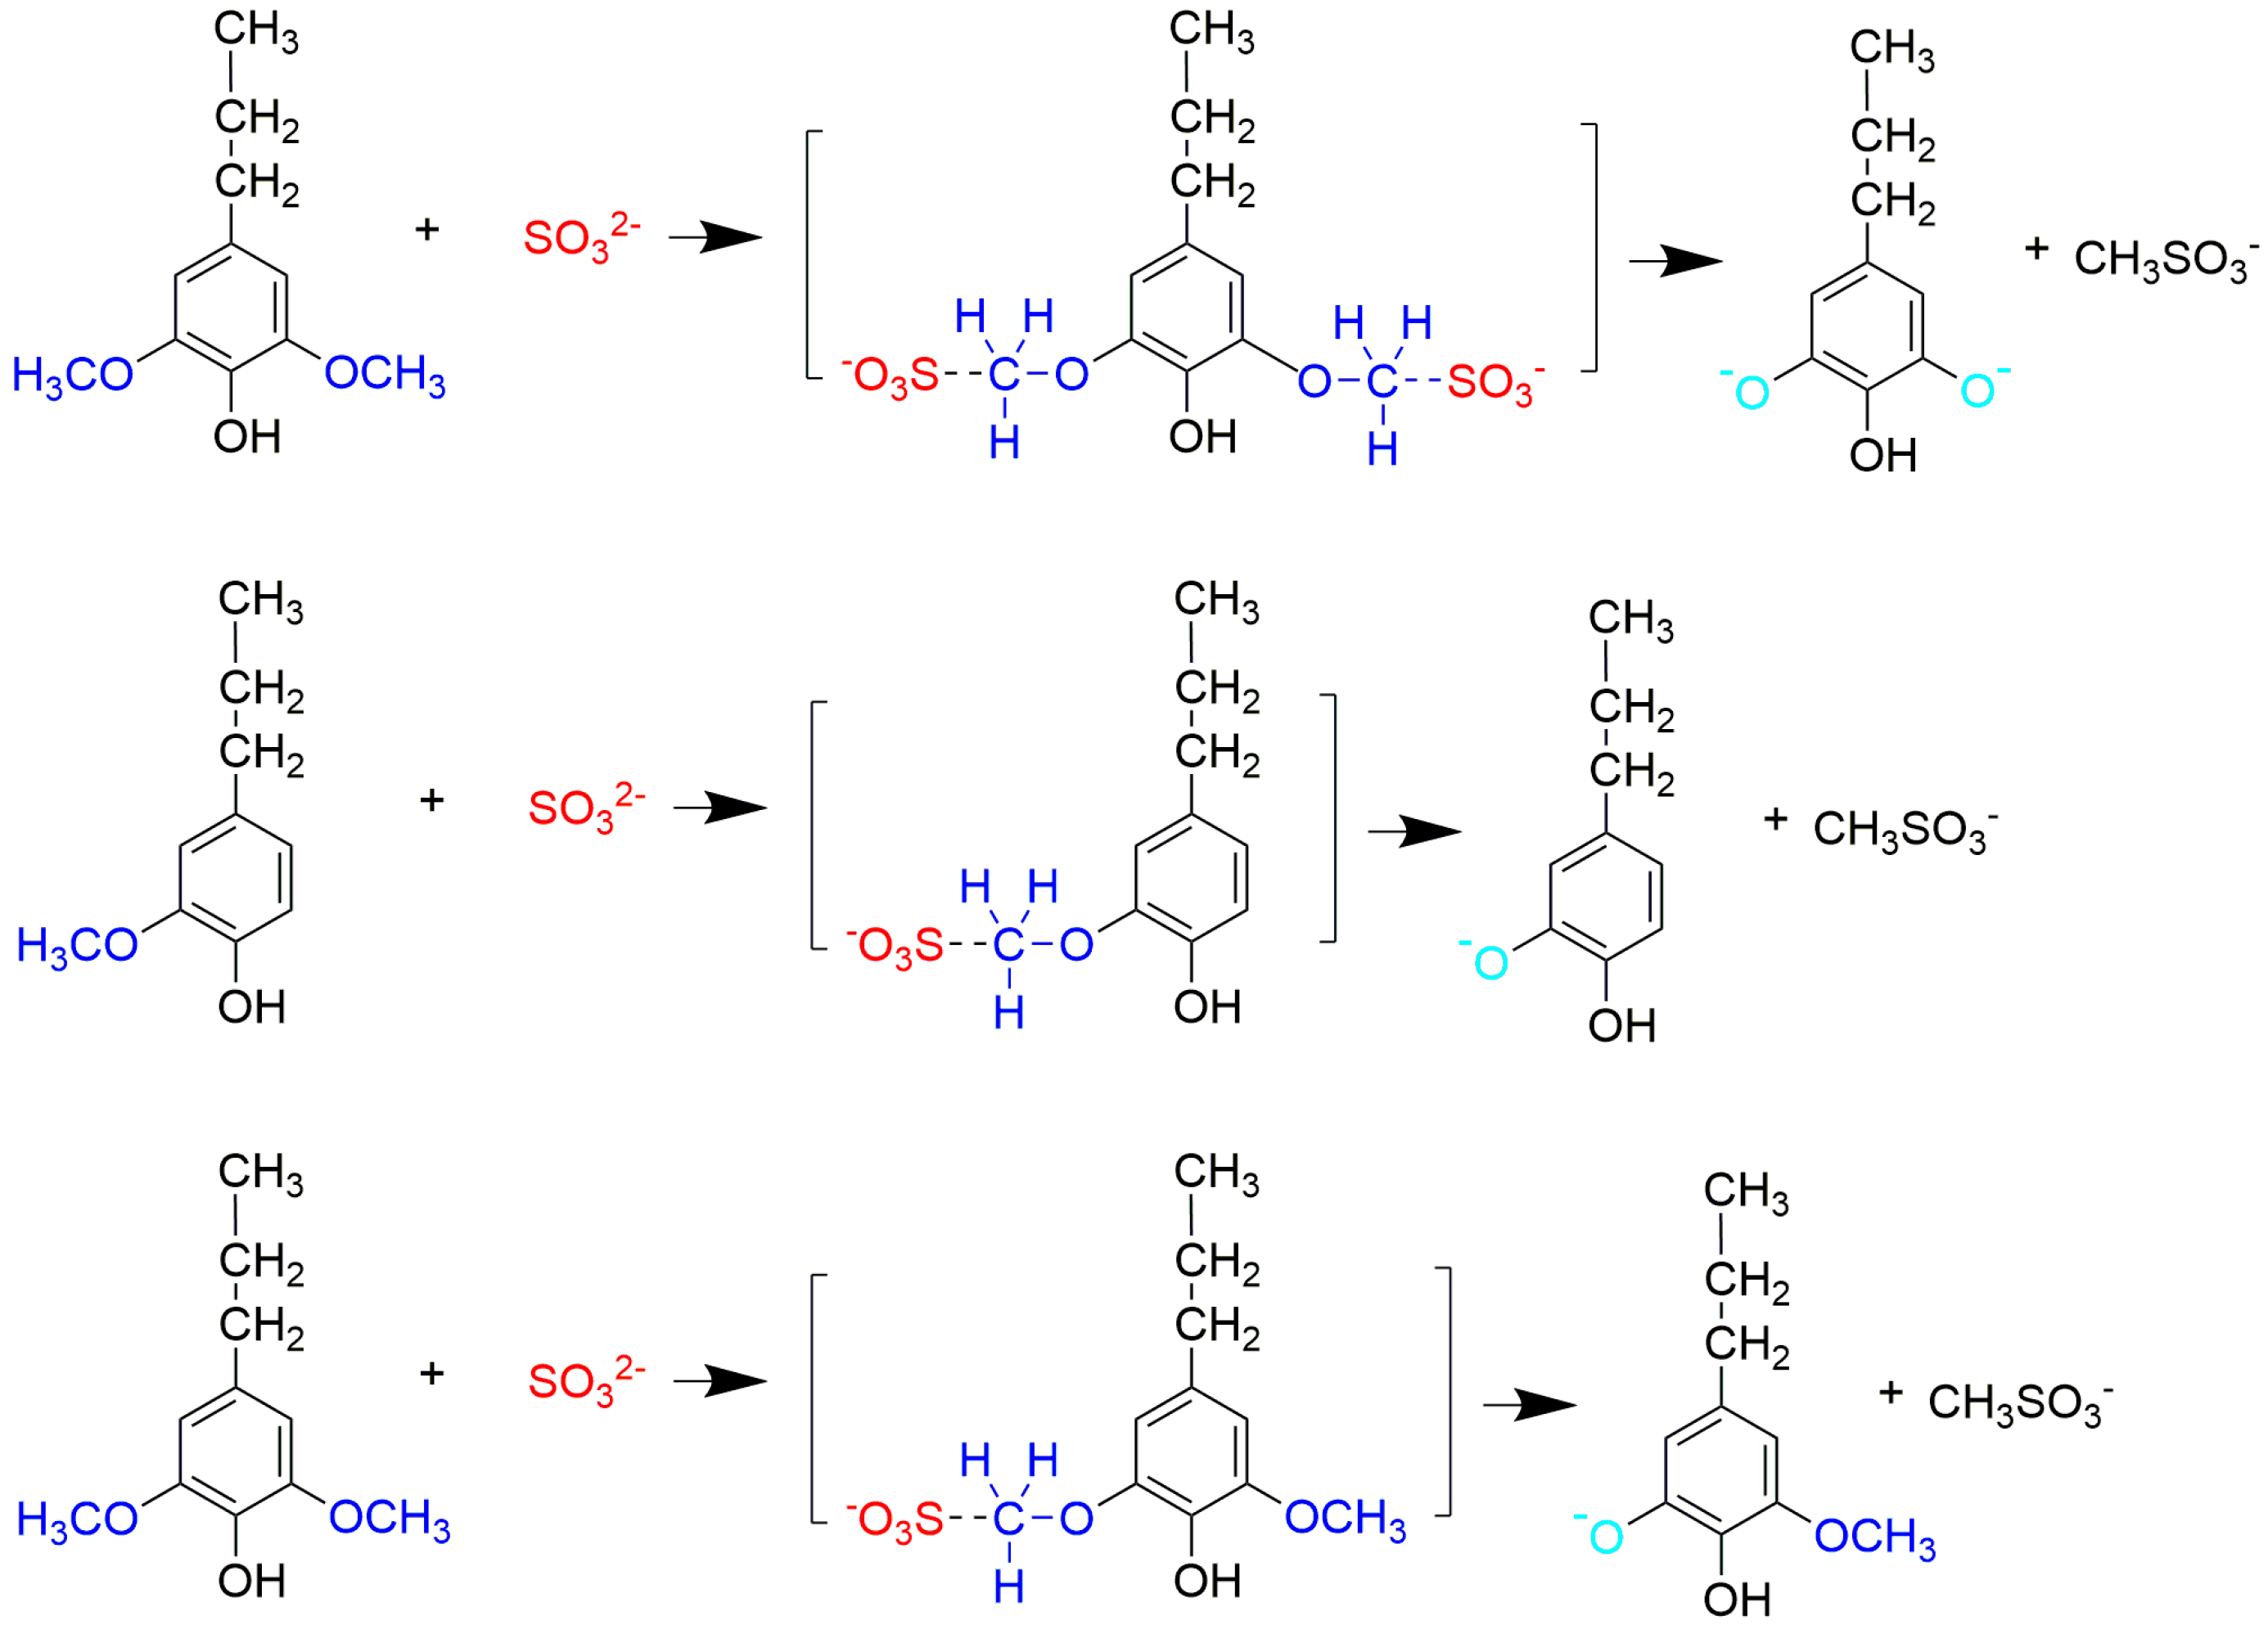
Based on the above results, we proposed a demethylation mechanism to illustrate the demethylation of lignin (
Figure 2). During the demethylation process, the sulfite ion at the side of methoxyl groups acted as the nucleophilic reagent, and the aryl methyl ethers of lignin compounds were cleaved by nucleophilic substitution reaction, resulting in the removal of methoxyl groups and the formation of phenolic hydroxyl groups.
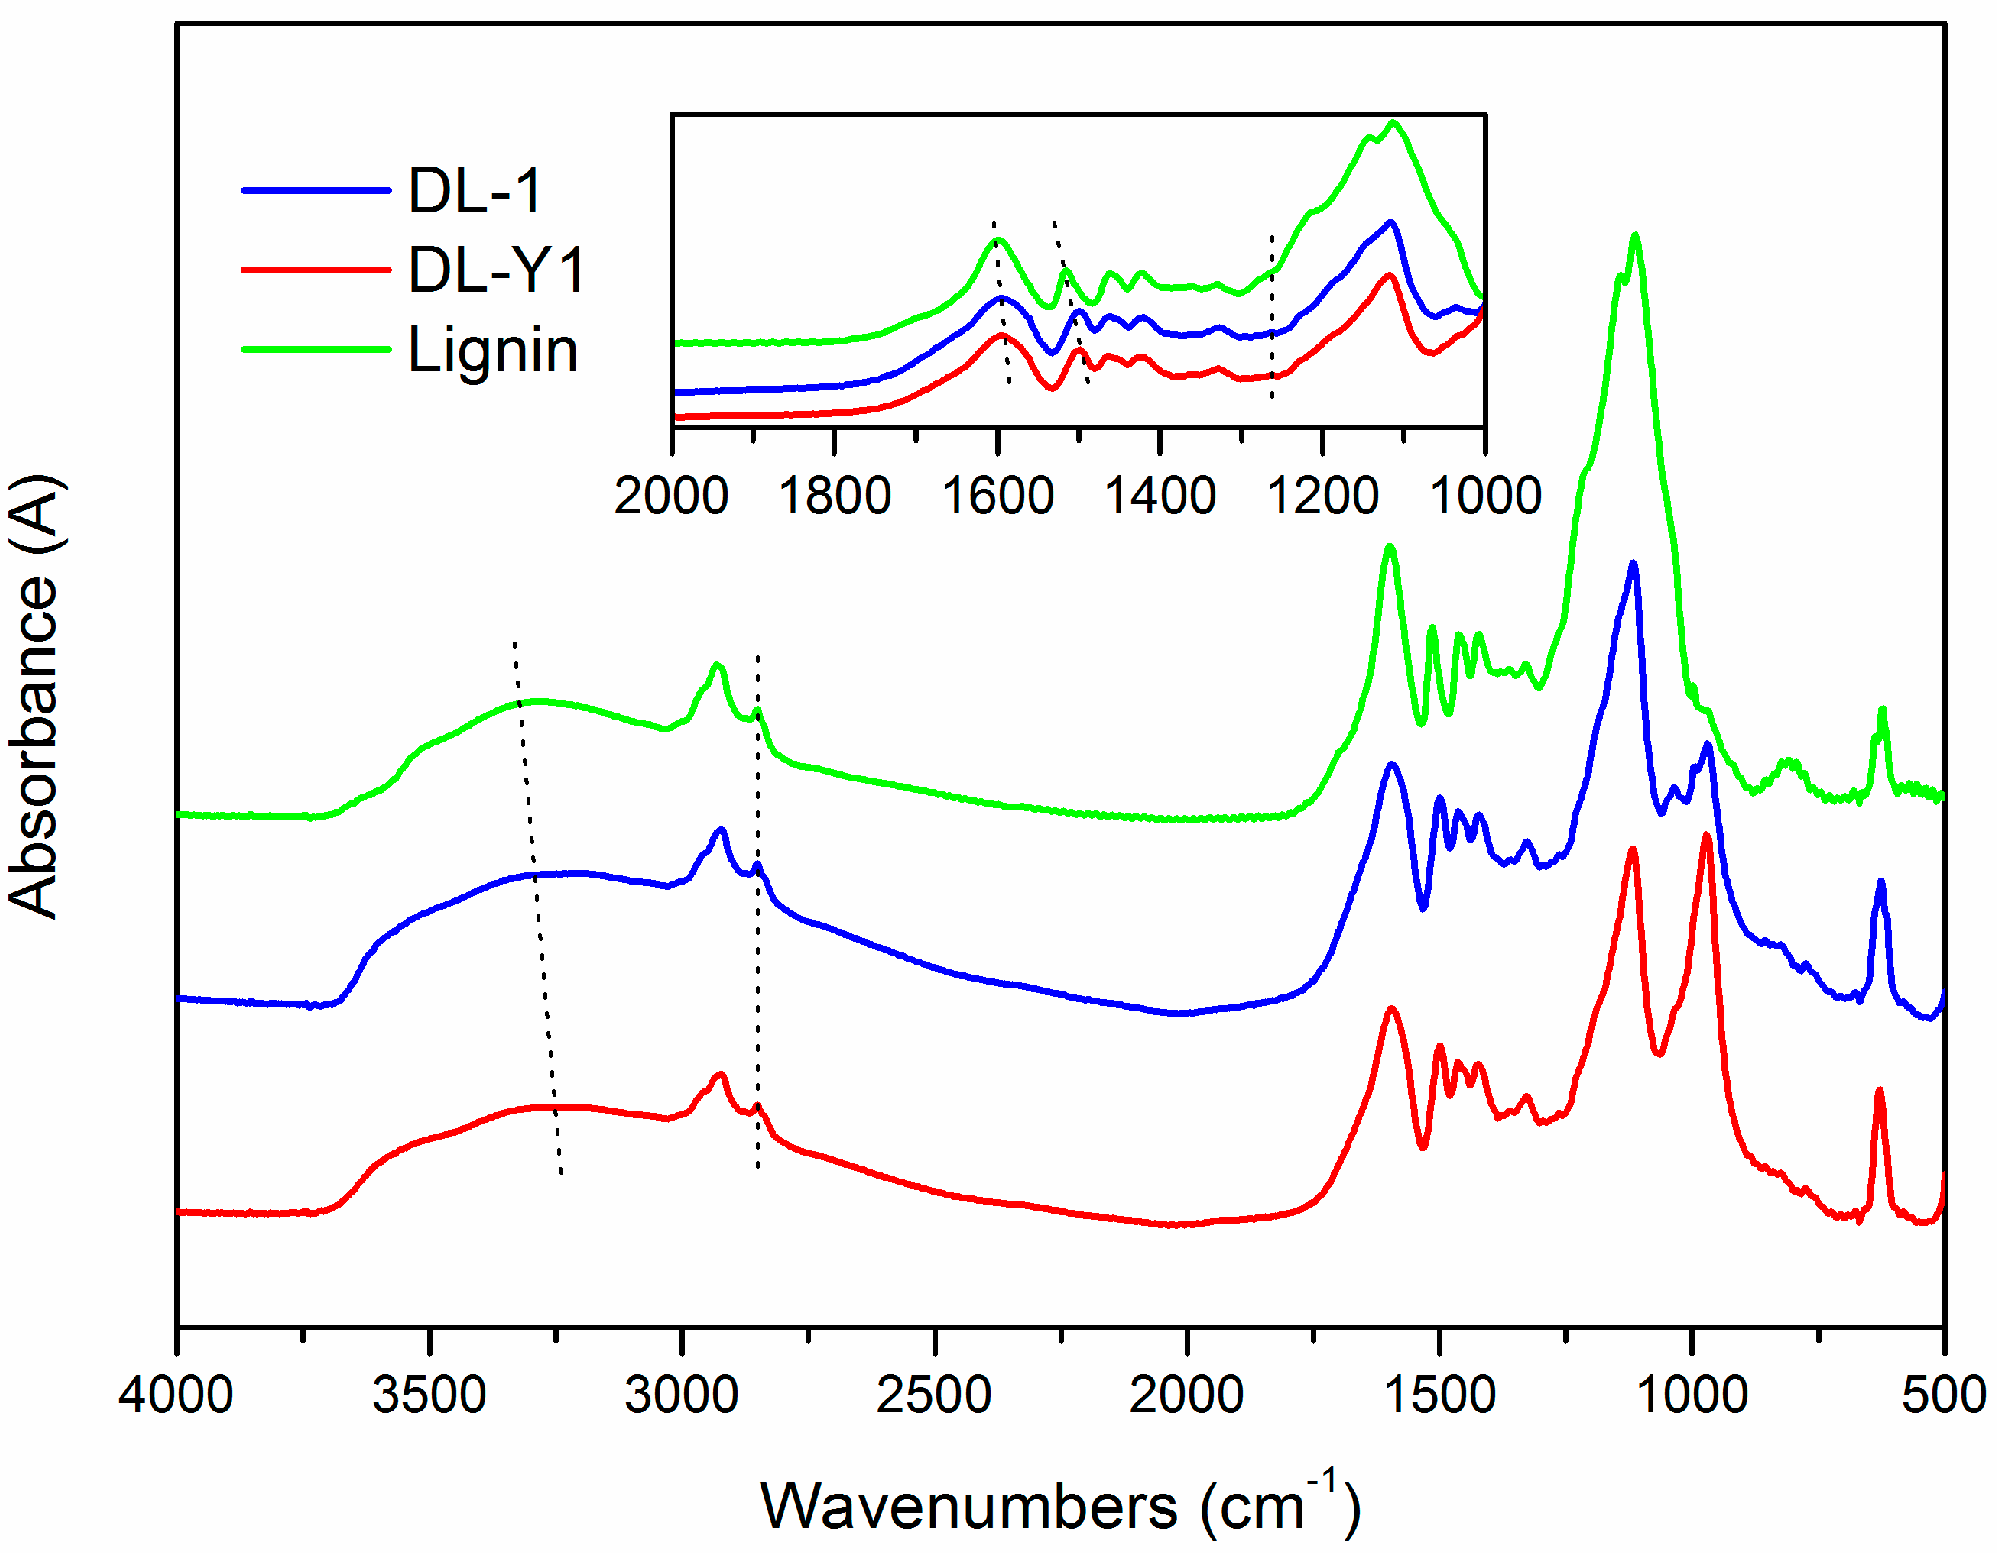
To further verify the demethylation mechanism, FT-IR analysis was conducted. The FT-IR spectra (
Figure 3) revealed that the main functional groups presented in lignin were similar to that of DL, indicating structural similarity between them. As for the spectrum of lignin, the absorption bands at 3283 cm
−1 were related to the aromatic and aliphatic –OH groups. The C–H vibration of –CH
2 and –CH
3 groups were represented by the band of 2929 cm
−1, and the bands at 2851 cm
−1 and 1461 cm
−1 were assigned to the C–H vibration of –OCH
3 groups [
27]. The presence of absorption bands at 1598 cm
−1, 1515 cm
−1 and 1422 cm
−1 in the spectrum of lignin were assigned to the aromatic ring vibrations of the phenyl-propane skeleton. The peak of 1515 cm
−1 was attributed to the aromatic skeletal vibrations coupled with C–H plane deformation. While the 1422 cm
−1 band corresponded to the aromatic ring vibration affected by the nature of the ring substituent and coupled to C–H in plane deformations [
12,
14]. The aromatic C–H in plane deformation vibration in the syringyl moiety of lignin can be seen at 1329 cm
−1 and 1113 cm
−1, while the aromatic C–H out of plane deformation vibration in the guaiacyl moiety of lignin presented at 808 cm
−1 [
27].
As seen in
Figure 3, there are some differences between the FT-IR spectra of lignin and DL products. For example, the absorption bands attributed to –OH stretching vibrations that appeared at 3283 cm
−1 shifted to low wavenumbers (3203–3233 cm
−1), reflecting the enhanced hydrogen bonding interactions (either –NH and –OH) and the increase of phenolic hydroxyl groups in the lignin polymer networks [
29]. In addition, the absorption bands assigned to the aromatic ring vibrations of the phenyl-propane skeleton were shifted from 1598 cm
−1 and 1515 cm
−1 to 1595 cm
−1 and 1499 cm
−1, respectively. This hypsochromic shift benefited from the cleavage of the –OCH
3 groups in the nine-carbon unit of lignin, which was consistent with the increase of phenolic hydroxyl groups. The presence of peaks at 1263 cm
−1 in the spectra of DL was caused by C–O in plane deformation vibration in phenolic hydroxyl groups, which was absent in the spectrum of lignin. Furthermore, the relative absorbance values of –OCH
3 groups in DL was lower than that in lignin based on a semi-quantitative analysis method, and DL-Y1 possessed the lowest relative absorbance values amongst the tested lignin. The appearance of bands at around 971 cm
−1 indicated the presence of sulfonic groups in the DL products [
30]. The intensity of the peak at 971 cm
−1 in the spectrum of DL-Y1 was higher than that of DL-1, indicating there were more sulfonic groups in DL-Y1 than that in DL-1. These results confirmed that –OCH
3 groups were cleaved and the phenolic hydroxyl groups emerged during the lignin demethylaton process under mild reaction condition, which was consistent with the
1H-NMR analysis.
It has been reported that the methoxyl groups at the ortho positions to the aromatic hydroxyl in the nine-carbon unit of lignin will hinder the reactivity of its free phenolic hydroxyl groups. If the –OCH
3 groups could be removed and demethylated, the demethylated lignin products would have far more free phenolic groups and its reactivity could be significantly enhanced [
13]. Previous works reported that methoxyl groups in lignin were removed through a nucleophilic substitution reaction when the aryl methyl ethers were attacked by nucleophiles such as S and HS
−, resulting in demethylated lignin with lower content of methoxyl groups and higher content of phenolic hydroxyl groups [
13,
19]. However, the rigid reaction condition obstructed their industrial applications. In this approach, Na
2SO
3 was used as the demethylation catalyst, and alkali lignin was demethylated under mild reaction condition. FT-IR and
1H-NMR analysis revealed that methoxyl groups in alkali lignin were successfully transformed into phenolic hydroxyl groups by nucleophilic substitution reaction with high demethylation efficiency. The obtained DL products possessed higher phenolic hydroxyl group content and lower methoxyl group content than the original lignin. In addition, the total hydroxyl group content of DL was also higher than that of lignin. It was believed that phenolic hydroxyl groups could activate the free ring positions in lignin, promoting the polymerization of phenolic resins. Therefore, the obtained DL-1, DL-Y1, and lignin were used for the fabrication of fast curing bio-based phenolic resins, and PF resins synthesized by phenol and formaldehyde were used as a control.
3.2. Chemical Structure Characterization of DLPF Resins
To study the structural changes between PF, LPF, and DLPF resins, FT-IR spectra were recorded. As seen in the FT-IR spectra (
Figure 4), the functional groups presented in all the phenolic resins were similar to each other, indicating they share a common molecular structure.
The wide absorption bands at around 3260 cm
−1 corresponded to –OH bridging groups in all phenolic resins, and the small peaks at the range of 2850–2923 cm
−1 were associated with the methylene bridges [
31]. The absorption bands at 1606 and 1446 cm
−1 were related to the aromatic ring vibrations of the phenyl-propane skeleton, and bands at 1668 cm
−1 can be attributed to unconjugated carbonyl groups [
15]. The band at 1244 cm
−1 were ascribed to the presence of C–O stretching vibration of the phenolic hydroxyl groups, while the C-O stretching vibration of aliphatic C–O(Ar), aliphatic C–OH and methylol C–OH were represented by the band of 1020 cm
−1 [
32]. It was observed that the absorption band at 1250 cm
−1 in the spectra of the LPF and DLPF resins was weaker than that of the PF resins, revealing that there were more C–O stretching vibrations of the phenolic hydroxyl groups in the PF resin than in the LPF and DLPF resins. This was because in the bio-based phenolic resins phenol was partly substituted by lignin containing both a phenolic units and non-phenolic units, resulting in lower phenolic hydroxyl group content [
16]. It could be seen that the band at 1020 cm
−1 of LPF and DLPF resins was broader than that in the PF resins, because three were more methylol-OH and aliphatic-OH in LPF and DLPF resins. This phenomenon was in agreement with previous reports [
15,
16]. The peak at 977 cm
−1 was associated with C-H stretching vibration of vinyl in PF resin, which was absent in the spectra of LPF and DLPF resins.
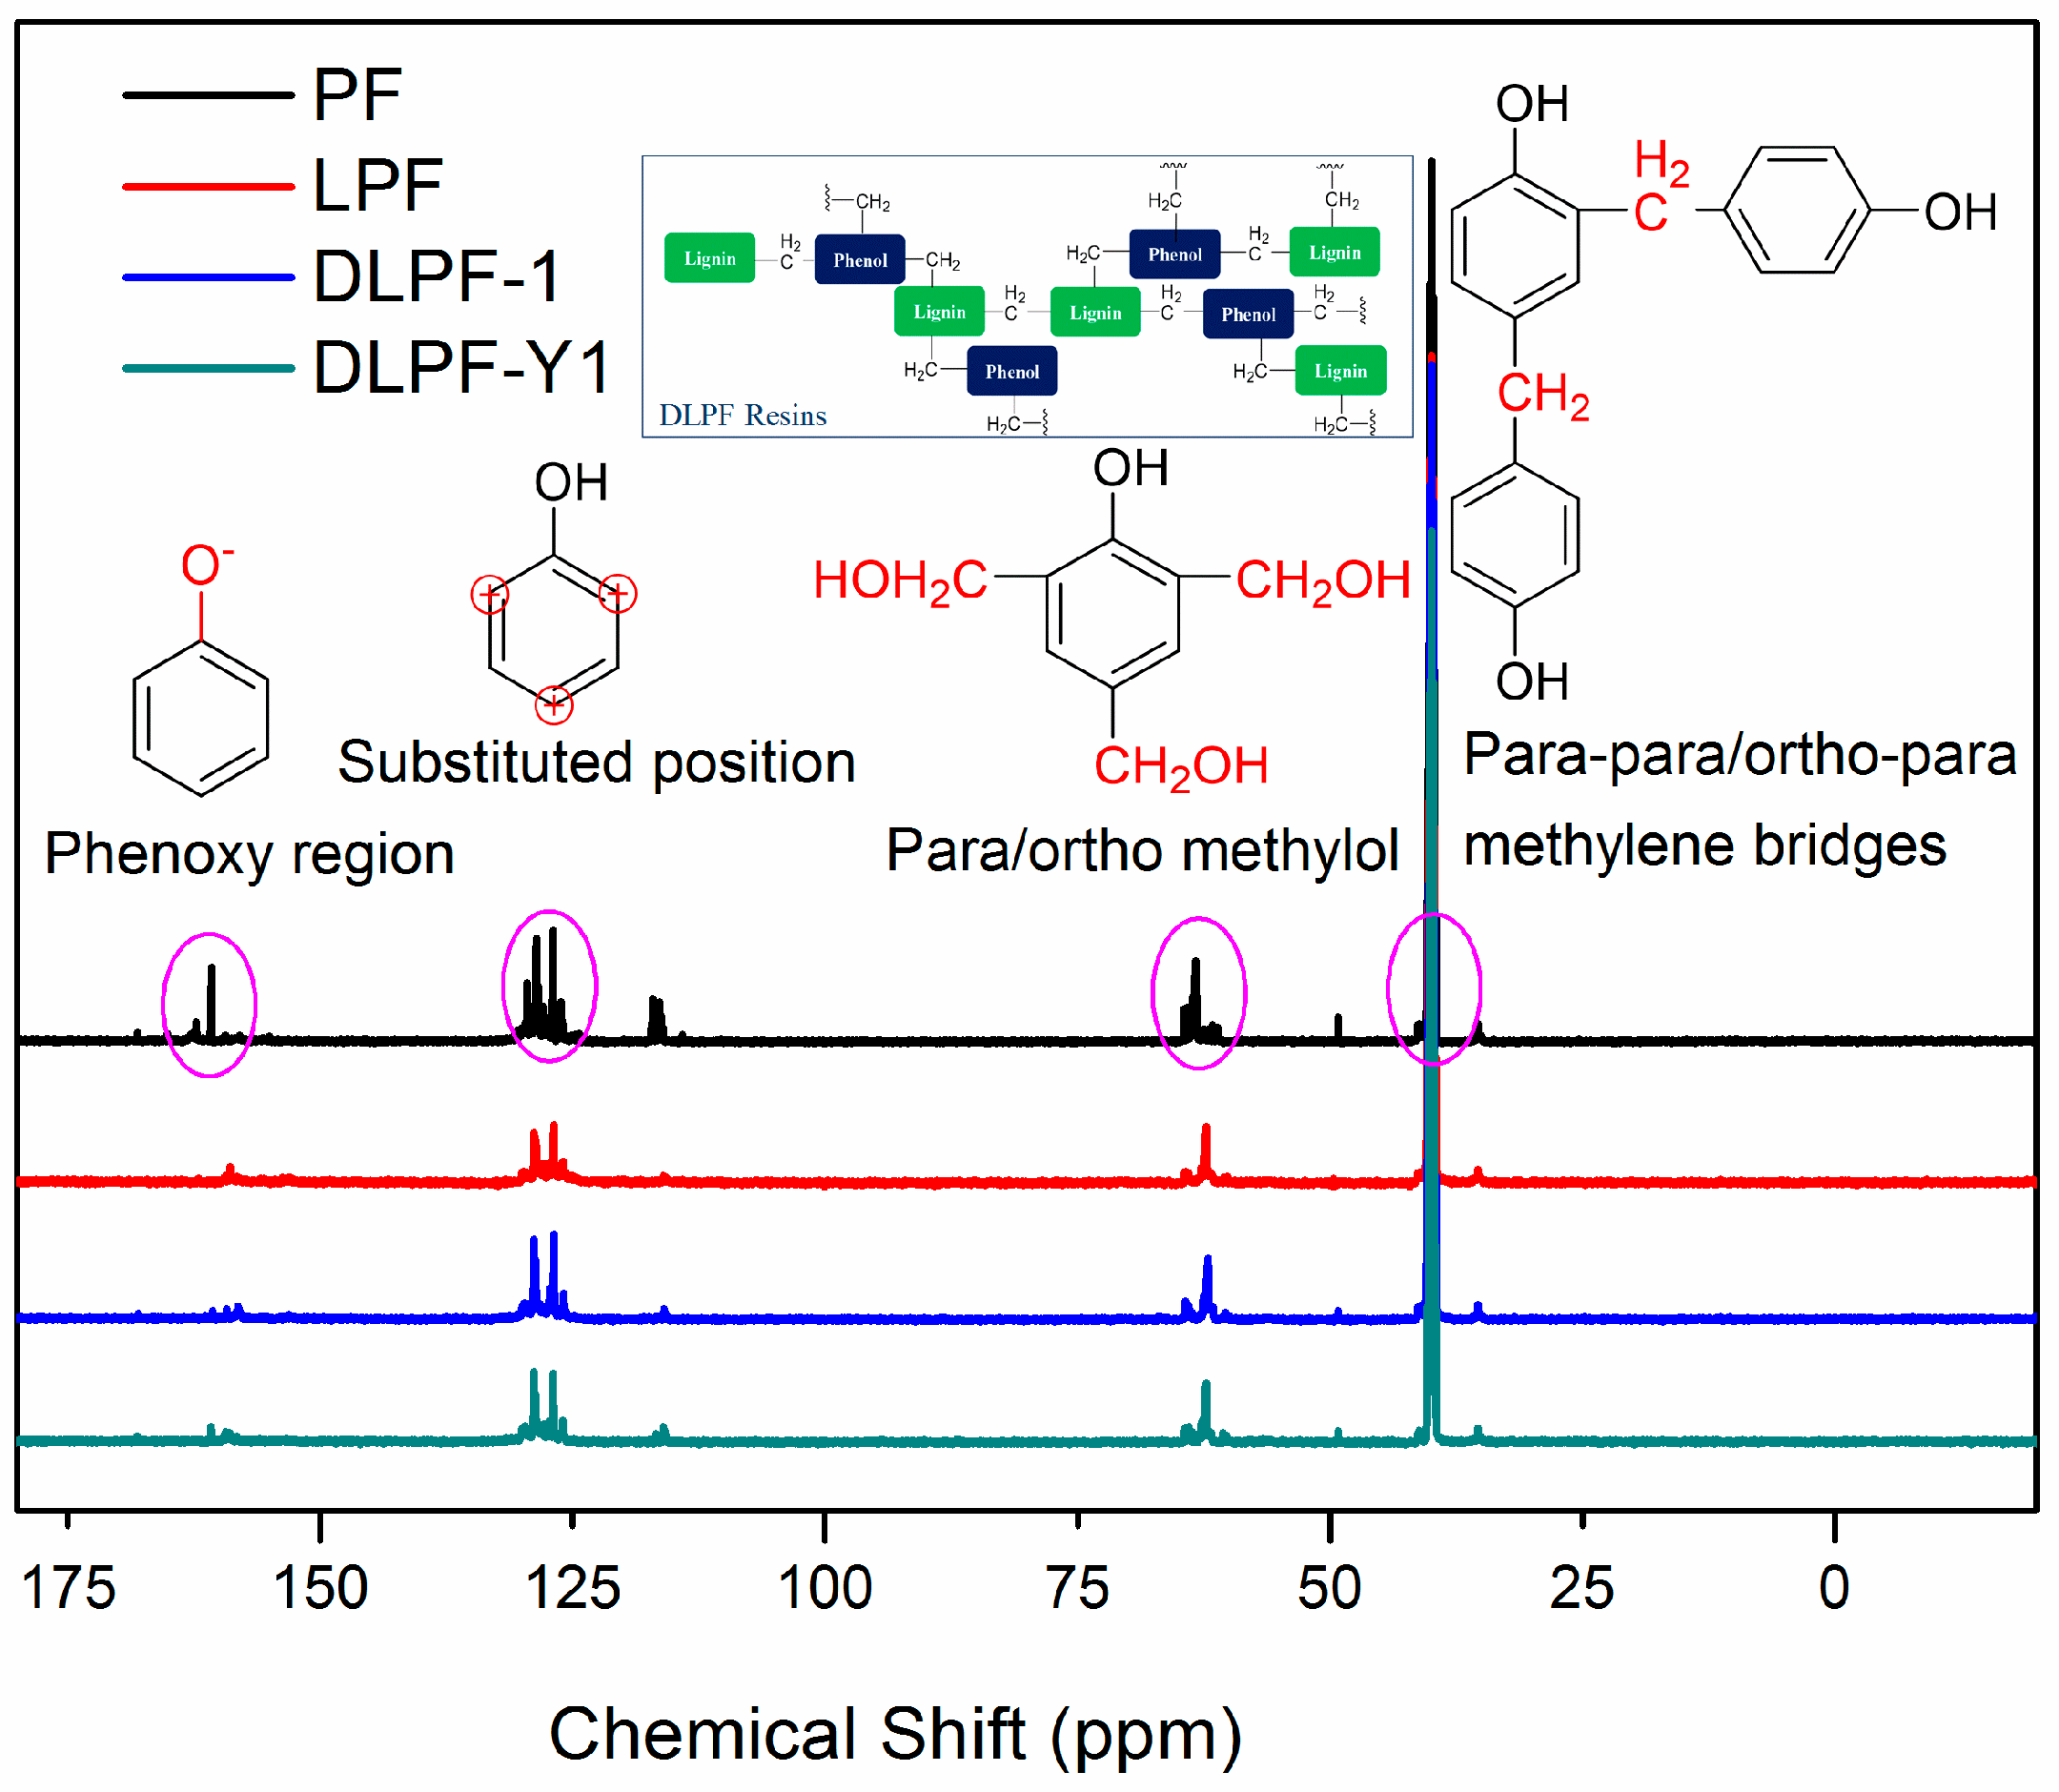
To identify the effect of different lignin on the functional groups of phenolic resins, liquid-state
13C-NMR was used to investigate the difference of chemical shifts between the pure PF resins and the bio-based phenolic resins. The liquid-state
13C-NMR spectra of various freeze-dried PF, LPF and DLPF resins are shown in
Figure 5. As seen, the
13C-NMR spectra of PF resins were similar to that of the bio-based phenolic resins, indicating that the bio-based phenolic resins exhibited molecular structure similar to the PF resins, which agreed with the FT-IR analysis. The chemical shift of 154.0–163.0 ppm was related to phenoxy carbons, and the para alkylated groups and ortho alkylated groups were observed at 160.7–162.8 ppm and 154.4–160.2 ppm, respectively [
33]. The dominant chemical shifts at around 129.0 ppm were assigned to the substituted ortho and para carbon sites on aromatic ring. The main reactive sites for the methylolation reaction, the unsubstituted para and ortho carbons, presented at 119.1–120.5 ppm and 115.1–117.8 ppm, respectively [
16]. The chemical shifts at 61.1–61.5 ppm were assigned to the methylol groups on the ortho position of phenolic hydroxyl groups, and the peaks observed at 63.3–64.8 ppm were associated with the para methylol groups [
33]. Theoretically, methylene ether bridges could be formed during the condensation process of phenolic resins. However, the absence of peaks between 69.0 ppm and 74.0 ppm indicated that there were no methylene ether bridges in the synthesized phenolic resins. The peaks ascribed to the para–para and para–ortho methylene bridges were presented at 39.8–41.1 ppm and 34.7–35.4 ppm, respectively. The peaks at around 50 ppm indicated the presence of methanol for all phenolic resins, which were formed during resin synthesis process from the Canizzaro reaction of formaldehyde [
15].
For all the phenolic resins, the intensity of para–para methylene bridges at 39.9–41.1 ppm was higher than that of para–ortho methylene bridges at 35.7–36.0 ppm. The intensity of chemical shifts at 63.6–64.2 ppm, ascribed to the para methylol groups, was higher than that of peaks at 62.5–63.2 ppm, which were assigned to the methylol groups on the ortho position of phenolic hydroxyl groups. This phenomenon was caused by the higher reactivity of aromatic hydrogen at the para position of the phenolic hydroxyl groups than that at the ortho position. Compared to the spectrum of PF resins, the chemical shifts presented at 119.1–120.5 ppm and 115.1–117.8 ppm, ascribed to the unsubstituted active sites in the aromatic ring decreased in the spectra of LPF and DLPF resins. This was caused by the incorporation of lignin with low content of the active sites in the phenolic resins. In addition, DLPF resins exhibited higher integral intensity of unsubstituted active sites in the aromatic ring than LPF resins, which was caused by the increase of active sites in DL products derived from the demethylation reaction. The fact that the substituted ortho and para carbon sites signals of DLPF resins were larger than that of LPF resins was caused by the enhanced reactivity of DL products. Furthermore, the integral intensity of methylol groups at 63.3–64.8 ppm and 61.1–61.5 ppm in LPF resins were lower than that in DLPF resins. The para–para methylene bridges (39.8–41.1 ppm) and para–ortho methylene bridges (34.7–35.4 ppm) between phenolic units in the spectra of DLPF resins exhibited higher integral intensity than that in the LPF resins. These phenomena can be ascribed to the higher copolymerization degree of the DLPF resins than the LPF resins, which was caused by the higher reactivity of the DL products than the original lignin.
3.3. Physical Properties of DLPF Resins
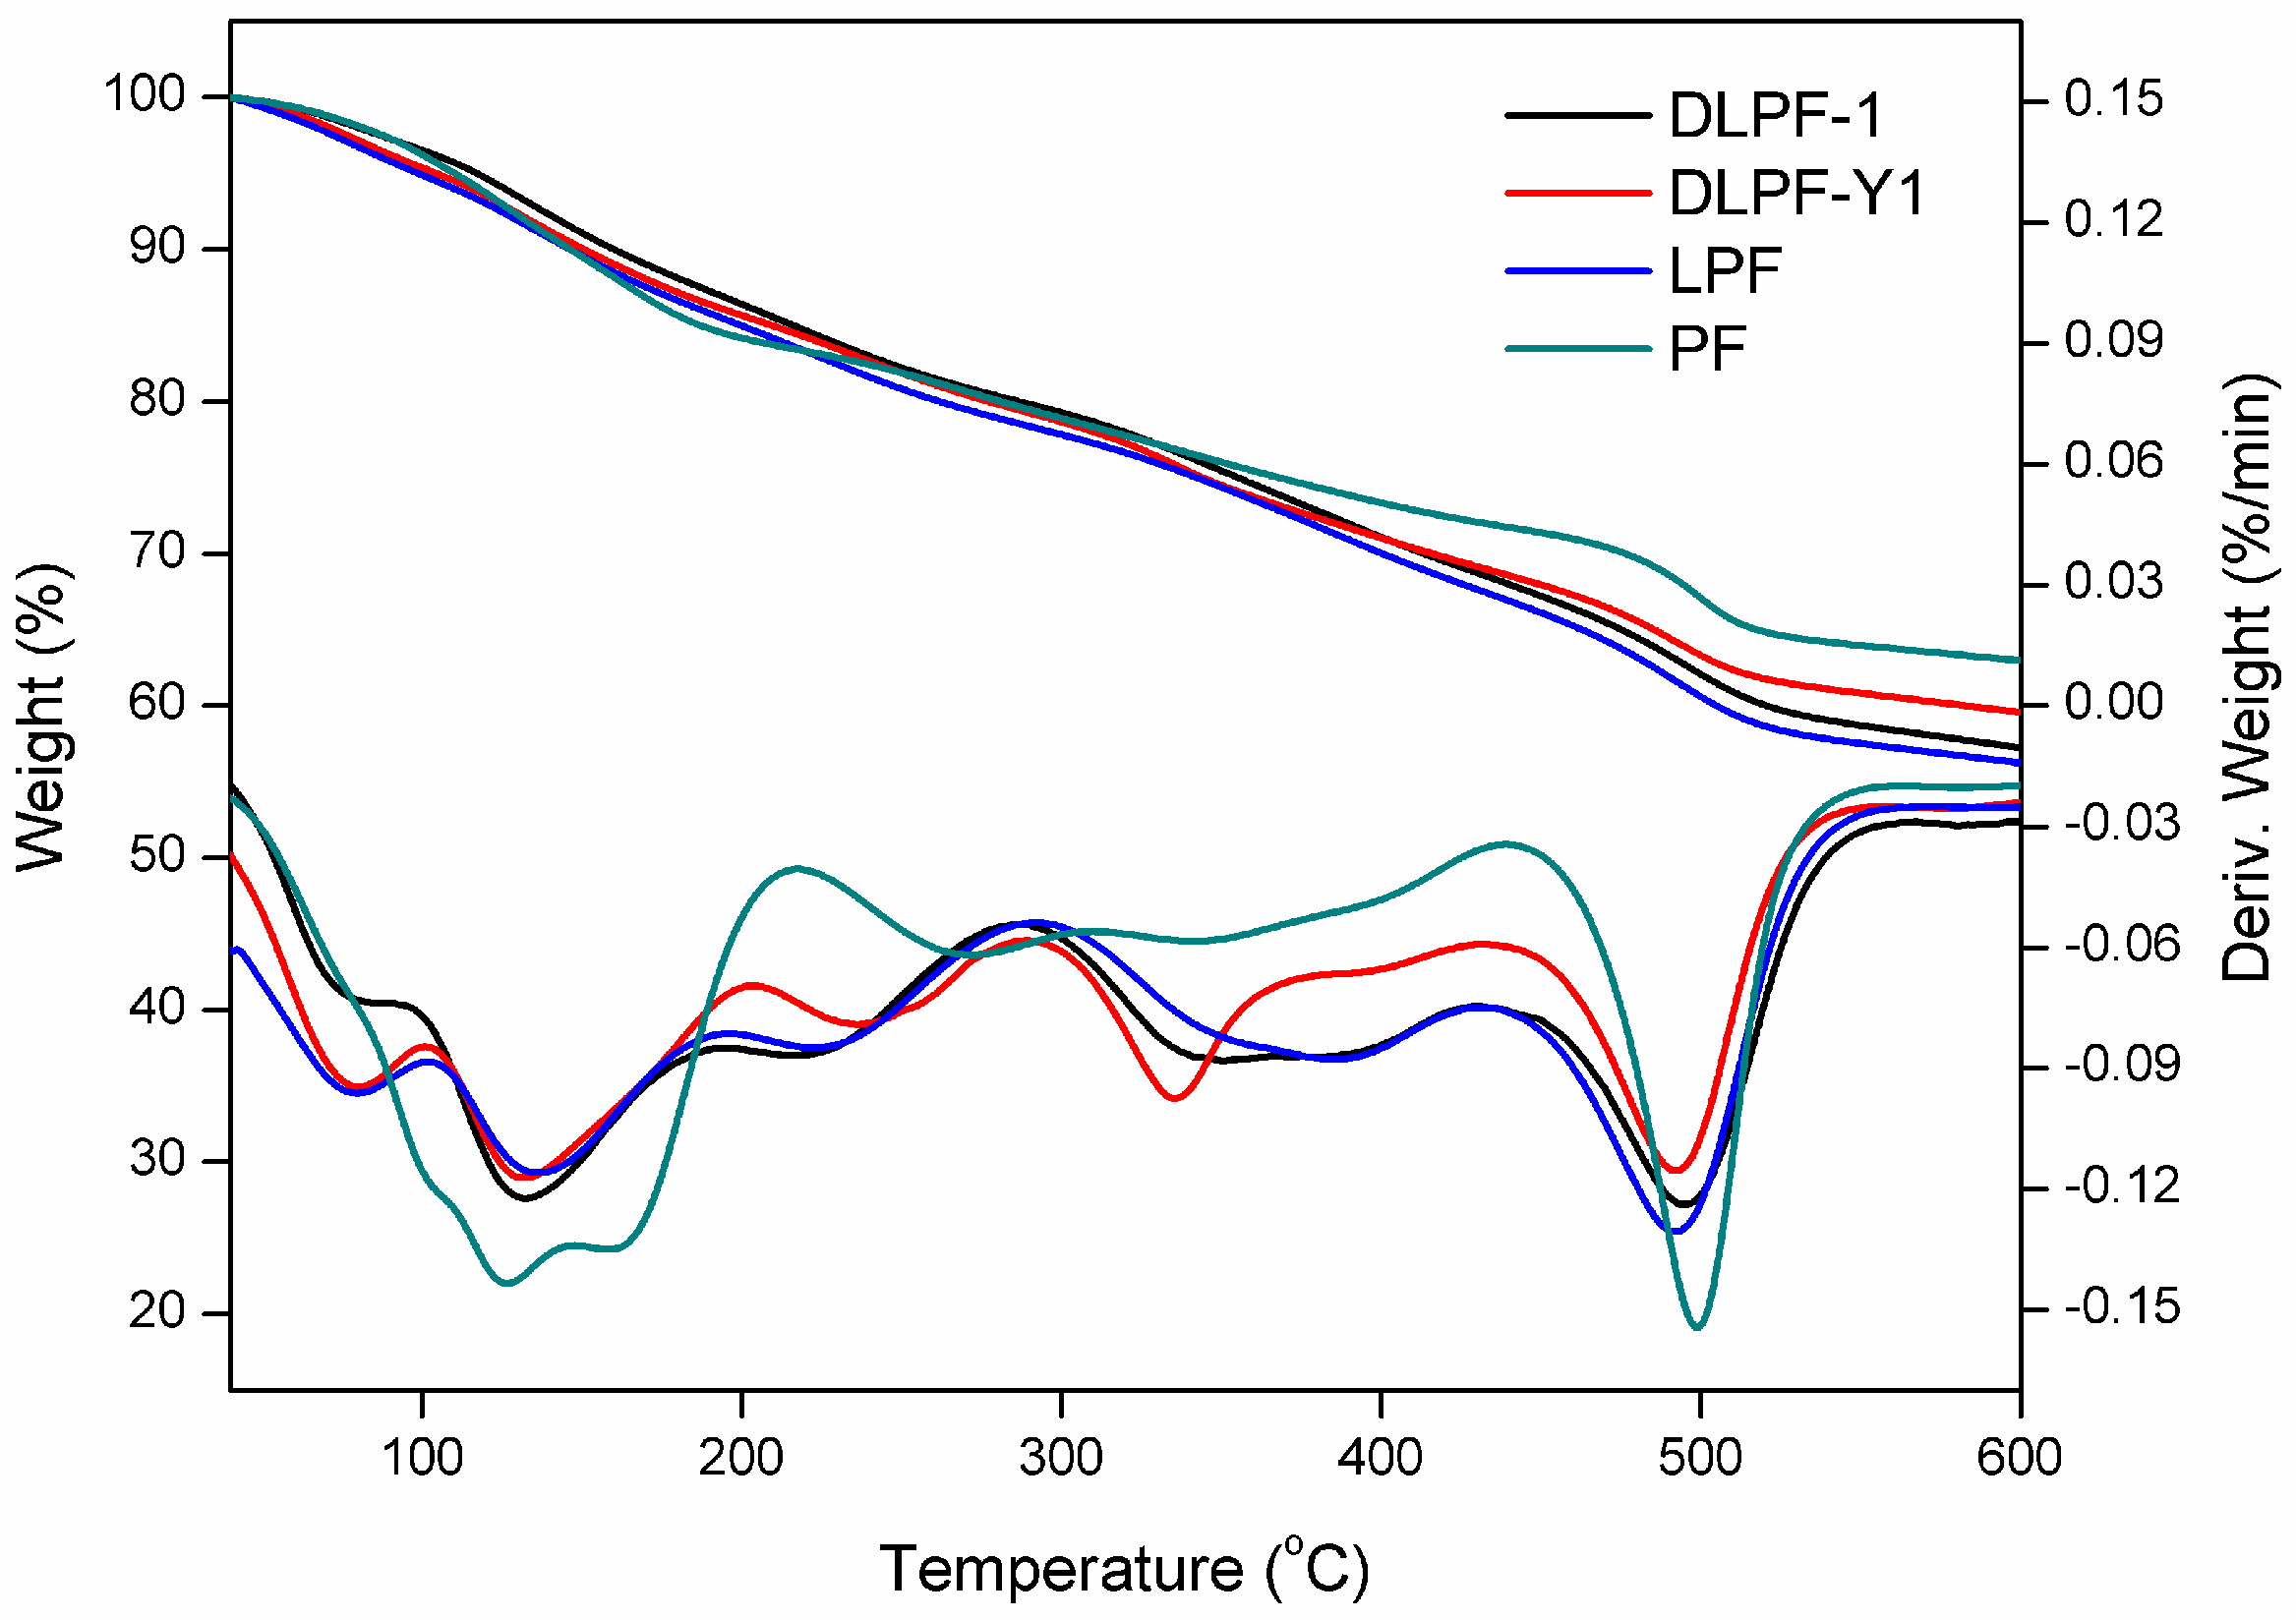
To characterize thermal stability of phenolic resins, TGA analysis was carried out under a nitrogen atmosphere. The peak of the derivative thermogravimetry (DTG) curves (T
max), which can be expressed as the maximum thermal degradation temperature in different thermal events, was used to compare the thermal stability characteristics of phenolic resins [
15].
Figure 6 shows the TGA-DTG curves of phenolic resins, and the data of their thermal degradation are given in
Table 4.
As seen in the TGA-DTG thermograms of phenolic resins, the degradation can be divided into three steps: post-curing, thermal reforming and ring stripping [
16]. The first degradation stage occurred in the range of 110–210 °C. The mass loss in the first stage was attributed to the evaporation of water, which was generated by condensation reaction of the methylol groups [
15]. When it comes to the bio-based phenolic resins, the T
max of the first degradation stage was in the range of 131–136 °C, higher than the PF resins (124 °C). As seen in this degradation stage, LPF resins and DLPF resins exhibited higher thermal stability than the PF resins. In addition, DLPF resins showed better thermal stability and lower degradation rate than the LPF resins, which was caused by the higher polymerization degree of the DLPF resins.
The second degradation stage is in the range of 210–430 °C. The mass loss in the second stage was due to the loss of water produced from the condensation reaction of phenolic hydroxyl and methylene as well as between two hydroxyl functional groups [
16]. It was observed that LPF resins and DLPF resins showed similar thermal stability to the PF resins in the second degradation stage.
The third degradation stage occurred in the range of 430–570 °C. The mass loss in the third stage arose from the elimination of carbon monoxide and methane formed by the degradation of methylene bridge [
12]. The PF resins in the third degradation stage exhibited better thermal stability than the bio-based phenolic resins, because the T
max (499 °C) and the weight residue (62.8%) at 600 °C were higher than that of the bio-based phenolic resins. Compared to LPF resins, the DLPF resins had higher T
max and greater weight residue at 600 °C, attributing to the higher reactivity of DL. The introduction of DL, which had higher reactivity, facilitating the formation of phenolic resins with higher polymerization degree, thus gave more weight residue at high temperature.
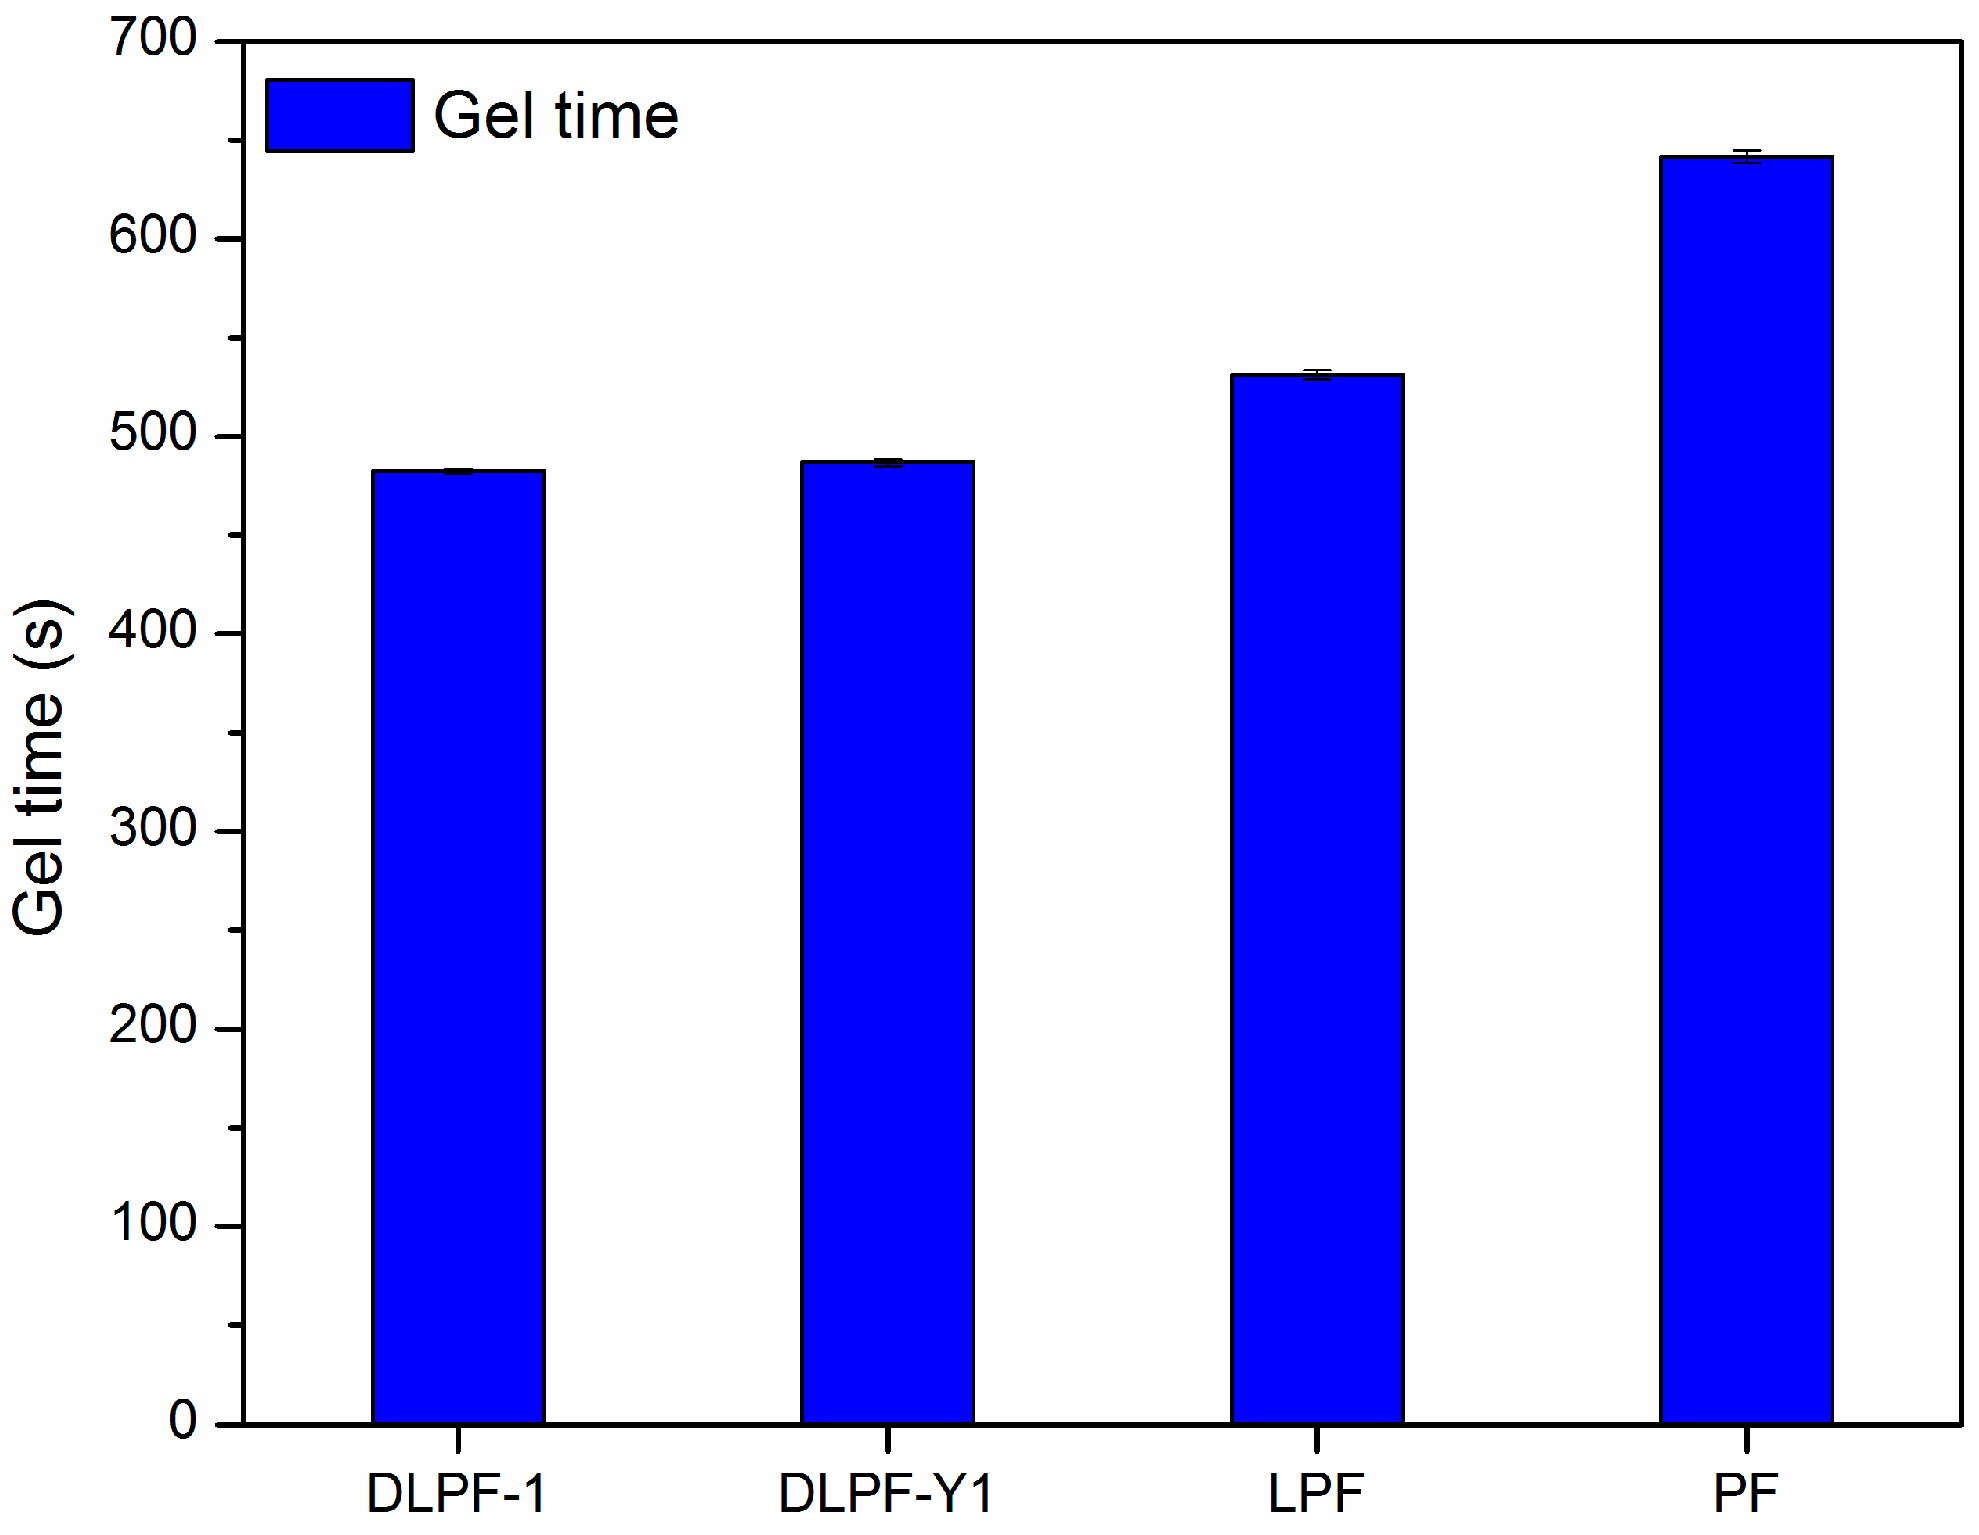
The gel time of various phenolic resins are shown in
Figure 7. Three spectrums were tested for each phenolic resin. Gel time was used as an indicator of the curing rate and molecular reactivity of the phenolic resins, because which is generally defined as the time required for phenolic resins to transform from a disorganized liquid into a three-dimensional macromolecular structure under specified conditions [
12]. Compared to PF resins, LPF and DLPF resins had shorter gel time and faster curing rate. It is well known that higher molecular weight can result in the shorter gel times [
34], hence the faster curing rate of LPF and DLPF resins benefited from the higher molecular weight of lignin over phenol. Among the bio-based phenolic resins, DLPF resins exhibited shorter gel time than the LPF resins. Partial methoxyl groups in the framework of lignin were converted into phenolic hydroxyl groups through demethylation reaction under mild condition, which resulted in increased polymerization degree of the DLPF resins and subsequently their reactivity; hence, DLPF resins had a faster curing rate, as shown in
Figure 7.
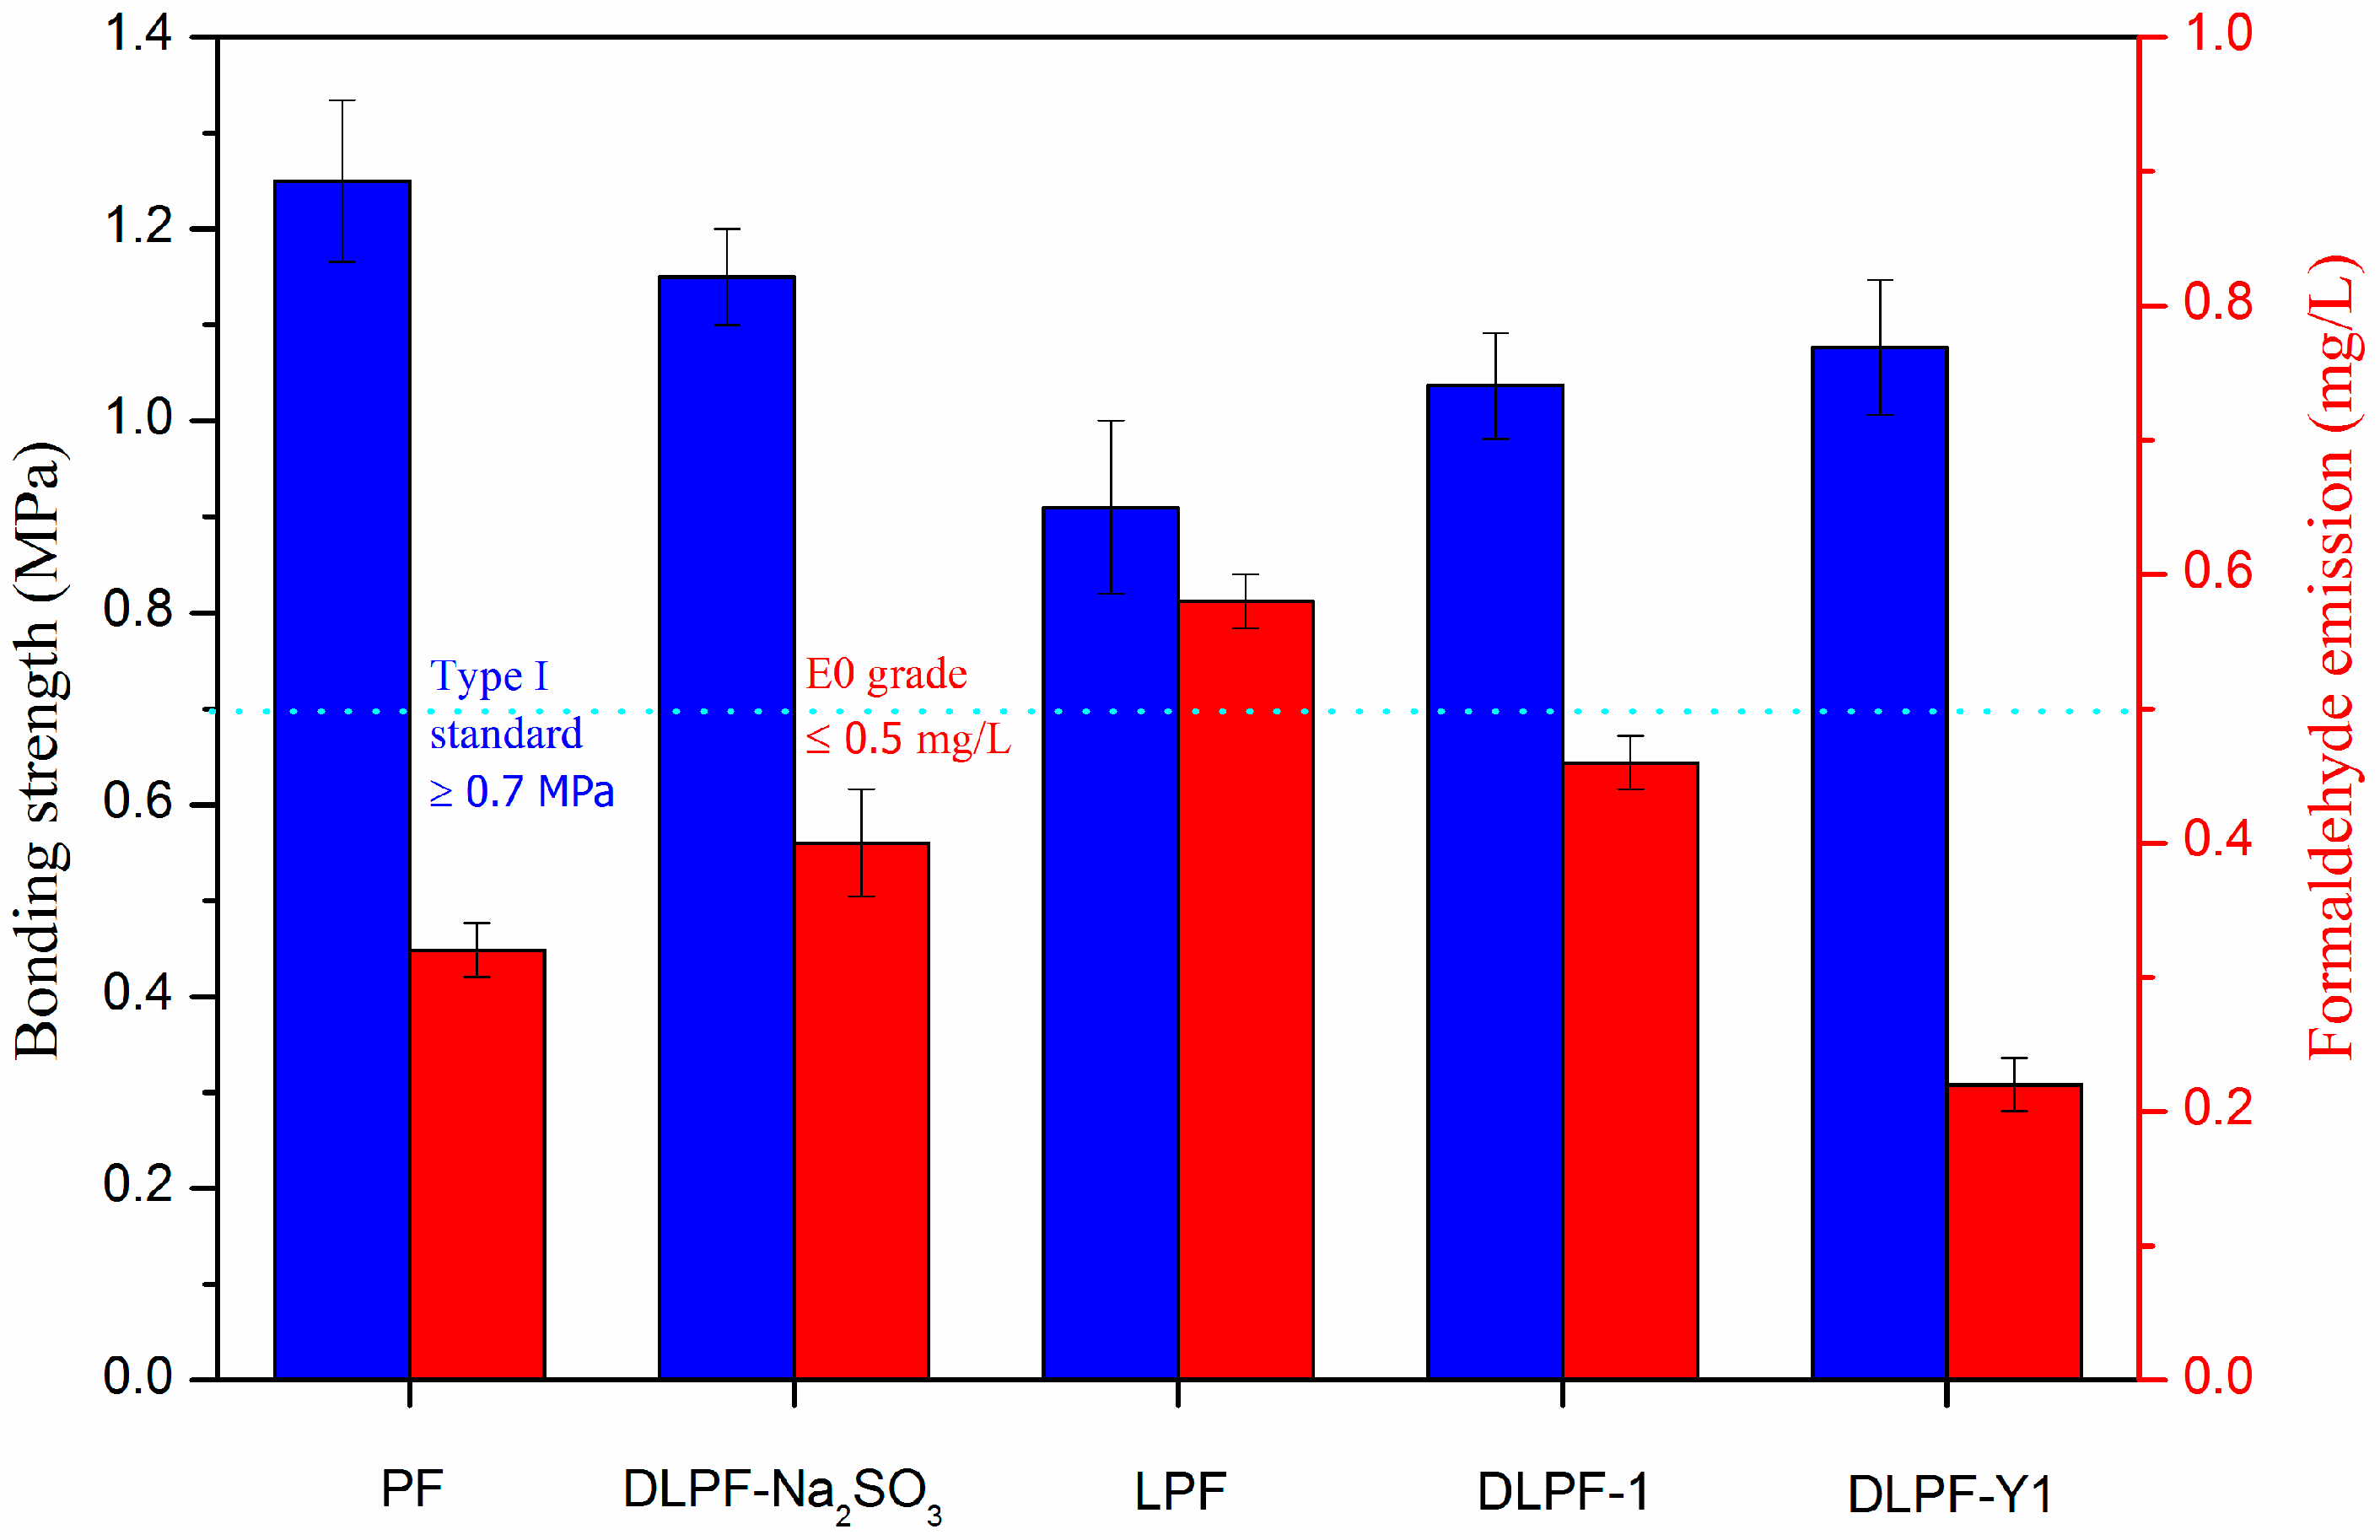
The bonding strength (determined after boiling the plywood samples for 3 h) and the formaldehyde emissions of plywood bonded with the phenolic resins are depicted in
Figure 8. Eight spectrums were tested for each kind of plywood for the test of bonding strength, and ten spectrums were tested for each kind of plywood for the test of formaldehyde emission. Plywood bonded with PF resins had higher bonding strength and lower formaldehyde emission than the bio-based LPF resins, because there are many non-phenolic compounds in lignin [
34]. In addition, the reactivity of lignin was lower than phenol because phenol has three active sites (two ortho and one para) available for polymerization, while there are two or less active sites on the molecule of lignin. Furthermore, lignin possessed large molecular weight and far greater steric hindrance, which could adversely affect the polycondensation reaction of LPF resins [
16]. With the addition of lignin, the bonding strength of plywood decreased from 1.24 MPa to 0.91 MPa, but still meet the standard for exterior-grade plywood panels (0.7 MPa). As seen in
Figure 8, plywood bonded with the DLPF resins had higher bonding strength and lower formaldehyde emission than the LPF resins, which was caused by the enhanced reactivity of DL products. In addition, plywood bonded with DLPF-Y1 resins possessed the highest bonding strength and the lowest formaldehyde emission among the bio-based phenolic resins. This phenomenon can be explained by the highest phenolic hydroxyl group content in the DL-Y1 products demethylated under the optimum reaction condition. It was much encouraged that the formaldehyde emission of plywood decreased from 0.58 mg/L to 0.22 mg/L after the demethylation of lignin at the optimum condition. This is an advantage to achieve the purpose of preparing ecofriendly phenolic resins by using lignin to replace petrochemical materials. Compared to plywood bonded with DLPF-Na
2SO
3, plywood bonded with DLPF-Y1 had lower bonding strength. It should be pointed out that plywood bonded with DLPF-Na
2SO
3 was hot pressed at 130 °C for 7 min, while the plywood bonded with DLPF-Y1 was hot pressed at 130 °C for 5 min. That is why the bonding strength of plywood bonded with DLPF-Y1 was lower than that of plywood bonded with DLPF-Na
2SO
3. The formaldehyde emission of plywood bonded with DLPF-Y1 was lower than that of plywood bonded with DLPF-Na
2SO
3, which may be caused by the enhanced reactivity of lignin demethylated at the optimum condition. The increased bonding strength and the decreased formaldehyde emission of plywood bonded with DLPF resins lead us to the conclusion that the DL products had enhanced reactivity, benefited from the removal of methoxyl groups and the formation of phenolic hydroxyl groups during the demethylation process. In addition, the improved properties of DLPF resins indicated that the demethylation technique in this approach had an enhanced demethylation efficiency, which could be confirmed by the
1H-NMR and FT-IR analysis.


