
“Living” Polymerization of Ethylene and 1-Hexene Using Novel Binuclear Pd–Diimine Catalysts


Abstract
:1. Introduction
2. Materials and Methods
2.1. Materials
2.2. Measurements
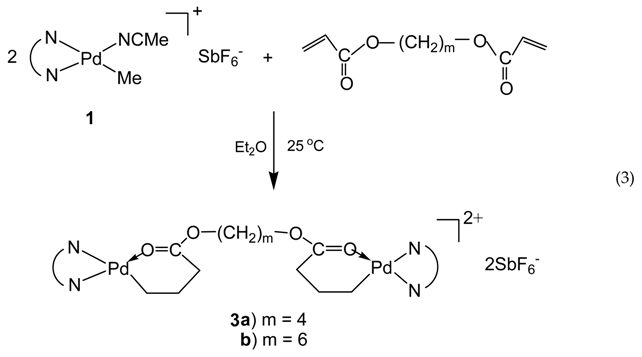
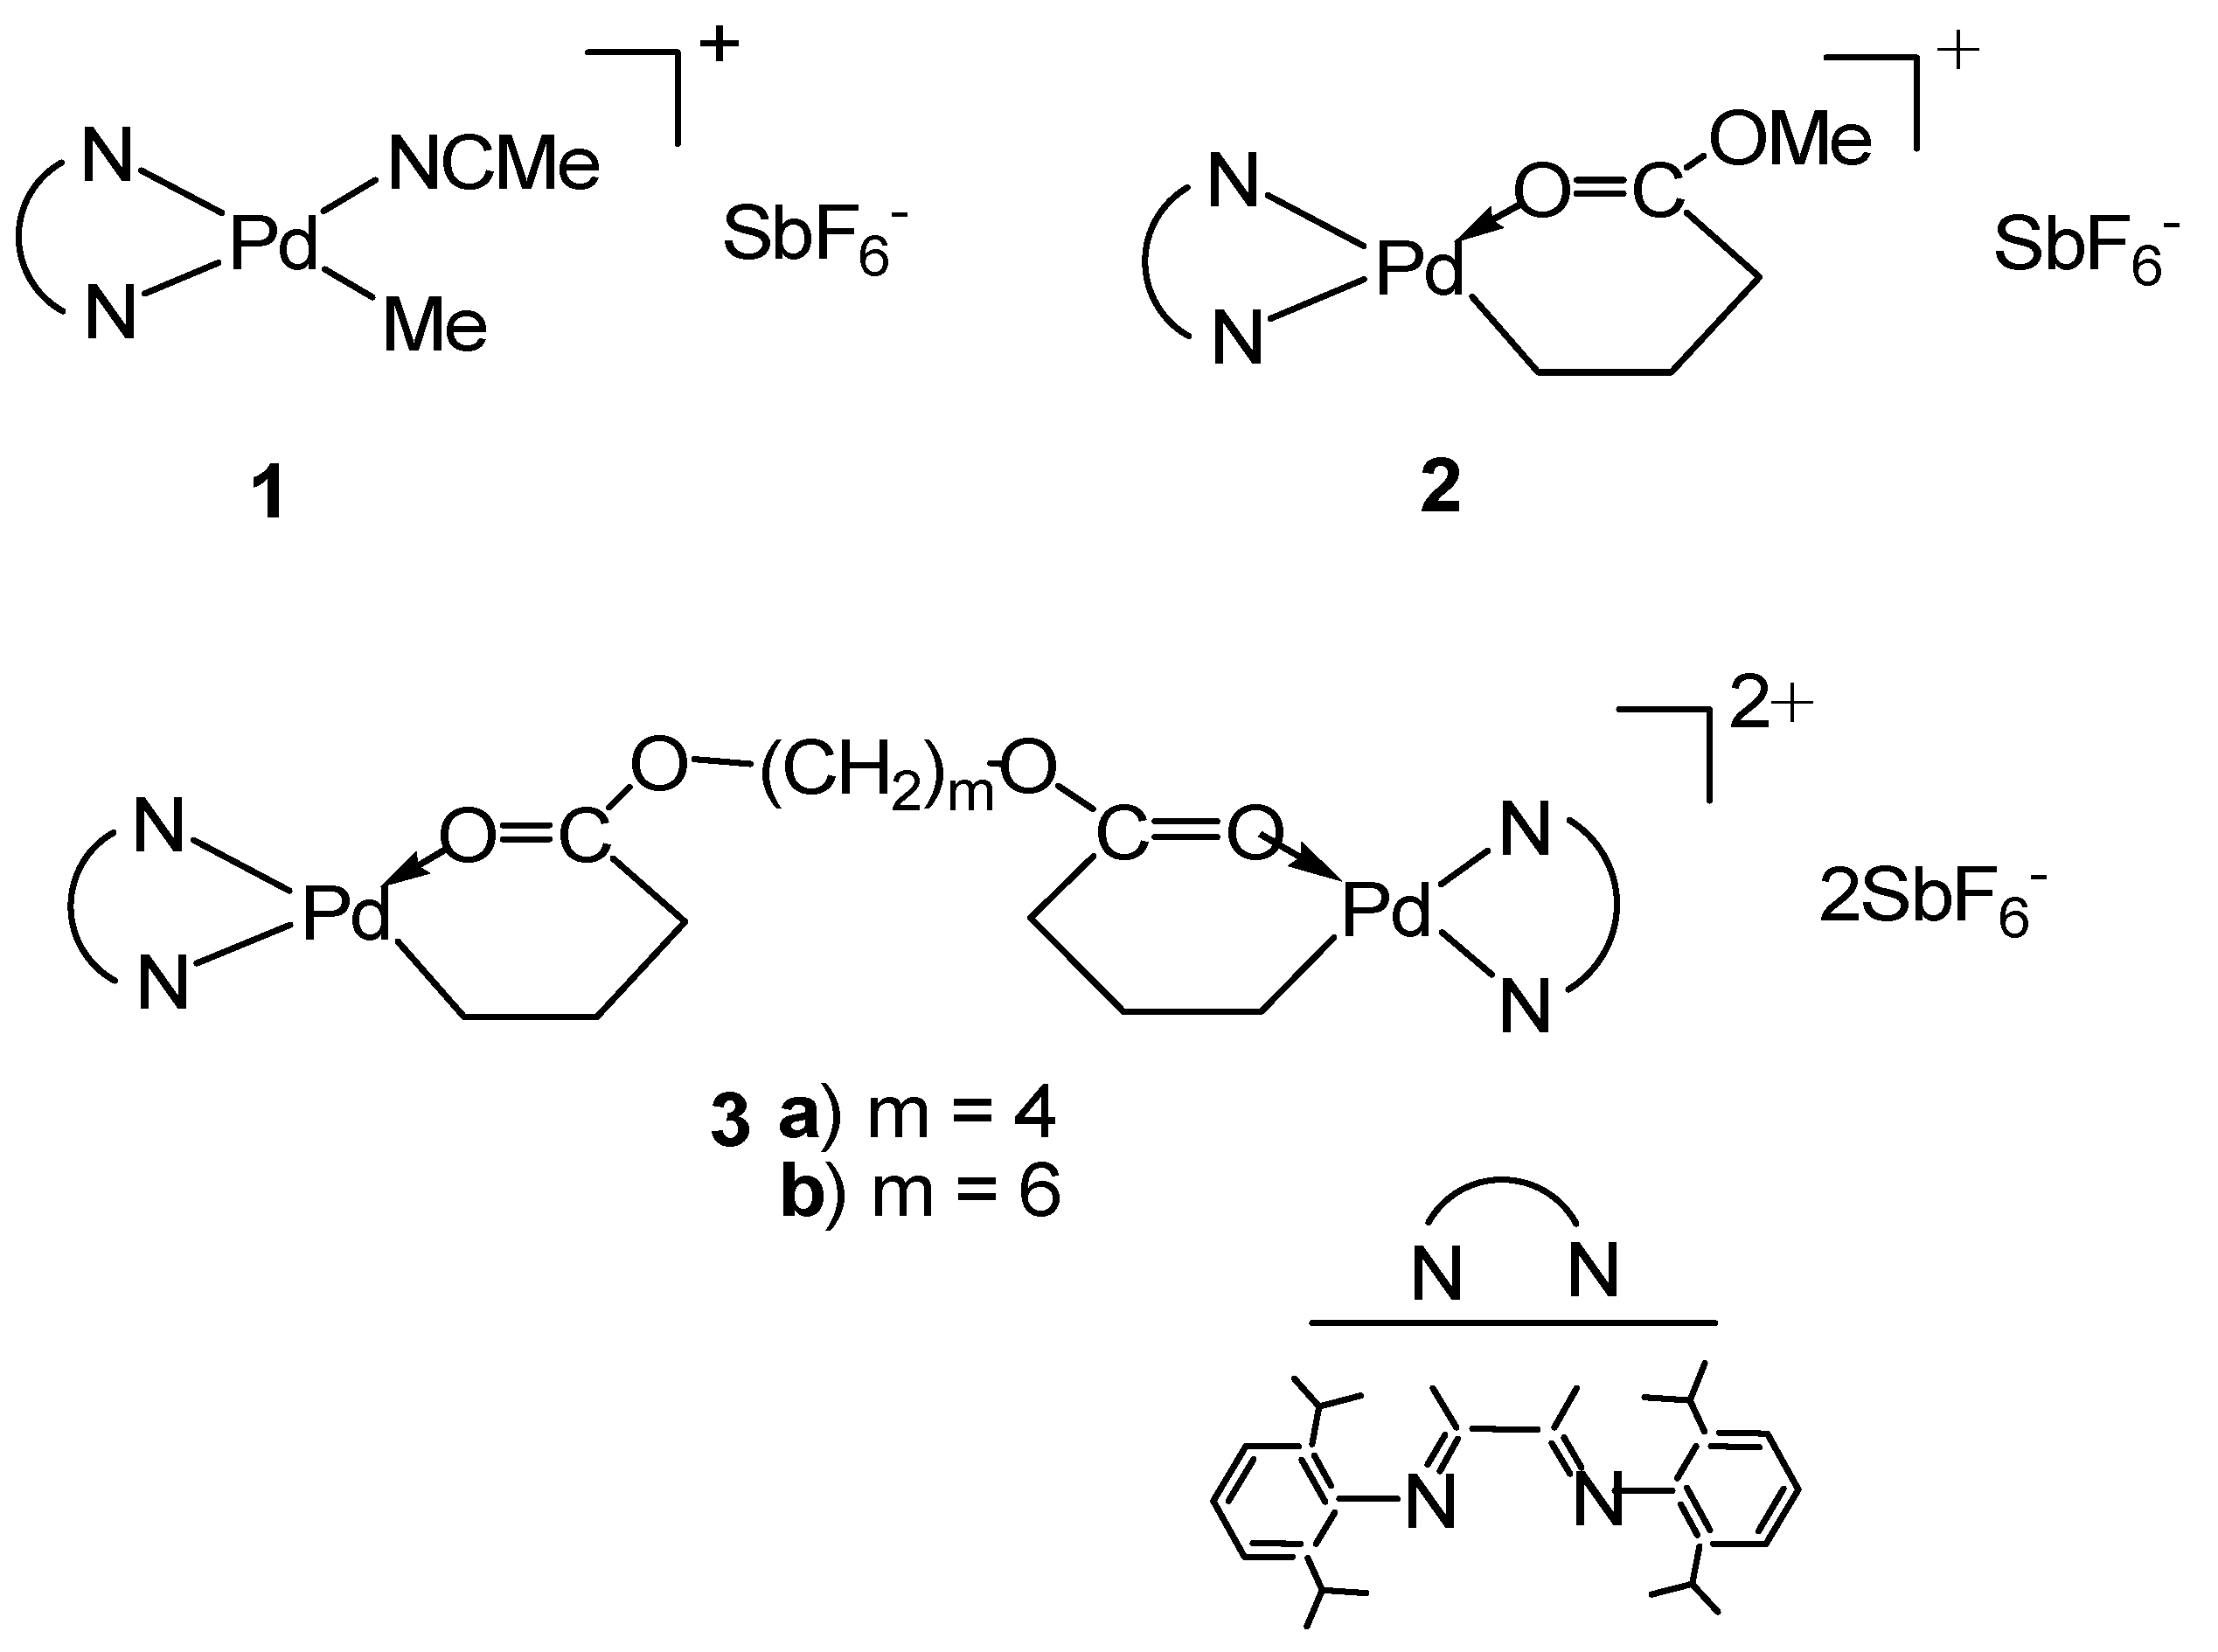
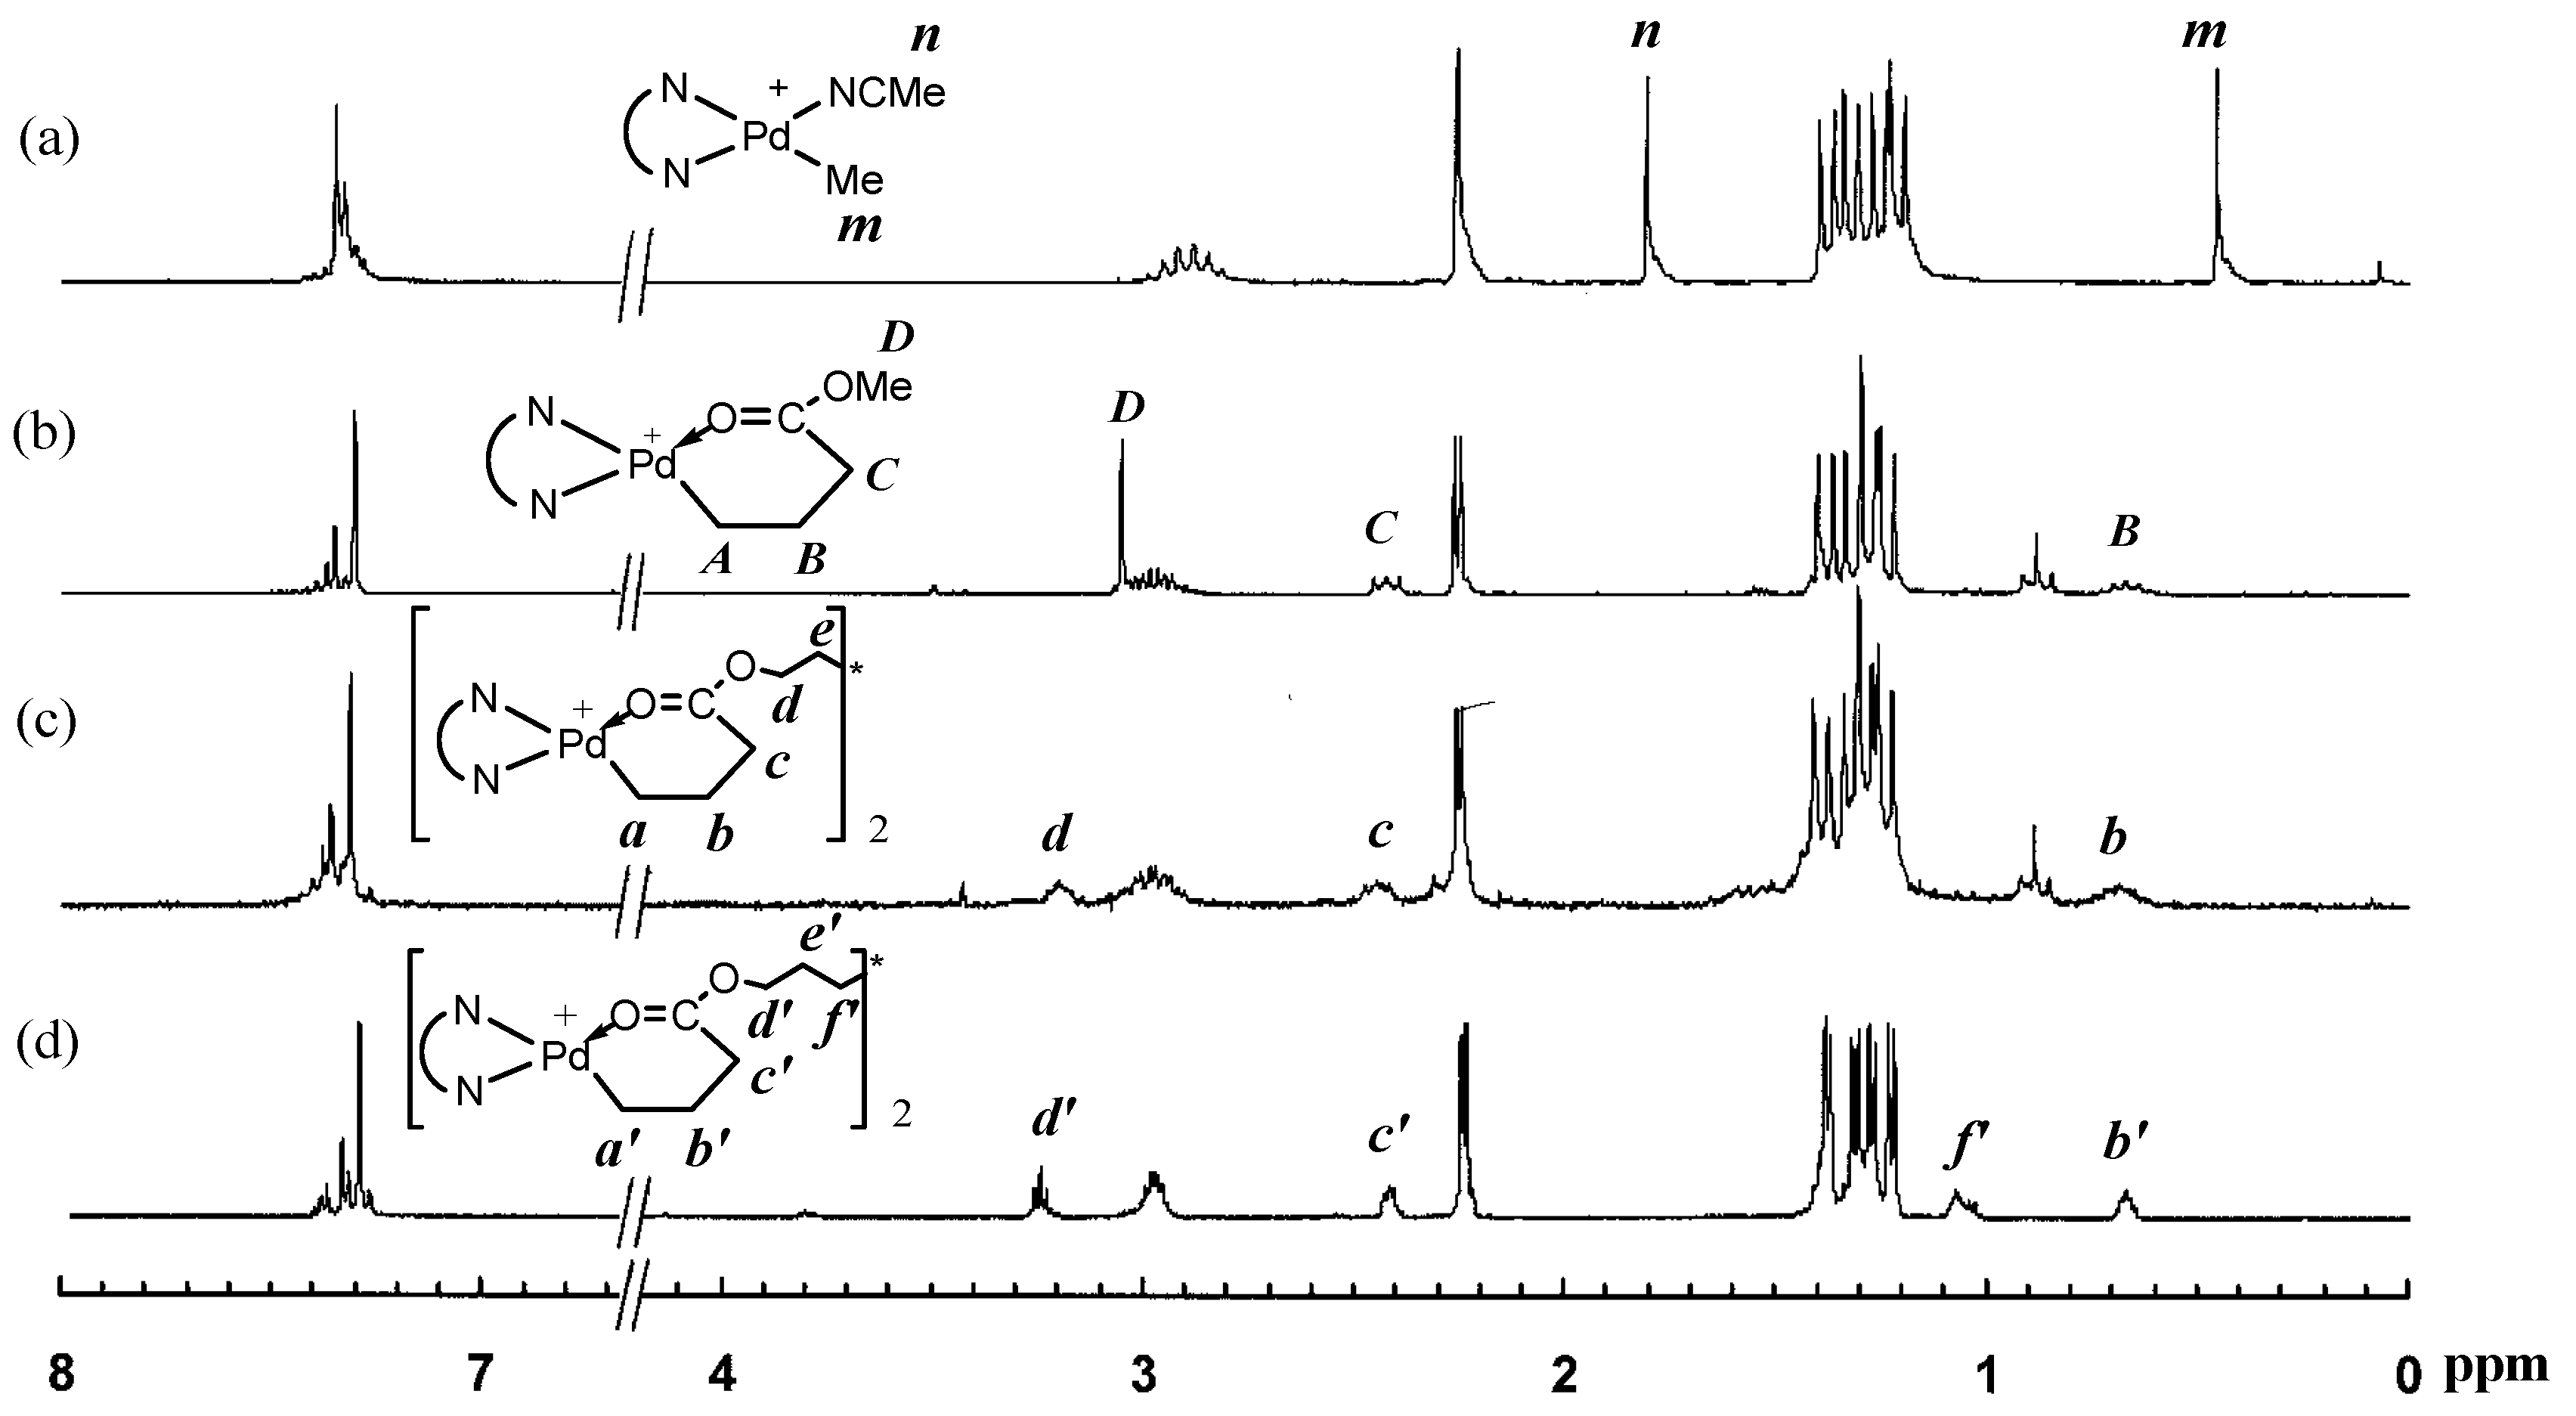
2.3. Synthesis of [(N^N)Pd(CH2)3C(O)O–(CH2)4–O(O)C(CH2)3Pd(N^N)](SbF6)2 (3a; N^N≡ArN=C(Me)–(Me)C=NAr; Ar≡2,6–(iPr)2C6H3)
2.4. Synthesis of [(N^N)Pd(CH2)3C(O)O–(CH2)6–O(O)C(CH2)3Pd(N^N)](SbF6)2 (3b; N^N≡ArN=C(Me)–(Me)C=NAr; Ar≡2,6–(iPr)2C6H3)
2.5. General Procedure for Ethylene “Living” Polymerization
2.6. General Procedure for “Living” Polymerization of 1-Hexene
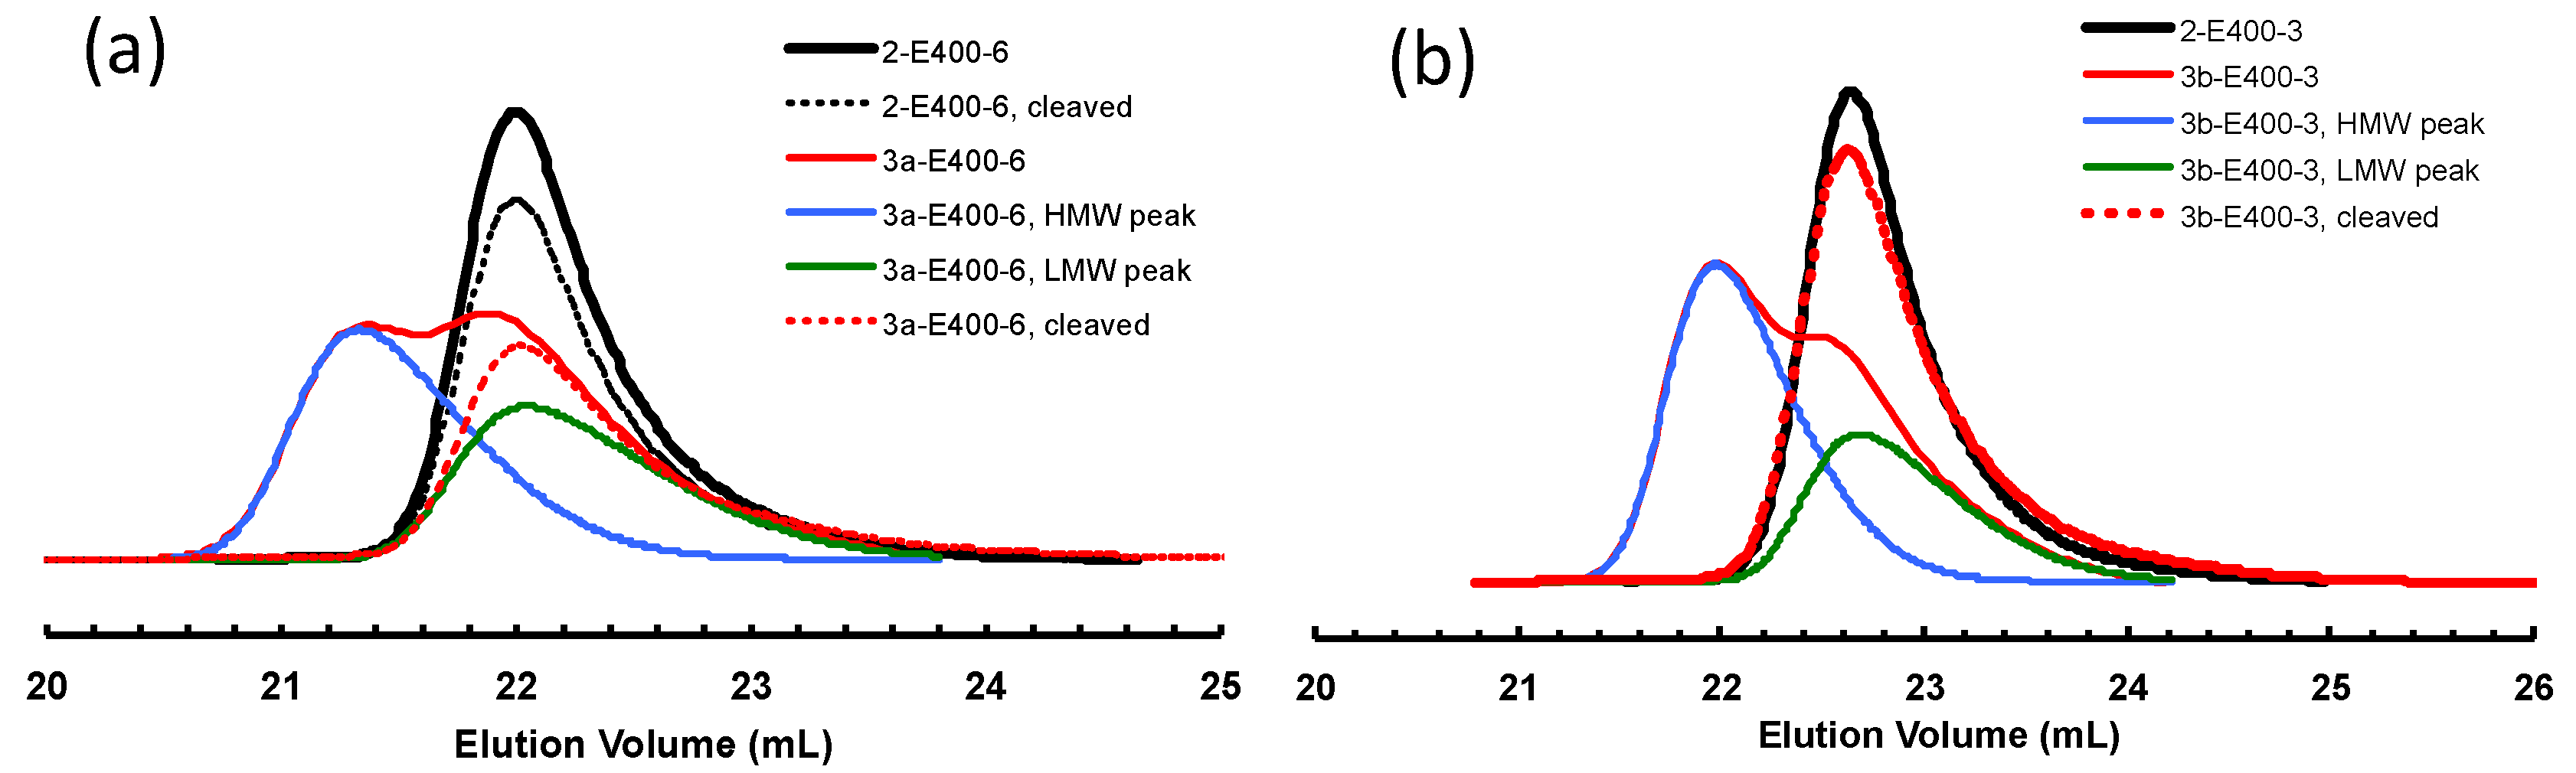
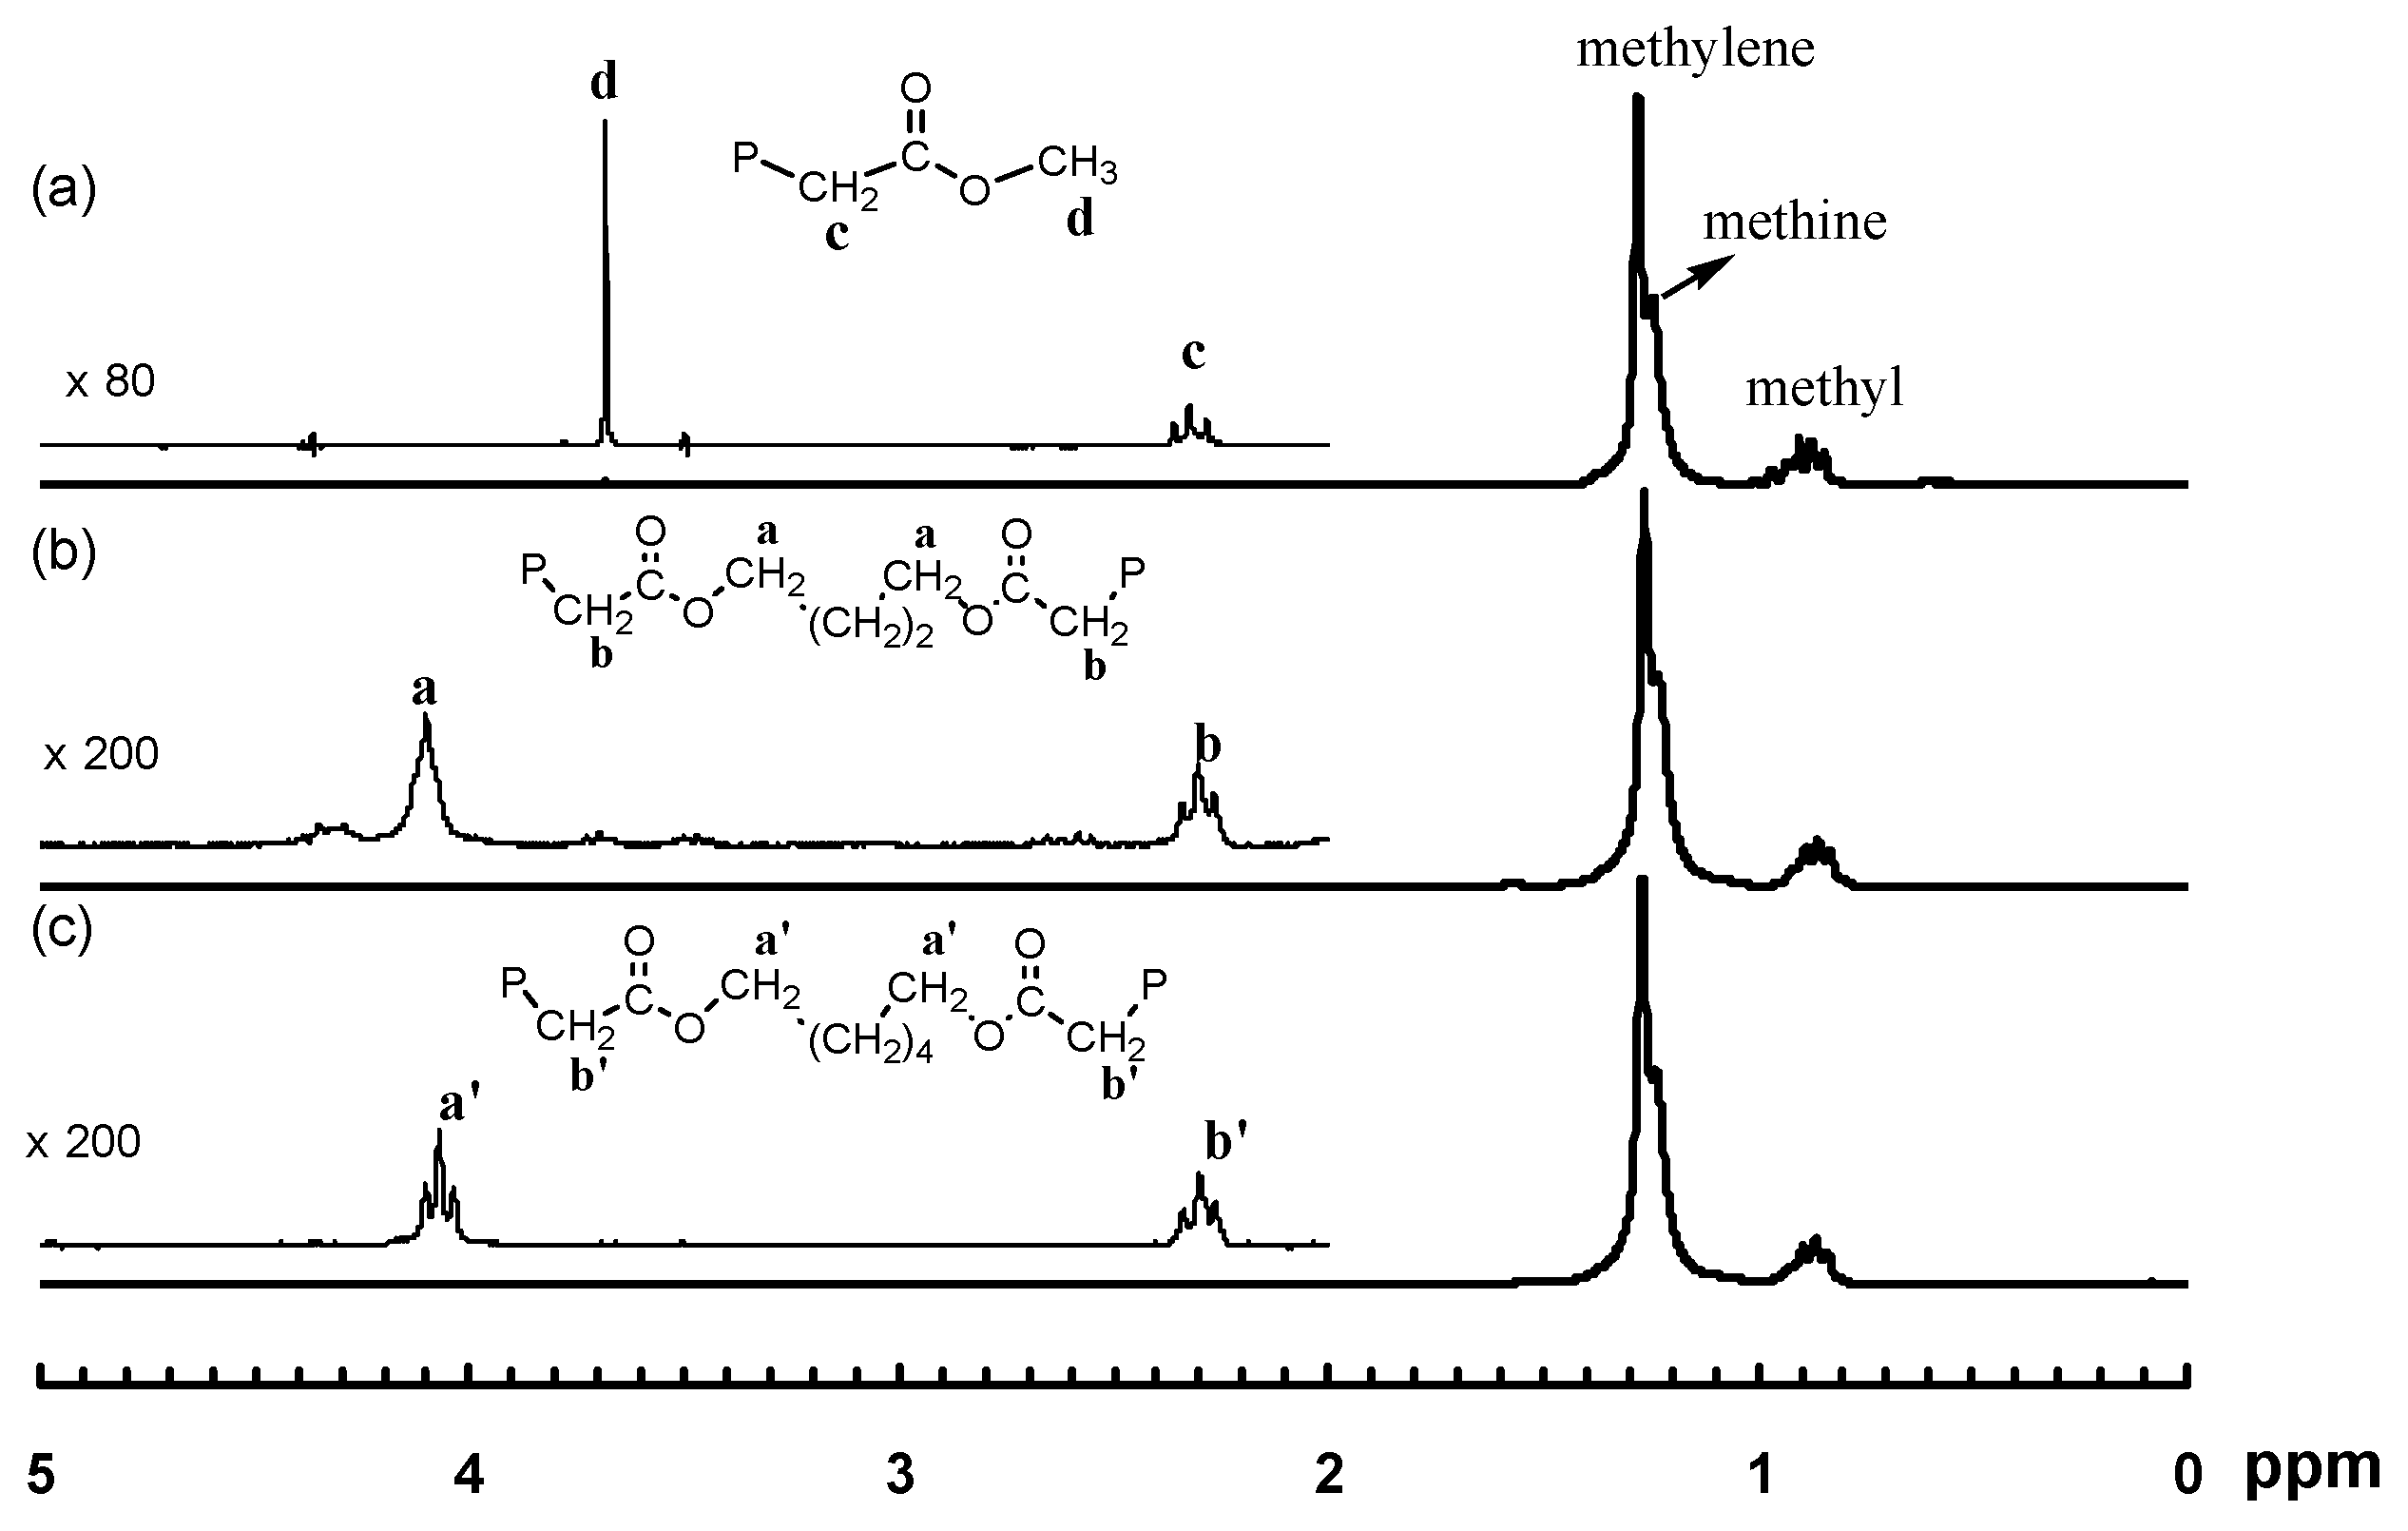
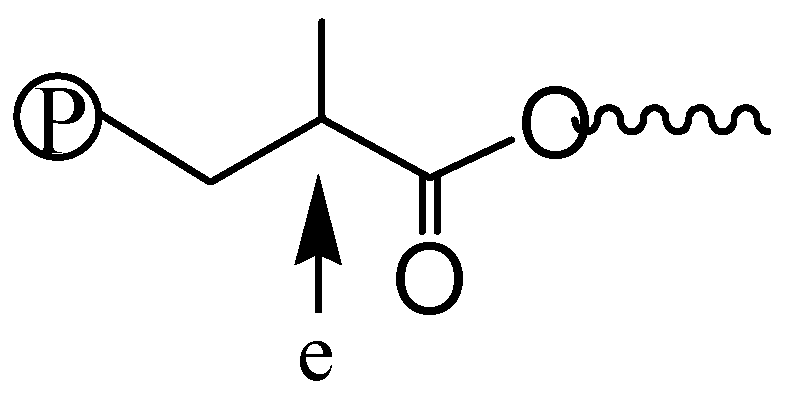
2.7. Polymer Cleavage by Hydrolysis
3. Results and Discussion
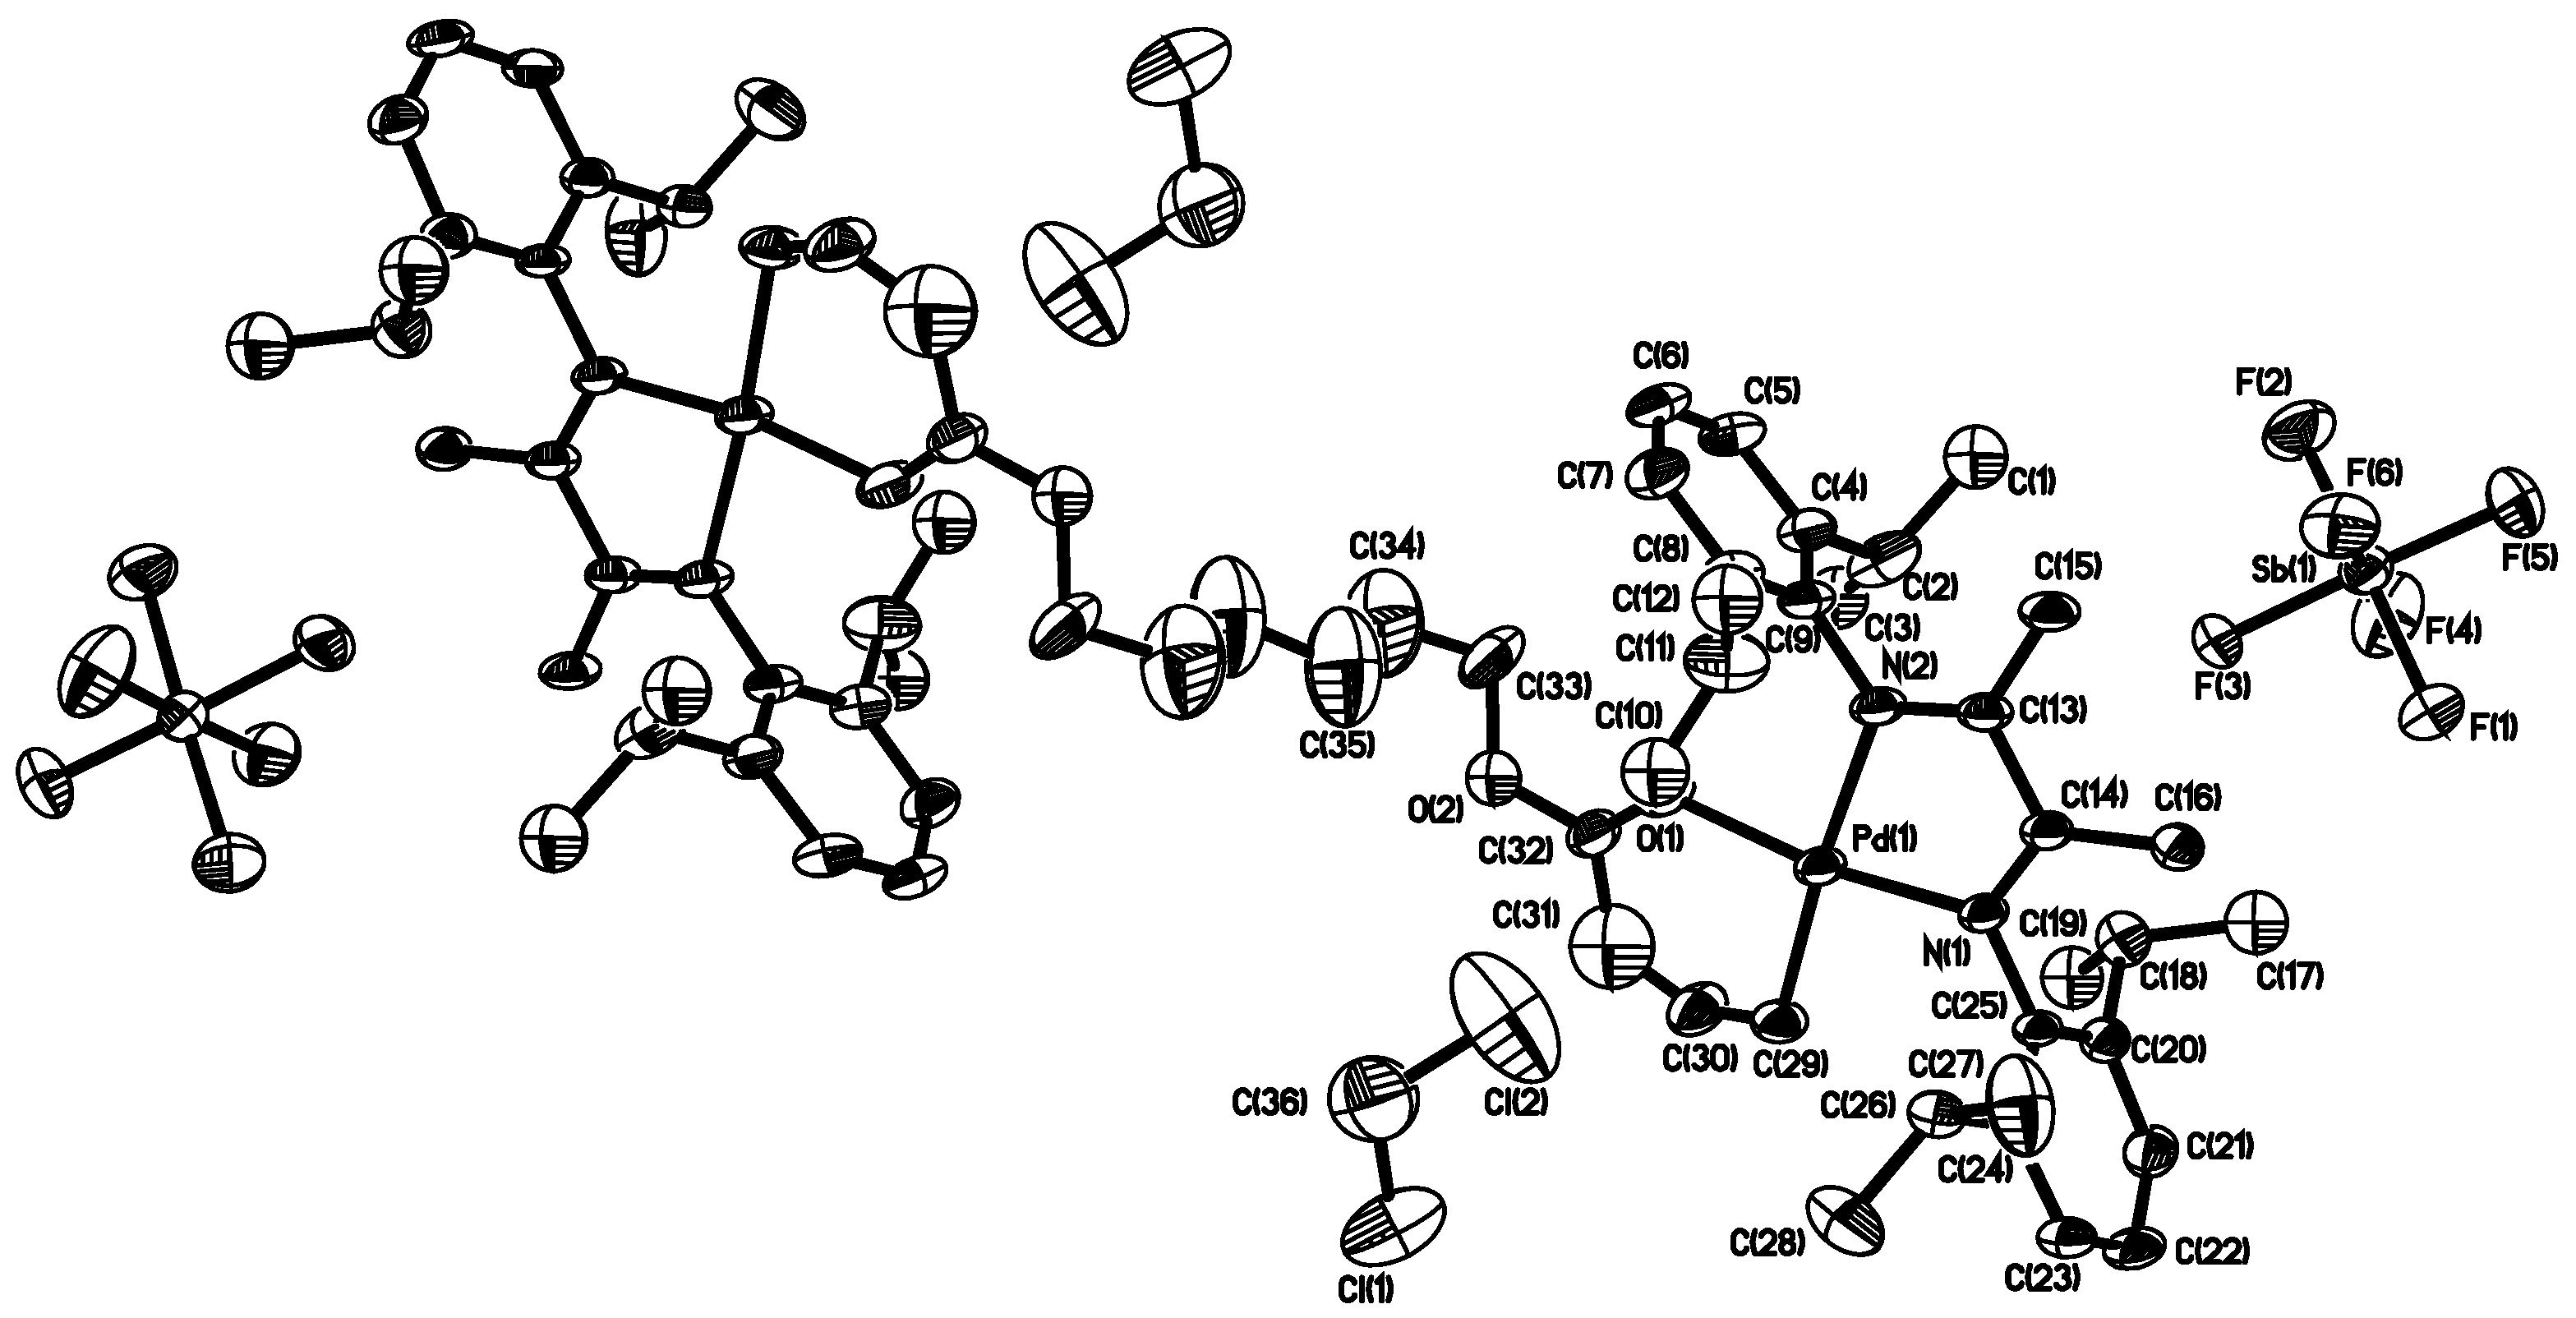
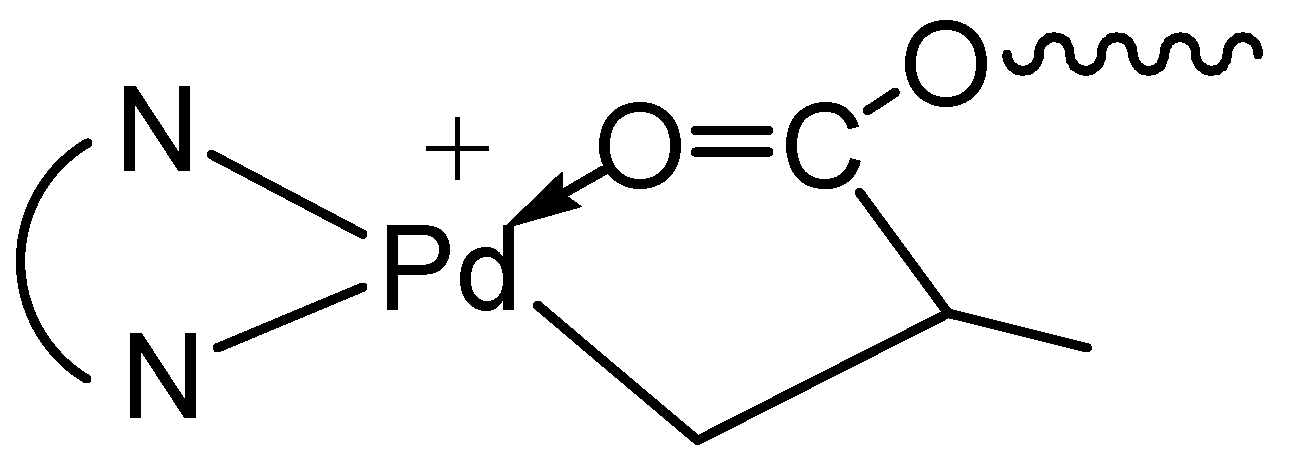
3.1. Synthesis of Binuclear Pd–Diimine Chelate Complexes
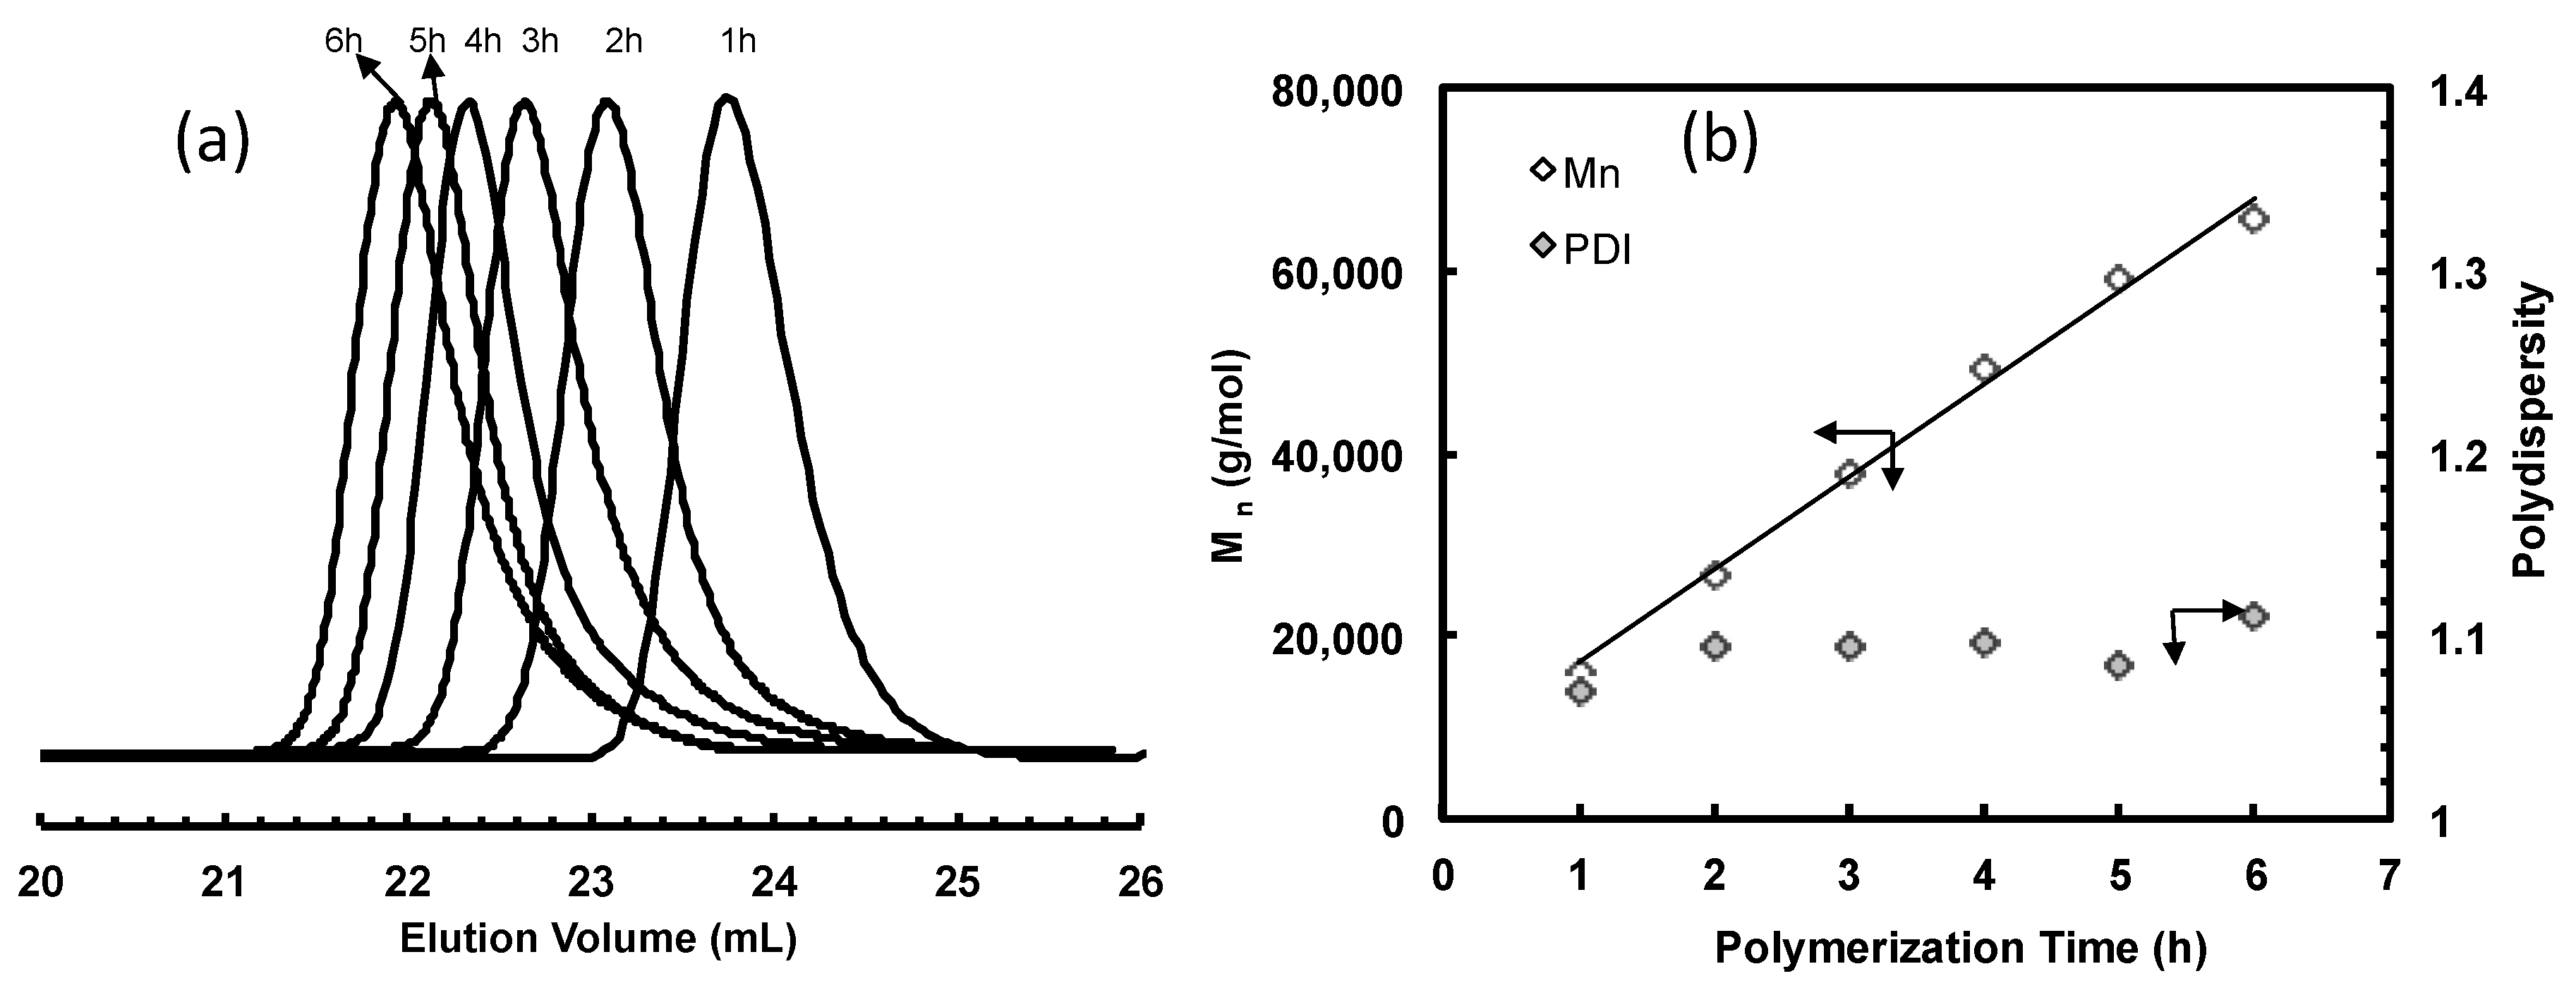
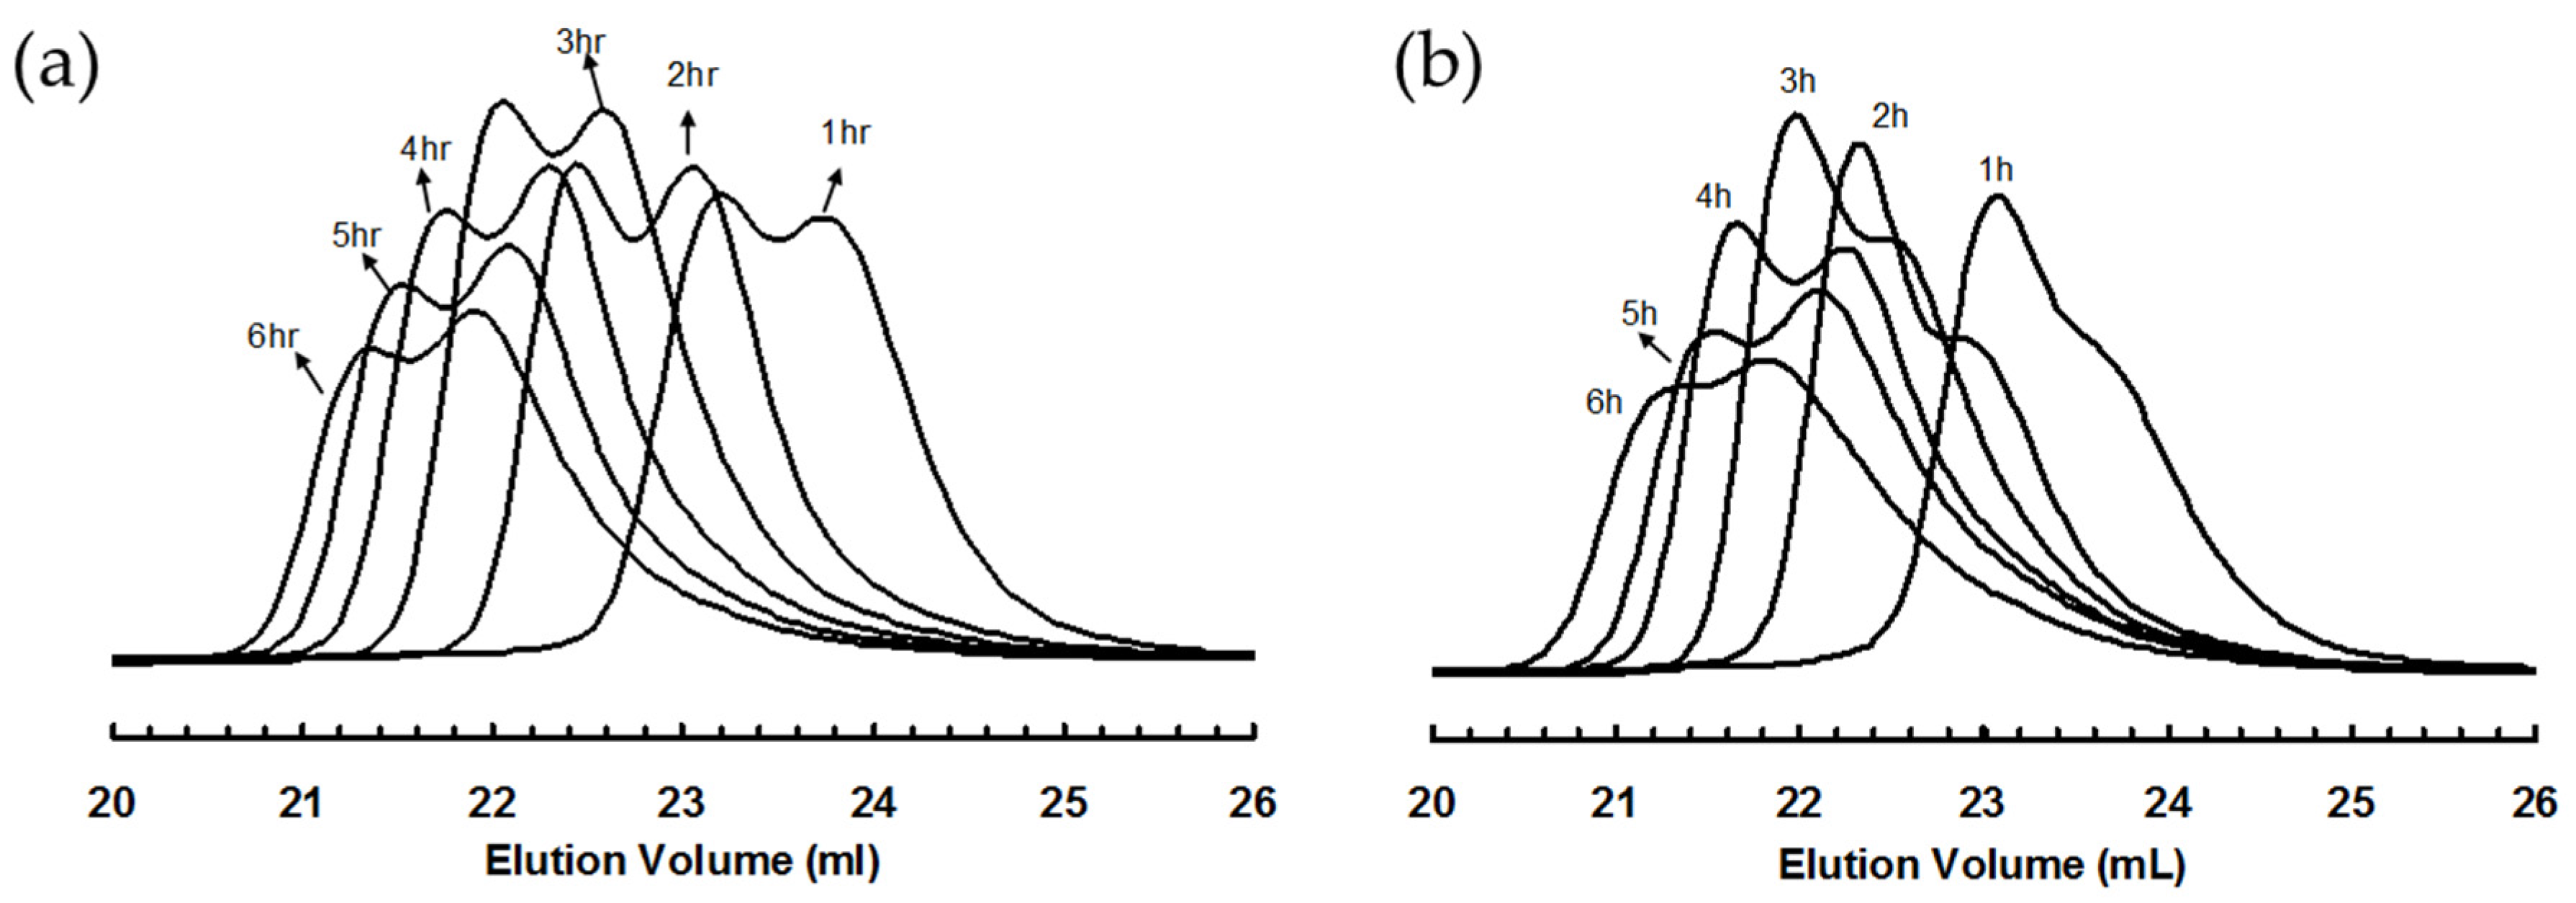
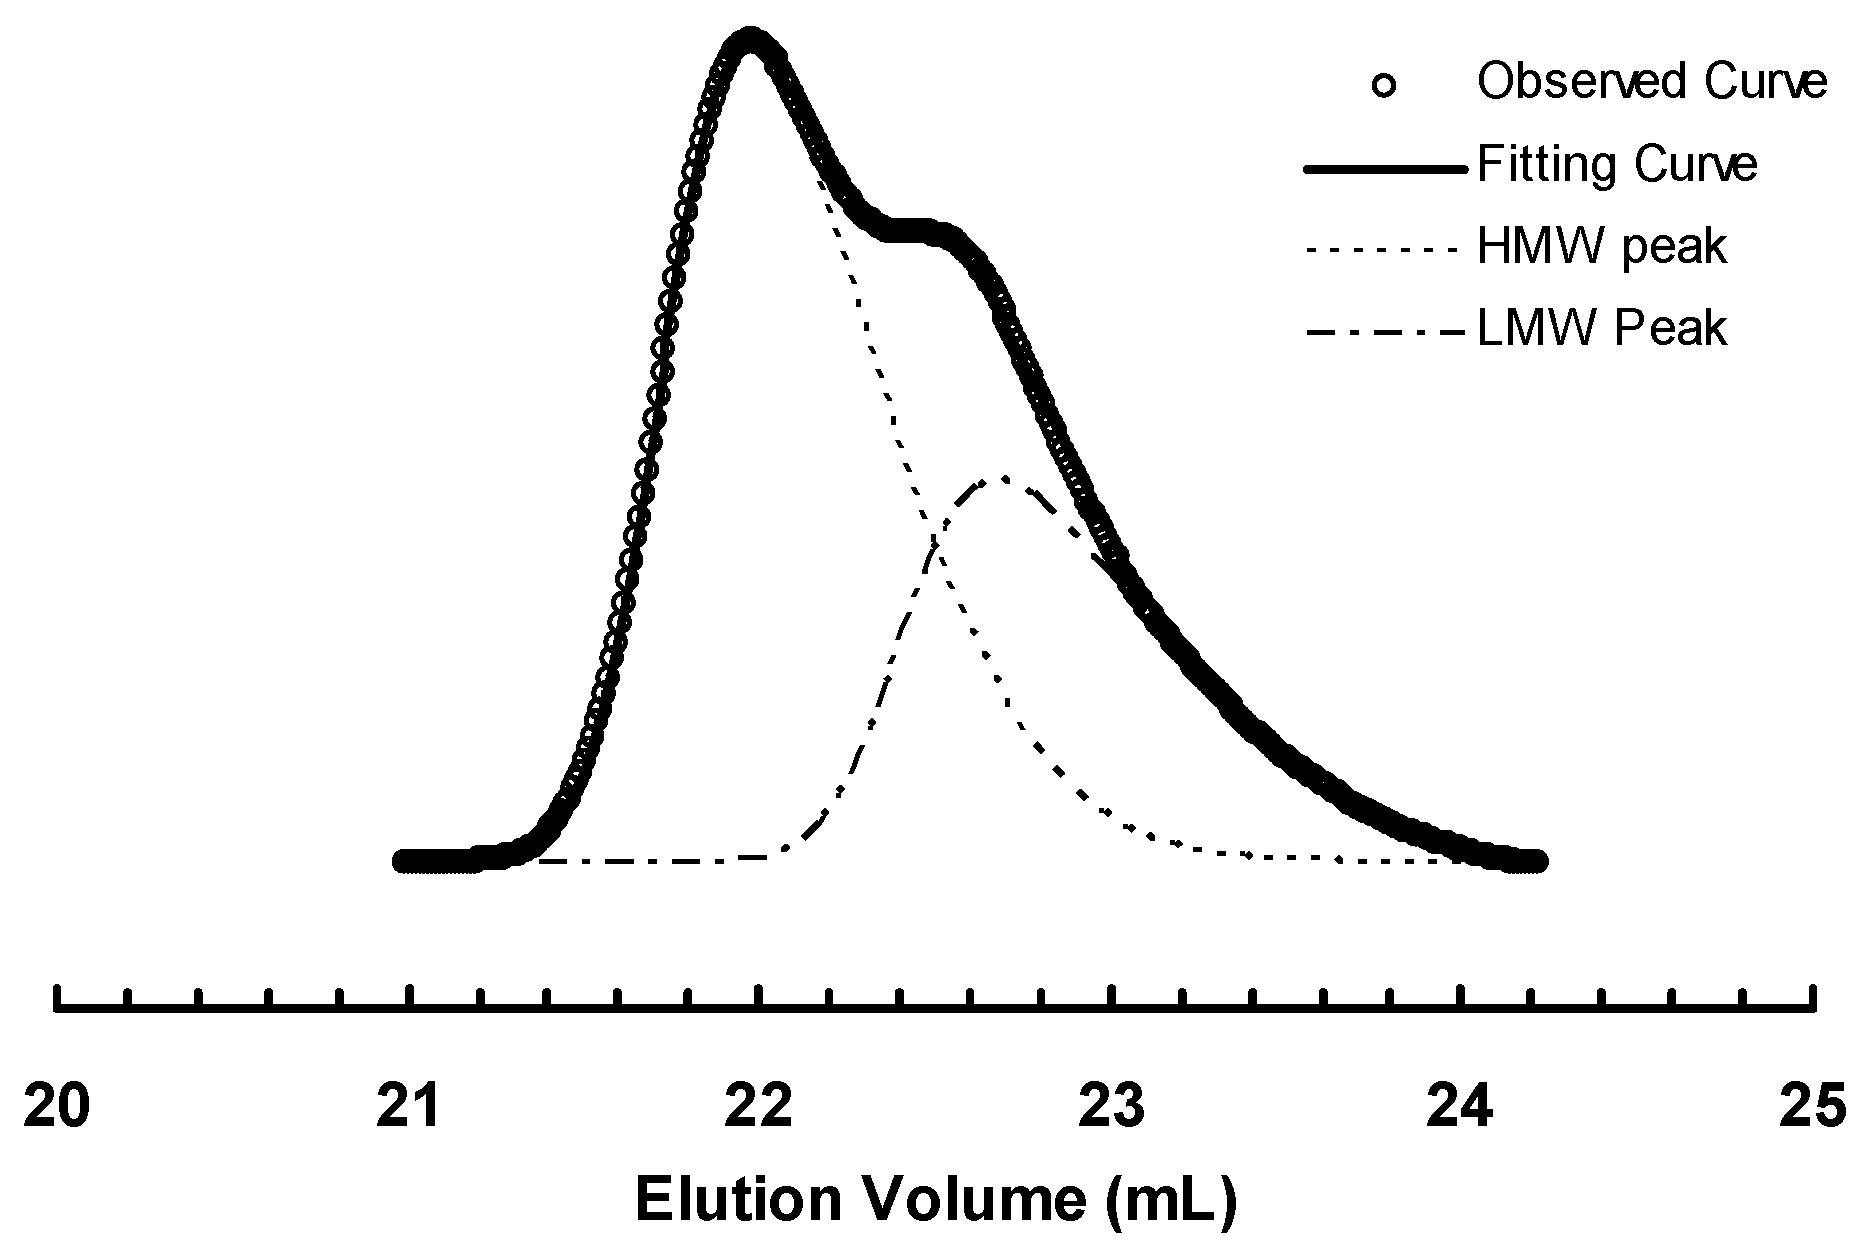
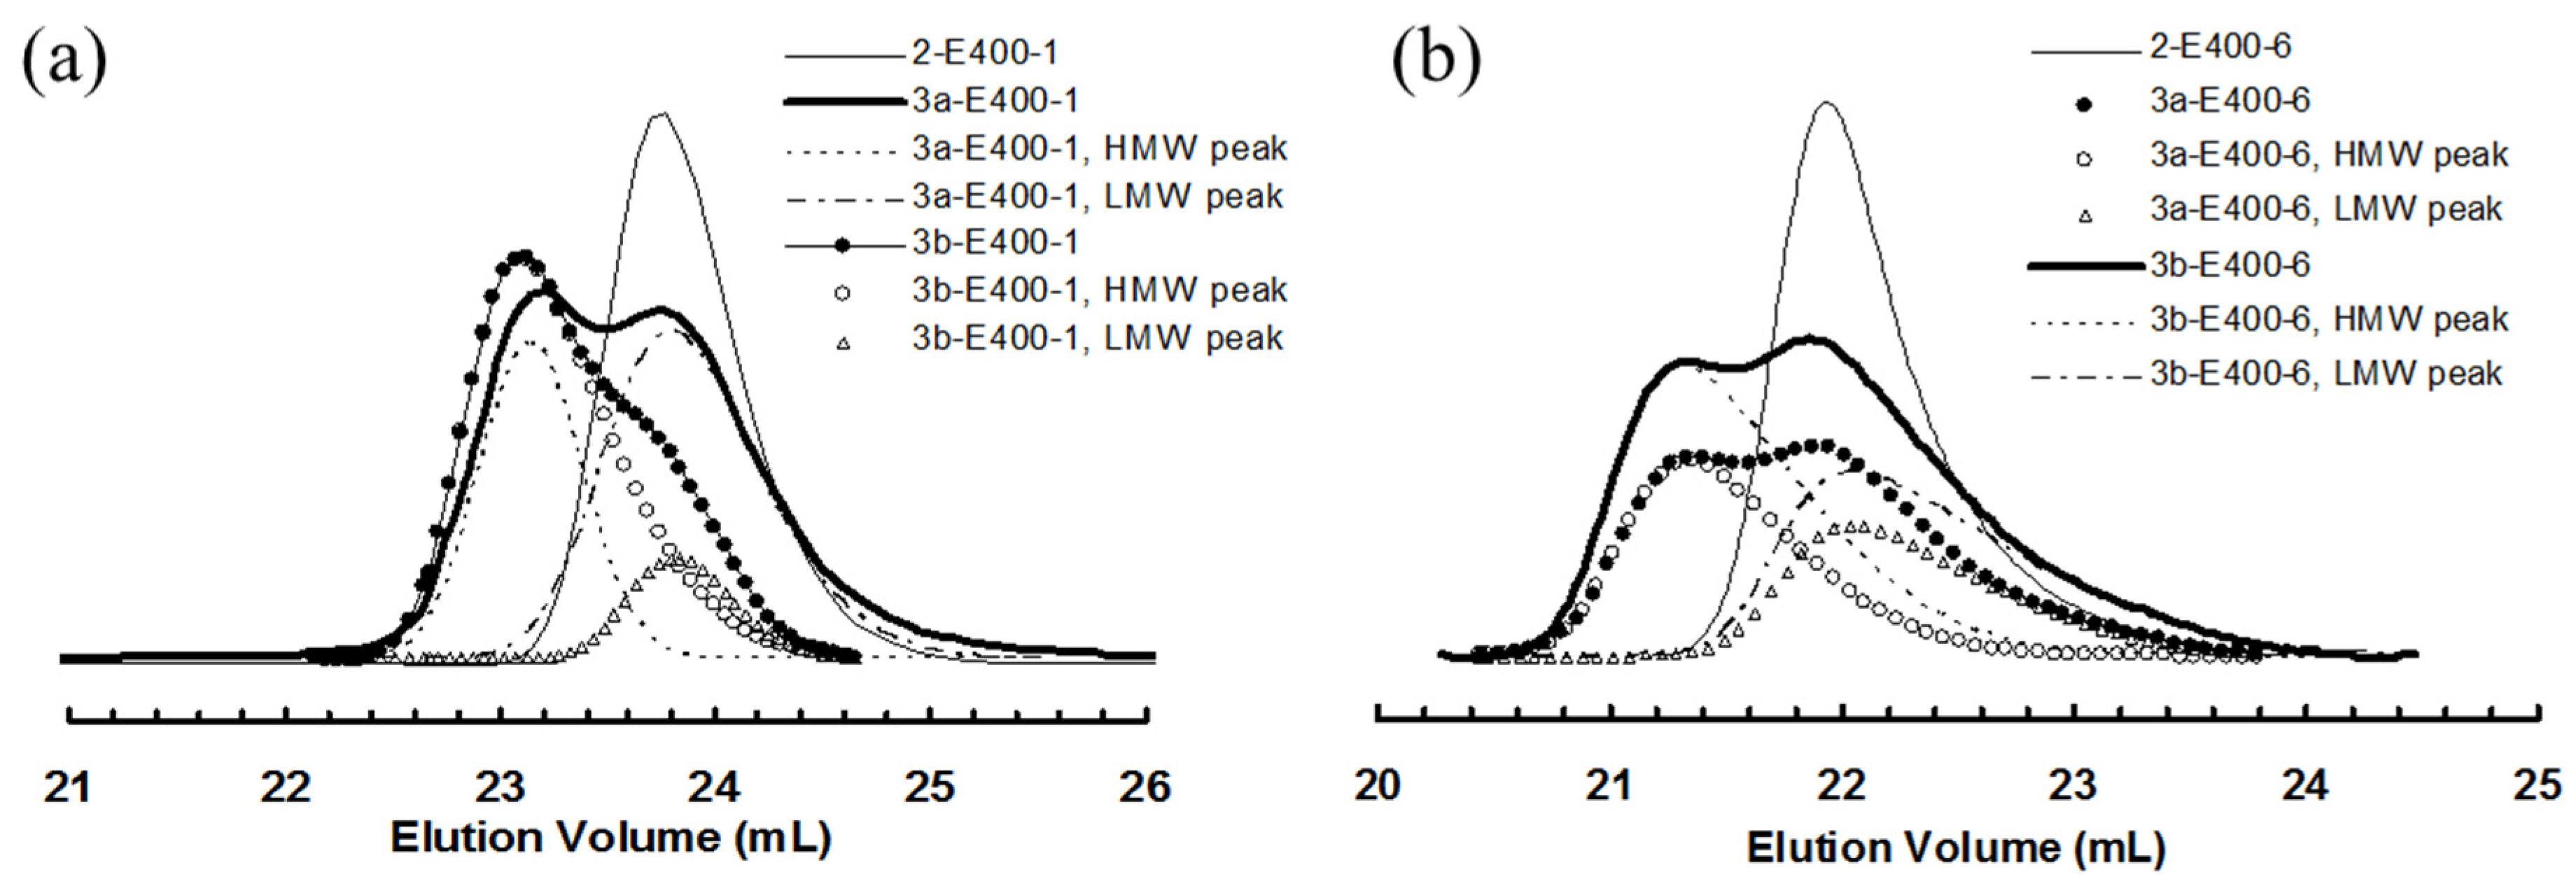
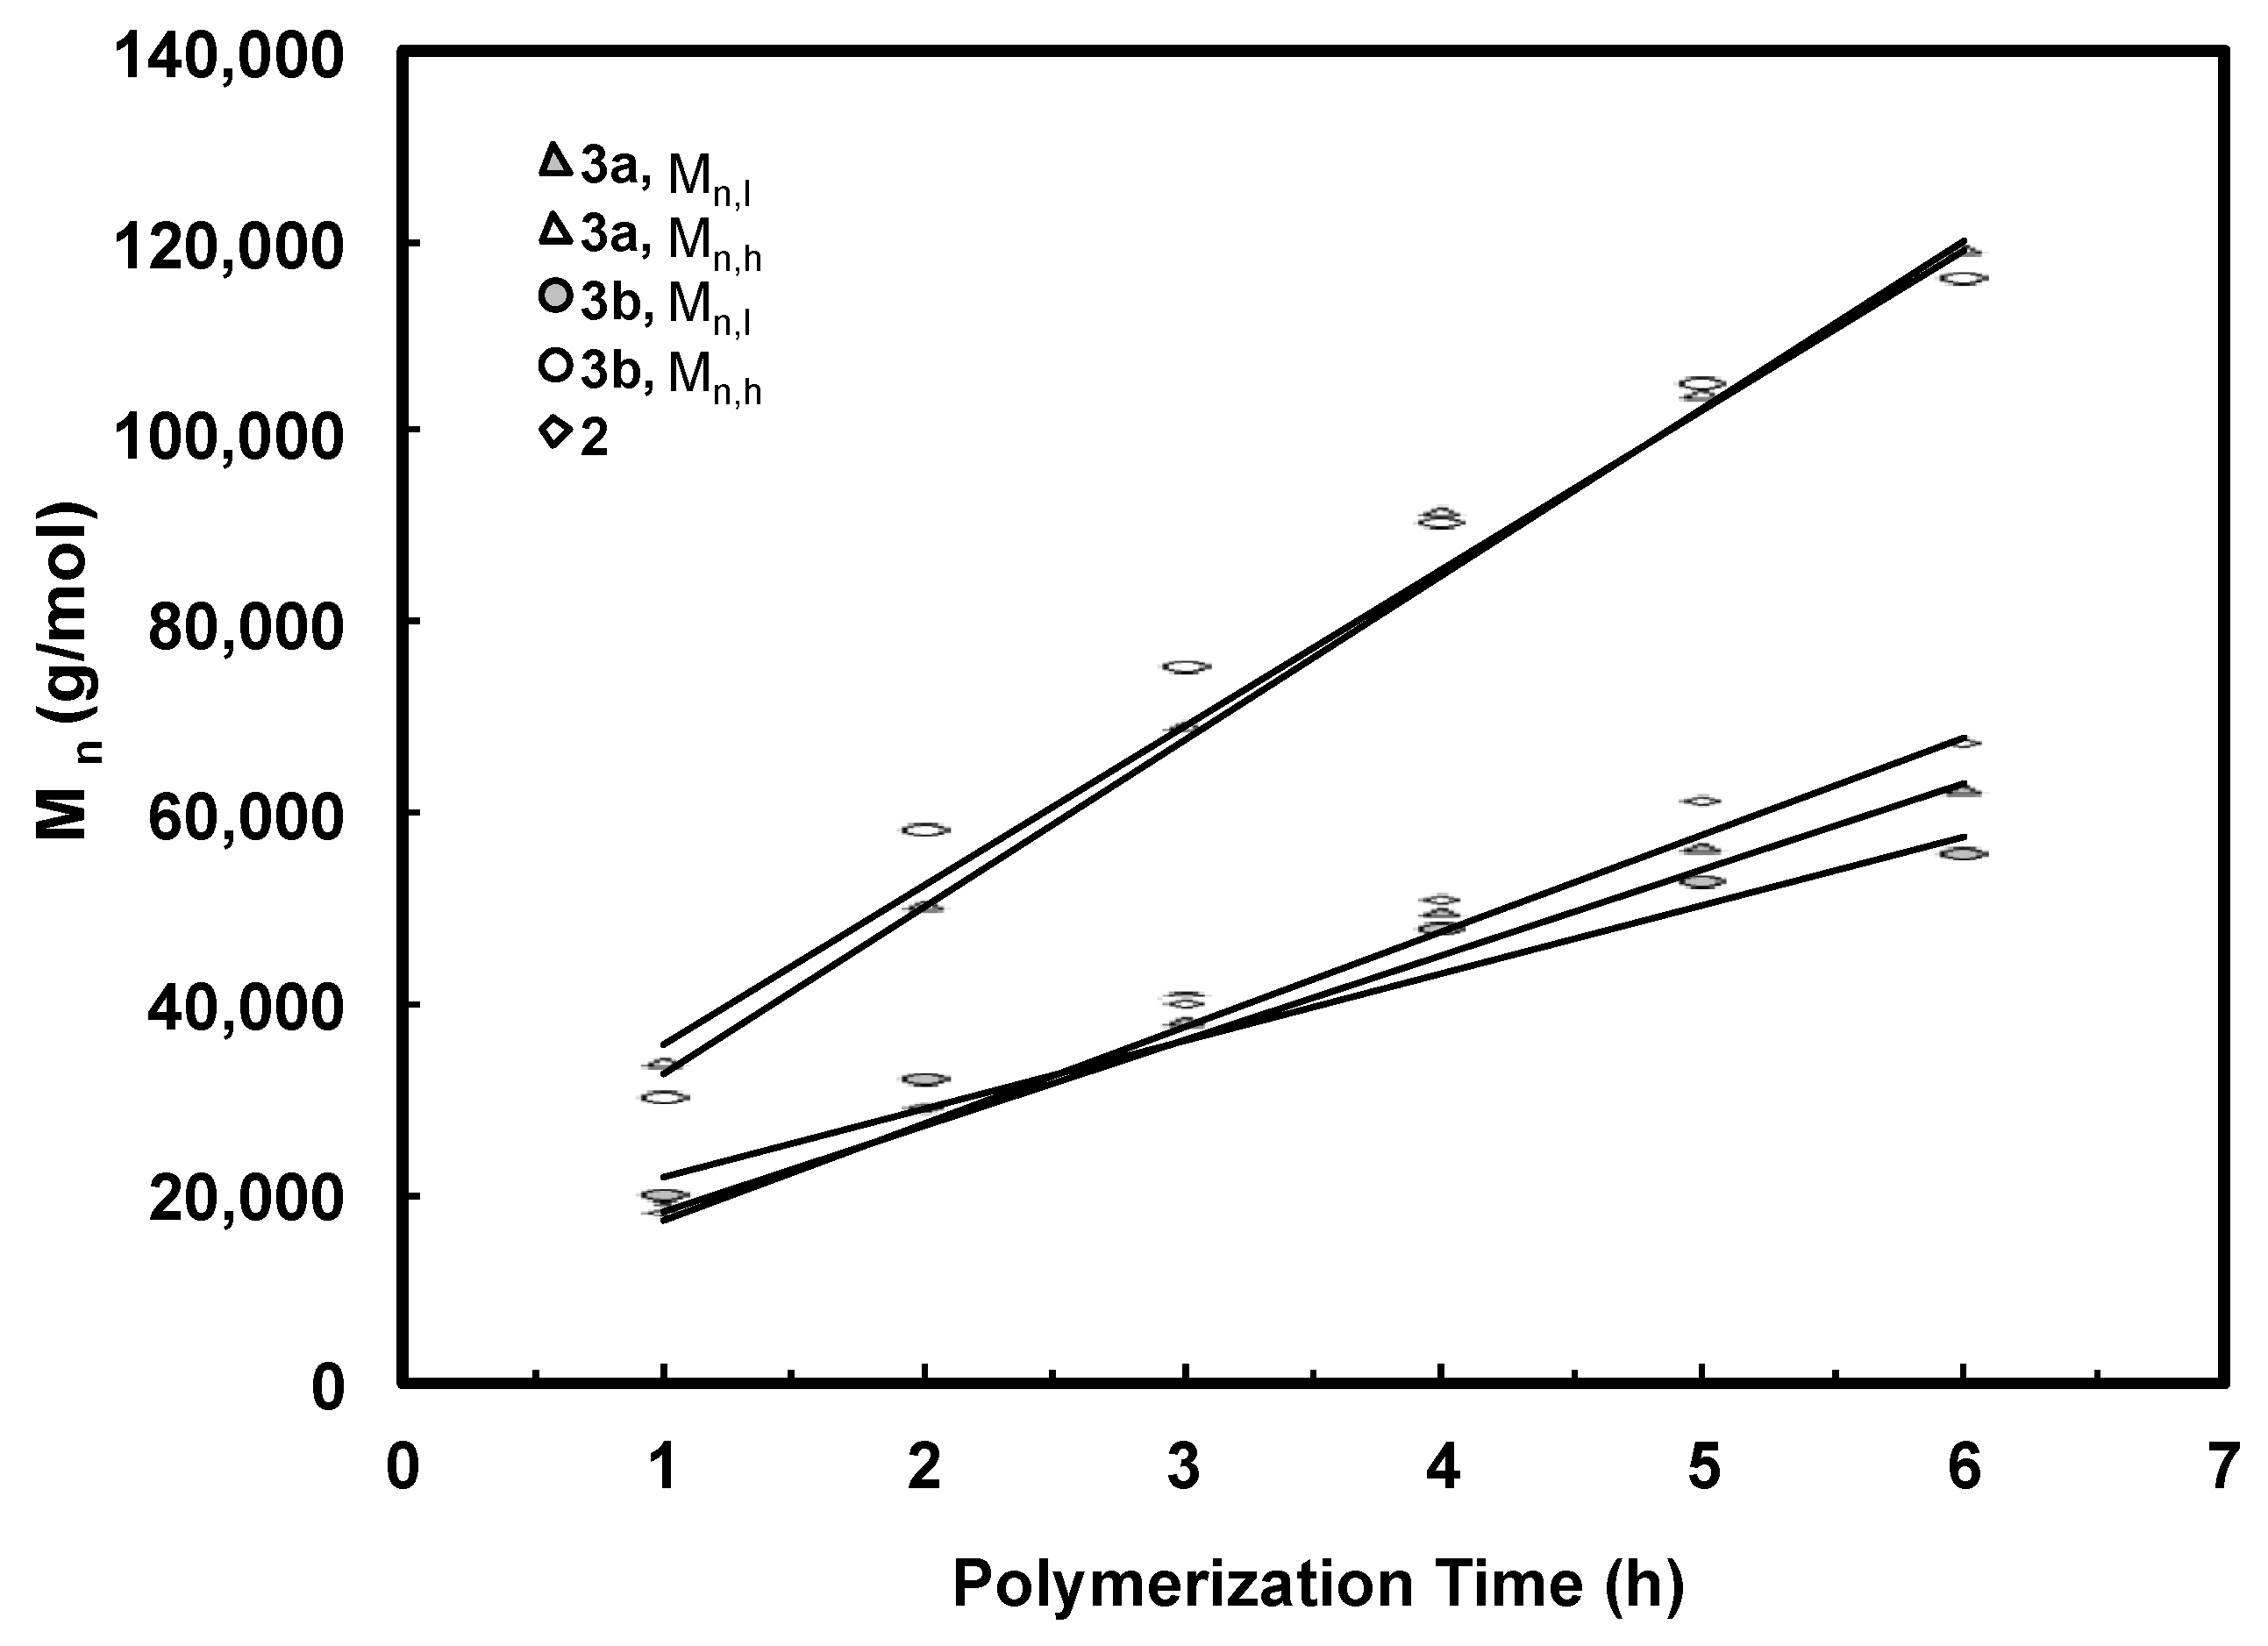
3.2. Ethylene “Living” Polymerization with 2, 3a, and 3b at 400 psi and 5 °C
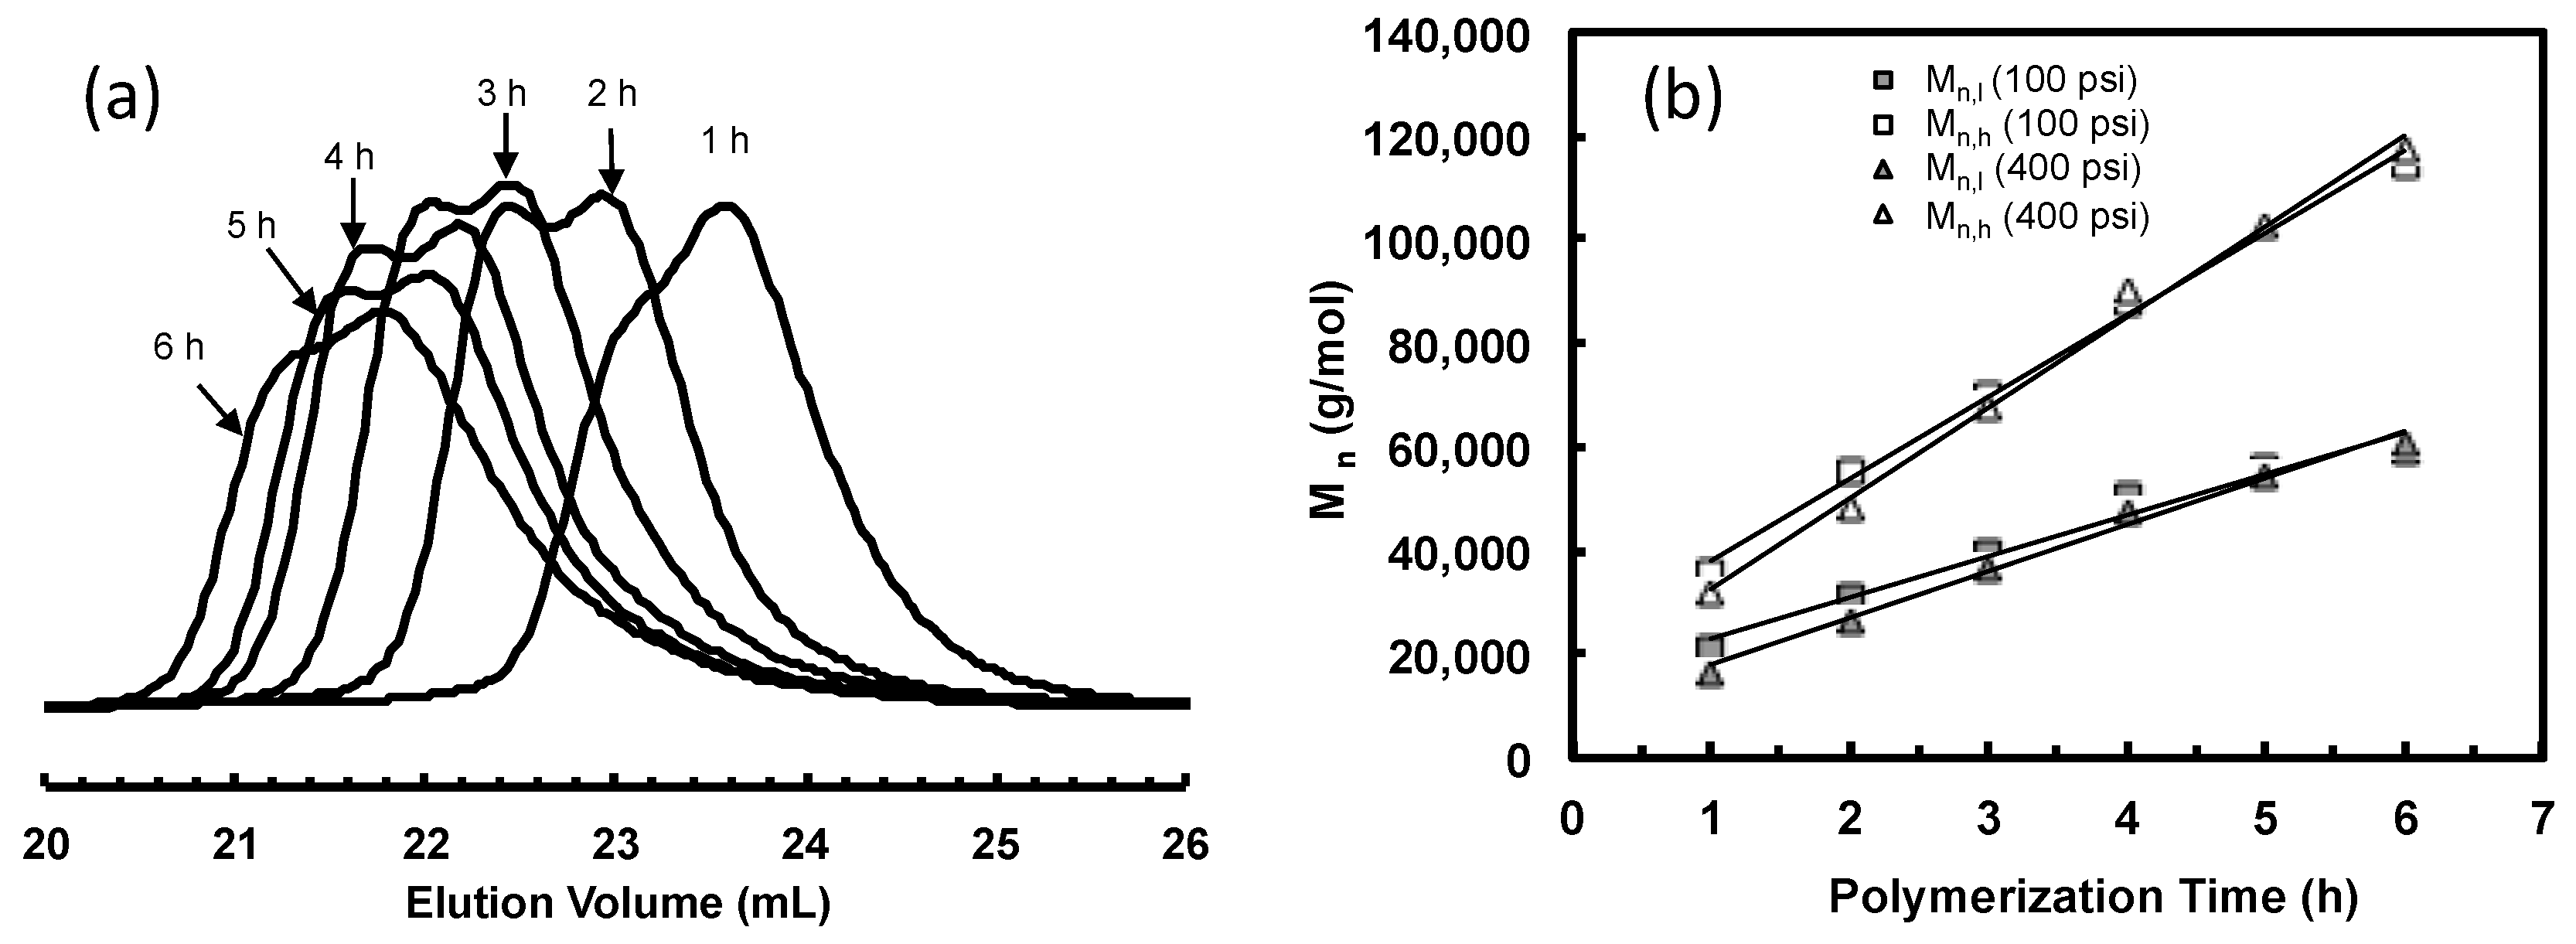
3.3. Ethylene “Living” Polymerization with 3a at 100 psi and 5 °C
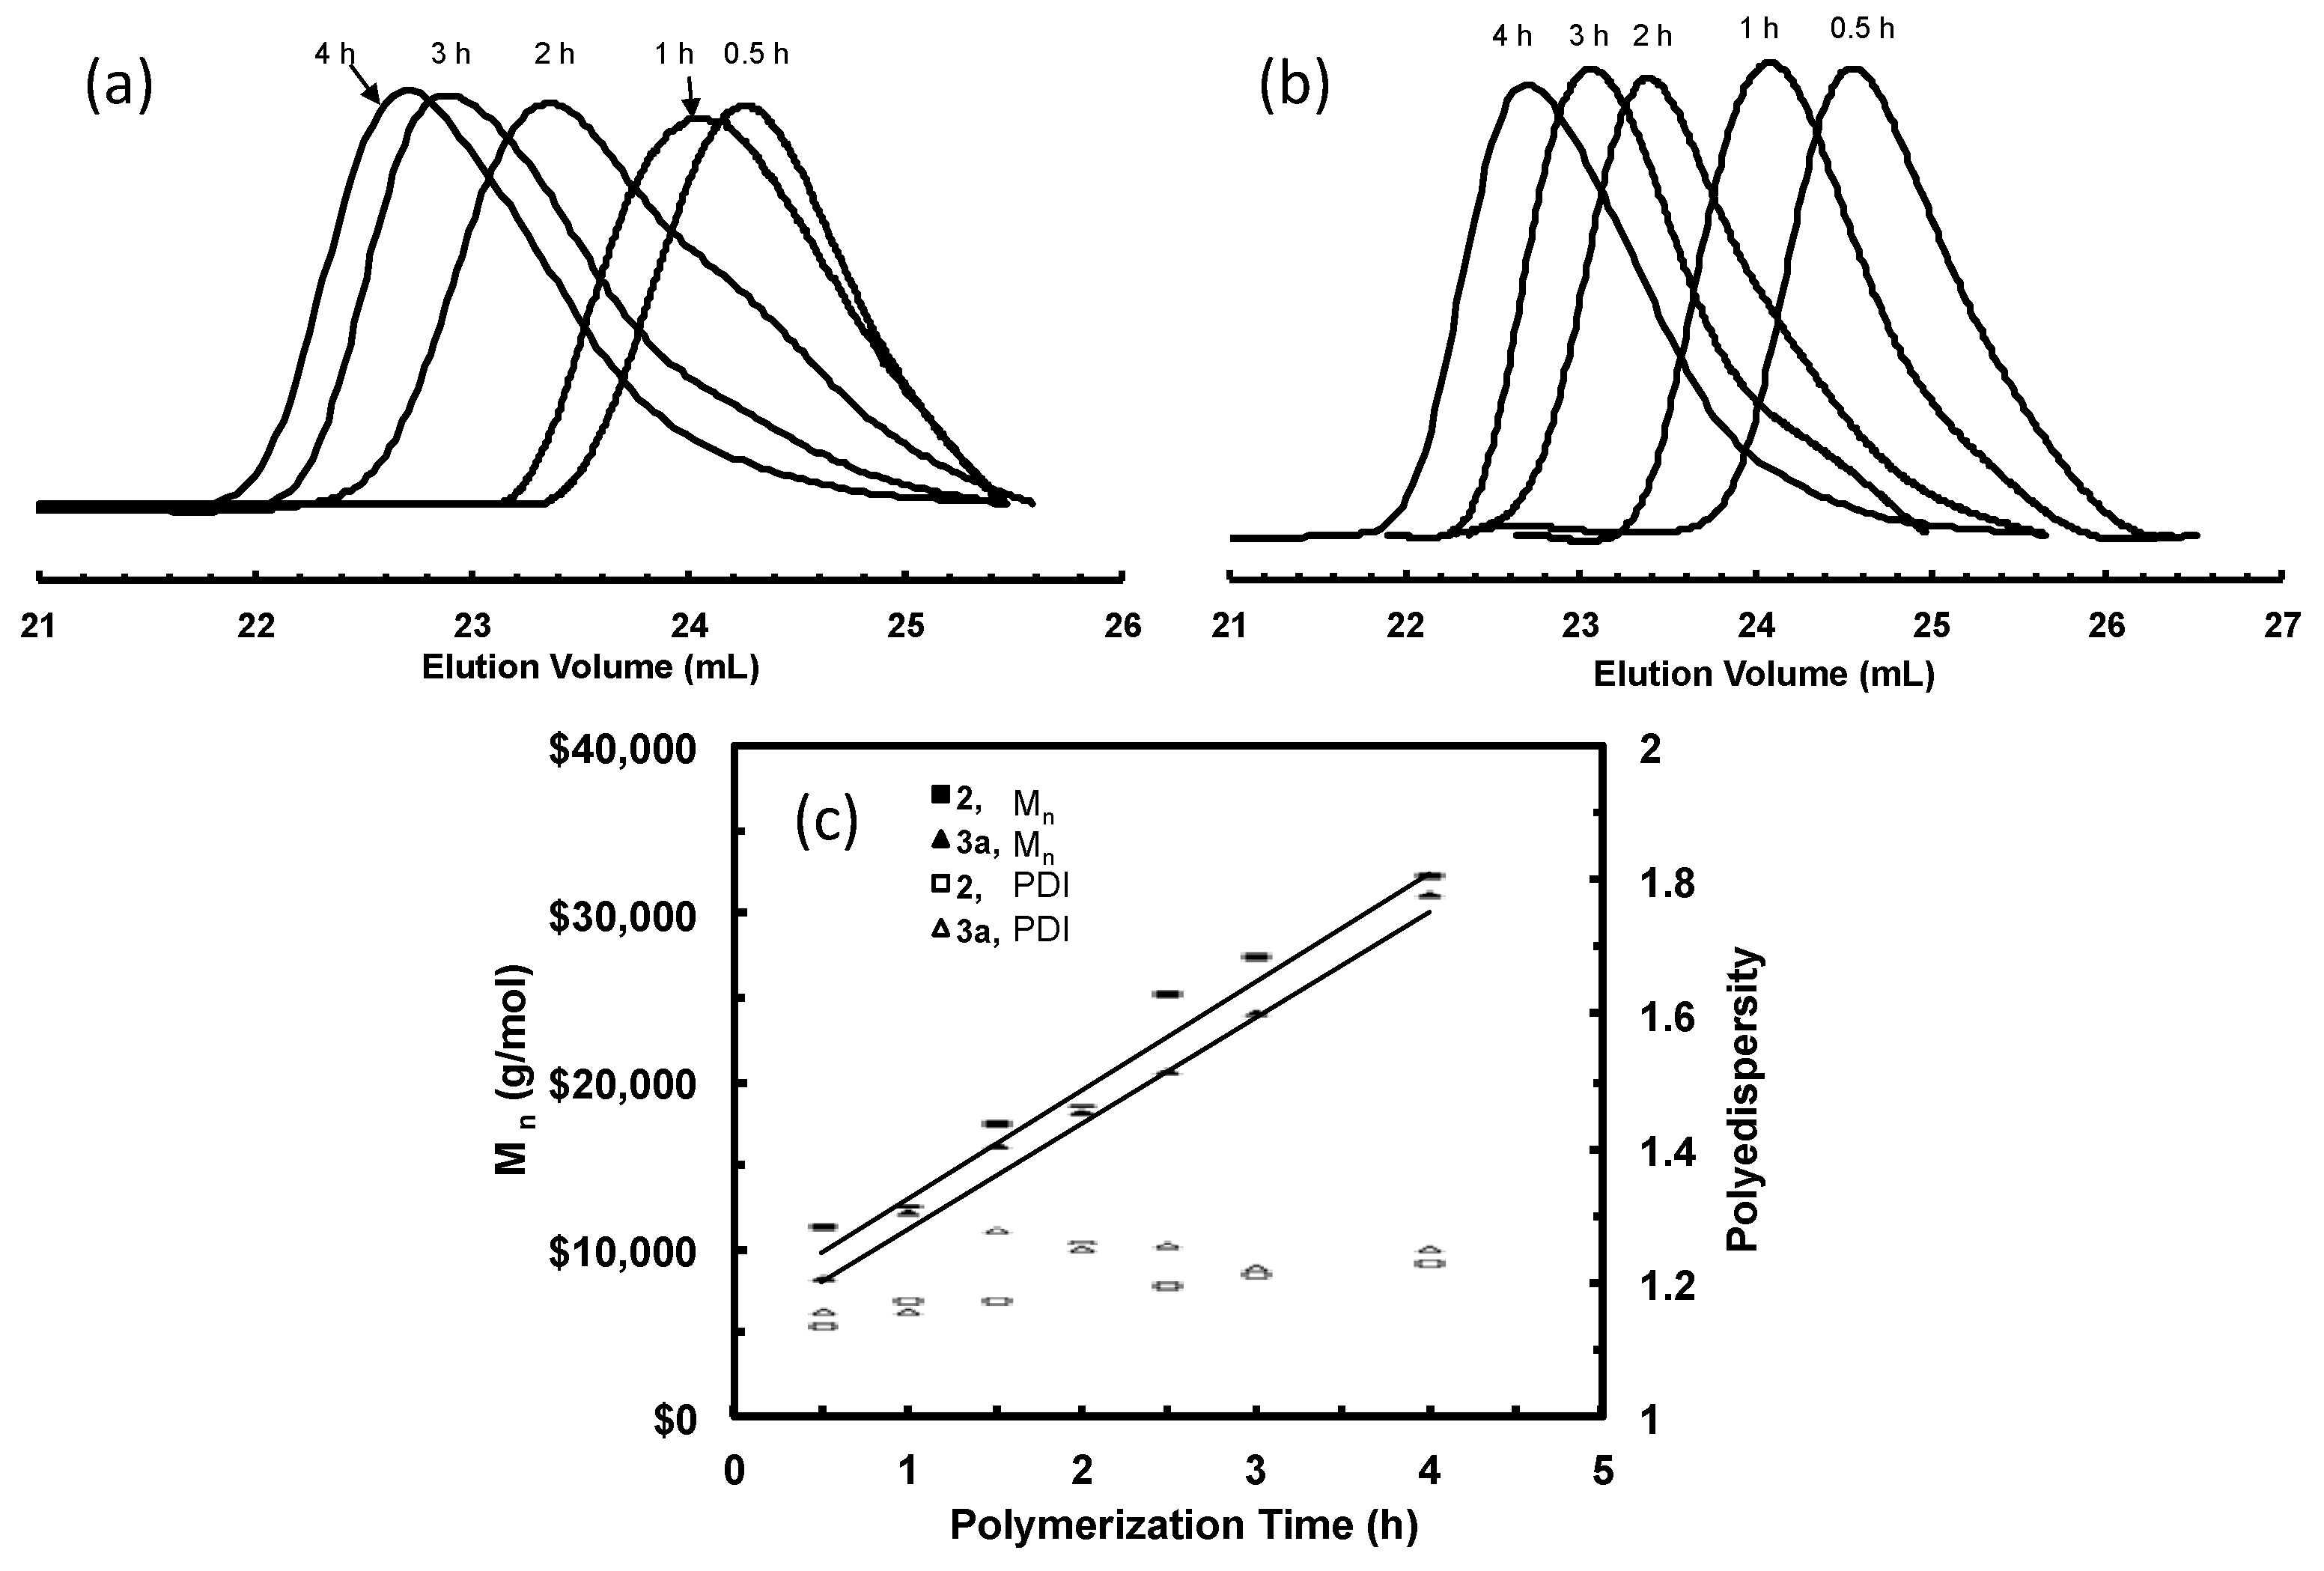
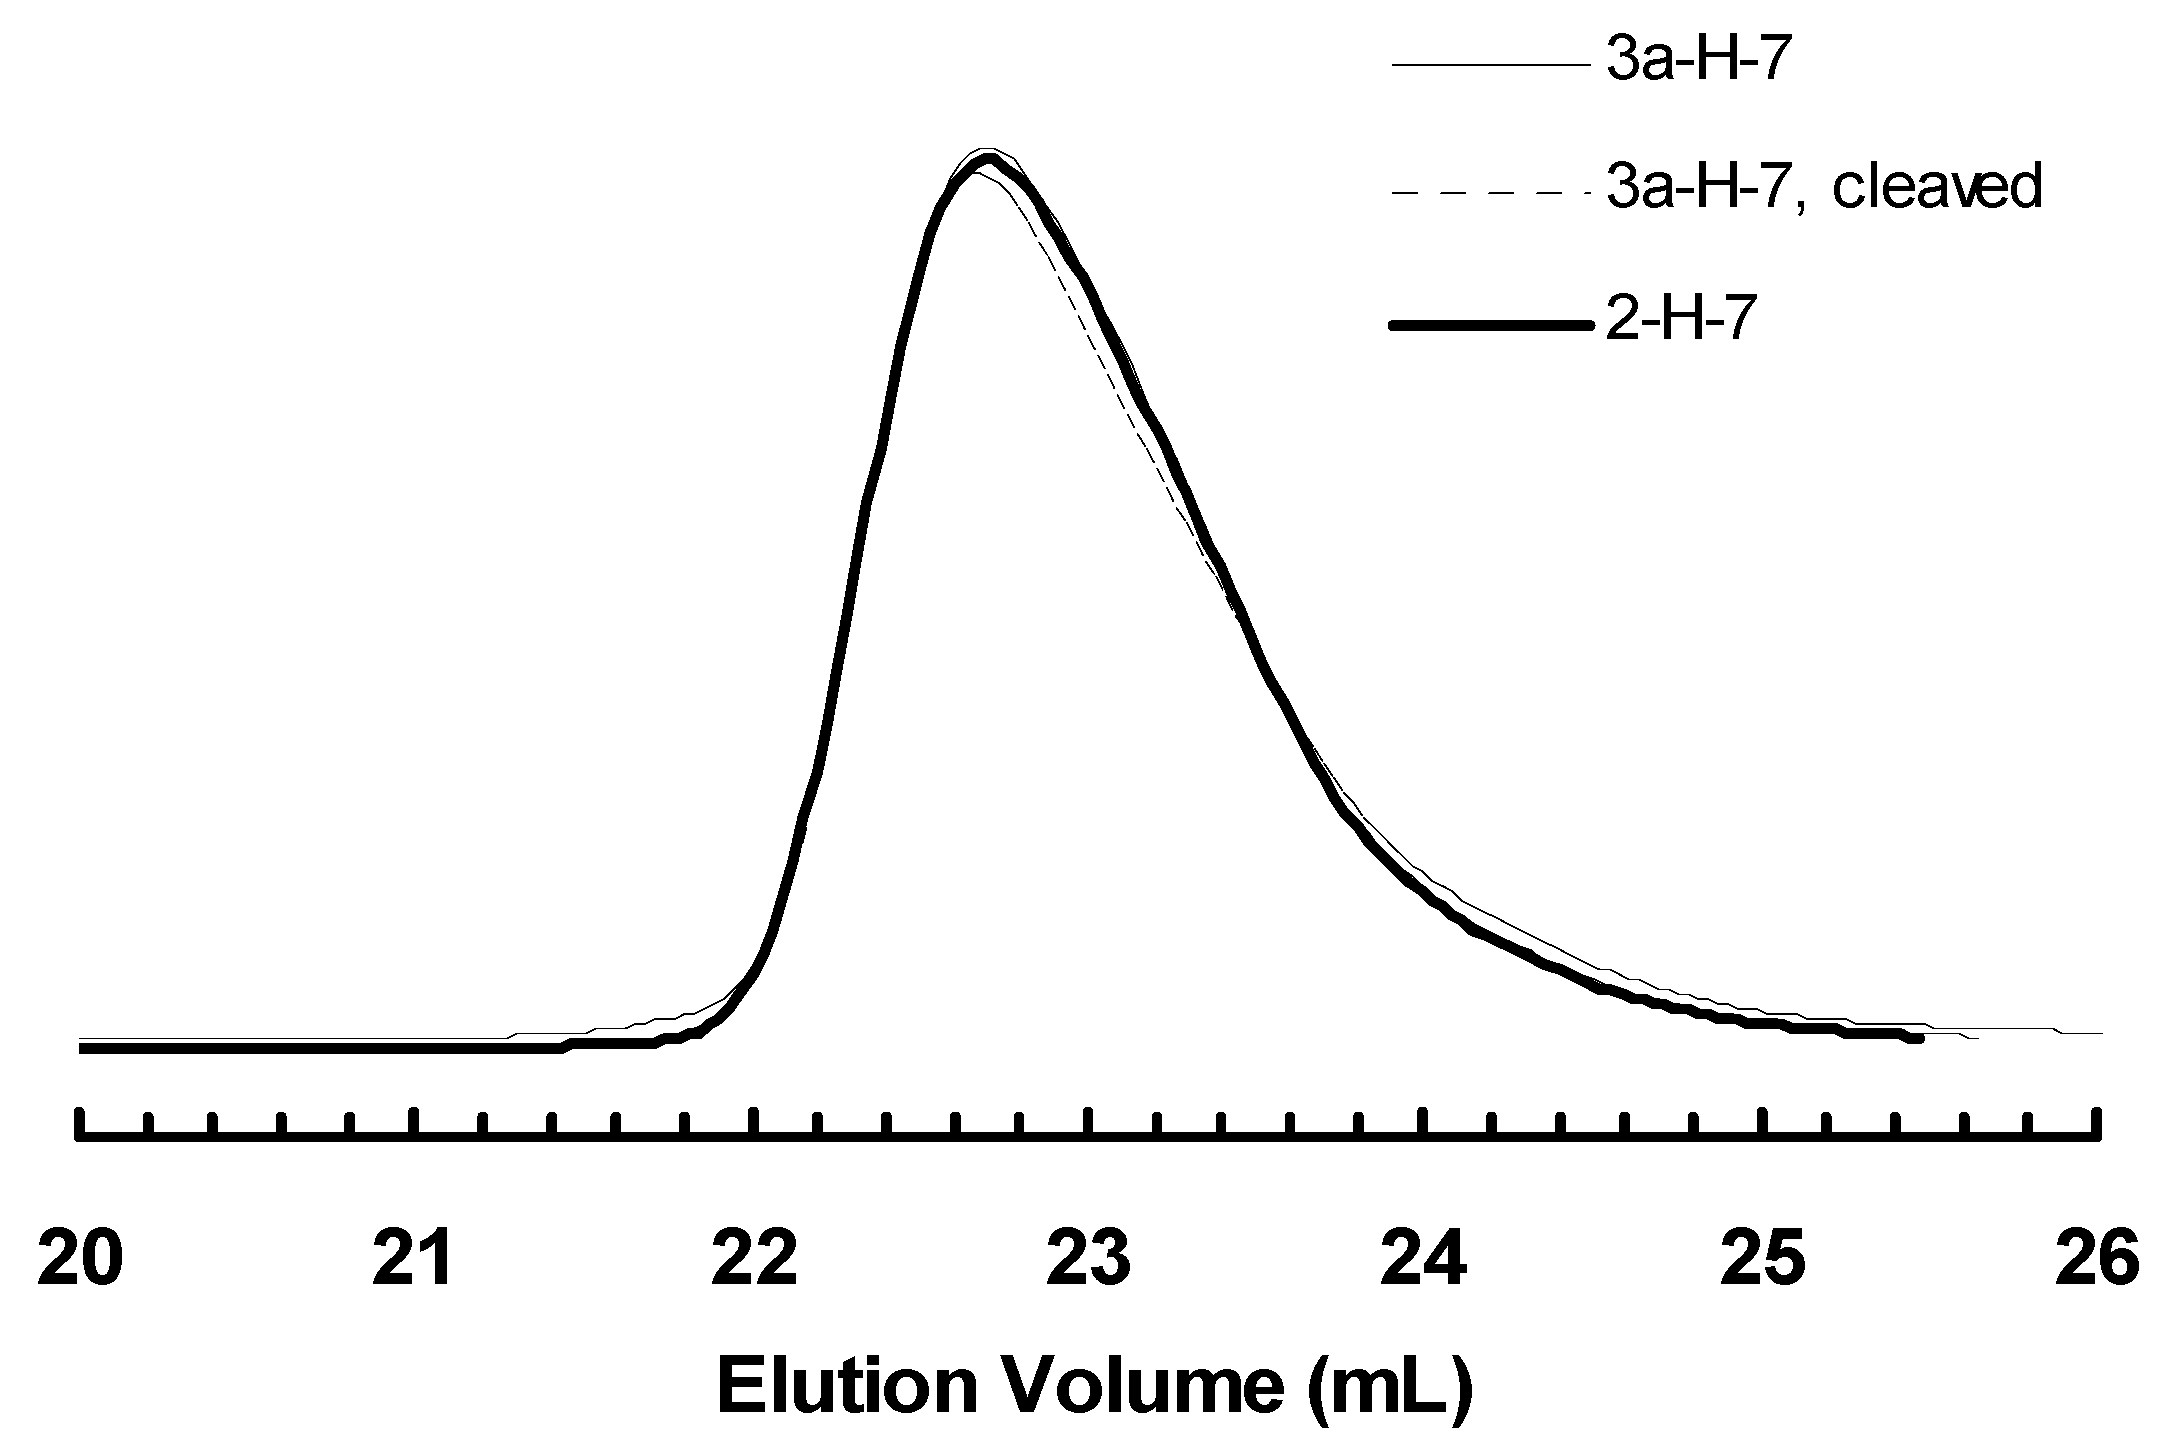
3.4. “Living” Polymerization of 1-Hexene at 0 °C
4. Conclusions
Supplementary Materials
Acknowledgments
Author Contributions
Conflicts of Interest
References
- Matyjaszewski, K.; Xia, J. Atom transfer radical polymerization. Chem. Rev. 2001, 101, 2921–2990. [Google Scholar] [CrossRef] [PubMed]
- Kamigaito, M.; Ando, T.; Sawamoto, M. Metal-catalyzed living radical polymerization. Chem. Rev. 2001, 101, 3689–3746. [Google Scholar] [CrossRef] [PubMed]
- Hawker, C.J.; Bosman, A.W.; Harth, E. New polymer synthesis by nitroxide mediated living radical polymerization. Chem. Rev. 2001, 101, 3661–3688. [Google Scholar] [CrossRef] [PubMed]
- Műller, A.H.E.; Baskaran, D. Anionic vinyl polymerization—50 years after Michael Szwarc. Prog. Polym. Sci. 2007, 32, 173–219. [Google Scholar] [CrossRef]
- Hadjichristidis, N.; Pitsikalis, M.; Pispas, S.; Iatrou, H. Polymers with complex architecture by living anionic polymerization. Chem. Rev. 2001, 101, 3747–3792. [Google Scholar] [CrossRef] [PubMed]
- Domski, G.J.; Rose, J.M.; Coates, G.W.; Bolig, A.D.; Brookhart, M. Living alkene polymerization: New methods for the precision synthesis of polyolefins. Prog. Polym. Sci. 2007, 32, 30–92. [Google Scholar] [CrossRef]
- Coates, G.W.; Hustad, P.D.; Reinartz, S. Catalysts for the living insertion polymerization of alkenes: Access to new polyolefin architectures using Zeigler-Natta chemistry. Angew. Chem. Int. Ed. 2002, 41, 2236–2257. [Google Scholar] [CrossRef]
- Yasuda, H. Organo transition metal initiated living polymerization. Prog. Polym. Sci. 2000, 25, 573–626. [Google Scholar] [CrossRef]
- Buchmeiser, M.R. Homogeneous metathesis polymerization by well defined group VI and group VIII transition-metal alkylidenes: Fundamentals and applications in the preparation of advanced materials. Chem. Rev. 2000, 100, 1565–1604. [Google Scholar] [CrossRef] [PubMed]
- Murata, M.; Fukui, Y.; Soga, K. Synthesis of a telechelic polypropylene with a vanadium-based living polymerization catalyst. Macromol. Rapid Commun. 1998, 19, 267–270. [Google Scholar] [CrossRef]
- Desurmont, G.; Tanaka, M.; Li, Y.; Yasuda, H.; Tokimitsu, T.; Tone, S.; Yanagase, A. New approach to block copolymerization of ethylene with polar monomers by the unique catalytic function of organolanthanide complexes. J. Polym. Sci. Polym. Chem. 2000, 38, 4095–4109. [Google Scholar] [CrossRef]
- Coffin, R.C.; Schneider, Y.; Kramer, E.J.; Bazan, G.C. Binuclear initiators for the telechclic synthesis of elastomeric polyolefins. J. Am. Chem. Soc. 2010, 132, 13869–13878. [Google Scholar] [CrossRef] [PubMed]
- Johnson, L.K.; Killian, C.M.; Brookhart, M. New Pd(II)-and Ni(II)-based catalysts for polymerization of ethylene and α-olefins. J. Am. Chem. Soc. 1995, 117, 6414–6415. [Google Scholar] [CrossRef]
- Killian, C.M.; Tempel, D.J.; Johnson, L.K.; Brookhart, M. Living polymerization of α-olefins using Ni(II)–α-diimine catalysts. Synthesis of new block polymers based on α-olefins. J. Am. Chem. Soc. 1996, 118, 11664–11665. [Google Scholar] [CrossRef]
- Gottfried, A.C.; Brookhart, M. Living polymerization of ethylene using Pd(II) α-diimine catalysts. Macromolecules 2001, 34, 1140–1142. [Google Scholar] [CrossRef]
- Gottfried, A.C.; Brookhart, M. Living and block copolymerization of ethylene and α-olefins using palladium(II)–α-diimine catalysts. Macromolecules 2003, 36, 3085–3100. [Google Scholar] [CrossRef]
- Ye, Z.; Xu, L.; Dong, Z.; Xiang, P. Designing polyethylenes of complex chain architectures via Pd–diimine-catalyzed “living” ethylene polymerization. Chem. Commun. 2013, 49, 6235–6255. [Google Scholar] [CrossRef] [PubMed]
- Zhang, K.; Ye, Z.; Subramanian, R. Synthesis of block copolymers of ethylene with styrene and n-butyl acrylate via a tandem strategy combining ethylene “living” polymerization catalyzed by a functionalized Pd–diimine catalyst with atom transfer radical polymerization. Macromolecules 2008, 41, 640–649. [Google Scholar] [CrossRef]
- Zhang, Y.; Ye, Z. Homogeneous polyhedral oligomeric silsesquioxane (POSS)-supported Pd–diimine complex and synthesis of polyethylene end-tethered with a POSS nanoparticle via ethylene “living” polymerization. Chem. Commun. 2008, 1178–1180. [Google Scholar] [CrossRef] [PubMed]
- Zhang, Y.; Ye, Z. Covalent surface grafting of branched polyethylenes on silica nanoparticles by surface-initiated ethylene “living” polymerization with immobilized Pd–diimine catalysts. Macromolecules 2008, 41, 6331–6338. [Google Scholar] [CrossRef]
- Zhang, K.; Ye, Z.; Subramanian, R. A trinuclear Pd–diimine catalyst for “core-first” synthesis of three-arm star polyethylenes via ethylene “living” polymerization. Macromolecules 2009, 42, 2313–2316. [Google Scholar] [CrossRef]
- Xia, X.; Ye, Z.; Morgan, S.; Lu, J. “Core-first” synthesis of multiarm star polyethylenes with a hyperbranched core and linear arms via ethylene multifunctional “living” polymerization with hyperbranched polyethylenes encapsulating multinuclear covalently tethered Pd–diimine catalysts. Macromolecules 2010, 43, 4889–4901. [Google Scholar] [CrossRef]
- Xu, Y.; Xiang, P.; Ye, Z.; Wang, W.-J. Hyperbranched–linear polyethylene block polymers constructed with chain blocks of hybrid chain topologies via one-pot stagewise chain walking ethylene “living” polymerization. Macromolecules 2010, 43, 8026–8038. [Google Scholar] [CrossRef]
- Liu, P.; Landry, E.; Ye, Z.; Joly, H.; Wang, W.-J.; Li, B.-G. “Arm-first” synthesis of core-cross-linked multiarm star polyethylenes by coupling palladium-catalyzed ethylene “living” polymerization with atom-transfer radical polymerization. Macromolecules 2011, 44, 4125–4139. [Google Scholar] [CrossRef]
- Zhang, Z.; Ye, Z. A ligand exchange strategy for one-pot sequential synthesis of (hyperbranched polyethylene)–b–(linear polyketone) block polymers. Chem. Commun. 2012, 48, 7940–7942. [Google Scholar] [CrossRef] [PubMed]
- Xiang, P.; Petrie, K.; Kontopoulou, M.; Ye, Z.; Subramanian, R. Tuning structural parameters of polyethylene brushes on silica nanoparticles in surface-initiated ethylene “living” polymerization and effects on silica dispersion in a polyolefin matrix. Polym. Chem. 2013, 4, 1381–1395. [Google Scholar] [CrossRef]
- Landry, E.; Ye, Z. Convenient Pd-catalyzed synthesis of large unimolecular star polyethylene nanoparticles. Macromol. Rapid Commun. 2013, 34, 1493–1498. [Google Scholar] [CrossRef] [PubMed]
- Xu, L.; Ye, Z. A Pd–diimine catalytic inimer for synthesis of polyethylenes of hyperbranched-on-hyperbranched and star architectures. Chem. Commun. 2013, 49, 8800–8802. [Google Scholar] [CrossRef] [PubMed]
- Liu, P.; Ye, Z.; Wang, W.-J.; Li, B.-G. Synthesis of polyethylene and polystyrene miktoarm star copolymers using an “in–out” strategy. Polym. Chem. 2014, 5, 5443–5452. [Google Scholar] [CrossRef]
- Xiang, P.; Ye, Z. Alternating, gradient, block, and block-gradient copolymers of ethylene and norbornene by Pd–diimine-catalyzed “living” copolymerization. J. Polym. Sci. Polym. Chem. 2013, 51, 672–686. [Google Scholar] [CrossRef]
- Guan, Z.; Cotts, P.M.; McCord, E.F.; McLain, S.J. Chain walking: A new strategy to control polymer topology. Science 1999, 283, 2059–2062. [Google Scholar] [CrossRef] [PubMed]
- Guan, Z. Control of polymer topology by chain-walking catalysts. Chem. Eur. J. 2002, 8, 3086–3092. [Google Scholar] [CrossRef]
- Cotts, P.M.; Guan, Z.; McCord, E.; McLain, S. Novel branching topology in polyethylenes as revealed by light scattering and 13C NMR. Macromolecules 2000, 33, 6945–6952. [Google Scholar] [CrossRef]
- Chen, G.; Ma, X.S.; Guan, Z. Synthesis of functional olefin copolymers with controllable topologies using a chain-walking catalyst. J. Am. Chem. Soc. 2003, 125, 6697–6704. [Google Scholar] [CrossRef] [PubMed]
- Johnson, L.K.; Mecking, S.; Brookhart, M. Copolymerization of ethylene and propylene with functionalized vinyl monomers by palladium(II) catalysts. J. Am. Chem. Soc. 1996, 118, 267–268. [Google Scholar] [CrossRef]
- Mecking, S.; Johnson, L.K.; Wang, L.; Brookhart, M. Mechanistic studies of the palladium-catalyzed copolymerization of ethylene and α-olefins with methyl acrylate. J. Am. Chem. Soc. 1998, 120, 888–899. [Google Scholar] [CrossRef]
- Ye, Z.; Zhu, S. Newtonian flow behavior of hyperbranched high-molecular-weight polyethylenes produced with a Pd–diimine catalyst and its dependence on chain topology. Macromolecules 2003, 36, 2194–2197. [Google Scholar] [CrossRef]
- Ye, Z.; AlObaidi, F.; Zhu, S. Melt rheological properties of branched polyethylenes produced with Pd–and Ni–diimine catalysts. Macromol. Chem. Phys. 2004, 205, 897–906. [Google Scholar] [CrossRef]
- Wang, J.; Ye, Z.; Joly, H. Synthesis and characterization of hyperbranched polyethylenes tethered with polyhedral oligomeric silsesquioxane (POSS) nanoparticles by chain walking ethylene copolymerization with acryloisobutyl–POSS. Macromolecules 2007, 40, 6150–6163. [Google Scholar] [CrossRef]
- Zhang, K.; Wang, J.; Subramanian, R.; Ye, Z.; Lu, J.; Yu, Q. Chain walking ethylene copolymerization with an ATRP inimer for one-pot synthesis of hyperbranched polyethylenes tethered with ATRP initiating sites. Macromol. Rapid Commun. 2007, 28, 2185–2191. [Google Scholar] [CrossRef]
- Wang, J.; Zhang, K.; Ye, Z. One-pot synthesis of hyperbranched polyethylenes tethered with polymerizable methacryloyl groups via selective ethylene copolymerization with heterobifunctional comonomers by chain walking Pd–diimine catalysis. Macromolecules 2008, 41, 2290–2293. [Google Scholar] [CrossRef]
- Xiang, P.; Ye, Z.; Morgan, S.; Xia, X.; Liu, W. Tuning polyethylene chain topology via ring incorporation in chain walking ethylene polymerization. Macromolecules 2009, 42, 4946–4949. [Google Scholar] [CrossRef]
- Xiang, P.; Ye, Z. Copolymerization of ethylene with sterically hindered 3,3-dimethyl-1-butene using a chain-walking Pd–diimine catalyst. Macromol. Rapid Commun. 2010, 31, 1083–1089. [Google Scholar] [CrossRef] [PubMed]
- Xiang, P.; Ye, Z. Hyperbranched polyethylene ionomers containing cationic tetralkylammonium ions synthesized by Pd–diimine-catalyzed direct ethylene copolymerization with ionic liquid comonomers. Macromolecules 2015, 48, 6096–6107. [Google Scholar] [CrossRef]
- Ye, Z.; Li, S. Hyperbranched polyethylenes and functionalized polymers by chain walking polymerization with Pd–diimine catalysis. Macromol. React. Eng. 2010, 4, 319–332. [Google Scholar] [CrossRef]
- Dong, Z.; Ye, Z. Hyperbranched polyethylenes by chain walking polymerization: synthesis, properties, functionalization, and applications. Polym. Chem. 2012, 3, 286–301. [Google Scholar] [CrossRef]
- Dai, S.; Sui, X.; Chen, C. Highly robust palladium(II) α-diimine catalysts for slow-chain-walking polymerization of ethylene and copolymerization with methyl acrylate. Angew. Chem. Int. Ed. 2015, 54, 9948–9953. [Google Scholar] [CrossRef] [PubMed]
- Wang, R.; Zhao, M.; Chen, C. Influence of ligand second coordination sphere effects on the olefin (co)polymerization properties of α-diimine Pd(II) catalysts. Polym. Chem. 2016, 7, 3933–3938. [Google Scholar] [CrossRef]
- Ye, Z.; Feng, W.; Zhu, S.; Yu, Q. Effect of chain straightening on plateau modulus and entanglement molecular weight of Ni-diimine poly(1-hexene)s. Macromol. Rapid Commun. 2006, 27, 871–876. [Google Scholar] [CrossRef]
- Takano, S.; Takeuchi, D.; Osakada, K.; Akamatsu, N.; Shishido, A. Dipalladium catalyst for olefin polymerization: introduction of acrylate units into the main chain of branched polyethylene. Angew. Chem. Int. Ed. 2014, 53, 9246–9250. [Google Scholar] [CrossRef] [PubMed]
- Zhu, L.; Fu, Z.-S.; Pan, H.-J.; Feng, W.; Chen, C.; Fan, Z.-Q. Synthesis and application of binuclear α-diimine nickel/palladium catalysts with a conjugated backbone. Dalton Trans. 2014, 43, 2900–2906. [Google Scholar] [CrossRef] [PubMed]
- Na, Y.; Wang, X.; Lian, K.; Zhu, Y.; Li, W.; Luo, Y.; Chen, C. Dinuclear α-diimine NiII and PdII complexes that catalyze ethylene polymerization and copolymerization. Chem. Cat. Chem. 2017, 9, 1062–1066. [Google Scholar] [CrossRef]
- Angot, S.; Murthy, K.S.; Taton, D.; Gnanou, Y. Scope of the copper halide/bipyridyl system associated with calixarene-based multihalides for the synthesis of well-defined polystyrene and poly(meth)acrylate stars. Macromolecules 2000, 33, 7261–7274. [Google Scholar] [CrossRef]


| Sample | Time (h) | Mn b (kg/mol) | PDI b | Branches c (/1000 C) |
|---|---|---|---|---|
| 2-E400-1 | 1 | 16 | 1.06 | 101 |
| 2-E400-2 | 2 | 27 | 1.09 | 100 |
| 2-E400-3 | 3 | 38 | 1.09 | 105 |
| 2-E400-4 | 4 | 49 | 1.10 | 98 |
| 2-E400-5 | 5 | 59 | 1.08 | 101 |
| 2-E400-6 | 6 | 65 | 1.11 | 103 |
| Sample | Time (h) | Mn b (kg/mol) | PDI b | Branches c/1000 C | High Molecular Weight Peak d | Low Molecular Weight Peak d | Mn,h/Mn,l | Peak Area% (h/l) | ||
|---|---|---|---|---|---|---|---|---|---|---|
| Mn,h (kg/mol) | PDIh | Mn,l (kg/mol) | PDIl | |||||||
| 3a-E400-1 | 1 | 21 | 1.21 | 99 | 32 | 1.04 | 17 | 1.10 | 1.9 | 39/61 |
| 3a-E400-2 | 2 | 33 | 1.21 | 98 | 48 | 1.09 | 27 | 1.09 | 1.8 | 61/39 |
| 3a-E400-3 | 3 | 45 | 1.24 | 100 | 67 | 1.09 | 36 | 1.12 | 1.9 | 60/40 |
| 3a-E400-4 | 4 | 56 | 1.25 | 100 | 90 | 1.08 | 48 | 1.12 | 1.9 | 52/48 |
| 3a-E400-5 | 5 | 66 | 1.26 | 106 | 102 | 1.10 | 55 | 1.13 | 1.9 | 44/56 |
| 3a-E400-6 | 6 | 77 | 1.25 | 101 | 118 | 1.13 | 61 | 1.15 | 1.9 | 43/57 |
| Sample | Time (h) | Mn b (kg/mol) | PDI b | Branches c/1000 C | High Molecular Weight Peak d | Low Molecular Weight Peak d | Mn,h/Mn,l | Peak Area% (h/l) | ||
|---|---|---|---|---|---|---|---|---|---|---|
| Mn,h (kg/mol) | PDIh | Mn,l (kg/mol) | PDIl | |||||||
| 3b-E400-1 | 1 | 22 | 1.20 | 97 | 29 | 1.09 | 18 | 1.04 | 1.6 | 85/15 |
| 3b-E400-2 | 2 | 39 | 1.22 | 98 | 56 | 1.06 | 30 | 1.07 | 1.9 | 67/33 |
| 3b-E400-3 | 3 | 51 | 1.19 | 98 | 73 | 1.08 | 38 | 1.11 | 1.9 | 65/35 |
| 3b-E400-4 | 4 | 55 | 1.31 | 100 | 89 | 1.10 | 46 | 1.13 | 1.9 | 62/38 |
| 3b-E400-5 | 5 | 60 | 1.32 | 99 | 103 | 1.12 | 51 | 1.18 | 2.0 | 43/57 |
| 3b-E400-6 | 6 | 68 | 1.41 | 101 | 114 | 1.14 | 54 | 1.22 | 2.1 | 44/56 |
| Sample | Before Cleavage | After Cleavage | Percentage Drop in Mn | ||
|---|---|---|---|---|---|
| Mn (kg/mol) | PDI | Mn (kg/mol) | PDI | ||
| 2-E400-6 | 65 | 1.11 | 61 | 1.13 | 6 |
| 3a-E400-6 | 77 | 1.25 | 54 | 1.17 | 30 |
| 3b-E400-3 | 51 | 1.19 | 36 | 1.10 | 29 |
| 3b-E400-5 | 71 | 1.32 | 53 | 1.14 | 25 |
| Sample | Time (h) | Mn b (kg/mol) | PDI b | High Molecular Weight Peak d | Low Molecular Weight Peak d | Mn,h/Mn,l | Peak Area% (h/l) | ||
|---|---|---|---|---|---|---|---|---|---|
| Mn,h (kg/mol) | PDIh | Mn,l (kg/mol) | PDIl | ||||||
| 3a-E100-1 | 1 | 21 | 1.22 | 36 | 1.03 | 21 | 1.09 | 1.7 | 22/78 |
| 3a-E100-2 | 2 | 35 | 1.21 | 55 | 1.05 | 31 | 1.07 | 1.8 | 49/51 |
| 3a-E100-3 | 3 | 47 | 1.27 | 70 | 1.08 | 40 | 1.09 | 1.8 | 59/41 |
| 3a-E100-4 | 4 | 57 | 1.31 | 88 | 1.09 | 50 | 1.09 | 1.8 | 60/40 |
| 3a-E100-5 | 5 | 60 | 1.32 | 103 | 1.11 | 56 | 1.12 | 1.8 | 53/47 |
| 3a-E100-6 | 6 | 69 | 1.41 | 114 | 1.13 | 59 | 1.19 | 1.9 | 24/76 |
| Sample | Catalyst | Time (h) | Mn b (kg/mol) | PDI b |
|---|---|---|---|---|
| 2-H-1 | 2 | 0.5 | 11 | 1.11 |
| 2-H-2 | 2 | 1 | 12 | 1.15 |
| 2-H-3 | 2 | 1.5 | 17 | 1.15 |
| 2-H-4 | 2 | 2 | 18 | 1.23 |
| 2-H-5 | 2 | 2.5 | 24 | 1.17 |
| 2-H-6 | 2 | 3 | 27 | 1.19 |
| 2-H-7 | 2 | 4 | 32 | 1.21 |
| 3a-H-1 | 3a | 0.5 | 8 | 1.11 |
| 3a-H-2 | 3a | 1 | 12 | 1.10 |
| 3a-H-3 | 3a | 1.5 | 15 | 1.16 |
| 3a-H-4 | 3a | 2 | 17 | 1.23 |
| 3a-H-5 | 3a | 2.5 | 20 | 1.24 |
| 3a-H-6 | 3a | 3 | 23 | 1.20 |
| 3a-H-7 | 3a | 3 | 31 | 1.23 |
© 2017 by the authors. Licensee MDPI, Basel, Switzerland. This article is an open access article distributed under the terms and conditions of the Creative Commons Attribution (CC BY) license (http://creativecommons.org/licenses/by/4.0/).
Share and Cite
Ye, J.; Ye, Z. “Living” Polymerization of Ethylene and 1-Hexene Using Novel Binuclear Pd–Diimine Catalysts. Polymers 2017, 9, 282. https://doi.org/10.3390/polym9070282
Ye J, Ye Z. “Living” Polymerization of Ethylene and 1-Hexene Using Novel Binuclear Pd–Diimine Catalysts. Polymers. 2017; 9(7):282. https://doi.org/10.3390/polym9070282
Chicago/Turabian StyleYe, Jianding, and Zhibin Ye. 2017. "“Living” Polymerization of Ethylene and 1-Hexene Using Novel Binuclear Pd–Diimine Catalysts" Polymers 9, no. 7: 282. https://doi.org/10.3390/polym9070282
APA StyleYe, J., & Ye, Z. (2017). “Living” Polymerization of Ethylene and 1-Hexene Using Novel Binuclear Pd–Diimine Catalysts. Polymers, 9(7), 282. https://doi.org/10.3390/polym9070282