1. Introduction
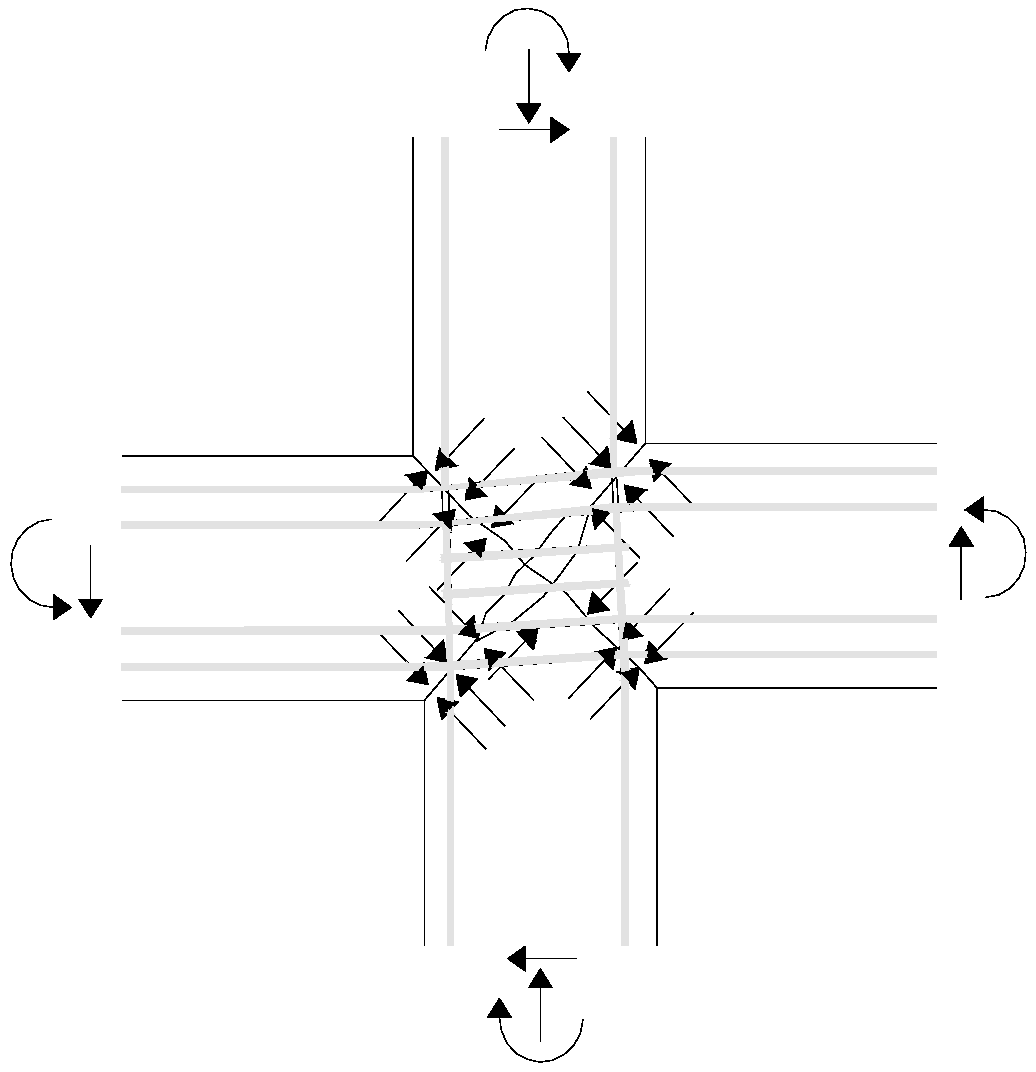
The behavior of the beam-column joint is a crucial aspect in a new or existing reinforced concrete (RC) moment resisting frame and needs to be designed and detailed properly. During earthquakes, the failure of beam-column joints is governed by bond and shear failure mechanisms which are usually brittle. Beam-column joints having deficient reinforcement details are expected to respond poorly, even when subjected to moderate seismic action. Beam-column joints in a RC moment resisting frame are circumscribed portions of the structures where high loads transfer between the connecting elements (
i.e., columns and beams) in the structure. This aspect can be particularly crucial in the case of seismically-resistant frames where this high demand mobilizes the inelastic capacity of RC members to dissipate seismic energy while joints are poorly designed, jeopardizing the entire structure, even if it is correctly designed (Manfredi
et al.) [
1].
Under certain seismic actions, the beams connecting into a joint are subjected to moments in the same (clockwise or counter-clockwise) direction. Under these moments, the bars at the same level are pulled or pushed in the same direction at both sides of the joint panel. If the column is not wide enough, or if the strength of concrete in the joint is too low, the bond between steel bars and concrete cannot balance this stress request (Lignola
et al.) [
2]. In such cases, the reinforcement bars slip inside the joint region, and beams lose their load capacity. Furthermore, under cyclic actions, joints undergo the diagonal push and pull actions and concrete diagonally cracks into the joint panel.
Stirrups in the joint panel provide the crucial shear strength and confinement pressure to preserve joint panels from premature brittle failures. A proper quantity of transverse reinforcement allows the stresses to be appropriately transmitted between the beams and columns. Nonetheless, the deficiency of transverse reinforcement in joint panels occurs often in structural systems designed for gravity loads or according to outdated seismic codes (Masi
et al.) [
3]. Hence, current research efforts concentrated on developing cost-effective and sound retrofit techniques and strategies by means of composite materials. Former rehabilitation techniques, such as RC or steel jackets, have been well investigated in the past (e.g., Alcocer and Jirsa [
4], Ghobarah
et al. [
5], Tsonos [
6], and Hakuto
et al. [
7] among others). In recent years, Fiber-reinforced polymer (FRP) has been widely studied as a novel strengthening system, and it has been extensively applied in practice due to its benefits, such as light weight, high strength, corrosion resistance, and fast constructability.
Several FRP-strengthening materials and layouts were considered to define the benefits provided to the seismic performance of beam-column joints (e.g., Gergely
et al. [
8], Pantelides
et al. [
9], Gergely
et al. [
10], Granata and Parvin [
11], Ghobarah and Said [
12], Pantelides
et al. [
13] among others).
From a designer point of view, current building codes for an earthquake-resistant design of RC moment frame structures provide an empirical limit on joint shear force. Earlier models, namely, traditional truss and strut models to explain the shear resistance mechanism, were proposed by Paulay
et al. [
14]. Further studies established shape factors given as empirical factors based on laboratory testing to take into account the variation of beam-column joint configurations. Such studies converged in different seismic code provisions and a review of them for joints, from main codes of practice around the world, can be found in Uma and Jain [
15]. However they lack consideration for the effects of other critical factors such as the magnitude of column axial load or the capacity of the members’ framing to the joint. Shiohara, in 2001 [
16], made some of the first efforts to identify all the crucial factors by means of a mechanical model, as described in the following, being the basis of the improvements provided by the proposed novel model. Re-evaluating available experimental results, the idea was not to limit the joint failure to an exceedance of a joint shear stress capacity (because joint shear stress does not degrade as the storey shear does during experimental tests).
Lowes and Altoontash, in 2003 [
17], and in the following years with further improvements and calibrations, proposed a nonlinear model for beam-column joints to be used in numerical analyses to evaluate the impact of joints on RC frame earthquake performance and their deformability, including bond-slip behavior. Increasing the complexity, further studies involved the full nonlinear finite element modeling (FEM) of joints clarifying the role of many factors in the behavior of beam column joints (e.g., Manfredi
et al. [
1] and Lignola
et al. [
2], among others).
3. Basis of Theoretical Model
The study focuses on internal joints which can be identified in a perimetric moment resisting frame. Perimetric frames have been selected because they have less beneficial effect of confinement provided by out-of-plane members (i.e., transverse beams or slabs). Internal joints present two beams framing into the sides of a column.
Experimental joint failure databases (e.g., Kim [
18] collected data on 341 subassemblies) highlight typical shear failures in conjunction with, but also without, yielding of longitudinal beam reinforcement. Influencing parameters for joint shear behavior are linked to key points on capacity curves displaying the most distinct stiffness changes. Concrete cracking is usually coupled to yielding or bond failure of longitudinal reinforcement of beams when the most different changes in stiffness, for both overall and local behavior are triggered, up to the point of initiation of joint shear failure (maximum experimental storey shear).
The examined parameters for joint behavior are material properties, joint panel geometry, reinforcement in joint panel, column axial load, and reinforcement bond condition. Furthermore, the effect of external strengthening, e.g., by means of externally-bonded FRP, but not limited to it, is another debated parameter. Obviously, shear and flexural capacity of intersecting elements, namely beams and columns, are also of interest for the capacity design, hence they are considered herein, but not analyzed in detail, since they are considered almost well established, both in terms of as-built and retrofitted capacity.
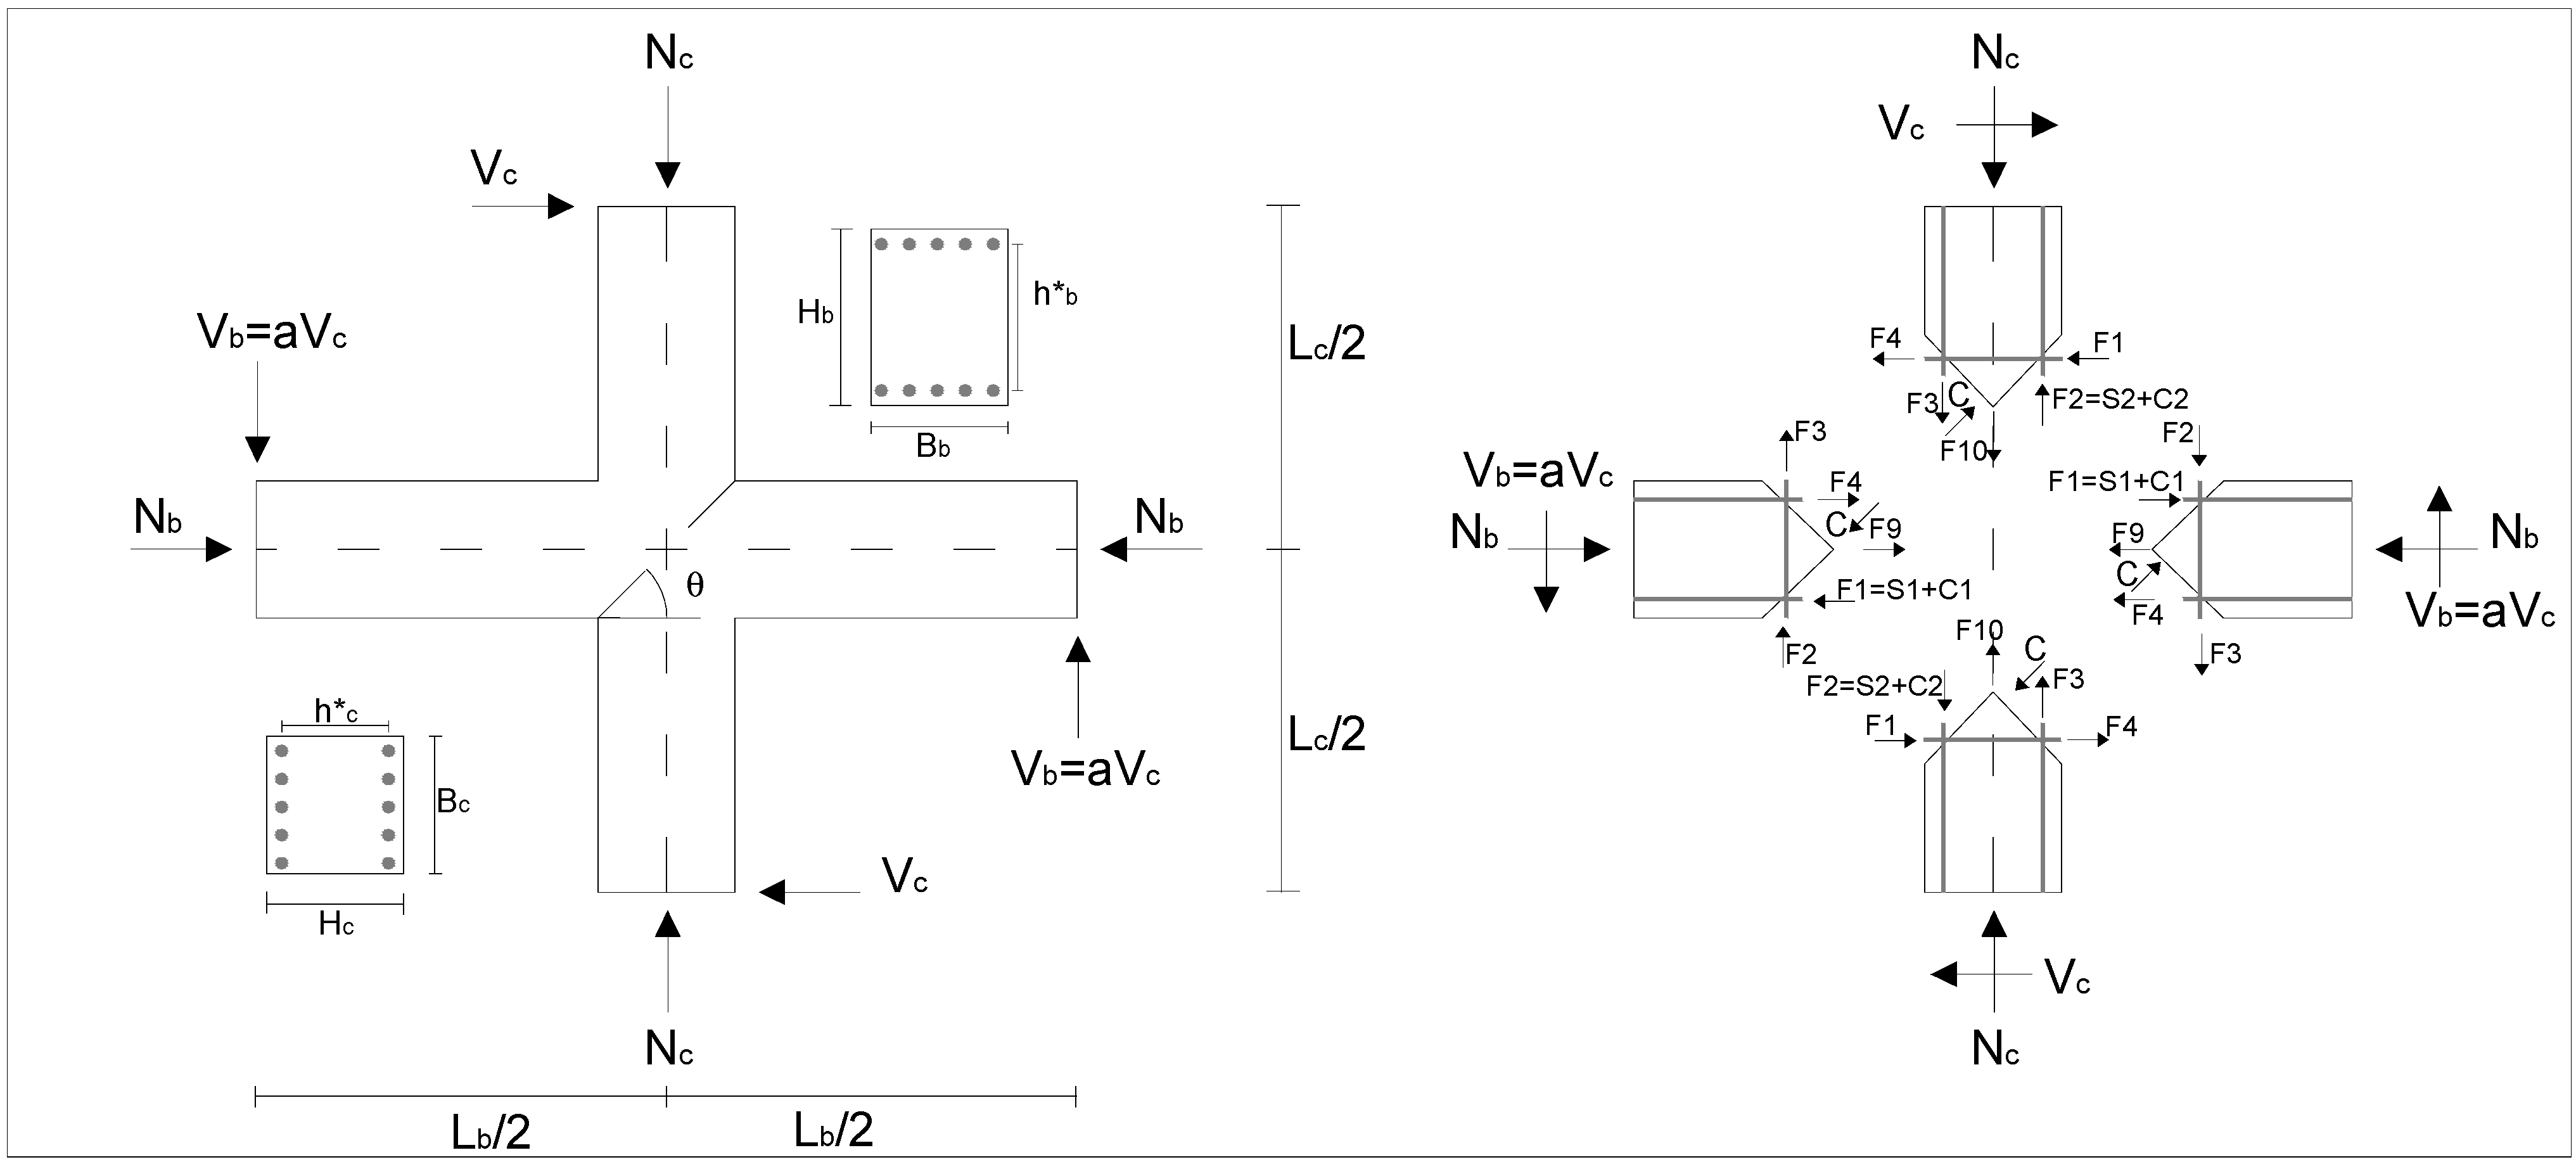
The proposed model moves from the so called quadruple flexural resistances model [
16] sketched in
Figure 1. It considers the kinematics of the four segments divided by diagonal cracks in the joint panel, rotating due to bending moment and shear coming from beams and columns. The equilibrium of internal forces in steel and concrete, and external forces acting on beam ends and column ends is taken into account, whereas the compatibility condition is not necessarily satisfied. Dowel effects of bars and shear friction along diagonal cracks were neglected in the original formulation. In fact, the model, as it was originally proposed, presents some essential assumptions, described in the following lines, mainly because of the undetermined system of equations having fewer equations than unknowns.
Figure 1.
The basic scheme of original quadruple flexural resistance model (Shiohara [
16]).
Figure 1.
The basic scheme of original quadruple flexural resistance model (Shiohara [
16]).
For instance in the interior joint, accounting for symmetry, given twelve equations defining equilibrium (three per rigid body), the number of independent equations representing the equilibrium reduces to five. Conversely, the unknowns are at least eight; three of them were assumed equal to experimental recorded data in experimental validation or directly assigned in the design phase. For instance yielding of joint stirrups was assumed (according to typical experimental outcomes after joint cracking) and also yielding of all beam bars, or alternatively yielding of tensile bars only and then the stress in compressed bars was derived by bond capacity limitation in the joint panel.
The model was also split to analyze potential beam failure or joint failure (evidently, beam column joint capacity is the smallest one of the two failure loads). However to avoid assuming a priori many unknowns, either supplied by experimental outcomes or considered at their maximum capacity (e.g., steel at yielding point, which actually is not always yielded at joint failure, when looking at experimental databases), modified unknowns, altered assumptions, and different solutions are herein proposed.
The basic idea is to include the beam mode into a unified joint model (adding apart a separate check not only of beam flexural failure, but also of column flexural failure, and for both, checking shear failure also). Doing so, it is possible to merge concrete compression and steel compression in a single compression force resultant at both beam and column ends. This assumption to merge compression in concrete and steel reinforcement has almost no effect on equilibrium of beams, while has minor effect on columns where neutral axis is deeper (Cosenza
et al.) [
19]. Finally, considering column shear not as an unknown, but as the main driving parameter to study, it is possible to plot the evolution of all other internal force unknowns with the column shear,
Vc, and to match the number of equations and unknowns. In this way, according to basic capacity design principles, column shear capacity is provided for each failure mode (e.g., column shear corresponding to concrete compression failure, is found on the curve of concrete in compression at a certain column shear value,
Vc, intersecting concrete capacity; similarly column shear,
Vc, corresponding to bond failure, is found on the bond demand curve while intersecting the bond capacity threshold). The model has been particularized for internal joints.
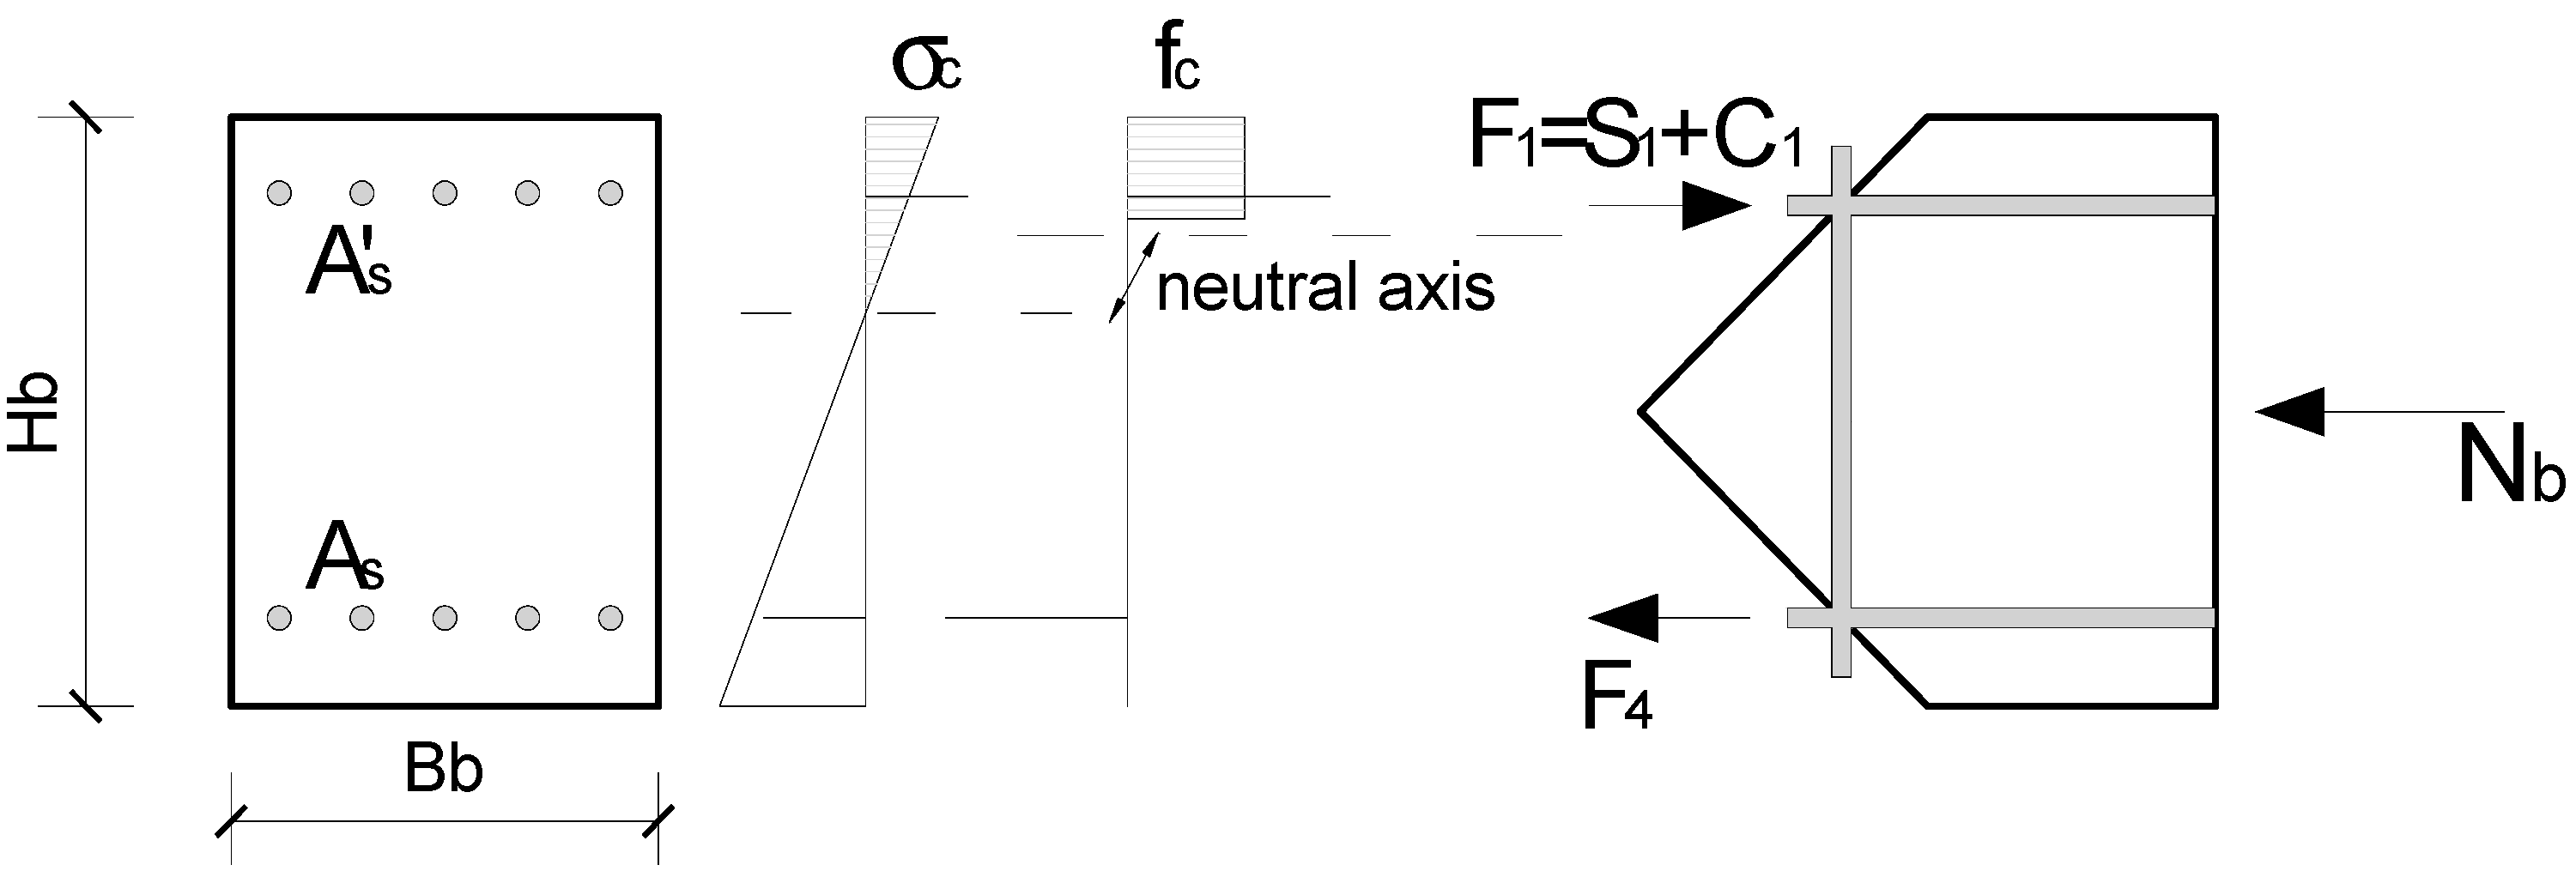
3.1. Mathematical Formulation
Joint scheme has been identified by setting geometric parameters and stresses, as shown in
Figure 2. It is enough to analyze a single load direction, since load reversal yields to the same stress state, because of the symmetry of the joint. Symmetry of the beam column joint is obvious if the joint is exactly at
Lb/2 and
Lc/2, as it is usually in experimental and design schemes; however, this does not mean that steel reinforcement bars having as resultant force,
T1, at the bottom of the right beam and at the top of the left beam have equal cross section or total area. Internal joints present a symmetry in terms of internal and external forces, but not necessarily in terms of reinforcement bars. Force resultants,
Fi, (e.g., for the depicted case of clockwise moments on columns,
F1 and
F2 are in compression) are also shown in
Figure 2. Accounting for symmetry, the number of nonlinear independent equations is five, in five unknowns (
C,
F1,
F2,
F3 and
F4):
Furthermore in this system, column and beam shear,
Vc and
Vb, as well as the flexural moment at column or beam,
Mc or
Mb, respectively, interface with joint satisfy also these relations:
Figure 2.
Internal perimetric joint: geometry, internal distribution of forces.
Figure 2.
Internal perimetric joint: geometry, internal distribution of forces.
3.2. Failure Modes
The paper focuses on internal perimetric joint failure; however, to fully understand joint behavior, it is recommended to also evaluate beam and column peculiar failure modes (
i.e., flexural and shear capacity, according to classical structural analysis approaches, Cosenza
et al. [
19]). These failure modes are expressed in terms of column shear according to Equations (6)–(8), thus providing the first four possible column shear,
Vc, capacity values corresponding to failure of the beam-column joint system. Eventual deficiencies of beams or columns in terms of flexural and shear capacities could be solved by means of FRP strengthening interventions, which are out of the scope of present paper and almost consolidated in the technical community.
Focusing on joint panel, three different failure modes can be expected: failure of concrete strut due to crushing, conventional failure due to yielding of longitudinal bars, or bond failure of longitudinal bars (in fact, the joint panel has limited dimensions to anchor the high stress demand and gradients from the bars).
The former failure mode involves the attainment of concrete crushing in the diagonal strut, so concrete contact force,
C, should be limited to the compression strength of strut:
If shear friction is assumed along cracks, the concrete contact force,
C, can be assumed inclined not as the diagonal (
i.e., ϑ ≠ θ), thus requiring a shear friction check where deviation from diagonal (
i.e., |ϑ−θ|) should be limited to a threshold value. Afterwards, conventional failure of reinforcement in tension is checked, assuming different bars at each longitudinal reinforcement level
i, having cross section
Ak, and yielding stress
fy,k. So each
Fi should be limited to axial strength:
Finally, the latter failure mode requires splitting the compression resultant force into steel and concrete contributions (
Figure 3). The basic idea is to evaluate (according to classical structural analysis approaches, Cosenza
et al. [
19]) the neutral axis depth, recalling linearity of the strain diagram of the cross section; in the meantime, compression and tensile resultants are in equilibrium, according to the previous systems of equations.
Figure 3 also remembers that the neutral axis changes with increasing flexural loads due to concrete nonlinearity. The neutral axis,
c, can be evaluated, for instance in the elastic field in a beam, without axial load, equating the first order moment to zero (Equation (11)) and, once the neutral axis,
c, is known, the compressive force of reinforcements,
S1, is derived:
Finally, estimating the effective bond length,
Leb, the upper bound bond capacity of concrete (based on uniform bond stress capacity, τ) is compared to the bond demand, given by the anchoring of longitudinal bars, even with different longitudinal diameters, Φ
k, of bars at the same level, e.g., due to the two resultants
S1 +
F4:
Three different bond stress capacities were considered according to Model Code 90 [
20]: the maximum bond capacity, τ
max, is equal to 2.5·
(good bond) or a medium value, τ
med is equal to 1.25·
all others conditions) for ribbed bars. The minimum value, τ
min, equal to 0.3·
can be used in the case of smooth bars. Different bond capacities’ detailed analysis is out of the scope of present work, however they can be evaluated and inserted in the proposed model as bond capacity thresholds, e.g., (
S1 +
F4)
max, to estimate corresponding column shear,
Vc.
Figure 3.
Analysis of distribution of compressive forces in concrete and reinforcement bars.
Figure 3.
Analysis of distribution of compressive forces in concrete and reinforcement bars.
4. Behavior of Proposed Simplified Model
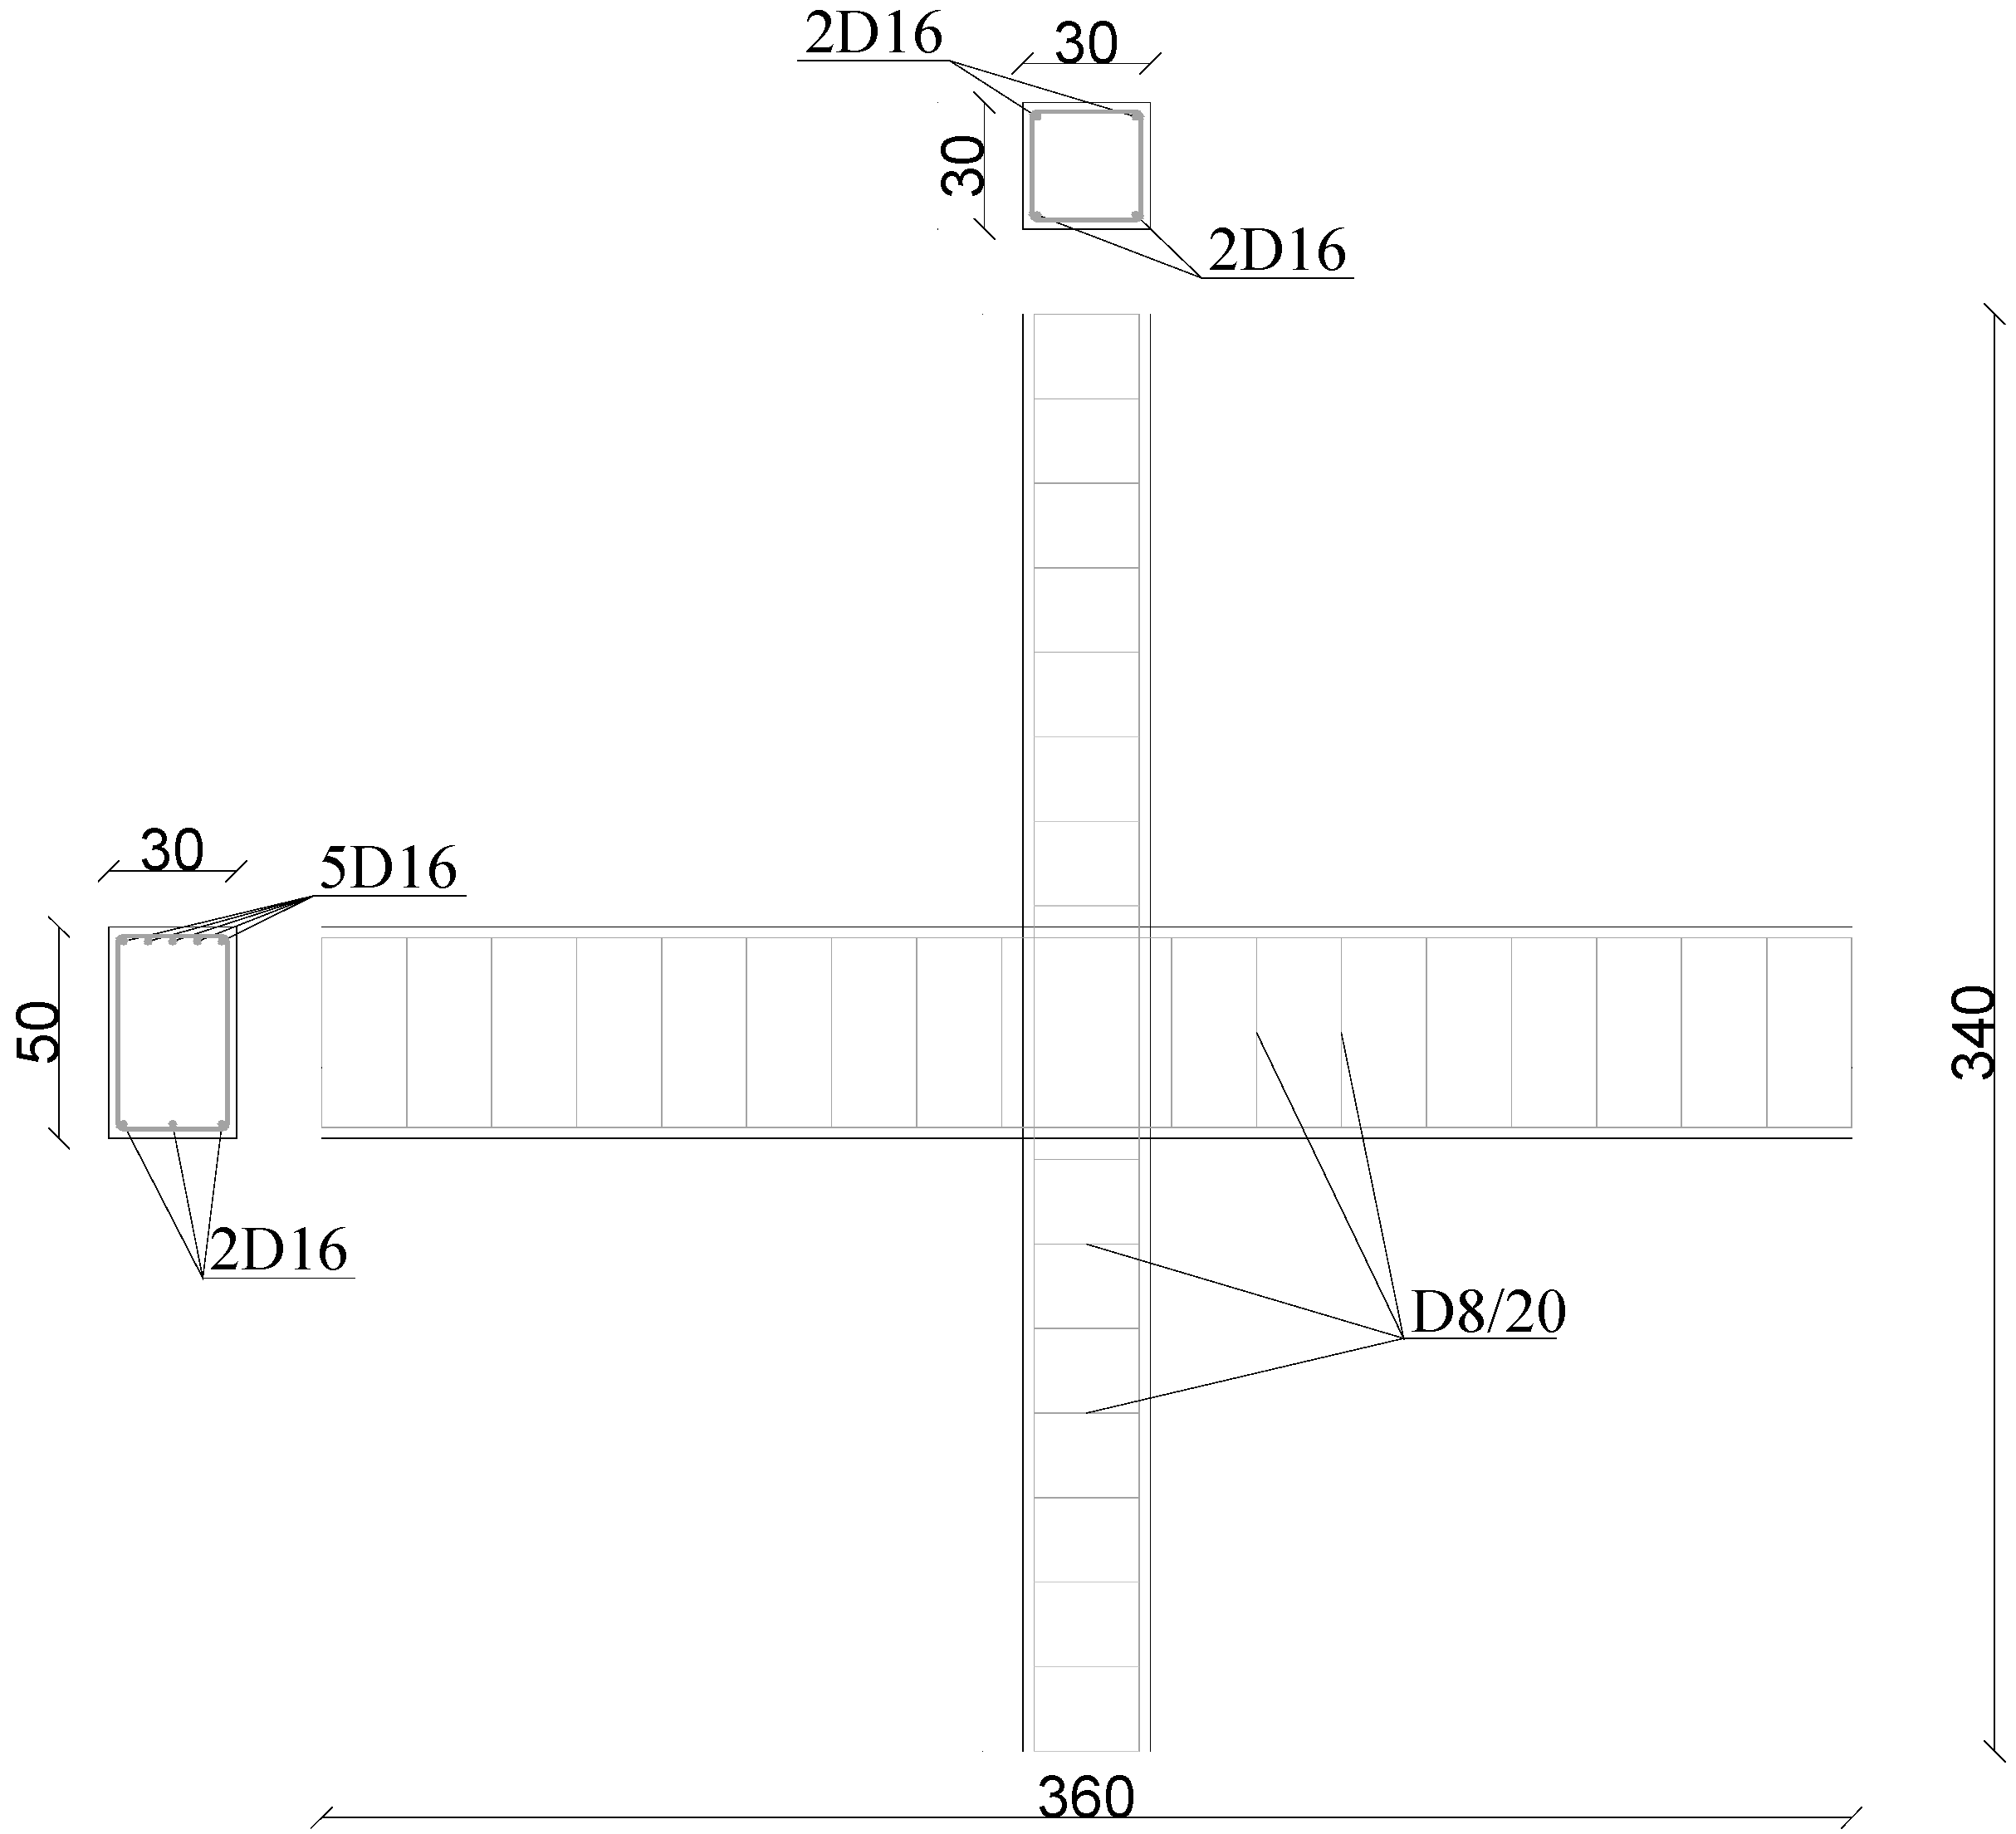
To evaluate the behavior of proposed simplified model, a parametric analysis is performed, on an internal perimetric joint, to highlight the peculiarities of this joint.
The joint analyzed to perform the parametric analysis is made of a beam of dimensions (30 cm × 50 cm, increased in a case) and a column 30 cm × 30 cm. The considered beam has length equal to 3.60 m, reinforced by five D16 longitudinal bars at upper side and three D16 at the lower one. The length of the column is
Lc = 3.40 m, reinforced symmetrically by two D16 longitudinal bars at upper and lower sides. Both of them have been transversally reinforced by using D8 stirrups (two legs) at 20 cm. Concrete cover value considered for both beam and column is 2.6 cm (see
Figure 4).
Figure 4.
Geometry and reinforcement of analyzed beam column joint.
Figure 4.
Geometry and reinforcement of analyzed beam column joint.
Scientific literature presents numerous experimental test results, conducted on different kinds of geometry, evaluating stress values leading to joint failure. By using the proposed model, for each geometry, the values of column shear,
Vc, have been calculated for each of the failure modes for nodes (and named
Vc1 to
Vc11 for each considered failure mode, see
Table 1).Starting from the reference condition, geometric variations have been performed leading to new column shear results related to each of the failure modes. In particular, variations about the number (two and four) of legs for stirrups and about the number and type of FRP layers have been considered. Four different Carbon CFRP (Young’s modulus
Ef = 230 GPa) configurations have been considered: one horizontal uni-axial layer (
tf = 0.333 mm), one quadri-axial layer, two quadri-axial layers, and four quadri-axial layers (each layer of quadri-axial has a thickness of 0.053 mm, hence combining the overlapping of inclined layer it is equivalent to 0.1279 mm in horizontal and vertical directions). FRP strain is assumed equal to debonding value (e.g., 0.4% according to Italian guidelines CNR DT200 R1 2013 [
21]).
In order to understand which failure mode is independent from the reinforcement and which is improvable by using reinforcement, results were grouped and compared to the reference case, to represent values of column shear (for each failure mode) related to the amount of reinforcement. The main considered parameters were: axial load on column,
Nc; concrete strength,
fc; stirrups in the joint; FRP externally bonded on the joint panel; longitudinal reinforcement ratio in beams and columns; and beam height, hence joint panel dimensions. Variability of considered parameters is depicted in a numerical test matrix (in
Table 2 at every case is associated an ID number). The identification of the failure mode allowed to establish if and how it is possible to change and improve the hierarchy of the failure modes. In many cases, the method led to switch a brittle failure mode into ductile failure modes, even if some mechanisms are independent from the reinforcement inserted into the joint.
Table 1.
Column shear, Vc, for each considered failure mode.
Table 1.
Column shear, Vc, for each considered failure mode.
| Column Shear | Failure mode |
|---|
| Vc1 | Bending capacity of beam |
| Vc2 | Bending capacity of column |
| Vc3 | Shear capacity of beam |
| Vc4 | Shear capacity of column |
| Vc5 | Joint with yielding of bars of beam |
| Vc6 | Joint with yielding of bars of column |
| Vc8 | Joint due to maximum bond exceedance |
| Vc9 | Joint due to medium bond exceedance |
| Vc10 | Joint due to minimum bond exceedance |
| Vc11 | Joint due to concrete strut crushing |
Table 2.
Parametric analysis: variability of considered parameters; failure modes and column shear capacities of considered joint configurations.
Table 2.
Parametric analysis: variability of considered parameters; failure modes and column shear capacities of considered joint configurations.
| ID number | Nc (kN) | fc (MPa) | Stirrups | FRP | Beam dimension (cm2) | Failure mode (kN) |
|---|
| 1 | 0 | 20 | - | - | (50 × 30) | Vc2 | 37.14 |
| 2 | 315 | 20 | - | - | (50 × 30) | Vc5 | 55.91 |
| 3 | 630 | 20 | - | - | (50 × 30) | Vc5 | 55.91 |
| 4 | 315 | 40 | - | - | (50 × 30) | Vc5 | 59.01 |
| 5 | 315 | 60 | - | - | (50 × 30) | Vc5 | 60.03 |
| 6 | 315 | 20 | 2D8 | - | (50 × 30) | Vc2 | 62.18 |
| 7 | 315 | 20 | 4D8 | - | (50 × 30) | Vc2 | 62.18 |
| 8 | 315 | 20 | 8D8 | - | (50 × 30) | Vc2 | 62.18 |
| 9 | 315 | 20 | - | 1 plyquadri-axial | (50 × 30) | Vc5 | 60.51 |
| 10 | 315 | 20 | - | 1 plyuni-axial | (50 × 30) | Vc2 | 62.18 |
| 11 | 315 | 20 | - | 2 pliesquadri-axial | (50 × 30) | Vc2 | 62.18 |
| 12 | 315 | 20 | - | 4 pliesquadri-axial | (50 × 30) | Vc2 | 62.18 |
| 13 | 315 | 20 | - | - | (70 × 30) | Vc2 | 66.79 |
| 14 1 | 315 | 20 | - | - | (50 × 30) | Vc2 | 62.18 |
| 15 2 | 315 | 20 | - | - | (50 × 30) | Vc8 | 20.08 |
As expected, those are all the mechanisms external to the joint (e.g., failure for bending and shear of column or beam) not incorporated in the system of equations previously presented. Furthermore, thanks to the symmetry of the joint, the values for yield strength in upper and lower bars of the column are the same for each analysis (for this reason Vc7 was omitted because it is equal to Vc6).
It is clear from
Table 1 that in the case of zero axial load on column (ID1), the failure of the system is due to the flexural failure of column in bending (
i.e.,
Vc2 = 37.14 kN is the lower column shear triggering the failure mode). Increasing the axial load (ID2 and ID3) the failure moves to the joint due to yielding of bars in beam (
i.e.,
Vc5 = 55.91 kN is the lower column shear triggering the failure mode). The increase of concrete strength (ID4 and ID5) simply increases slightly the column shear leading to the same failure mode of the joint.
Any improvement of the joint reinforcement (ID6 to ID8 in the case of internal reinforcement of new structures, or ID9 to ID12 in the case of external retrofit of existing structures) moves the failure mode from the brittle failure of the joint due to yielding of bars in the beam to the flexural failure of the column. Only an exception is represented by one ply of quadri-axial reinforcement (ID9), not sufficient in the horizontal direction to avoid a joint failure due to yielding of beam bars at a slightly lower load. Increasing the dimensions of the joints (ID13) allows preventing of joint failure, hence moving to the flexural failure of the column (at a slightly higher load, not because joint dimensions increase the ultimate moment of the column, but because the lever arms slightly changes; see Equation (7)).
Assuming a friction along the diagonal cracks in the joint (ID14 and ID15 and assuming the maximum of both) improves slightly the capacity of the joint pushing failure to the flexural capacity of the column.
Since the flexural failure of the column is not yet the optimum failure mode, a further intervention could be foreseen for the column, hence increasing the flexural capacity up to a switch of the failure mode to the beam flexural failure, the optimal ductile failure of such systems. It is worth noting that once increasing the flexural capacity of a member, in this case the column, a shear check should always be coupled and performed to evaluate the need for a combined shear strengthening, because shear loads on the member could increase with the flexural improvement. However this latter aspect of column strengthening is out of the scope of present work.
This discussion was performed assuming a good bond condition. However, in the case of smooth bars, with poor bond conditions, the failure mode would always occur at a much lower column shear with joint failure due to the bond of the longitudinal bars inside the joint. The fifteen analyses (
Table 2 and
Table 3) allow assessing the influence of different parameters, both in terms of failure mode and column shear,
Vc. In some cases, a parameter has no influence on the effective failure mode, however it has an influence on other possible failure modes, but not triggered first in that case. The effect of axial load is mainly on column reinforcement forces and flexural and shear capacity (see
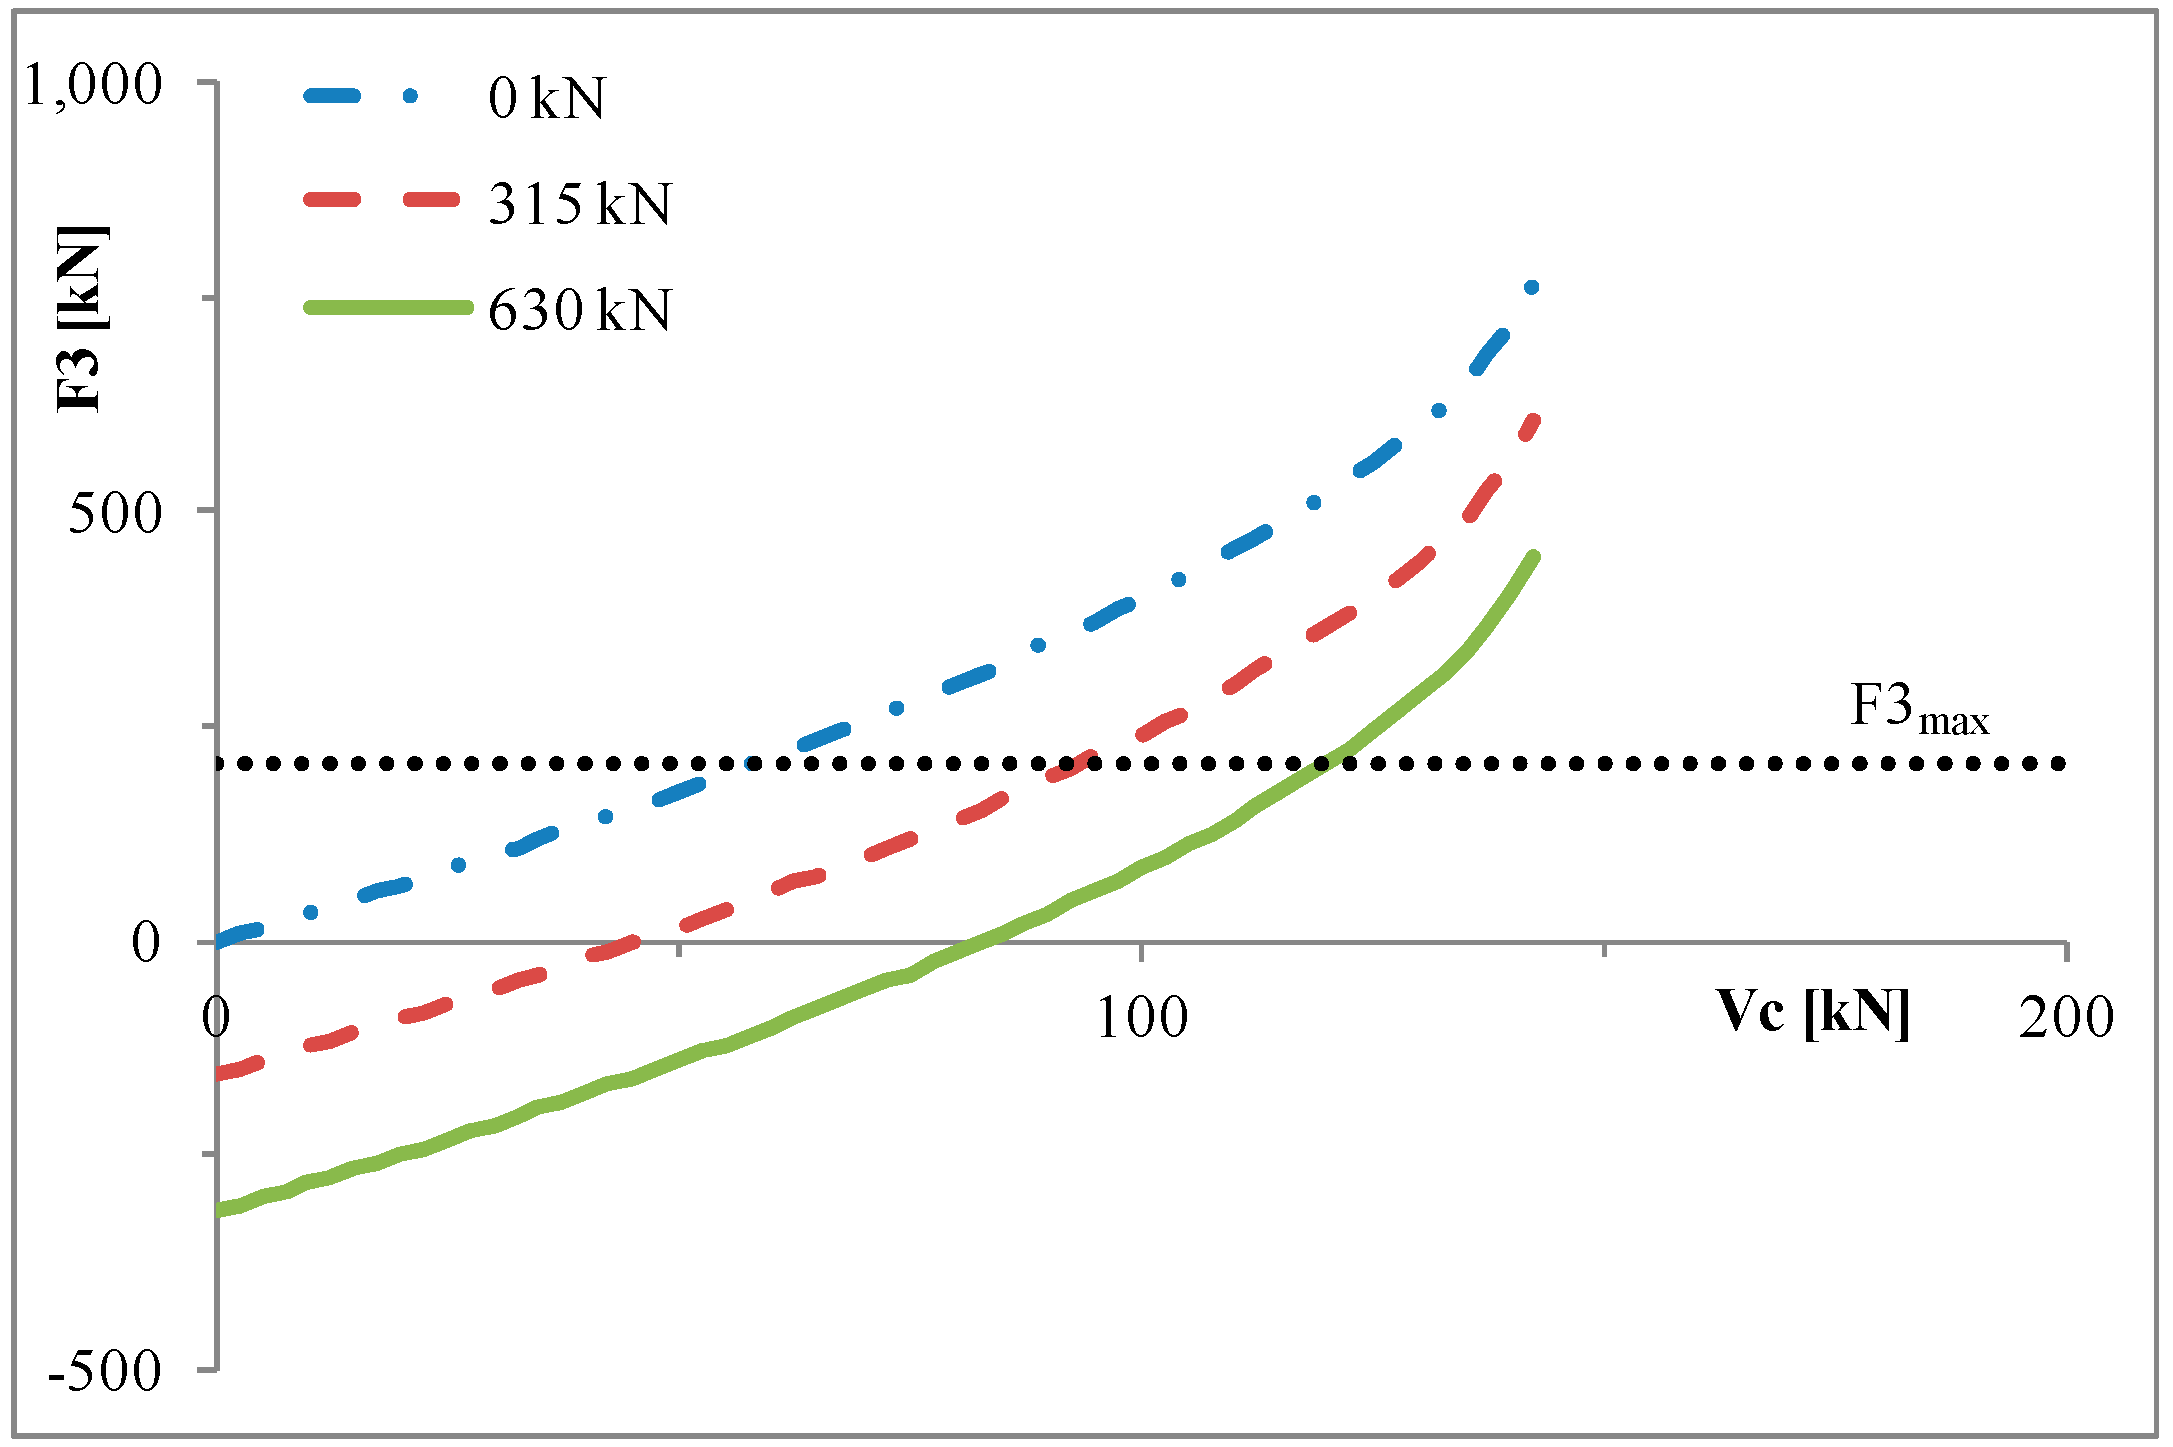
Figure 5 where the force resultant
F3 reaches its yielding value at increasing column shear,
Vc, when increasing axial load on column,
Nc). In
Figure 5,
F3(
Vc) curves have different origins because the higher is the axial load,
Nc, the higher is initial compression level at zero lateral load,
Vc. Similarly, column shear corresponding to column flexural failure increases from 37.14 kN to 79.46 kN (+114%) (in square brackets the percentage increase has been reported), yet not being triggered as the first failure mode. Axial load has negligible effect on joint failure. The effect of concrete strength is mainly related to shear and flexural capacity of beams and columns.
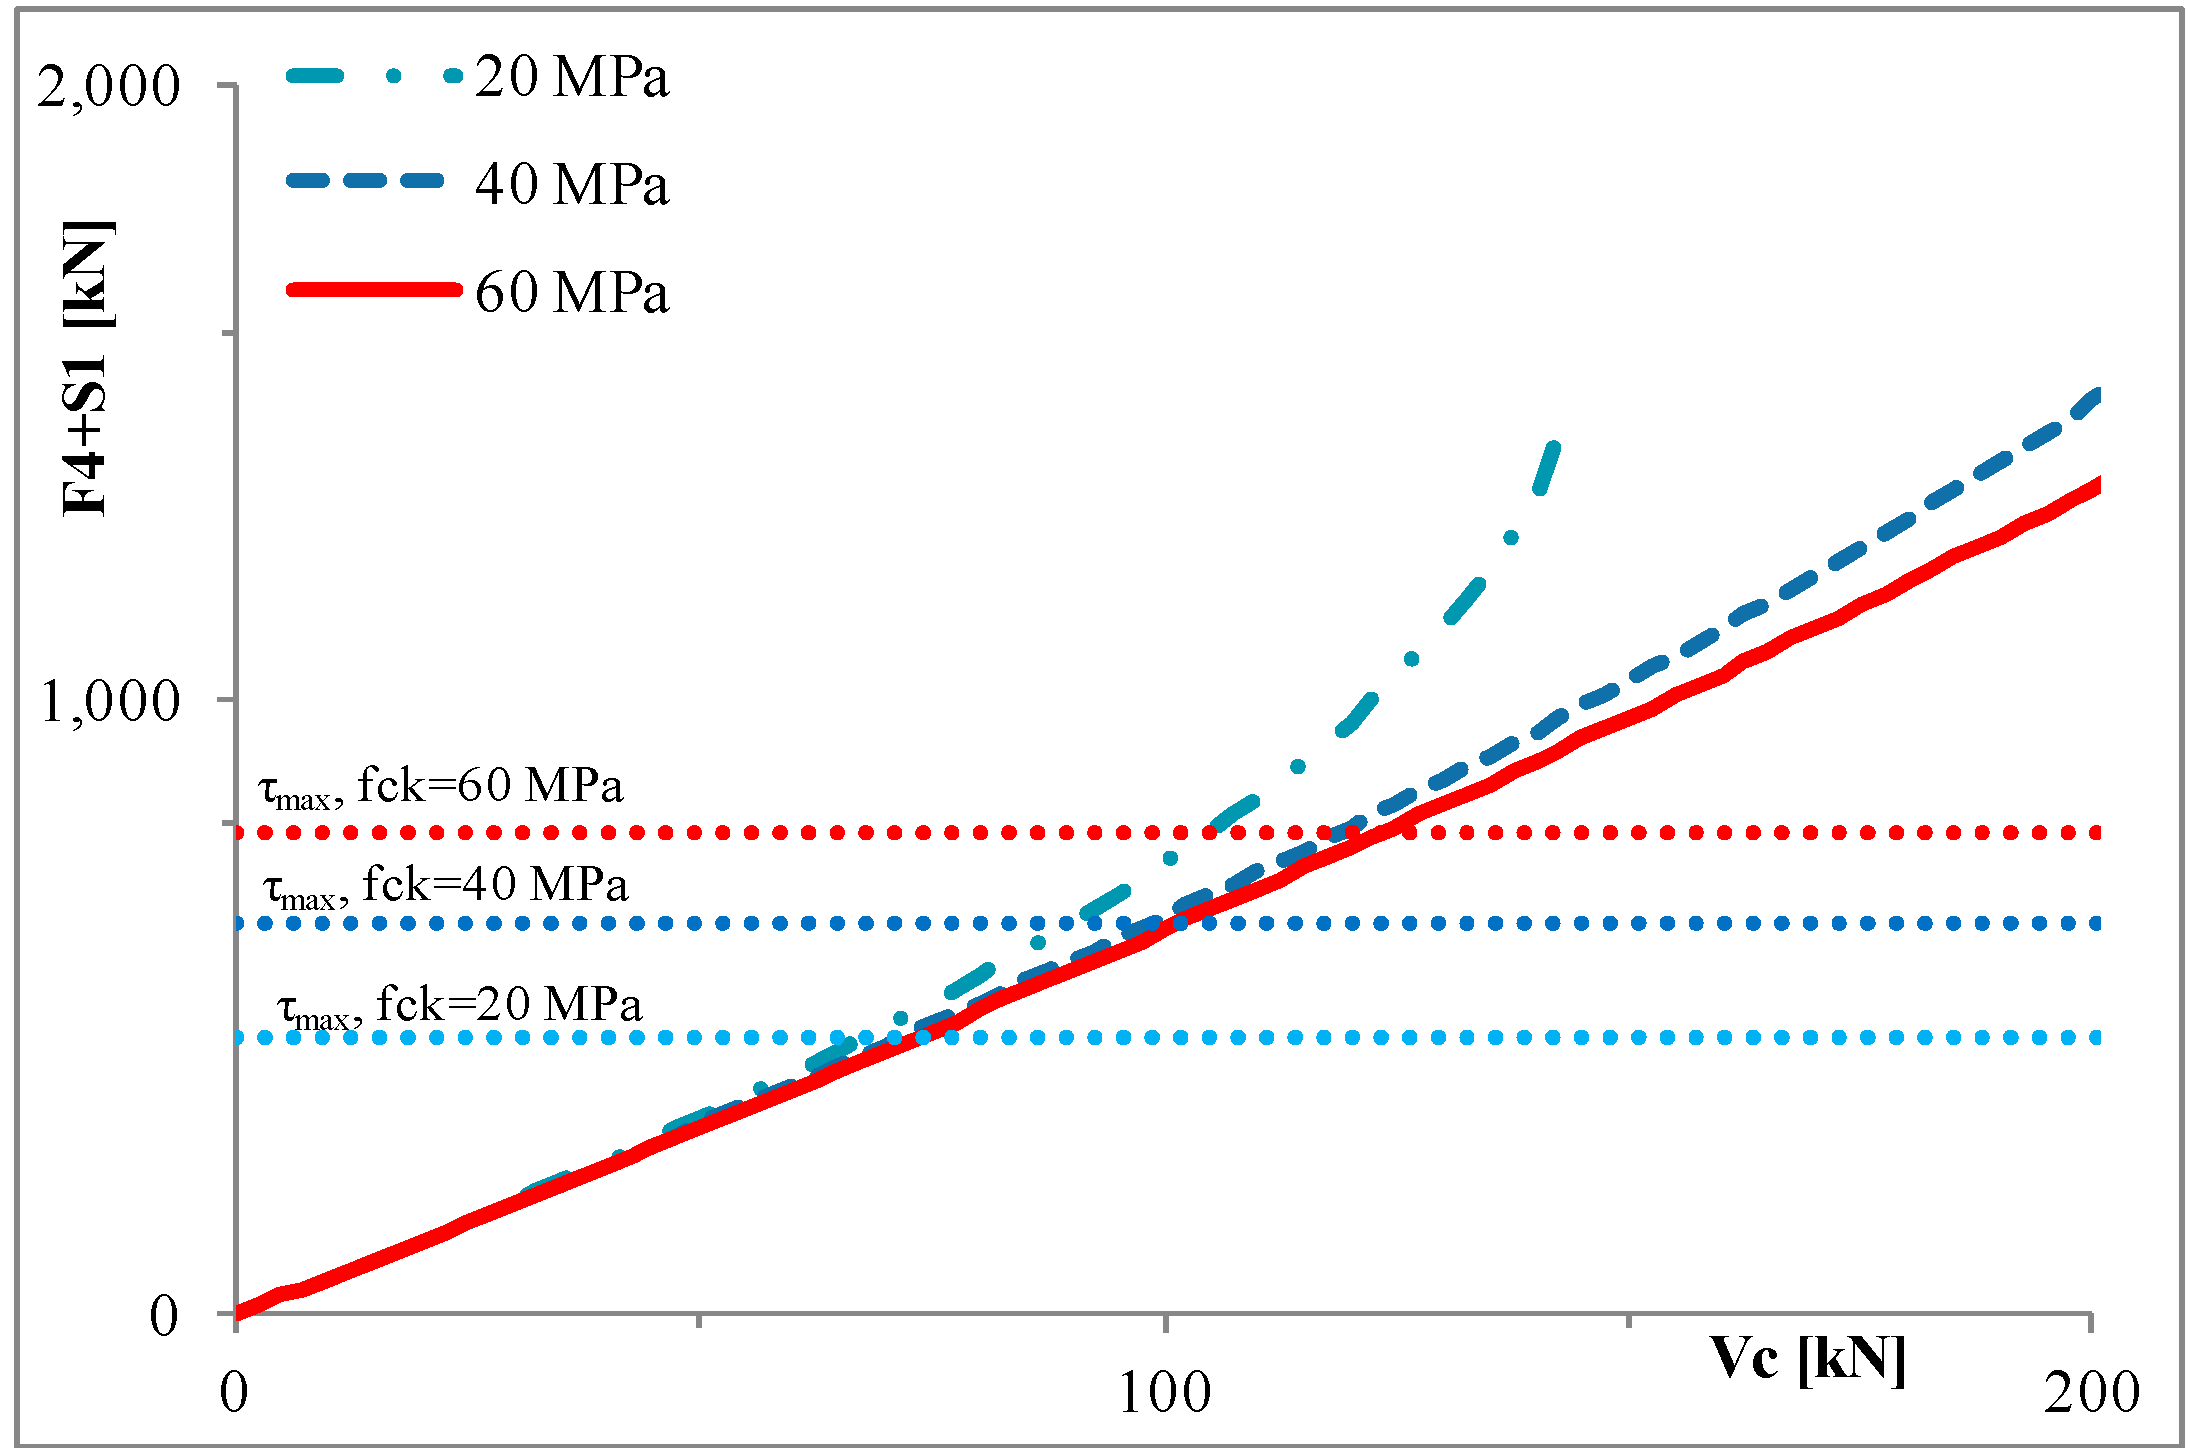
A clear effect is also on bond capacity;
Figure 6 shows bond demand
F4 +
S1 reaching its capacity value at increasing column shear,
Vc, when changing bond capacity (in good bond conditions) due to concrete strength τ
max(
fc).
To evaluate the failure mode for each considered configuration case it is possible to refer to values reported in
Table 3.
Table 3.
Column shear for each configuration case and for every failure mode (to evaluate the strength hierarchy).
Table 3.
Column shear for each configuration case and for every failure mode (to evaluate the strength hierarchy).
| Column shear at failure | Configuration ID Number |
|---|
| 1 | 2 | 3 | 4 | 5 | 6 | 7 | 8 | 9 | 10 | 11 | 12 | 13 | 14 | 15 |
|---|
| Vc1 (kN) | 91.4 | 91.4 | 91.4 | 92.7 | 93.8 | 91.4 | 91.4 | 91.4 | 91.4 | 91.4 | 91.4 | 91.4 | 132.5 | 91.4 | 91.4 |
| Vc2 (kN) | 37.1 | 62.2 | 79.5 | 65.2 | 66.9 | 62.2 | 62.2 | 62.2 | 62.2 | 62.2 | 62.2 | 62.2 | 66.8 | 62.2 | 62.2 |
| Vc3 (kN) | 295.0 | 295.0 | 295.0 | 295.0 | 295.0 | 295.0 | 295.0 | 295.0 | 295.0 | 295.0 | 295.0 | 295.0 | 419.5 | 295.0 | 295.0 |
| Vc4 (kN) | 161.1 | 161.1 | 161.1 | 161.1 | 161.1 | 161.1 | 161.1 | 161.1 | 161.1 | 161.1 | 161.1 | 161.1 | 161.1 | 161.1 | 161.1 |
| Vc5 (kN) | 55.9 | 55.9 | 55.9 | 59.0 | 60.0 | 64.0 | 71.7 | 86.1 | 60.5 | 67.7 | 65.00 | 73.6 | 78.6 | 65.7 | 47.5 |
| Vc6 (kN) | 58.7 | 93.8 | 120.4 | 104.4 | 107.8 | 93.8 | 93.8 | 93.8 | 97.4 | 93.8 | 100.5 | 106.8 | 177.2 | 64.0 | 106.9 |
| Vc8 (kN) | 67.2 | 67.2 | 67.2 | 99.1 | 123.5 | 74.8 | 82.1 | 95.4 | 71.6 | 78.2 | 75.8 | 83.8 | 104.4 | 120.5 | 20.1 |
| Vc9 (kN) | 36.0 | 36.0 | 36.0 | 51.9 | 64.1 | 44.9 | 53.5 | 69.5 | 41.1 | 48.9 | 46.0 | 55.6 | 53.6 | 79.7 | 10.2 |
| Vc10 (kN) | 9.1 | 9.1 | 9.1 | 12.9 | 15.8 | 18.9 | 28.5 | 46.5 | 14.7 | 23.4 | 20.2 | 30.8 | 13.1 | 22.4 | 2.5 |
| Vc11 (kN) | 144.5 | 144.5 | 144.5 | 289.0 | 433.6 | 144.5 | 144.5 | 144.5 | 144.5 | 144.5 | 144.5 | 144.5 | 144.5 | 124.2 | 130.8 |
Figure 5.
Parametric analysis: tensile force, F3, in column bars and its threshold with variability of axial load, Nc.
Figure 5.
Parametric analysis: tensile force, F3, in column bars and its threshold with variability of axial load, Nc.
Figure 6.
Parametric analysis: Bond demand of beam bars, F4 + S1, and its threshold with variability of concrete strength, fc.
Figure 6.
Parametric analysis: Bond demand of beam bars, F4 + S1, and its threshold with variability of concrete strength, fc.
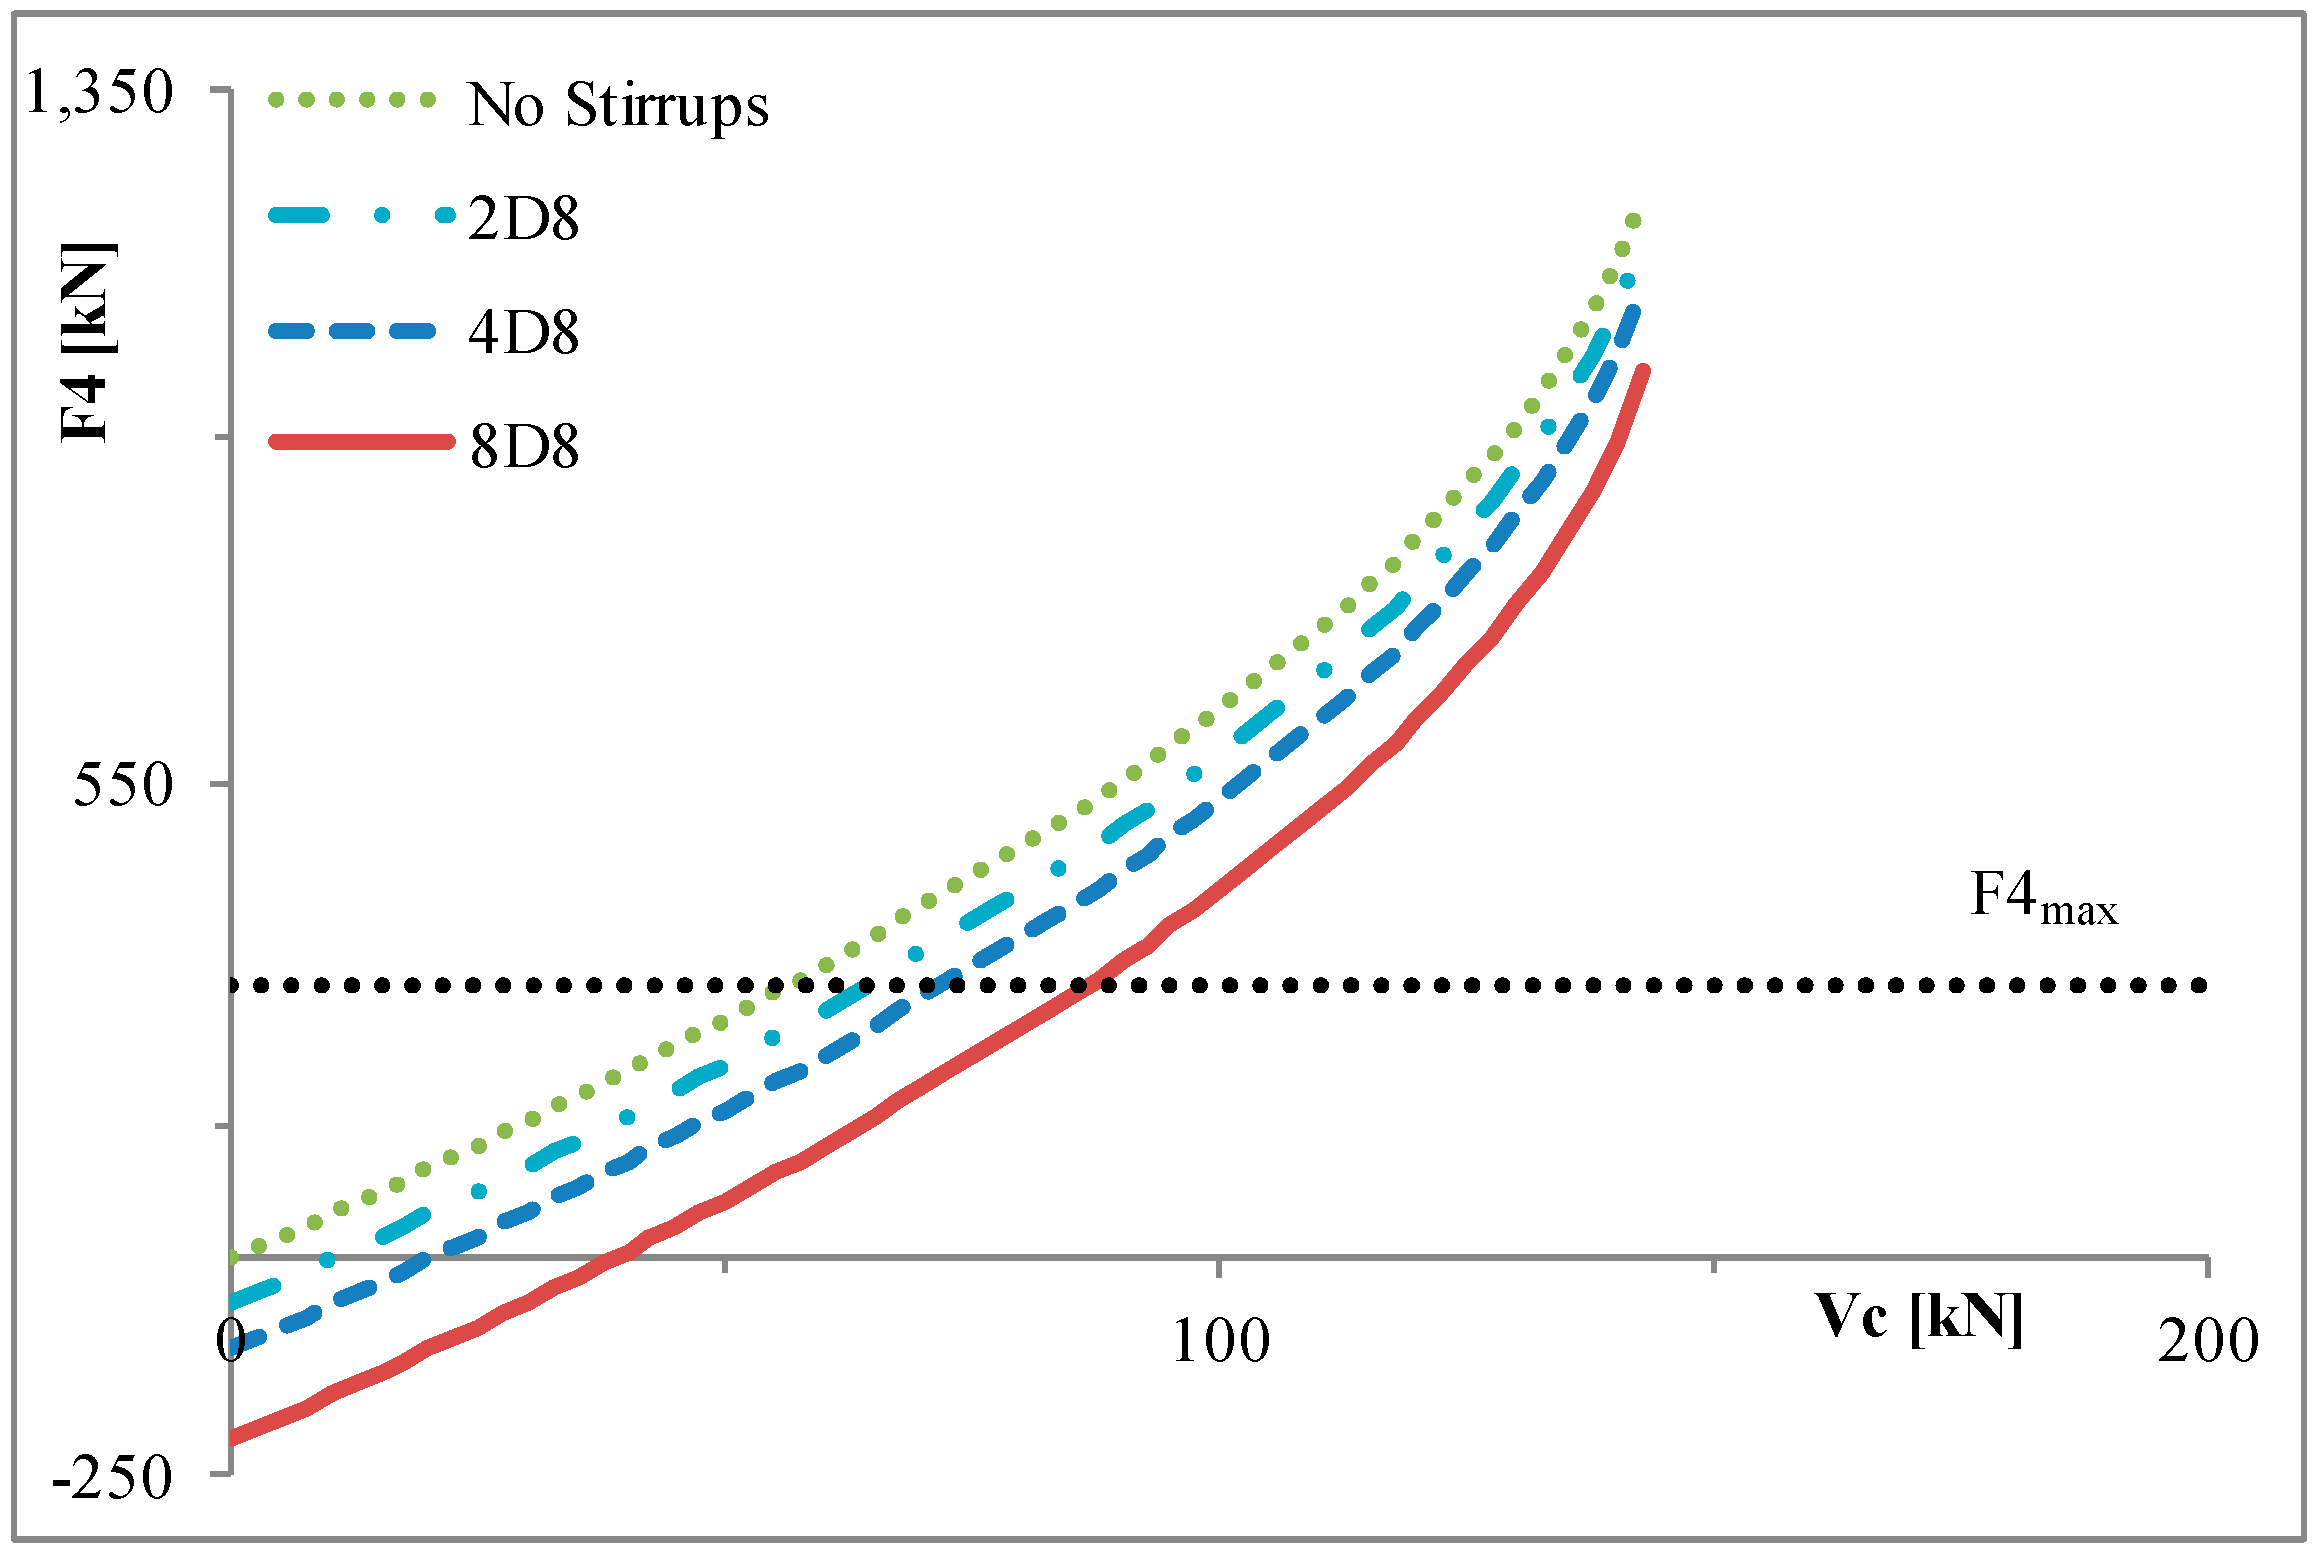
The effect of stirrups is meaningful, as it has many consequences. The most relevant is on longitudinal reinforcement bars, reducing their load, thus bearing a portion of horizontal load demand. Stirrups are assumed to yield, and for simplicity, their tensile force (
T9) is assumed equal to yielding force from the very beginning; for this reason, in
Figure 7 the
F4(
Vc) curves have different origins. However the presence of stirrups increases column shear corresponding to joint failure due to beam tensile reinforcement yielding from 55.91 kN (no stirrups and actual failure of ID2 case) to 64.01 kN (+14.48%) (two D8 stirrups with two legs, ID6 case) and 86.14 kN (+54.06%) (eight D8 stirrups with two legs), but in these cases the failure mode switches to column flexural failure. Thus, it can be concluded that, in this case, two D8 stirrups are enough to change the failure mode from brittle joint failure to more desirable ductile column flexural failure.
Figure 7.
Parametric analysis: tensile force, F4, in beam bars and its threshold with variability of stirrups.
Figure 7.
Parametric analysis: tensile force, F4, in beam bars and its threshold with variability of stirrups.
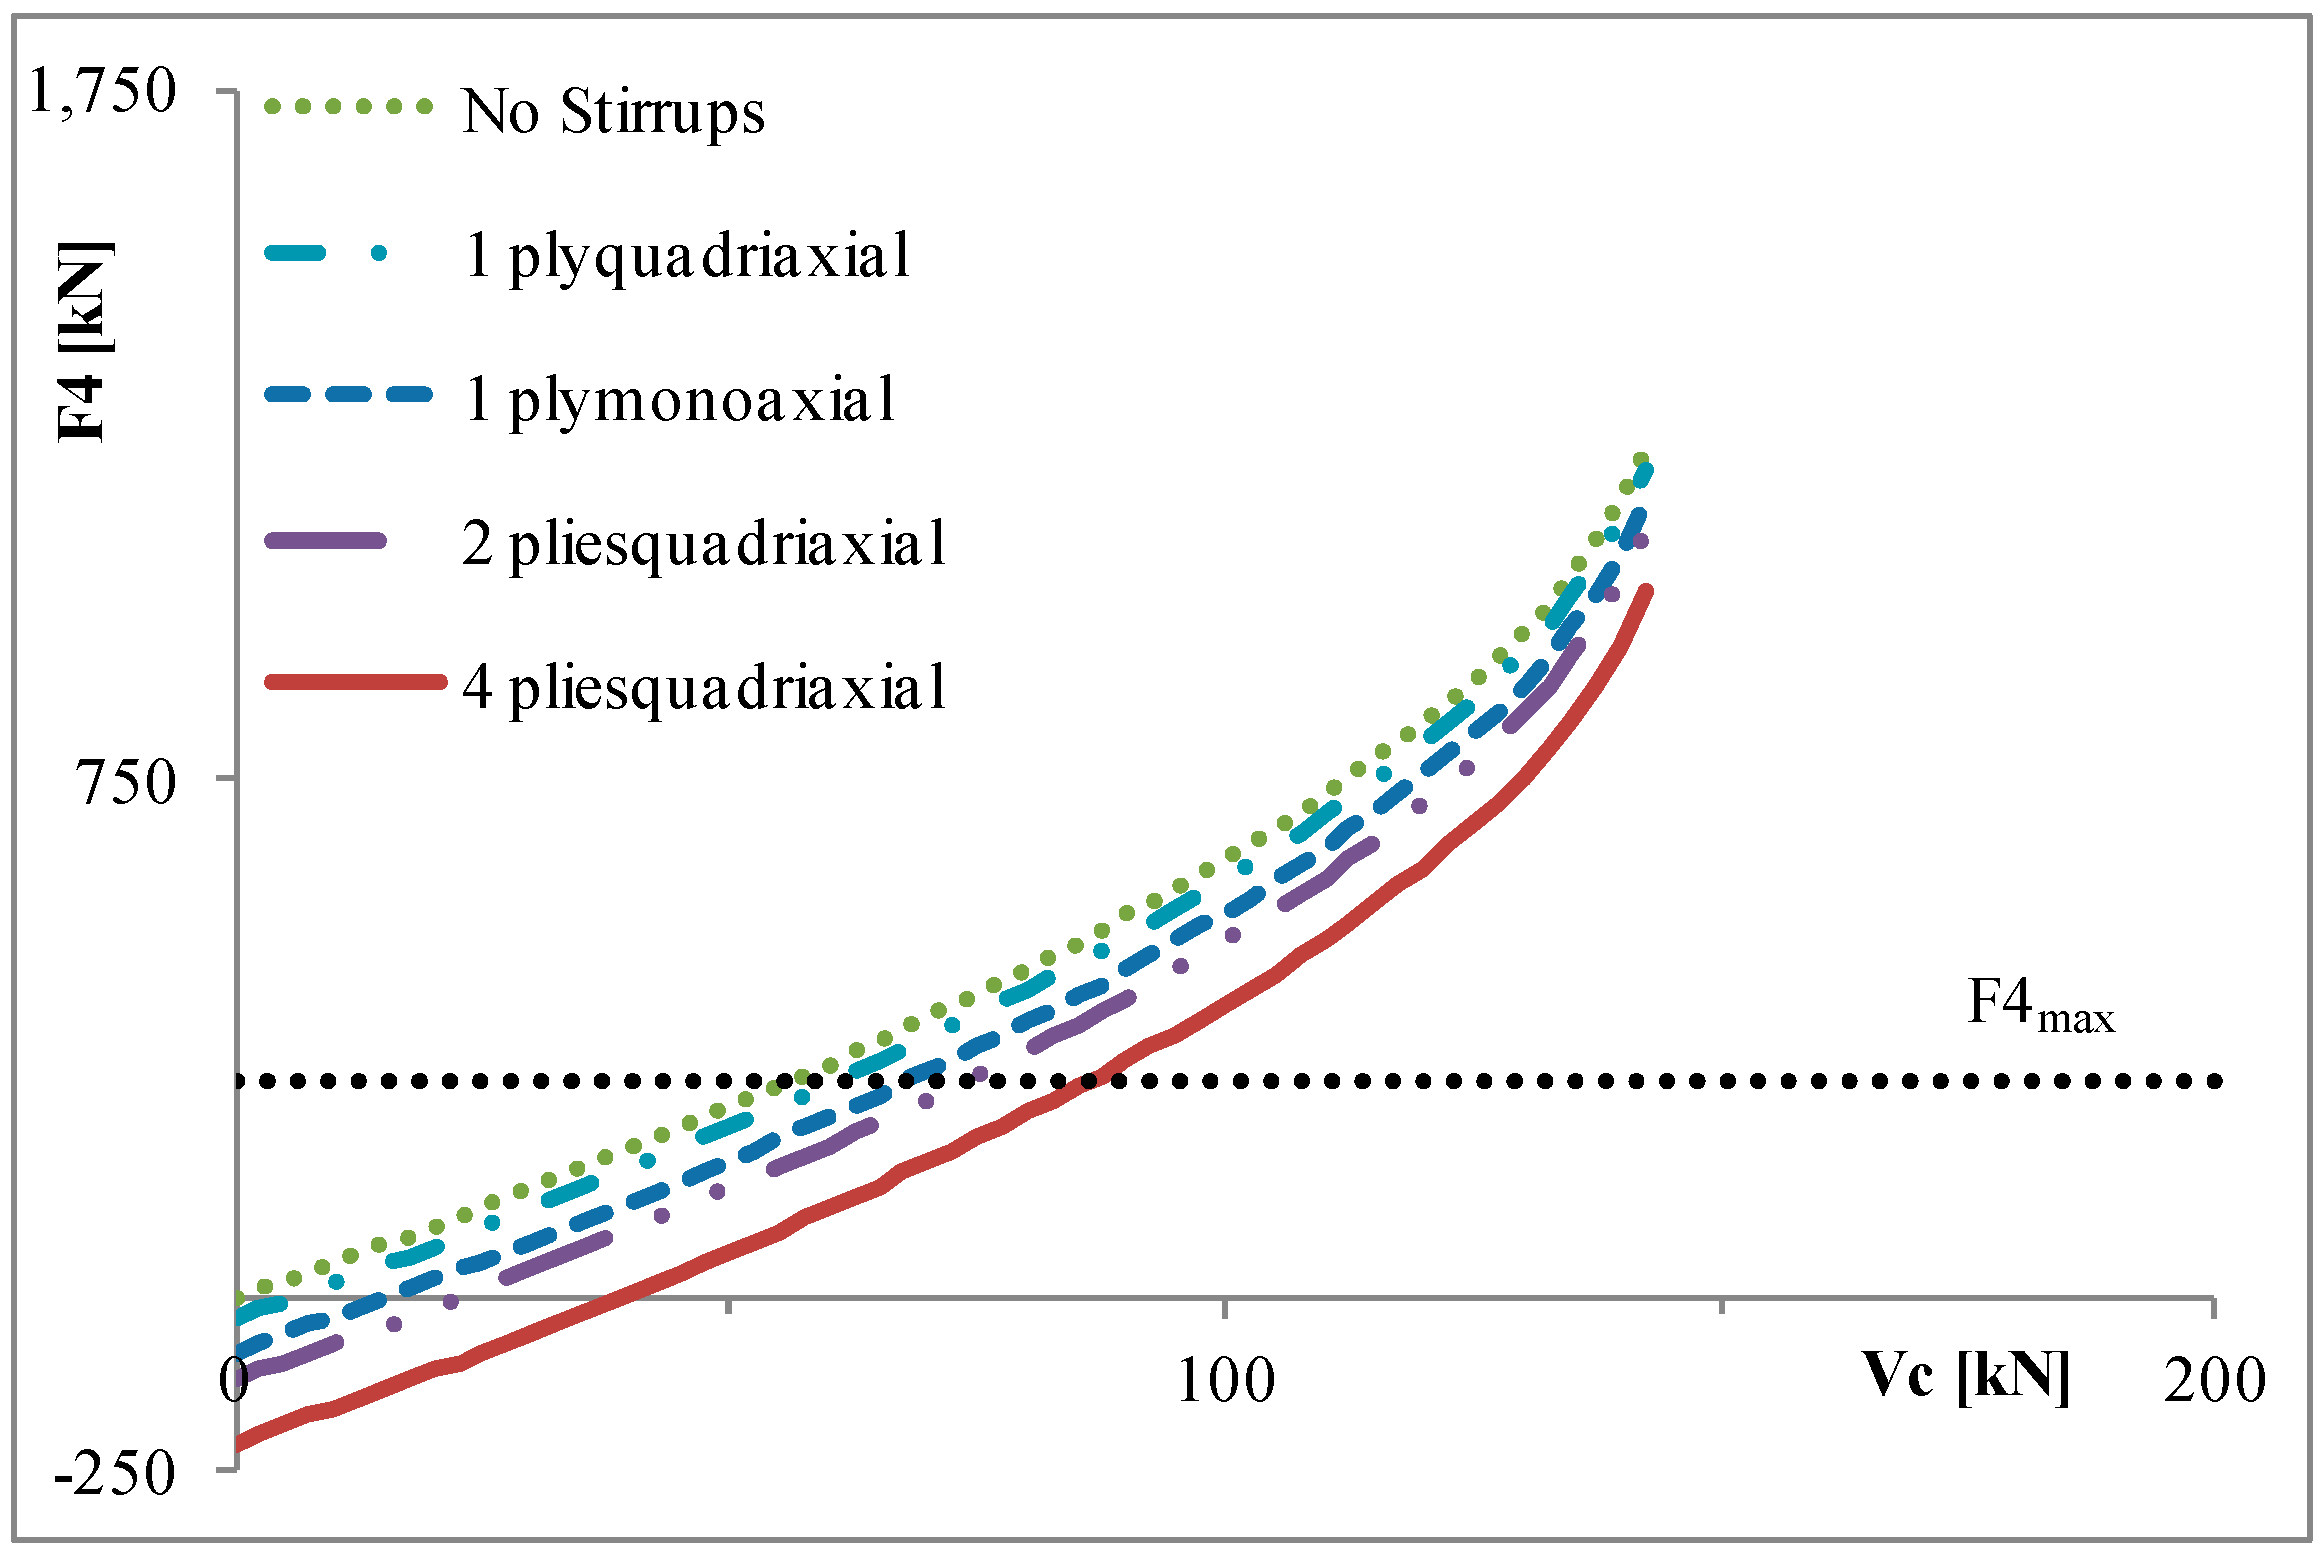
Similar comments can be repeated for externally-bonded FRP. The role of the reinforcement is similar to the insertion of stirrups; however, benefits can also be achieved on an existing joint, even if, originally, they have no internal stirrups. From a numerical point of view, the presence of FRP is similar to stirrups (note that one ply of uni-axial FRP is not enough to change the failure mode, remaining the joint failure with yielding of beam bars). FRP and stirrups both provide an increase of horizontal,
T9, (or vertical,
T10, if vertical fibers are also applied) load carrying capacity. FRP tensile force is assumed equal to the debonding force from the very beginning. For this reason, in
Figure 8 the
F4(
Vc) curves have different origins. However, the presence of FRP increases the shear column value,
Vc, corresponding to system failure, from 55.91 kN (yet joint failure due to beam tensile reinforcement yielding) to 65.00 kN (+16.25%) (two plies of quadri-axial FRP, ID11 case). FRP was able to change the failure mode from brittle joint failure to more desirable ductile column flexural failure, with the only exception of ID9.
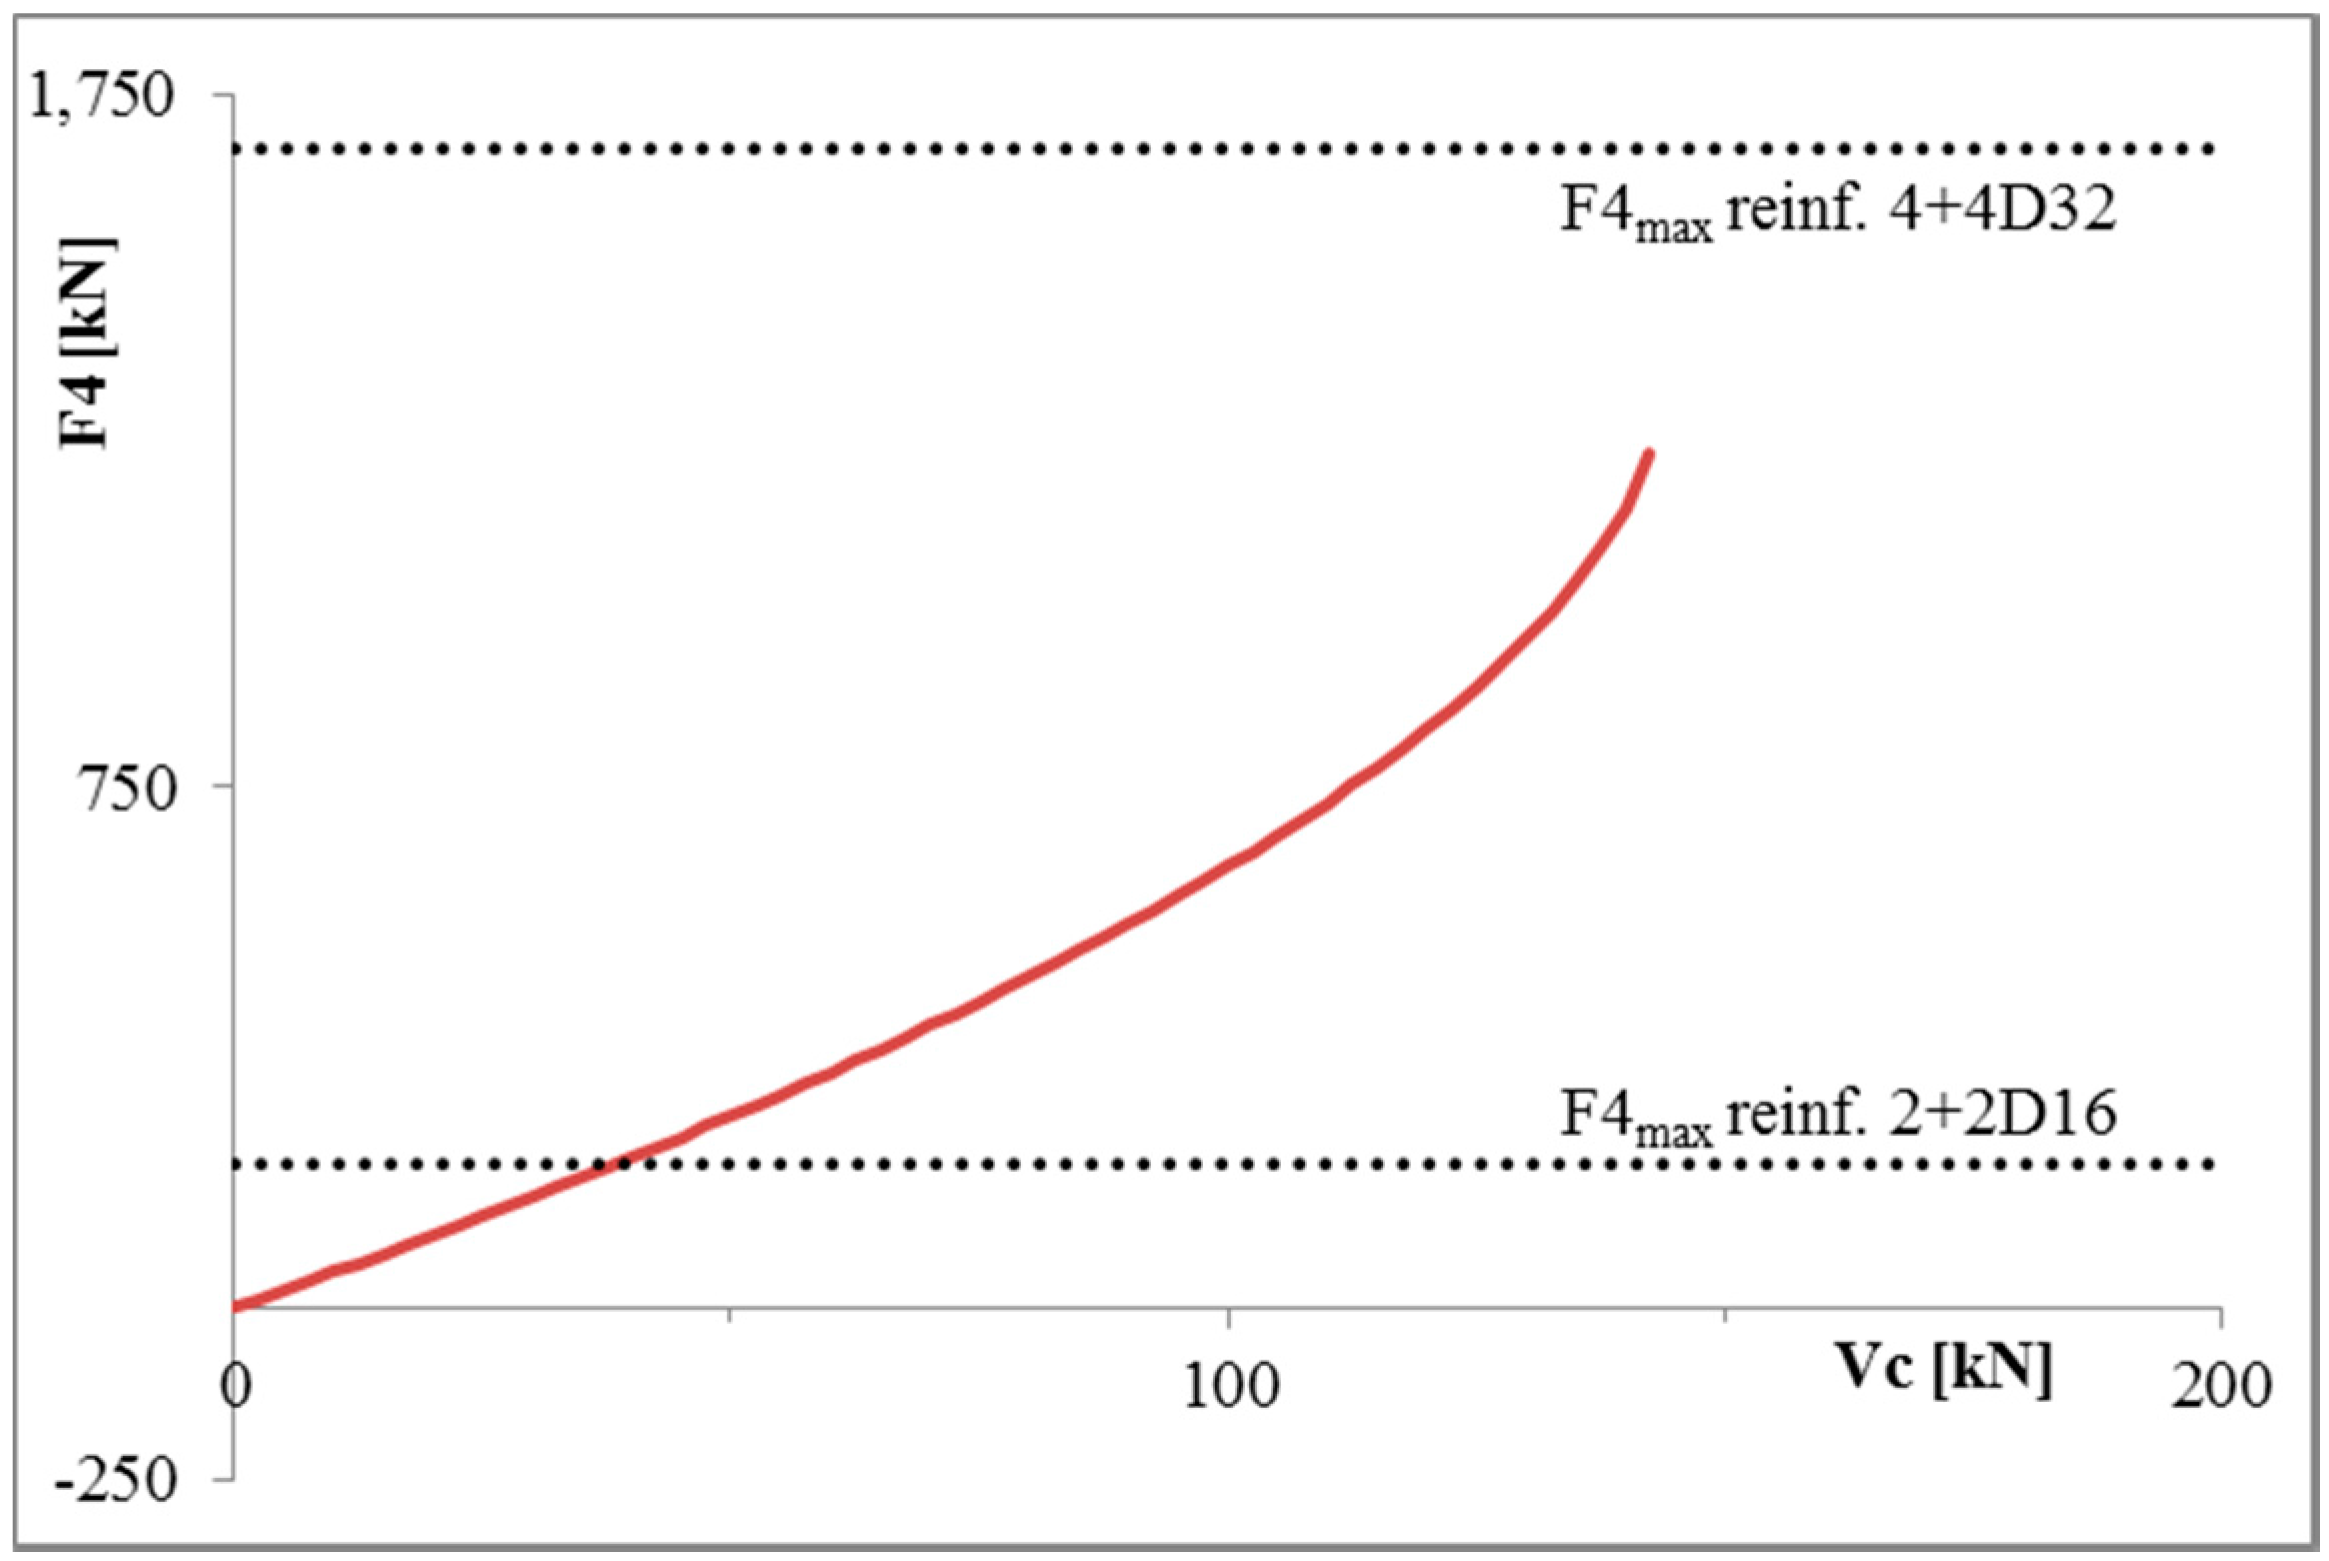
Longitudinal reinforcement has a low influence on the evaluation of force resultants, e.g.,
Figure 9 shows the
F4(
Vc) curves, they are overlapping; however, the yielding capacity is different, thus leading to much different column shear values,
Vc, corresponding to joint failure due to beam tensile reinforcement yielding. These column shear values,
Vc, reduces from 55.91 kN (actual failure of ID2 case) to 38.66 kN (−30.85%] (2+2D16 bars in the beams), or increases to 144.53 kN (+158.5%) (4+4D32 bars in the beams) yet not reaching yielding of bars, however in this latter case the failure mode is a different one, the column flexural failure, at
Vc = 62.18 kN. Conversely, the increase of beam dimensions has two main effects: the first one is the increase of beam capacity, both in terms of flexure and shear; and the second one is the increase of joint panel dimensions.
Figure 8.
Parametric analysis: tensile force, F4, in beam bars and its threshold with variability of externally bonded FRP.
Figure 8.
Parametric analysis: tensile force, F4, in beam bars and its threshold with variability of externally bonded FRP.
Figure 9.
Parametric analysis: tensile force, F4, in beam bars and its threshold with variability of longitudinal beam reinforcement.
Figure 9.
Parametric analysis: tensile force, F4, in beam bars and its threshold with variability of longitudinal beam reinforcement.
The increase of joint panel dimensions reduces the demand in terms of resultant forces in reinforcements, as shown in
Figure 10 where the bond demand is lower for the higher beam. The same figure also highlights the influence of bond capacity: the same beam-column joint, if reinforced with smooth bars, presents a much lower capacity. In the case of beams of dimensions 70 cm × 30 cm, potential failure due to bond occurs at 97.45 kN in the case of good bond for ribbed bars, and it drops dramatically to 12.62 kN (−87.05%) in the case of smooth bars. It is a “potential” failure mode in the case of a good bond with ribbed bars, because the actual failure mode is column flexural failure at a shear column value,
Vc = 66.79 kN.
Figure 10.
Parametric analysis: tensile force, F4, in beam bars and its threshold with variability of longitudinal beam reinforcement.
Figure 10.
Parametric analysis: tensile force, F4, in beam bars and its threshold with variability of longitudinal beam reinforcement.
Compared to counterpart case ID2 (differing only for beam height), the increase of joint panel dimensions increases the failure load. Conversely, if smooth bars where used, the predicted failure mode of the system would have occurred due to bond failure at a very low shear column value, Vc = 12.62 kN. This leads one to conclude that bond capacity has a meaningful effect on beam-column joint strength.
5. Model Validation
Theoretical predictions of the proposed simplified model were also compared to some experimental tests available in the literature (Hakuto
et al. [
22], Prota
et al. [
23] and Zaid
et al. [
24]) to validate the proposed theoretical model. Following, some beam-column joint specimens will be discussed in detail showing the entire table of “potential” failure modes. Actual failure load is the smallest of the potential failure modes. Discussion of the results considers two limit bond performances: maximum and minimum (due to smooth bars) bond conditions. This approach allows one not only to better understand the strength hierarchy, but also to calibrate strengthening design.
The basic idea is to avoid all undesired failure modes (e.g., brittle shear failure of joint, but also of beams and columns) to push failure mode to more desirable ductile beam flexural failure. Once the desired failure mode is selected, than all failure mode mechanisms presenting lower column shear values should be improved and strengthening (on existing structures) or design improvements (in structures still under design) can be calibrated to exceed the column shear, Vc corresponding to desired failure mode (i.e., according to “capacity design” approach).
Six retrofit configurations have been implemented, and “applied” to literature experimental results. In particular they have been supposed (as retrofit method): (a) one quadri-axial ply of FRP of thickness, t = 0.1279 mm; (b) two quadri-axial plies of FRP of thickness, t = 0.2559 mm; (c) four quadri-axial plies of FRP of thickness, t = 0.5116 mm; (d) one uni-axial horizontal ply of FRP of thickness, t = 0.333 mm; (e) two stirrups (two legs) of diameter 12 mm; and (f) four stirrups (two legs) of diameter 12 mm, simulated into the model by appropriate values of F9 and F10.
In all the cases FRP has a Young’s Modulus of 230 GPa and is assumed to debond at 0.4%.
Table 4 shows concrete characteristics and beam and column longitudinal and transversal reinforcements for all considered specimens of experimental tests available in scientific literature.
Table 4.
Geometrical and mechanical properties of specimens of experimental programs.
Table 4.
Geometrical and mechanical properties of specimens of experimental programs.
| Specimen ID Number | Concrete characteristics | Concrete section | Concrete cover | Beam | Column | Stirrups |
|---|
| Upper side | Lower side | Upper side | Lower side | Beam | Column |
|---|
| Nc | fck | Beam | Column | Beam | Column | Bar diameter | A’s,b | fy | Bar diameter | As,b | fy | Bar diameter | A’s,c | fy | Bar diameter | As,c | fy | legs, diameter | fy | legs, diameter | fy |
|---|
| kN | MPa | cm2 | cm2 | mm | mm | mm | cm2 | MPa | mm | cm2 | MPa | mm | cm2 | MPa | mm | cm2 | MPa | N°, mm | MPa | N°, mm | MPa |
|---|
| Hakuto et al. [22] |
| Unit 5 | 0 | 33 | 50 × 30 | 46 × 46 | 36 | 40 | 32 | 16.08 | 306 | 32 | 16.08 | 306 | 28 | 18.46 | 321 | 28 | 18.46 | 321 | 2, 12 | 398 | 2, 12 | 398 |
| Unit 1 | 0 | 41 | 50 × 30 | 46 × 30 | 40 | 40 | 24 | 9.04 | 325 | 24 | 18.09 | 325 | 24 | 13.56 | 325 | 24 | 13.56 | 325 | 399 | 4, 12 | 399 |
| Prota et al. [23] |
| L1 | 124.5 | 38.6 | 35.5 × 20 | 20 × 20 | 38 | 38 | 22 | 11.40 | 599 | 18 | 5.08 | 511 | 16 | 8.04 | 449 | 16 | 8.04 | 449 | 2, 12 | 398 | 2, 12 | 398 |
| H1 | 249.0 | 31.7 |
| L2 | 124.5 | 39.8 |
| H2 | 249.0 | 36.5 |
| Zaid et al. [24] |
| 1 | 100 | 28 | 30 × 20 | 30 × 30 | 35 | 35 | 16 | 10.05 | 470 | 16 | 10.05 | 470 | 19 | 11.34 | 450 | 19 | 11.34 | 450 | 1, 6 | 390 | 1, 6 | 390 |
However more details about experimental programs and results can be found in relevant cited publications.
Table 5 shows results obtained by the resolution of the experimental configuration model (for each experimental program and each specimen).
The validation is proposed in
Table 6 where the agreement between experimental outcomes and model predictions (both in terms of failure modes and column shear capacity) is usually satisfactory and on the safe side.
Table 5.
Theoretical prediction of capacities for each potential failure modes of specimens of experimental programs.
Table 5.
Theoretical prediction of capacities for each potential failure modes of specimens of experimental programs.
| Column shear at failure | Experimental program |
|---|
| Hakuto et al. [22] | Prota et al. [23] | Zaid et al. [24] |
|---|
| Unit 05 | Unit 01 | L1 | H1 | L2 | H2 | Specimen 3 |
|---|
| Vc1 (kN) | 170.50 | 94.32 | 63.20 | 62.43 | 63.29 | 62.95 | 171.26 |
| Vc2 (kN) | 197.57 | 131.17 | 32.50 | 36.73 | 33.82 | 40.67 | 228.73 |
| Vc3 (kN) | 299.21 | 248.54 | 32.57 | 434.84 | 501.26 | 475.32 | 446.75 |
| Vc4 (kN) | 739.40 | 629.79 | 128.76 | 128.76 | 247.56 | 244.56 | 328.58 |
| Vc5 (kN) | 130.19 | 76.03 | 35.90 | 32.26 | 33.31 | 32.94 | 121.52 |
| Vc6 (kN) | 163.44 | 121.55 | 53.07 | 54.34 | 49.49 | 57.20 | 128.33 |
| Vc8 (kN) | 192.62 | 187.06 | 30.19 | 26.93 | 30.58 | 29.14 | 129.80 |
| Vc9 (kN) | 111.22 | 99.95 | 15.93 | 14.30 | 16.12 | 15.41 | 90.91 |
| Vc10 (kN) | 29.22 | 25.12 | 3.97 | 3.58 | 4.02 | 3.85 | 36.01 |
| Vc11 (kN) | 250.39 | 400.84 | 79.73 | 64.97 | 81.58 | 74.81 | 132.87 |
Table 6.
General validation of model by means of comparison of experimental outcomes and simplified model predictions.
Table 6.
General validation of model by means of comparison of experimental outcomes and simplified model predictions.
| Reference and Specimen ID | Experimental | Theoretical | Difference % |
|---|
| Failure mode | Vc (kN) | Failure mode | Vc (kN) |
|---|
| Hakuto et al. [22] O1 | J | 89.0 | J | 76.0 | −15% |
| Hakuto et al. [22] O5 | BS | 150.0 | J | 130.2 | −13% |
| Prota et al. [23] L1 | CF | 32.7 | CF | 32.5 | −1% |
| Prota et al. [23] H1 | CF | 37.7 | J | 32.3 | −14% |
| Prota et al. [23] L2 | CF | 31.6 | CF | 33.3 | 5% |
| Prota et al. [23] H2 | J | 38.4 | J | 32.9 | −14% |
| Zaid et al. [24] S3 | J | 130.0 | J | 121.5 | −6% |
5.1. Simulation of Experimental Tests in Research from Hakuto et al.
Both specimens tested by Hakuto
et al. [
22], have a failure mode due to yielding of bars of the beam, with a value of
Vc5 equal to 130.20 kN and 76.03 kN, for Unit 5 and Unit 1 (considering maximum bond), respectively. The proposed model satisfactorily underestimates the actual capacity of the tested joint. By applying the retrofit methods (a) to (d) at Unit 5, the failure mode does not change (both in case of minimum or maximum bond); instead, applying methods (e) and (f), the failure mode in case of maximum bond, moves from yielding of bars of column to yielding of bars of column, but not one of the considered retrofits provides a ductile failure mode. Unit 1 has a different behavior. Considering the maximum bond case, by applying the retrofit methods (a) and (b) failure does not change. In case of maximum bond, retrofit methods (c) to (f) allow to move to a failure mode due to bending moment of the beam (the most desirable one) applying three plies of FRP (
t = 0.33 mm), so the joint is upgradable. Results of the specimen named Unit 1 are shown in
Table 7.
Table 7.
General validation of model by means of comparison of experimental outcomes and simplified model predictions.
Table 7.
General validation of model by means of comparison of experimental outcomes and simplified model predictions.
| Column shear at failure | Hakuto et al.—Unit 01 |
|---|
| No retrofit | 1 ply (a) | 2 plies (b) | 4 plies (c) | 1 Uni-axial ply (d) | 2 Stirrups (e) | 4 Stirrups (f) |
|---|
| Vc1 (kN) | 94.32 | 94.32 | 94.32 | 94.32 | 94.32 | 94.32 | 94.32 |
| Vc2 (kN) | 131.17 | 131.17 | 131.17 | 131.17 | 131.17 | 131.17 | 131.17 |
| Vc3 (kN) | 248.54 | 248.54 | 248.54 | 248.54 | 248.54 | 248.54 | 248.54 |
| Vc4 (kN) | 629.79 | 629.79 | 629.79 | 629.79 | 629.79 | 629.79 | 629.79 |
| Vc5 (kN) | 76.03 | 83.26 | 90.41 | 104.51 | 94.69 | 112.91 | 147.80 |
| Vc6 (kN) | 121.55 | 128.38 | 135.14 | 148.41 | 121.56 | 121.56 | 121.56 |
| Vc8 (kN) | 187.06 | 193.05 | 198.97 | 210.57 | 202.50 | 217.45 | 245.72 |
| Vc9 (kN) | 99.95 | 106.94 | 113.85 | 127.46 | 117.98 | 135.56 | 169.16 |
| Vc10 (kN) | 25.12 | 32.83 | 40.46 | 55.52 | 45.03 | 64.50 | 101.97 |
| Vc11 (kN) | 400.84 | 400.84 | 400.84 | 400.84 | 400.84 | 400.84 | 400.84 |
5.2. Simulation of Experimental Tests in Research from Prota et al.
In this paper [
23], four specimens of a wider experimental program on perimetric joints have been considered, namely H1, L1, L2, and H2. For all of them, column length,
Lc, is 264 cm, beam length,
Lb, is 305 cm, distance between reinforcement layers in the column,
= 12.4 cm, distance between reinforcement layers in the beam,
= 27.9 cm, and concrete cover of beam and column is 4 cm.
The specimen named L1 does not present external FRP reinforcement. Considering the case of maximum bond the failure mode can be changed by applying one ply of uni-axial FRP (
t = 0.13 mm) from bond failure to the bending moment of the column. Similar results can be obtained in cases of medium or minimum bond, increasing the number of FRP plies or the number of stirrups. In any case, the retrofit yields to a failure due to the bending moment of the column. Nevertheless, to avoid this kind of joint failure, column bending capacity needs to be improved, but this kind of retrofit is out of the scope of present paper. Results are shown in
Table 8.
Concrete strength of specimen H1 (31.70 MPa) and H2 (36.50 MPa) is lower than previous cases (specimen L1
fc = 38.60 MPa), so it is more difficult to obtain every desirable failure mode. Considering maximum bond, the failure mode moves to flexural column failure by application of retrofit named (f) in both cases, even if
Vc values of specimen H2 are higher than values of specimen H1. Furthermore, the reduced concrete strength reduces the possibilities of FRP retrofit since the concrete strut crushing (
i.e.,
Vc11) could occur at column shear close to the desired flexural failure of beams (
i.e.,
Vc1). All potential failure modes and relevant column shears are reported in
Table 9 and
Table 10.
Specimen L2 presents results comparable with specimen L1.
Table 8.
Theoretical prediction of capacities for each potential failure modes of different retrofit solutions for specimens “L1” (Prota et al.).
Table 8.
Theoretical prediction of capacities for each potential failure modes of different retrofit solutions for specimens “L1” (Prota et al.).
| Column shear at failure | Prota et al.—L1 |
|---|
| No retrofit | 1 ply (a) | 2 plies (b) | 4 plies (c) | 1 uni-axial ply (d) | 2 Stirrups (e) | 4 Stirrups (f) |
|---|
| Vc1 (kN) | 63.20 | 63.20 | 63.20 | 63.20 | 63.20 | 63.20 | 63.20 |
| Vc2 (kN) | 32.57 | 32.57 | 32.57 | 32.57 | 32.57 | 32.57 | 32.57 |
| Vc3 (kN) | 494.32 | 494.32 | 494.32 | 494.32 | 494.32 | 494.32 | 494.32 |
| Vc4 (kN) | 128.76 | 128.76 | 128.76 | 128.76 | 128.76 | 128.76 | 128.76 |
| Vc5 (kN) | 35.90 | 38.15 | 40.33 | 44.53 | 41.62 | 43.25 | 49.96 |
| Vc6 (kN) | 53.07 | 54.78 | 56.45 | 59.62 | 53.06 | 53.07 | 53.07 |
| Vc8 (kN) | 30.19 | 32.57 | 34.89 | 39.36 | 36.26 | 38.00 | 45.18 |
| Vc9 (kN) | 15.93 | 18.61 | 21.24 | 26.33 | 22.79 | 24.78 | 33.00 |
| Vc10 (kN) | 3.97 | 6.88 | 9.73 | 15.28 | 11.42 | 13.59 | 22.59 |
| Vc11 (kN) | 79.73 | 79.73 | 79.73 | 79.73 | 79.73 | 79.73 | 79.73 |
Table 9.
Theoretical prediction of capacities for each potential failure modes of different retrofit solutions for specimens “H1” (Prota et al.).
Table 9.
Theoretical prediction of capacities for each potential failure modes of different retrofit solutions for specimens “H1” (Prota et al.).
| Column shear at failure | Prota et al.—H1 |
|---|
| No retrofit | 1 ply (a) | 2 plies (b) | 4 plies (c) | 1 uni-axial ply (d) | 2 Stirrups (e) | 4 Stirrups (f) |
|---|
| Vc1 (kN) | 62.43 | 62.43 | 62.43 | 62.43 | 62.43 | 62.43 | 62.43 |
| Vc2 (kN) | 36.73 | 36.73 | 36.73 | 36.73 | 36.73 | 36.73 | 36.73 |
| Vc3 (kN) | 434.84 | 434.84 | 434.84 | 434.84 | 434.84 | 434.84 | 434.84 |
| Vc4 (kN) | 128.76 | 128.76 | 128.76 | 128.76 | 128.76 | 128.76 | 128.76 |
| Vc5 (kN) | 32.26 | 34.40 | 36.47 | 40.41 | 37.69 | 39.22 | 45.39 |
| Vc6 (kN) | 54.34 | 55.54 | 56.68 | 58.75 | 54.32 | 54.34 | 54.34 |
| Vc8 (kN) | 26.93 | 29.23 | 31.47 | 35.73 | 32.78 | 34.44 | 41.17 |
| Vc9 (kN) | 14.30 | 16.94 | 19.52 | 24.47 | 21.04 | 22.96 | 30.86 |
| Vc10 (kN) | 3.58 | 6.47 | 9.30 | 14.76 | 10.97 | 13.10 | 21.87 |
| Vc11 (kN) | 64.97 | 64.97 | 64.97 | 64.97 | 64.97 | 64.97 | 64.97 |
Table 10.
Theoretical prediction of capacities for each potential failure modes of different retrofit solutions for specimens “H2” (Prota et al.).
Table 10.
Theoretical prediction of capacities for each potential failure modes of different retrofit solutions for specimens “H2” (Prota et al.).
| Column shear at failure | Prota et al.—H2 |
|---|
| No retrofit | 1 ply (a) | 2 plies (b) | 4 plies (c) | 1 uni-axial ply (d) | 2 Stirrups (e) | 4 Stirrups (f) |
|---|
| Vc1 (kN) | 62.95 | 62.95 | 62.95 | 62.95 | 62.95 | 62.95 | 62.95 |
| Vc2 (kN) | 40.67 | 40.67 | 40.67 | 40.67 | 40.67 | 40.67 | 40.67 |
| Vc3 (kN) | 475.32 | 475.32 | 475.32 | 475.32 | 475.32 | 475.32 | 475.32 |
| Vc4 (kN) | 244.56 | 244.56 | 244.56 | 244.56 | 244.56 | 244.56 | 244.56 |
| Vc5 (kN) | 32.94 | 35.20 | 37.40 | 41.61 | 38.69 | 40.34 | 47.05 |
| Vc6 (kN) | 57.20 | 58.64 | 60.03 | 62.64 | 57.18 | 57.20 | 57.20 |
| Vc8 (kN) | 29.14 | 31.50 | 33.79 | 38.20 | 35.15 | 36.86 | 43.91 |
| Vc9 (kN) | 15.41 | 18.08 | 20.69 | 25.73 | 22.23 | 24.20 | 32.32 |
| Vc10 (kN) | 3.85 | 6.75 | 9.59 | 15.11 | 11.28 | 13.43 | 22.37 |
| Vc11 (kN) | 74.81 | 74.81 | 74.81 | 74.81 | 74.81 | 74.81 | 74.81 |
5.3. Simulation of Experimental Tests in Research from Zaid et al.
In this case [
24], column length,
Lc, is 147 cm, beam length,
Lb, is 270 cm, distance between reinforcements layer in the column,
= 23 cm, distance between reinforcements layer in the beam,
= 23 cm, concrete cover of beam and column is 3.5 cm and concrete contact force inclination is equal to
= 0.785 rad.
Results obtained by applying retrofits (a) to (f), and not reported here for brevity, show that it is not possible to move from the joint failure mode due to yielding of bars of beam by retrofitting the joint only with the considered retrofit configurations. In this case the reinforcement ratio of the beams is high; hence the flexural capacity is relatively high to move to the desired ductile flexural beam failure.


 ,
, 

