
Effect of Artificial Weathering on PLA/Nanocomposite Molecular Weight Distribution


Abstract
:
1. Introduction
2. Experimental Section
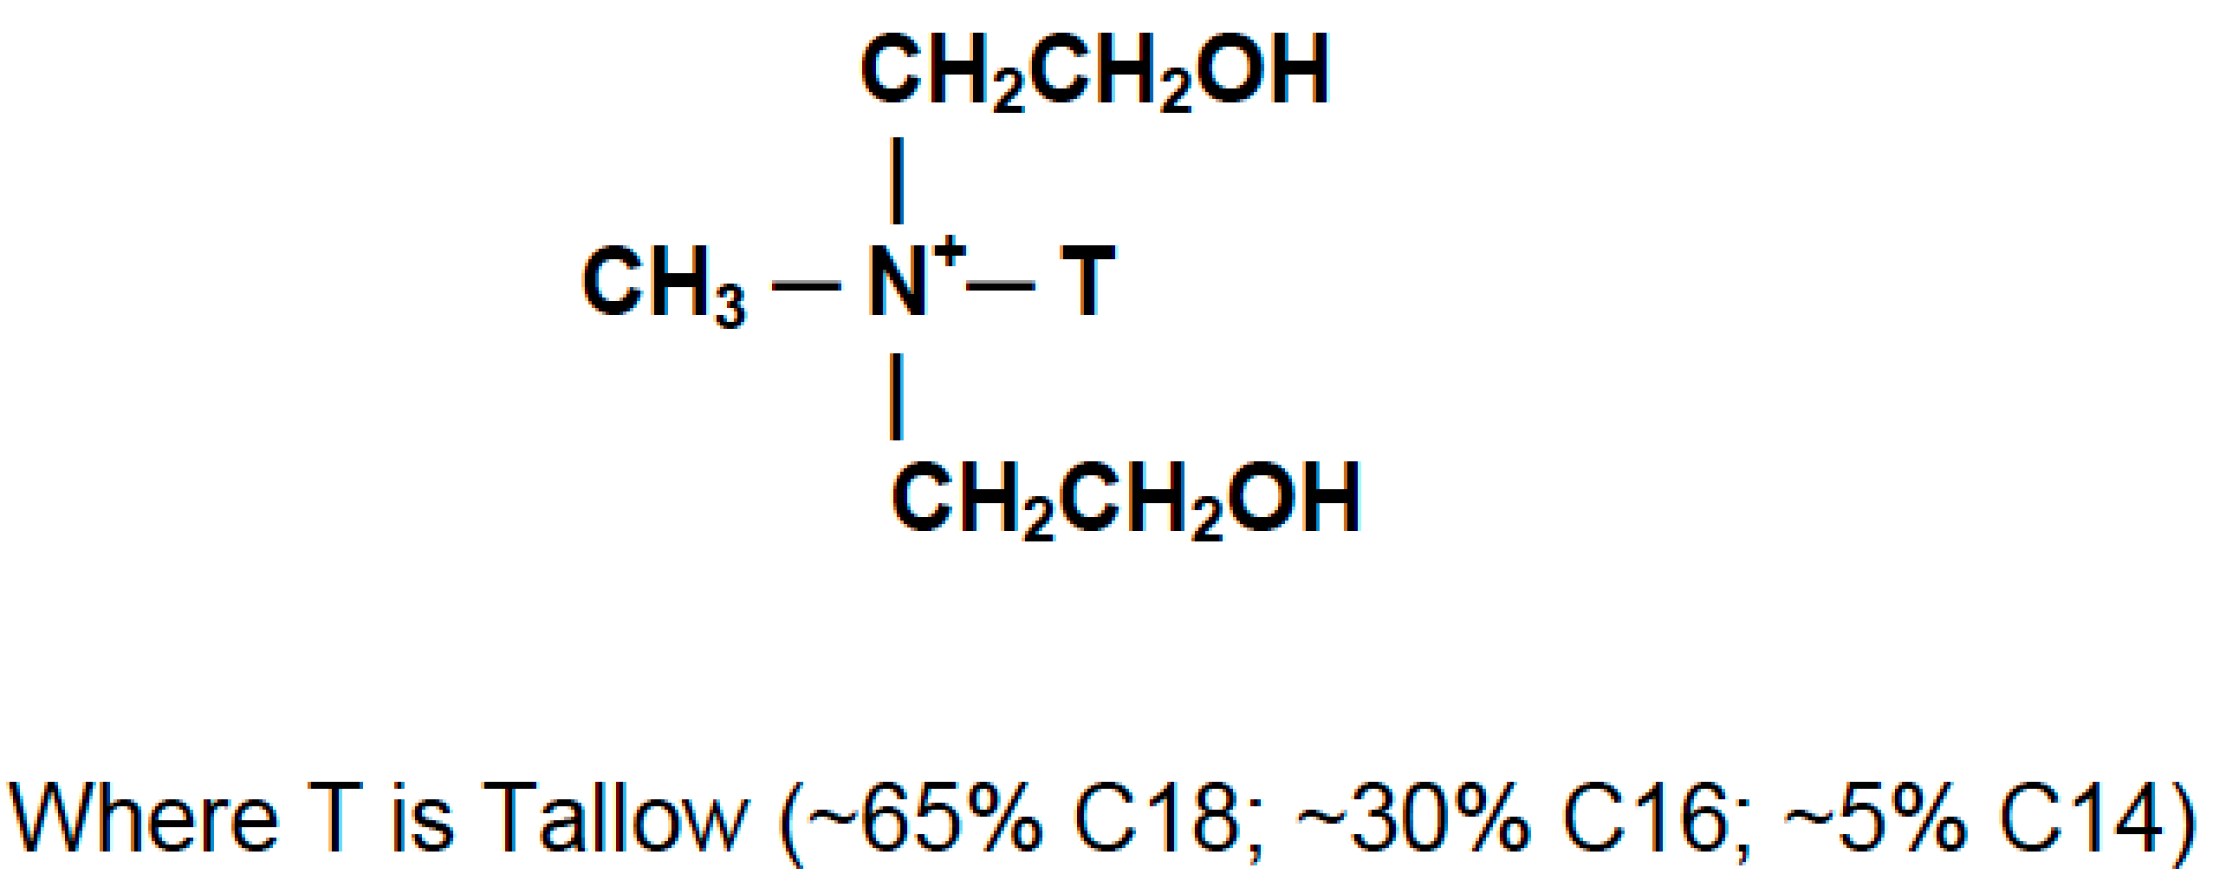
2.1. Materials

Preparation of PLA Nanocomposites and Blanks
2.2. Characterization
2.3. Artificial Weathering
3. Results and Discussion
3.1. Before Accelerated Weathering
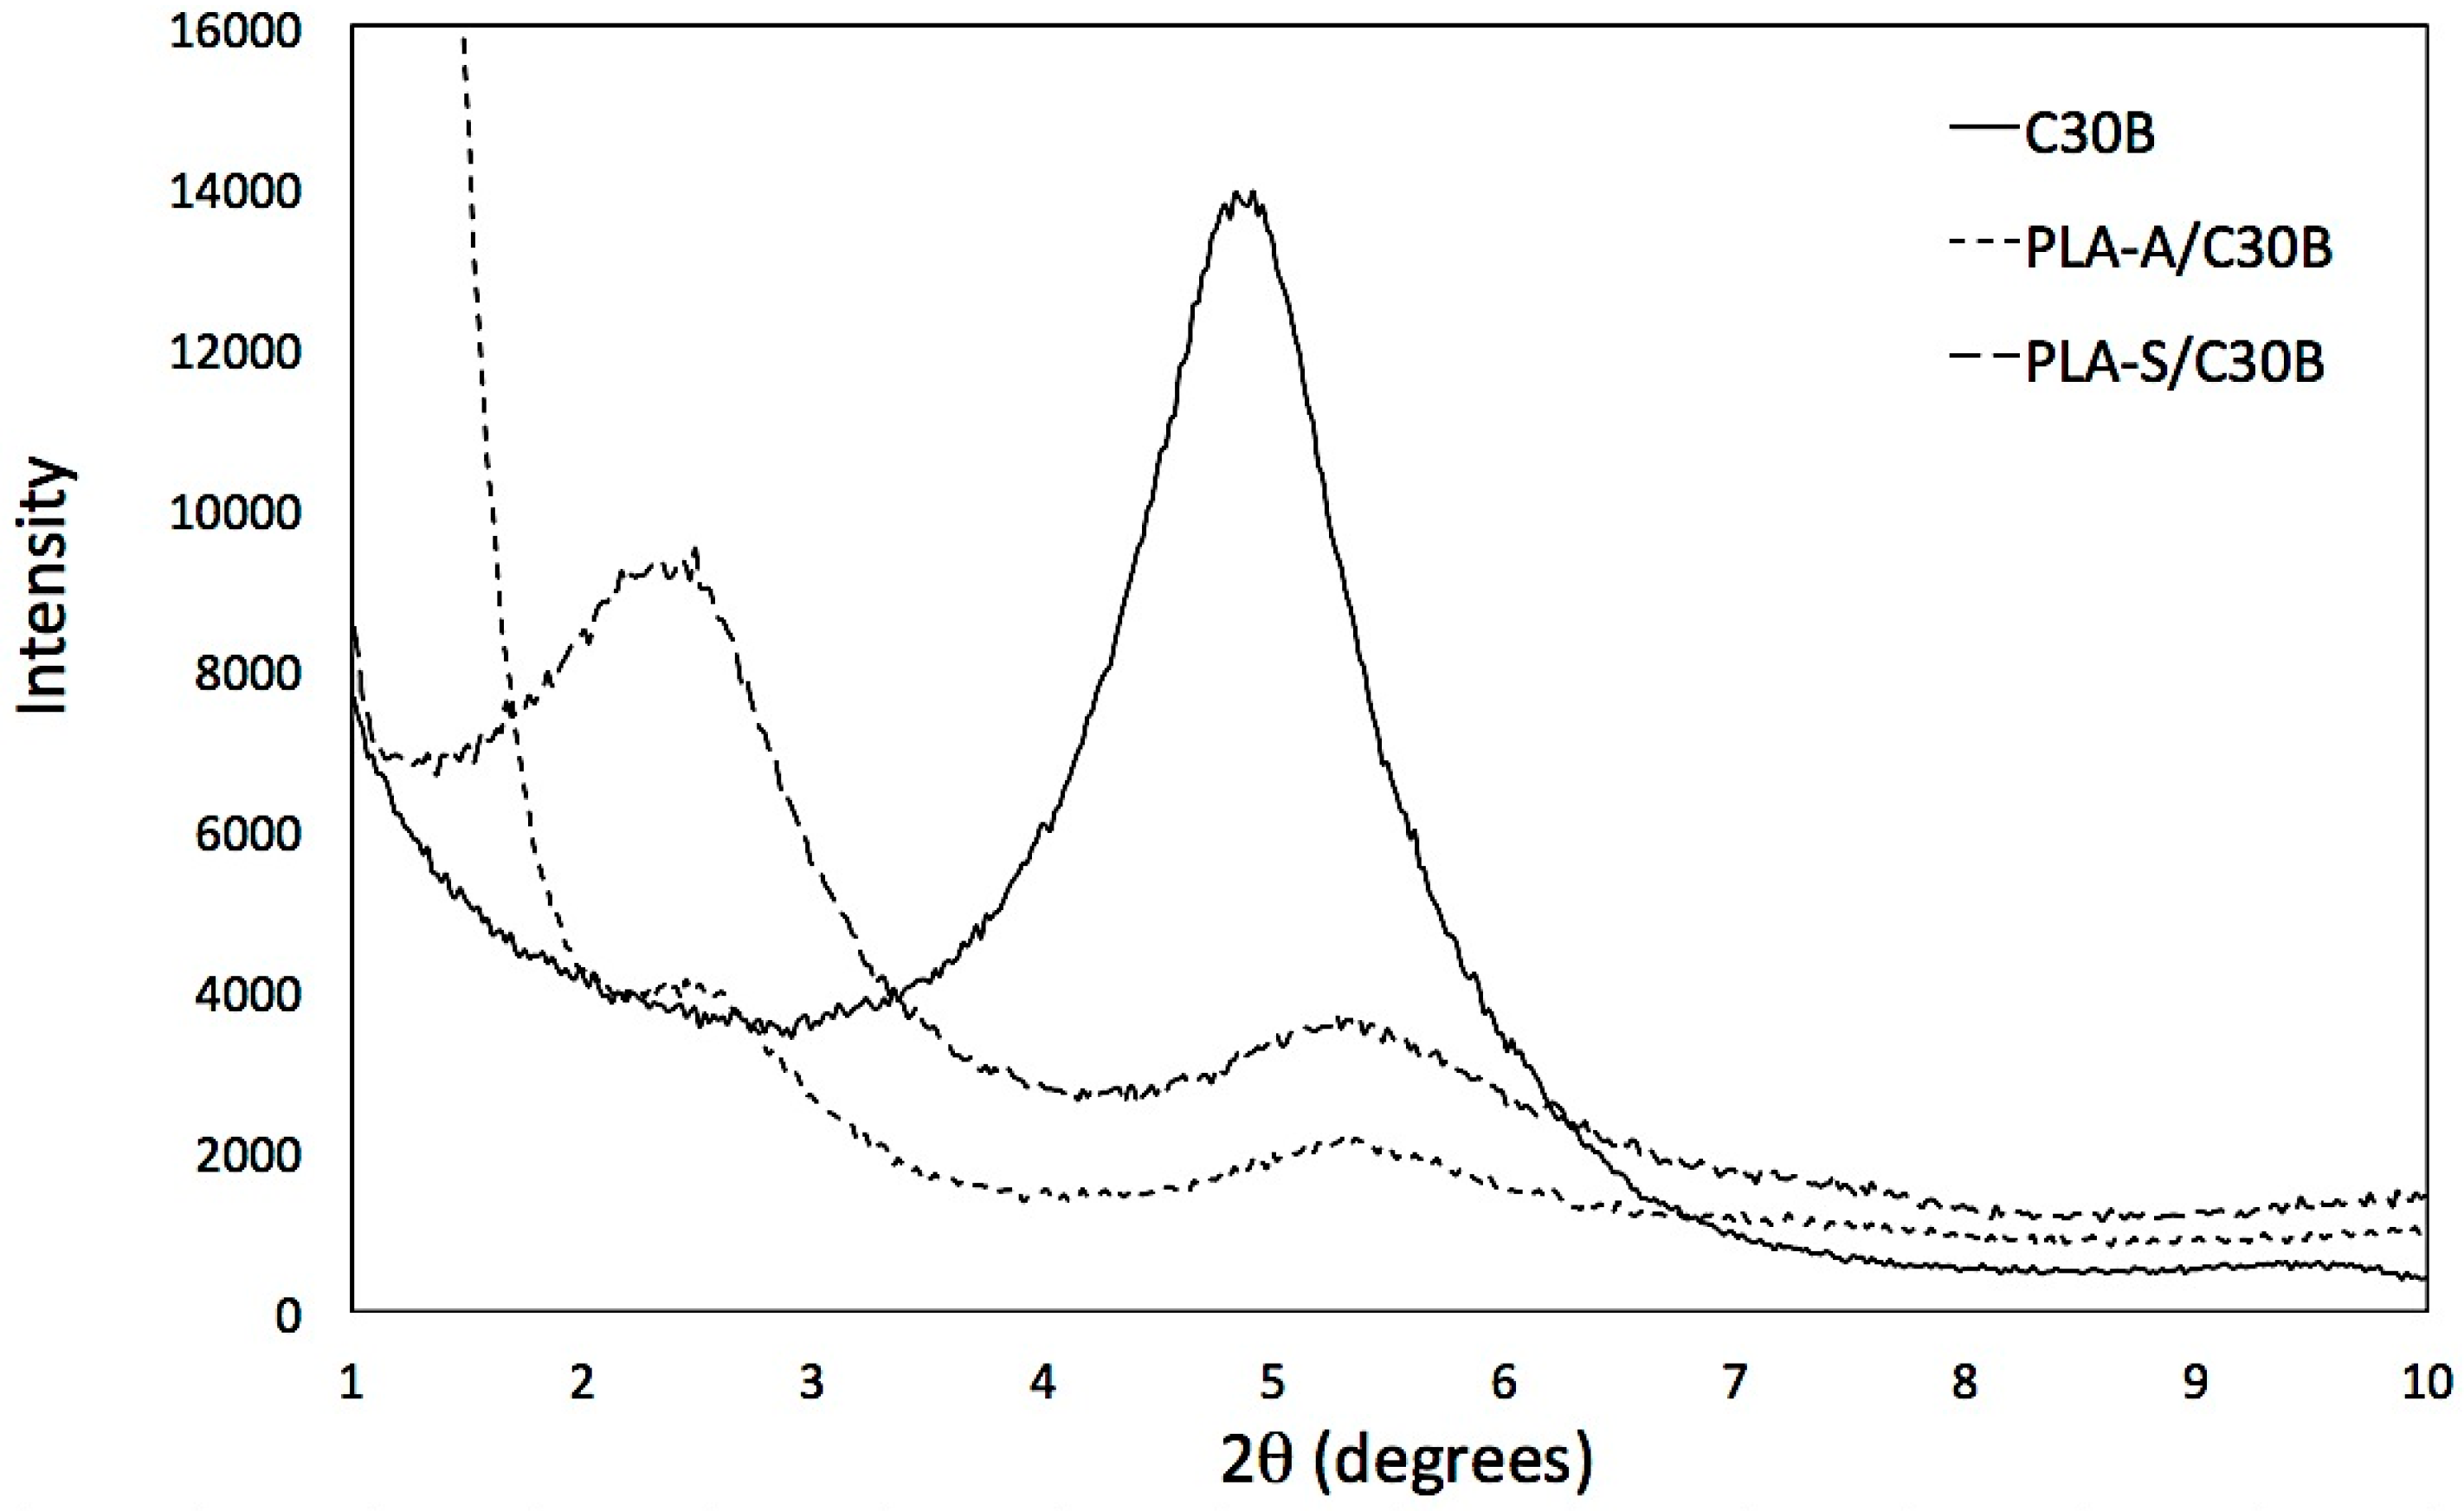
3.1.1. XRD

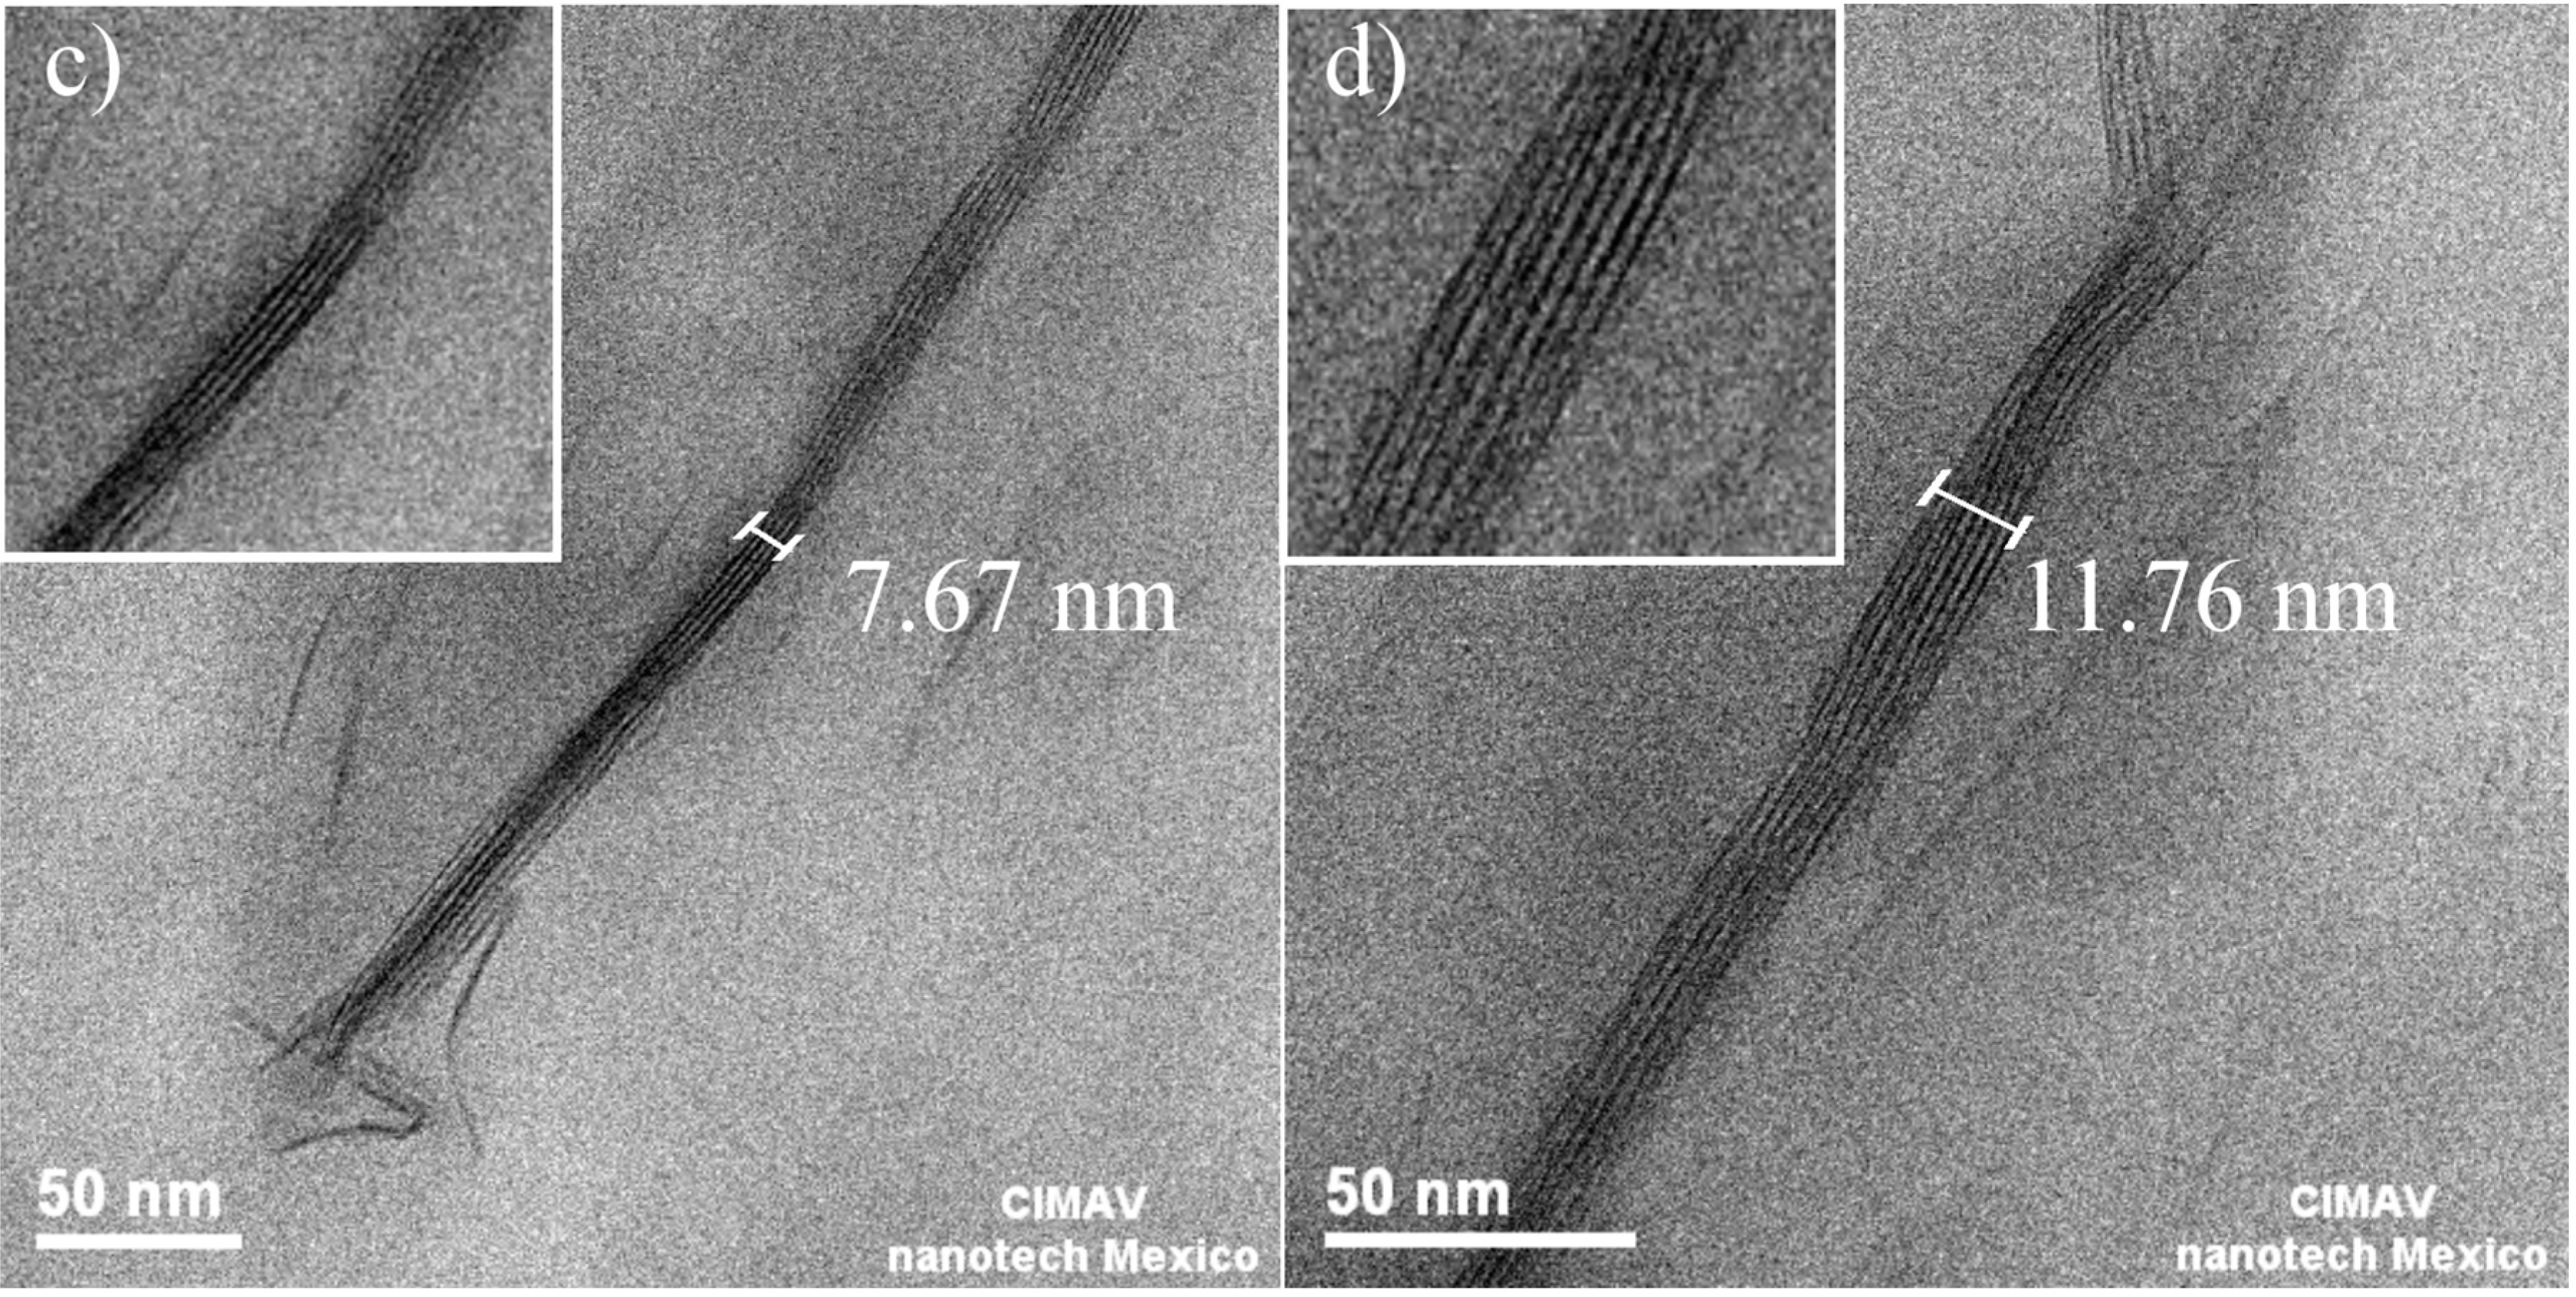
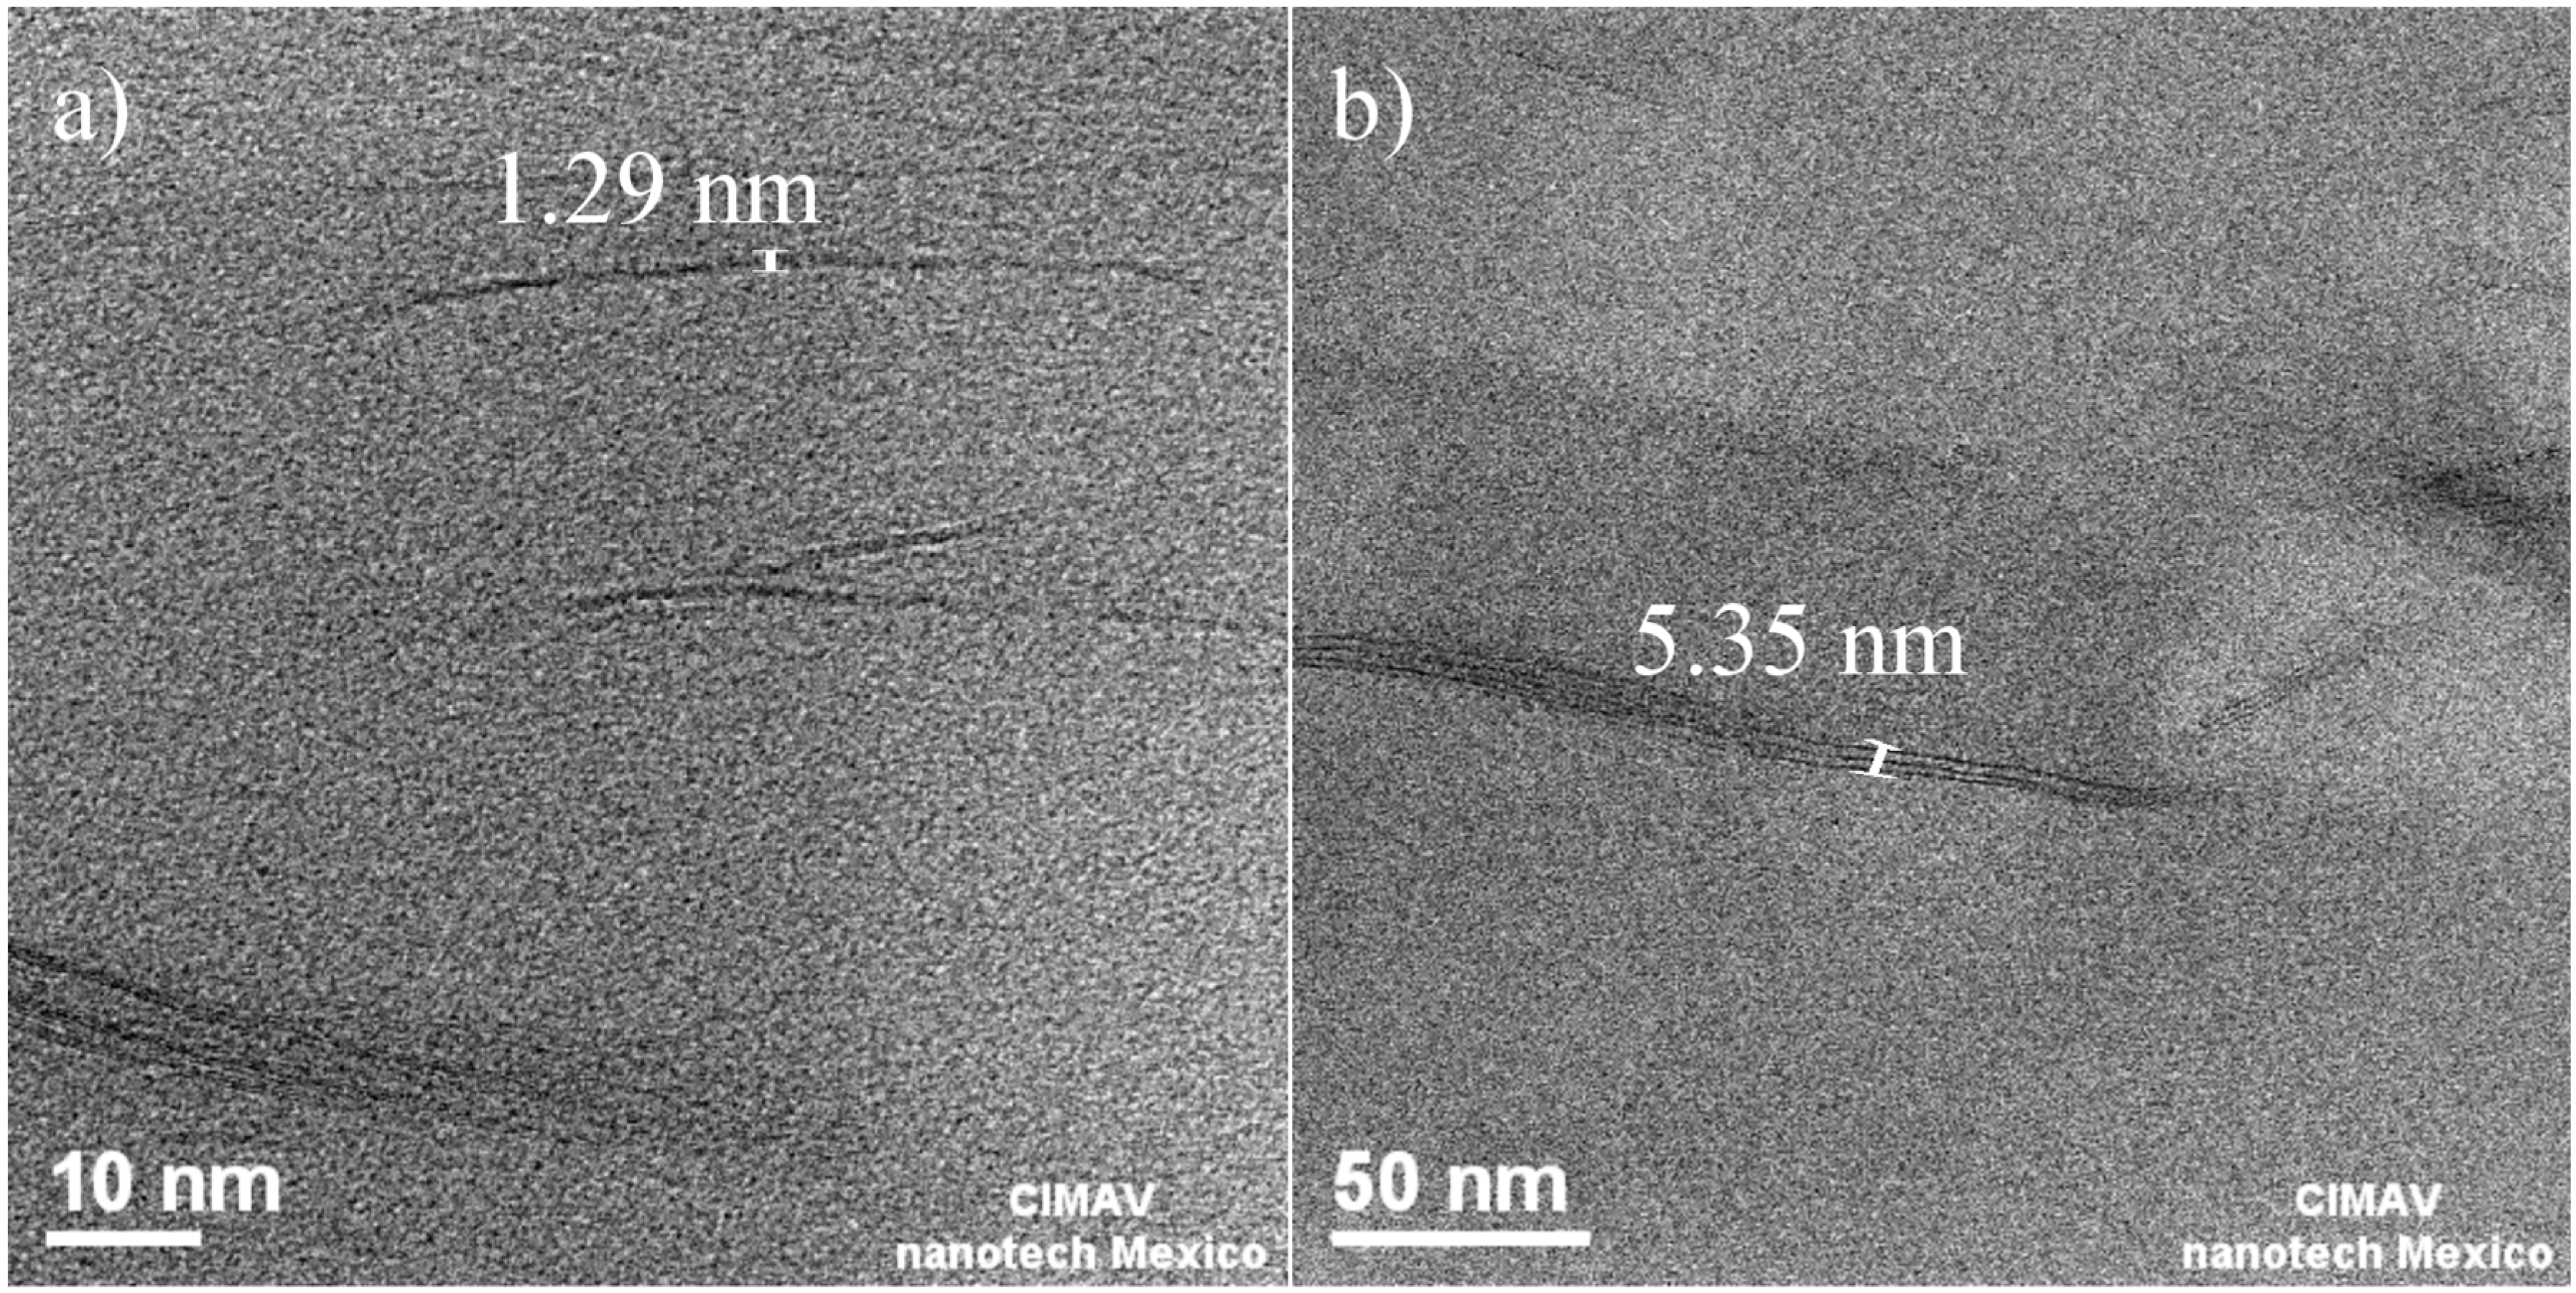
3.1.2. Morphology

3.1.3. Molecular Weight Distribution before Artificial Weathering

| Sample | Mw (kg·mol−1) | Mn (kg·mol−1) | Mw/Mn |
|---|---|---|---|
| PLA-A/Neat | 270.0 | 81.4 | 3.32 |
| PLA-A/P | 157.8 | 57.0 | 2.77 |
| PLA-A/B | 139.0 | 50.3 | 2.76 |
| PLA-A/C30B | 97.7 | 44.7 | 2.19 |
| PLA-S/Neat | 329.0 | 136.0 | 2.42 |
| PLA-S/P | 222.7 | 77.0 | 2.90 |
| PLA-S/B | 125.0 | 49.0 | 2.55 |
| PLA-S/C30B | 99.0 | 43.5 | 2.27 |
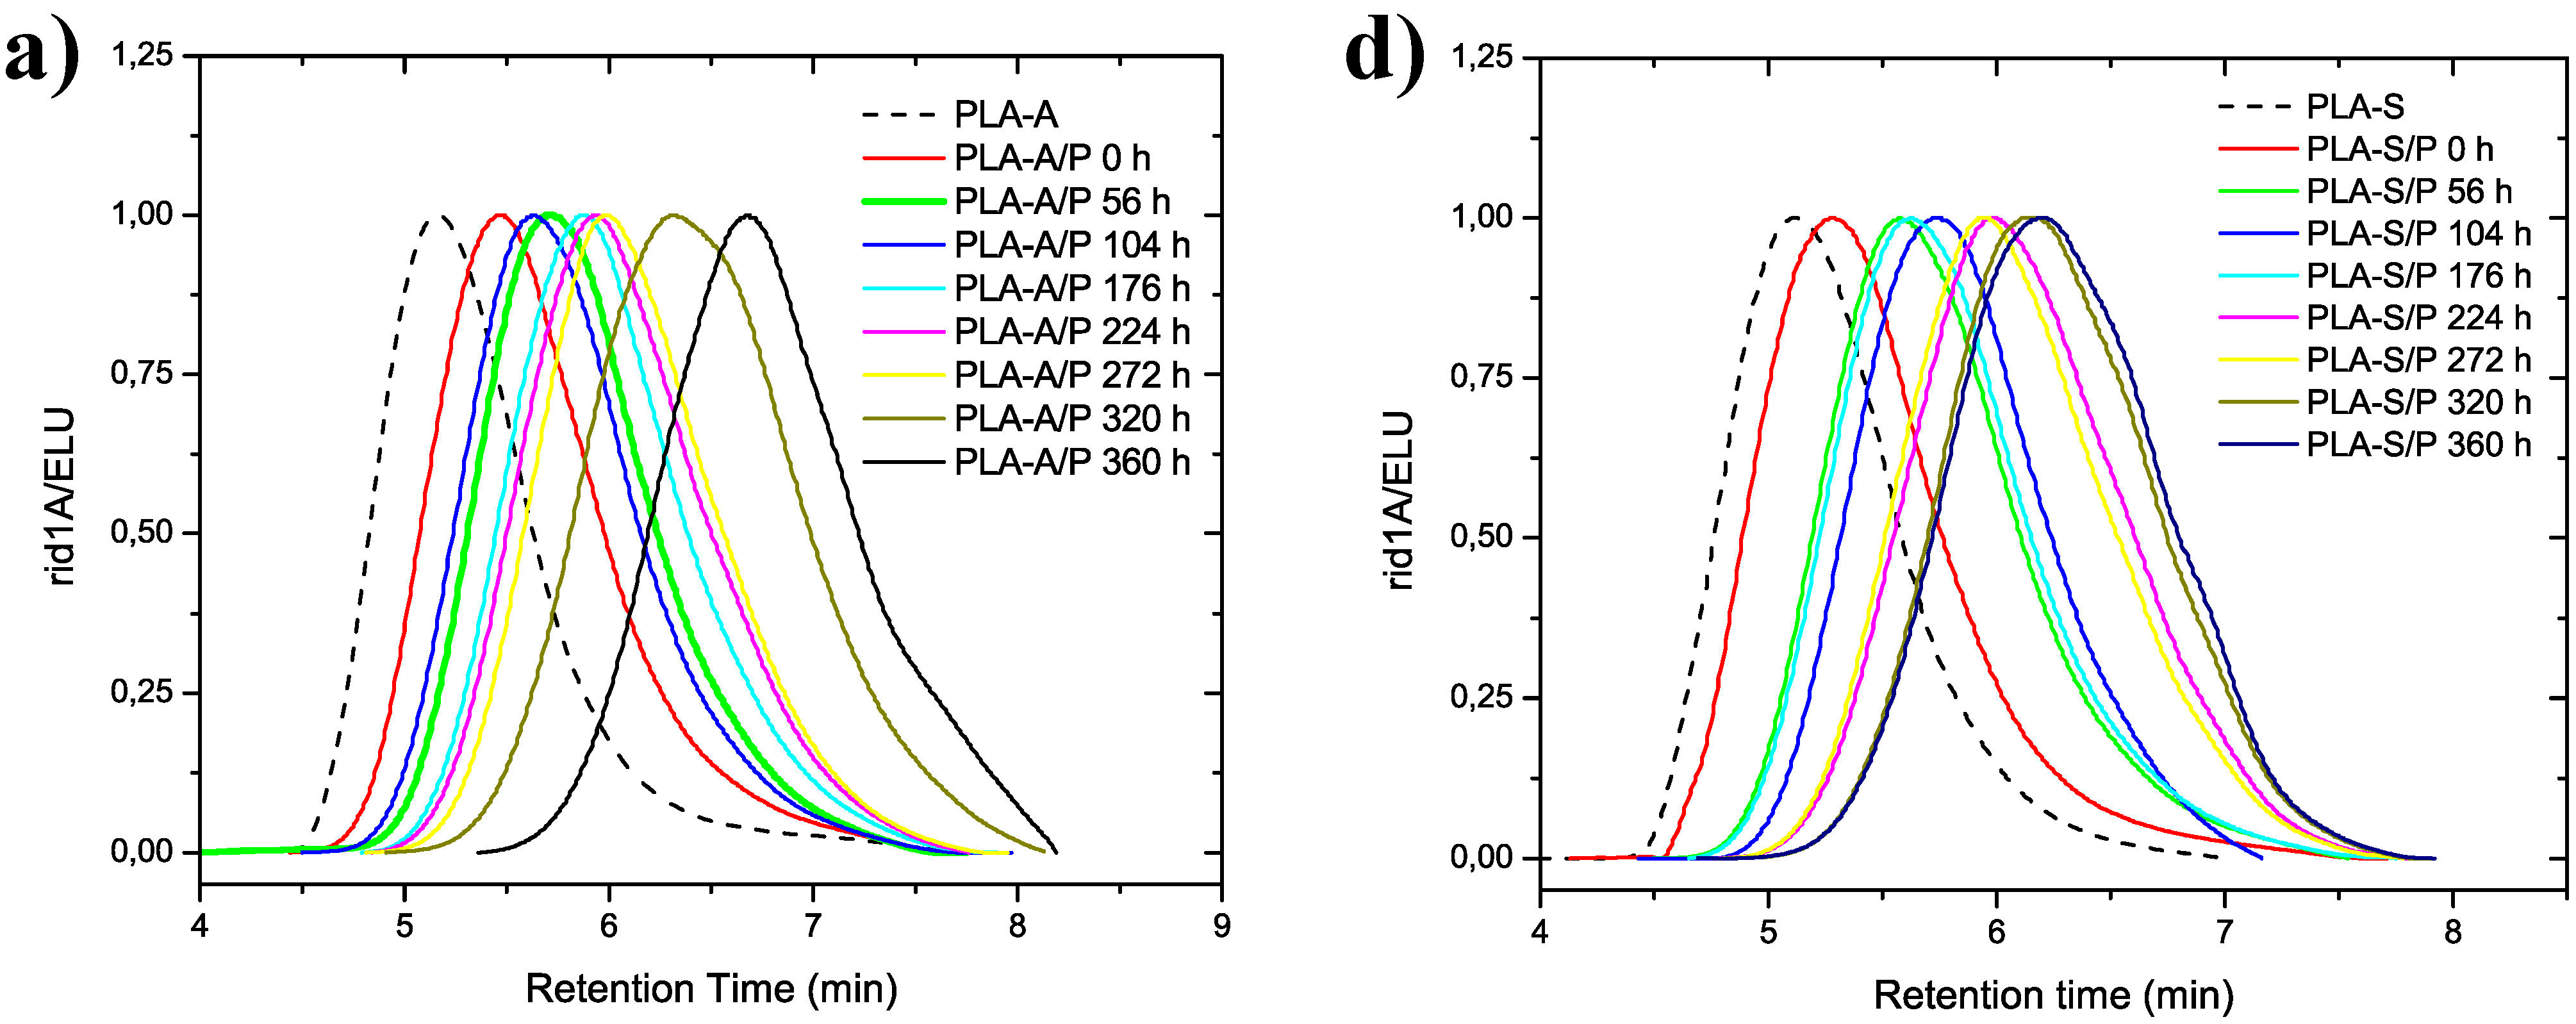
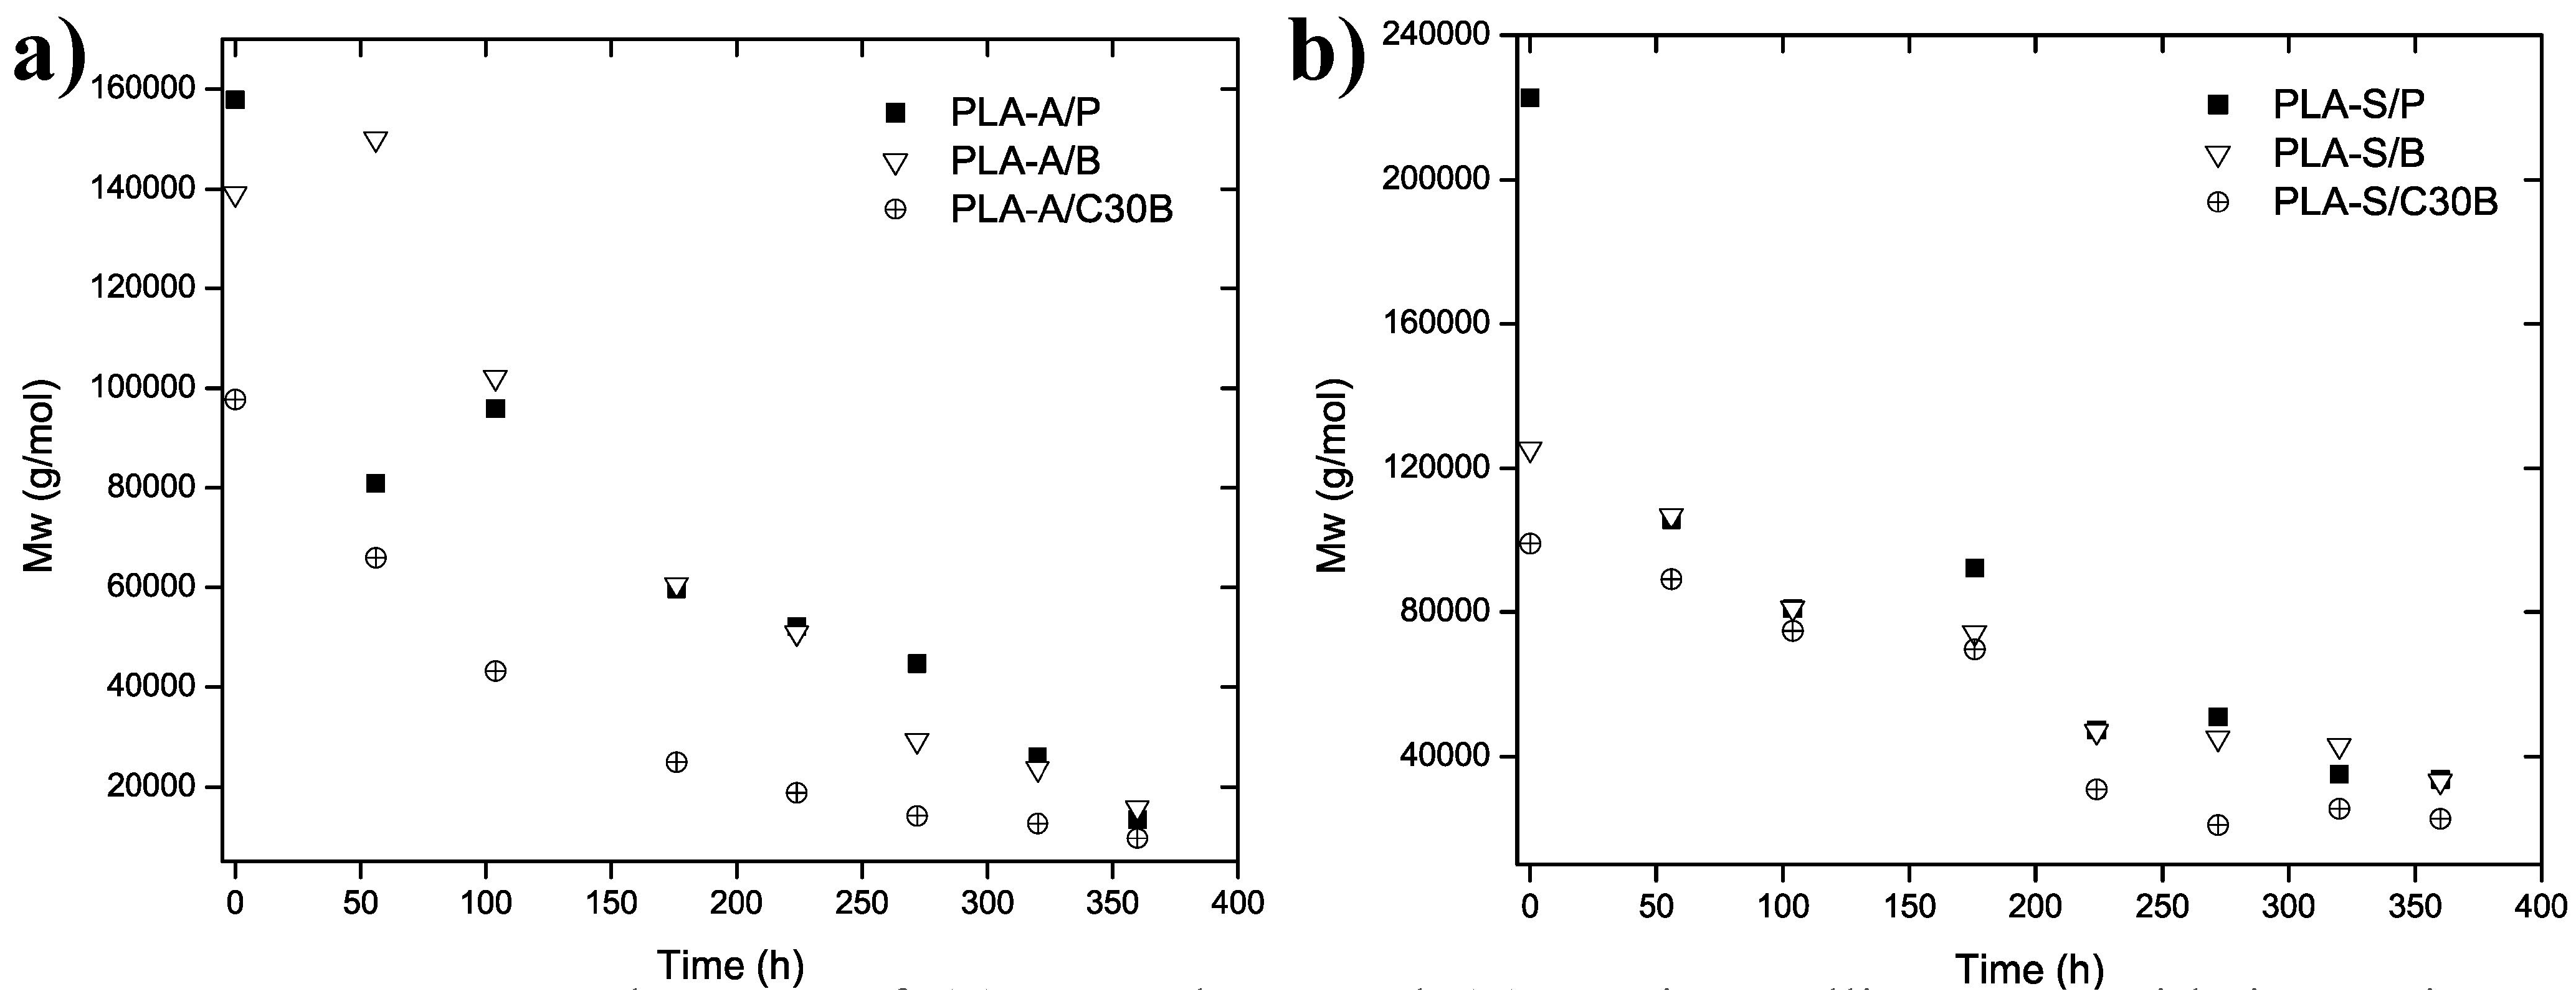
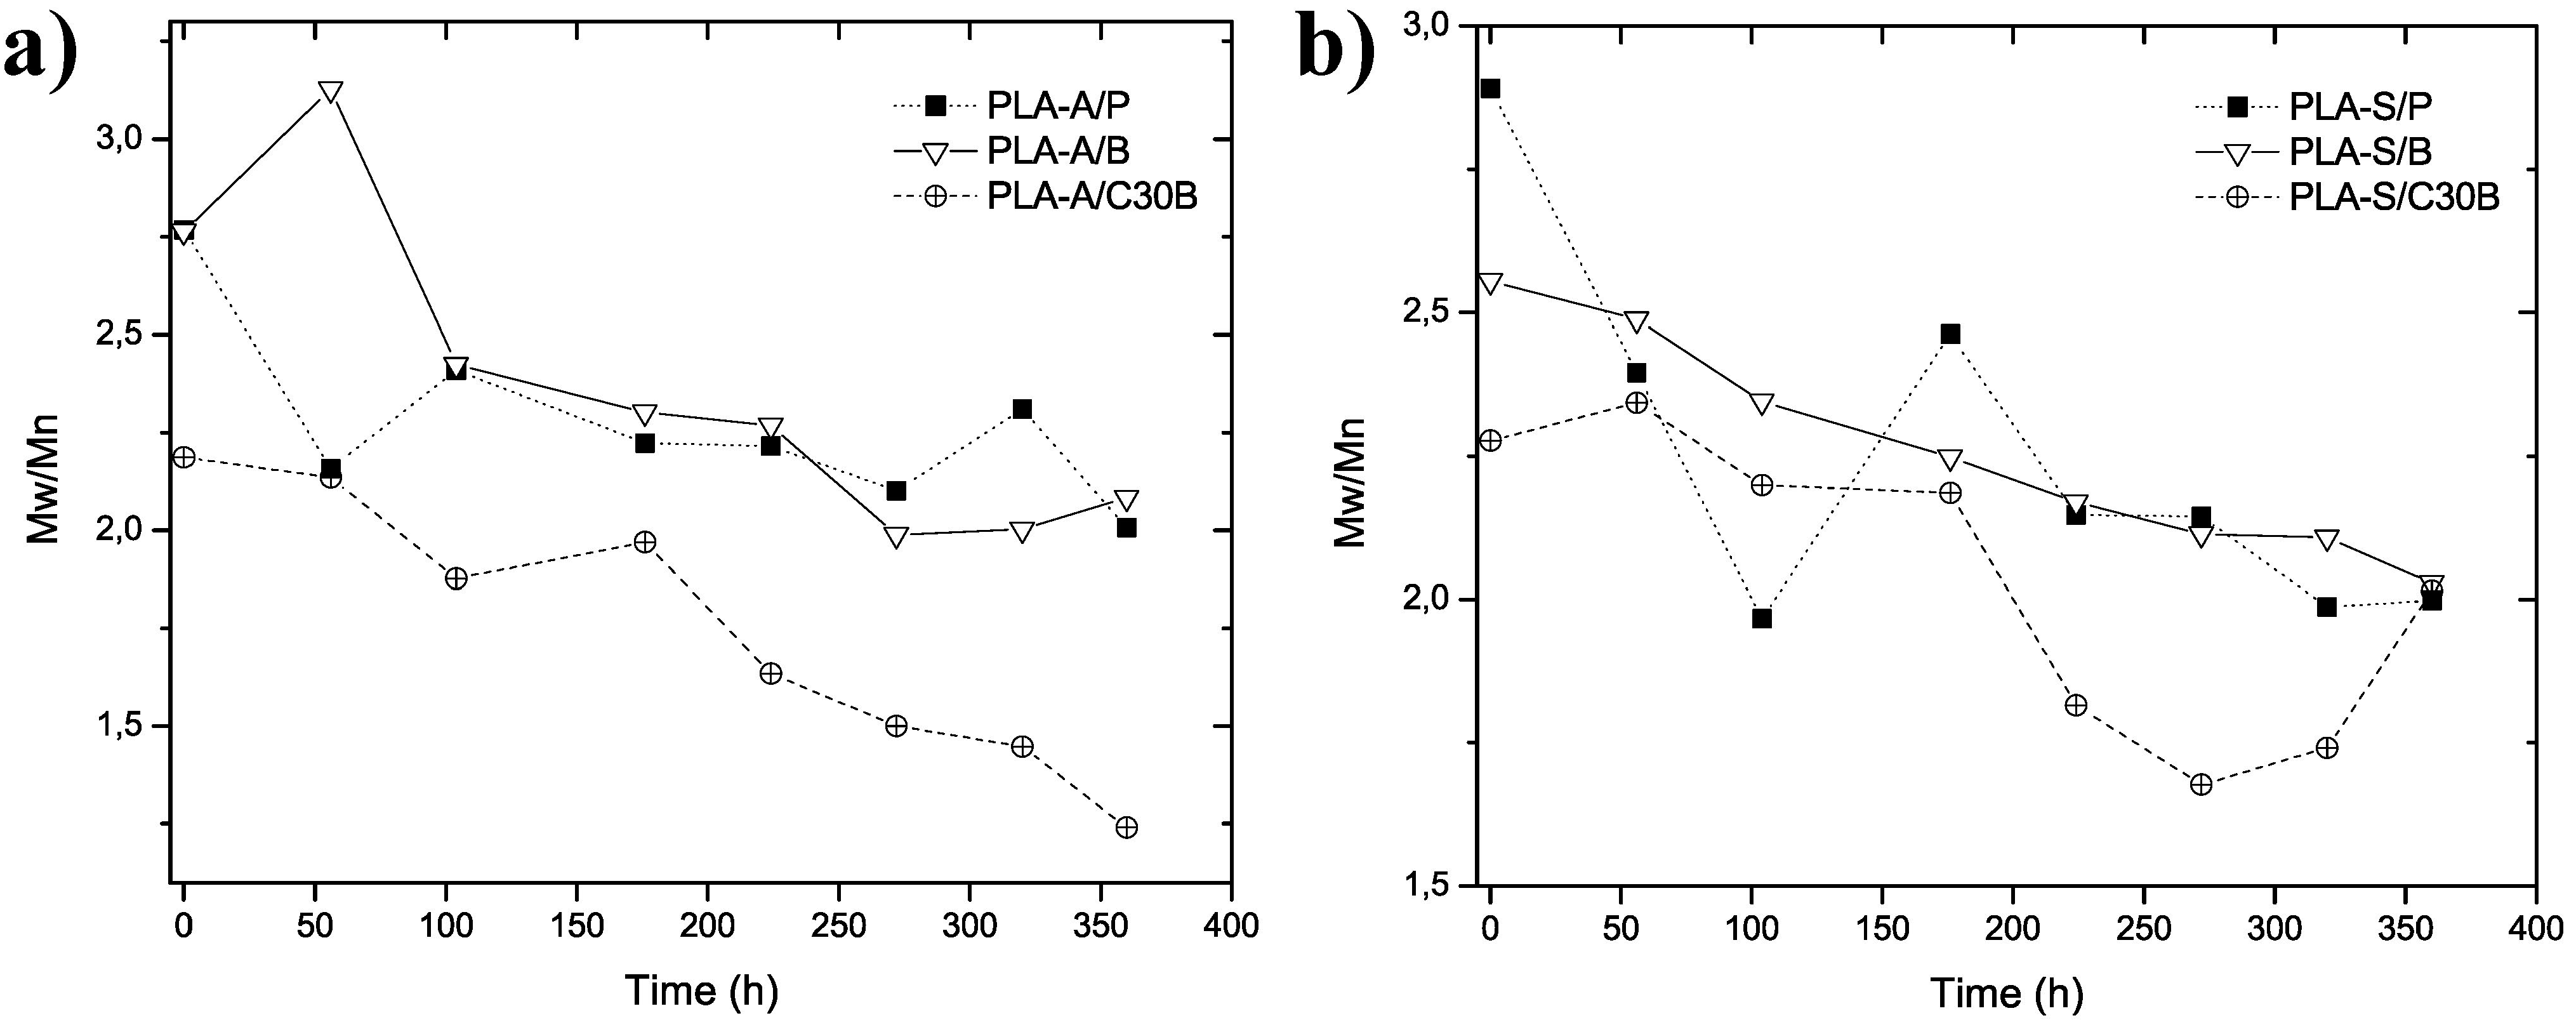
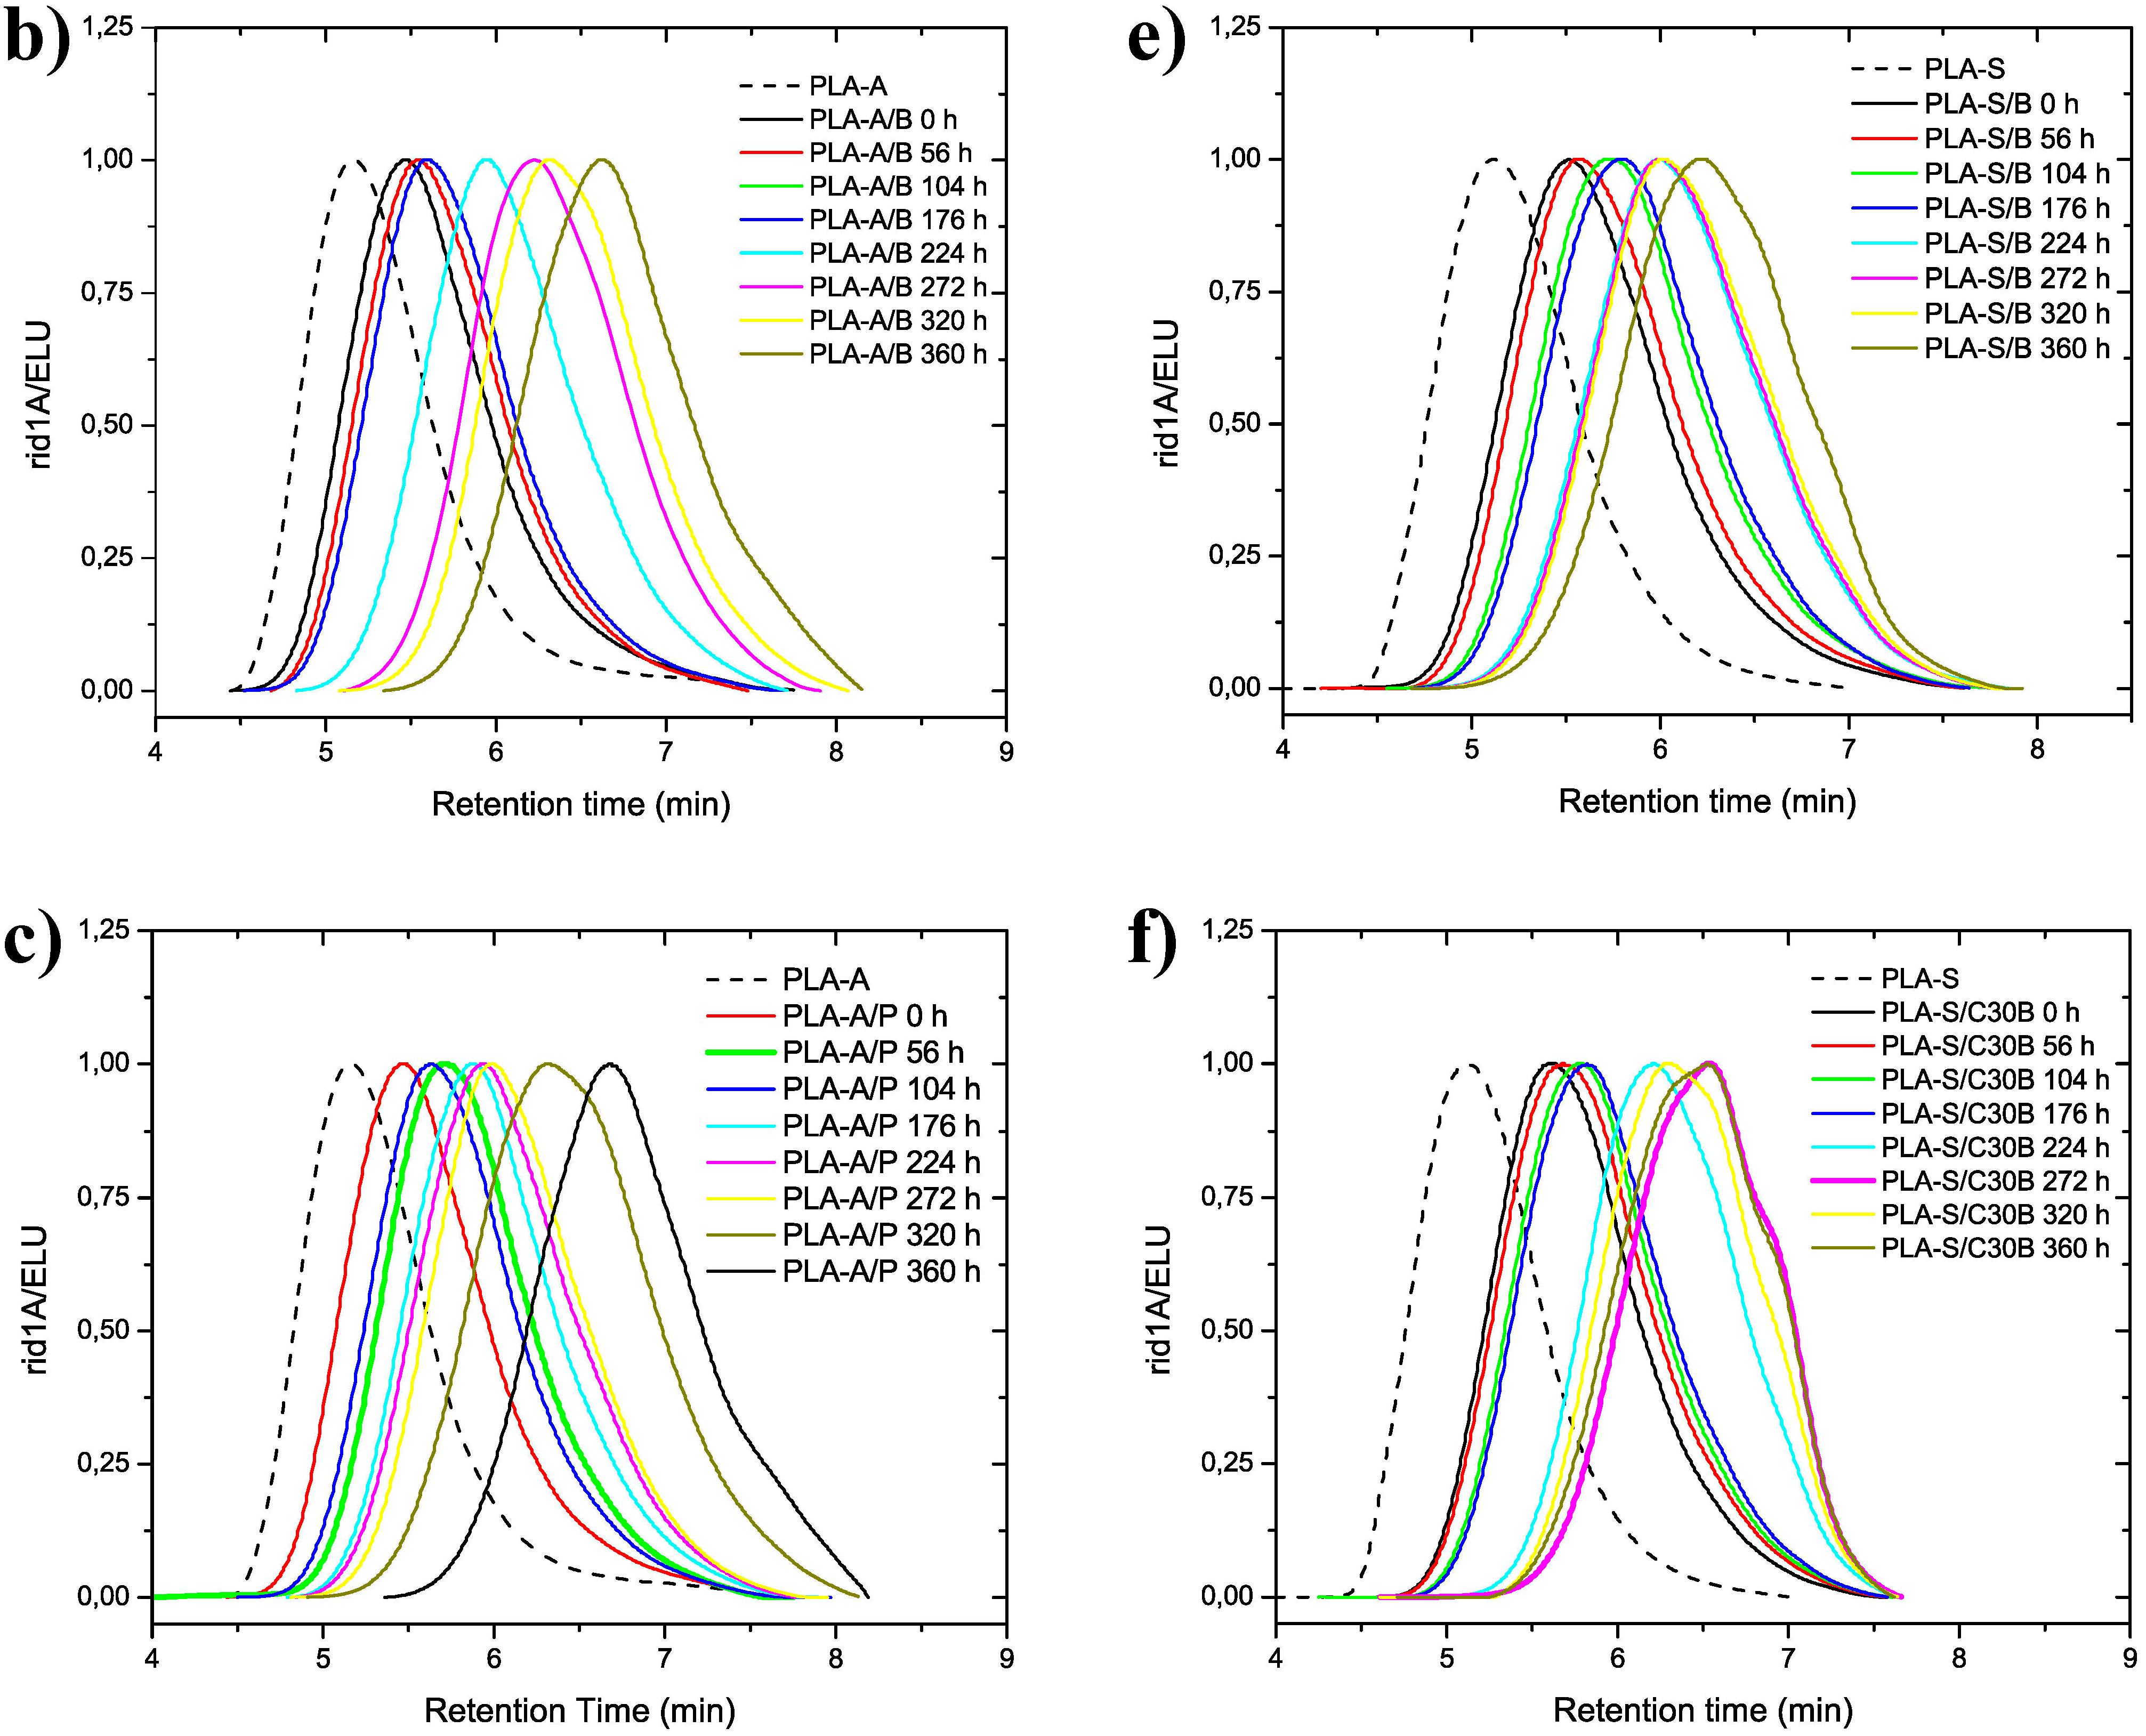
3.2. Molecular Weight Distribution after Artificial Weathering
| Sample | Exposure time (h) | Mn (kg·mol−1) | Mw (kg·mol−1) | Mw/Mn | Sample | Exposure time (h) | Mn (kg·mol−1) | Mw (kg·mol−1) | Mw/Mn |
|---|---|---|---|---|---|---|---|---|---|
| PLA-A/Neat | - | 81.4 | 270.0 | 3.32 | PLA-S/Neat | - | 136.0 | 329.0 | 2.42 |
| PLA-A/P | 0 | 57.0 | 157.8 | 2.77 | PLA-S/P | 0 | 77.0 | 222.7 | 2.90 |
| 56 | 37.5 | 81.0 | 2.16 | 56 | 44.1 | 106.0 | 2.40 | ||
| 104 | 39.8 | 96.0 | 2.41 | 104 | 41.2 | 80.9 | 1.97 | ||
| 176 | 26.8 | 59.7 | 2.22 | 176 | 37.5 | 92.3 | 2.46 | ||
| 224 | 23.5 | 52.2 | 2.22 | 224 | 22.1 | 47.4 | 2.15 | ||
| 272 | 21.3 | 44.7 | 2.10 | 272 | 23.8 | 51.1 | 2.14 | ||
| 320 | 11.3 | 26.1 | 2.31 | 320 | 17.7 | 35.2 | 1.99 | ||
| 360 | 6.73 | 13.5 | 2.01 | 360 | 16.9 | 33.7 | 2.00 | ||
| PLA-A/B | 0 | 50.3 | 139.0 | 2.76 | PLA-S/B | 0 | 49.0 | 125.0 | 2.55 |
| 56 | 48.0 | 150.0 | 2.40 | 56 | 42.9 | 107.0 | 2.49 | ||
| 104 | 42.1 | 102.0 | 2.42 | 104 | 34.6 | 81.1 | 2.35 | ||
| 176 | 26.3 | 60.5 | 2.30 | 176 | 33.1 | 74.3 | 2.25 | ||
| 224 | 22.4 | 50.8 | 2.27 | 224 | 21.6 | 47.0 | 2.17 | ||
| 272 | 14.7 | 29.3 | 1.99 | 272 | 21.3 | 45.1 | 2.11 | ||
| 320 | 11.8 | 23.6 | 2.00 | 320 | 20.4 | 43.1 | 2.11 | ||
| 360 | 7.58 | 15.8 | 1.99 | 360 | 16.4 | 33.3 | 2.03 | ||
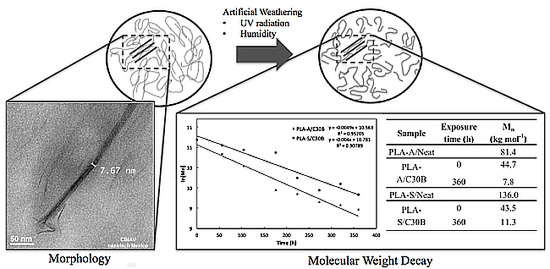
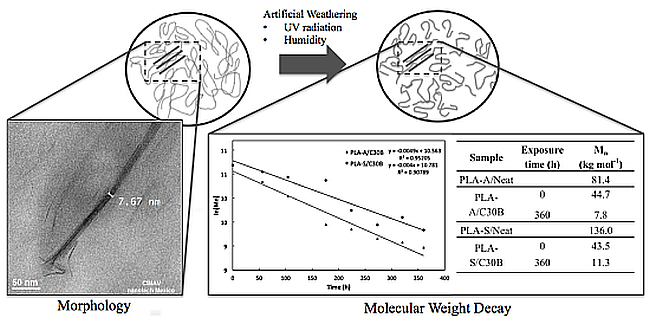
| PLA-A/C30B | 0 | 44.7 | 97.7 | 2.19 | PLA-S/C30B | 0 | 43.5 | 99.0 | 2.28 |
| 56 | 30.9 | 65.9 | 2.14 | 56 | 38.1 | 89.2 | 2.34 | ||
| 104 | 23.0 | 43.2 | 1.88 | 104 | 34.0 | 74.8 | 2.20 | ||
| 176 | 12.7 | 25.0 | 1.97 | 176 | 31.9 | 69.7 | 2.19 | ||
| 224 | 11.5 | 18.9 | 1.64 | 224 | 17.1 | 31.0 | 1.82 | ||
| 273 | 9.4 | 14.2 | 1.51 | 273 | 12.6 | 21.1 | 1.68 | ||
| 320 | 8.7 | 12.7 | 1.45 | 320 | 14.7 | 25.6 | 1.74 | ||
| 360 | 7.8 | 9.7 | 1.24 | 360 | 11.3 | 22.8 | 1.73 |

| Sample | Exposure time (h) | % Mn Degradation | % Mw Degradation | Sample | Exposure time (h) | % Mn Degradation | % Mw Degradation |
|---|---|---|---|---|---|---|---|
| PLA-A/P | 0 | - | - | PLA-S/P | 0 | - | - |
| 56 | 34 | 49 | 56 | 43 | 53 | ||
| 104 | 30 | 39 | 104 | 47 | 64 | ||
| 176 | 53 | 62 | 176 | 51 | 59 | ||
| 224 | 59 | 67 | 224 | 71 | 79 | ||
| 272 | 63 | 72 | 272 | 69 | 77 | ||
| 320 | 80 | 83 | 320 | 77 | 84 | ||
| 360 | 88 | 91 | 360 | 78 | 85 | ||
| PLA-A/B | 0 | - | - | PLA-S/B | 0 | - | - |
| 56 | 5 | -8 | 56 | 12 | 15 | ||
| 104 | 16 | 27 | 104 | 30 | 35 | ||
| 176 | 48 | 56 | 176 | 33 | 41 | ||
| 224 | 55 | 63 | 224 | 56 | 63 | ||
| 272 | 71 | 79 | 272 | 56 | 64 | ||
| 320 | 77 | 83 | 320 | 58 | 66 | ||
| 360 | 85 | 89 | 360 | 67 | 73 | ||
| PLA-A/C30B | 0 | - | - | PLA-S/C30B | 0 | - | - |
| 56 | 31 | 33 | 56 | 13 | 10 | ||
| 104 | 48 | 56 | 104 | 22 | 24 | ||
| 176 | 72 | 74 | 176 | 27 | 30 | ||
| 224 | 74 | 81 | 224 | 61 | 69 | ||
| 273 | 79 | 85 | 273 | 71 | 79 | ||
| 320 | 80 | 87 | 320 | 66 | 74 | ||
| 360 | 82 | 90 | 360 | 74 | 77 |


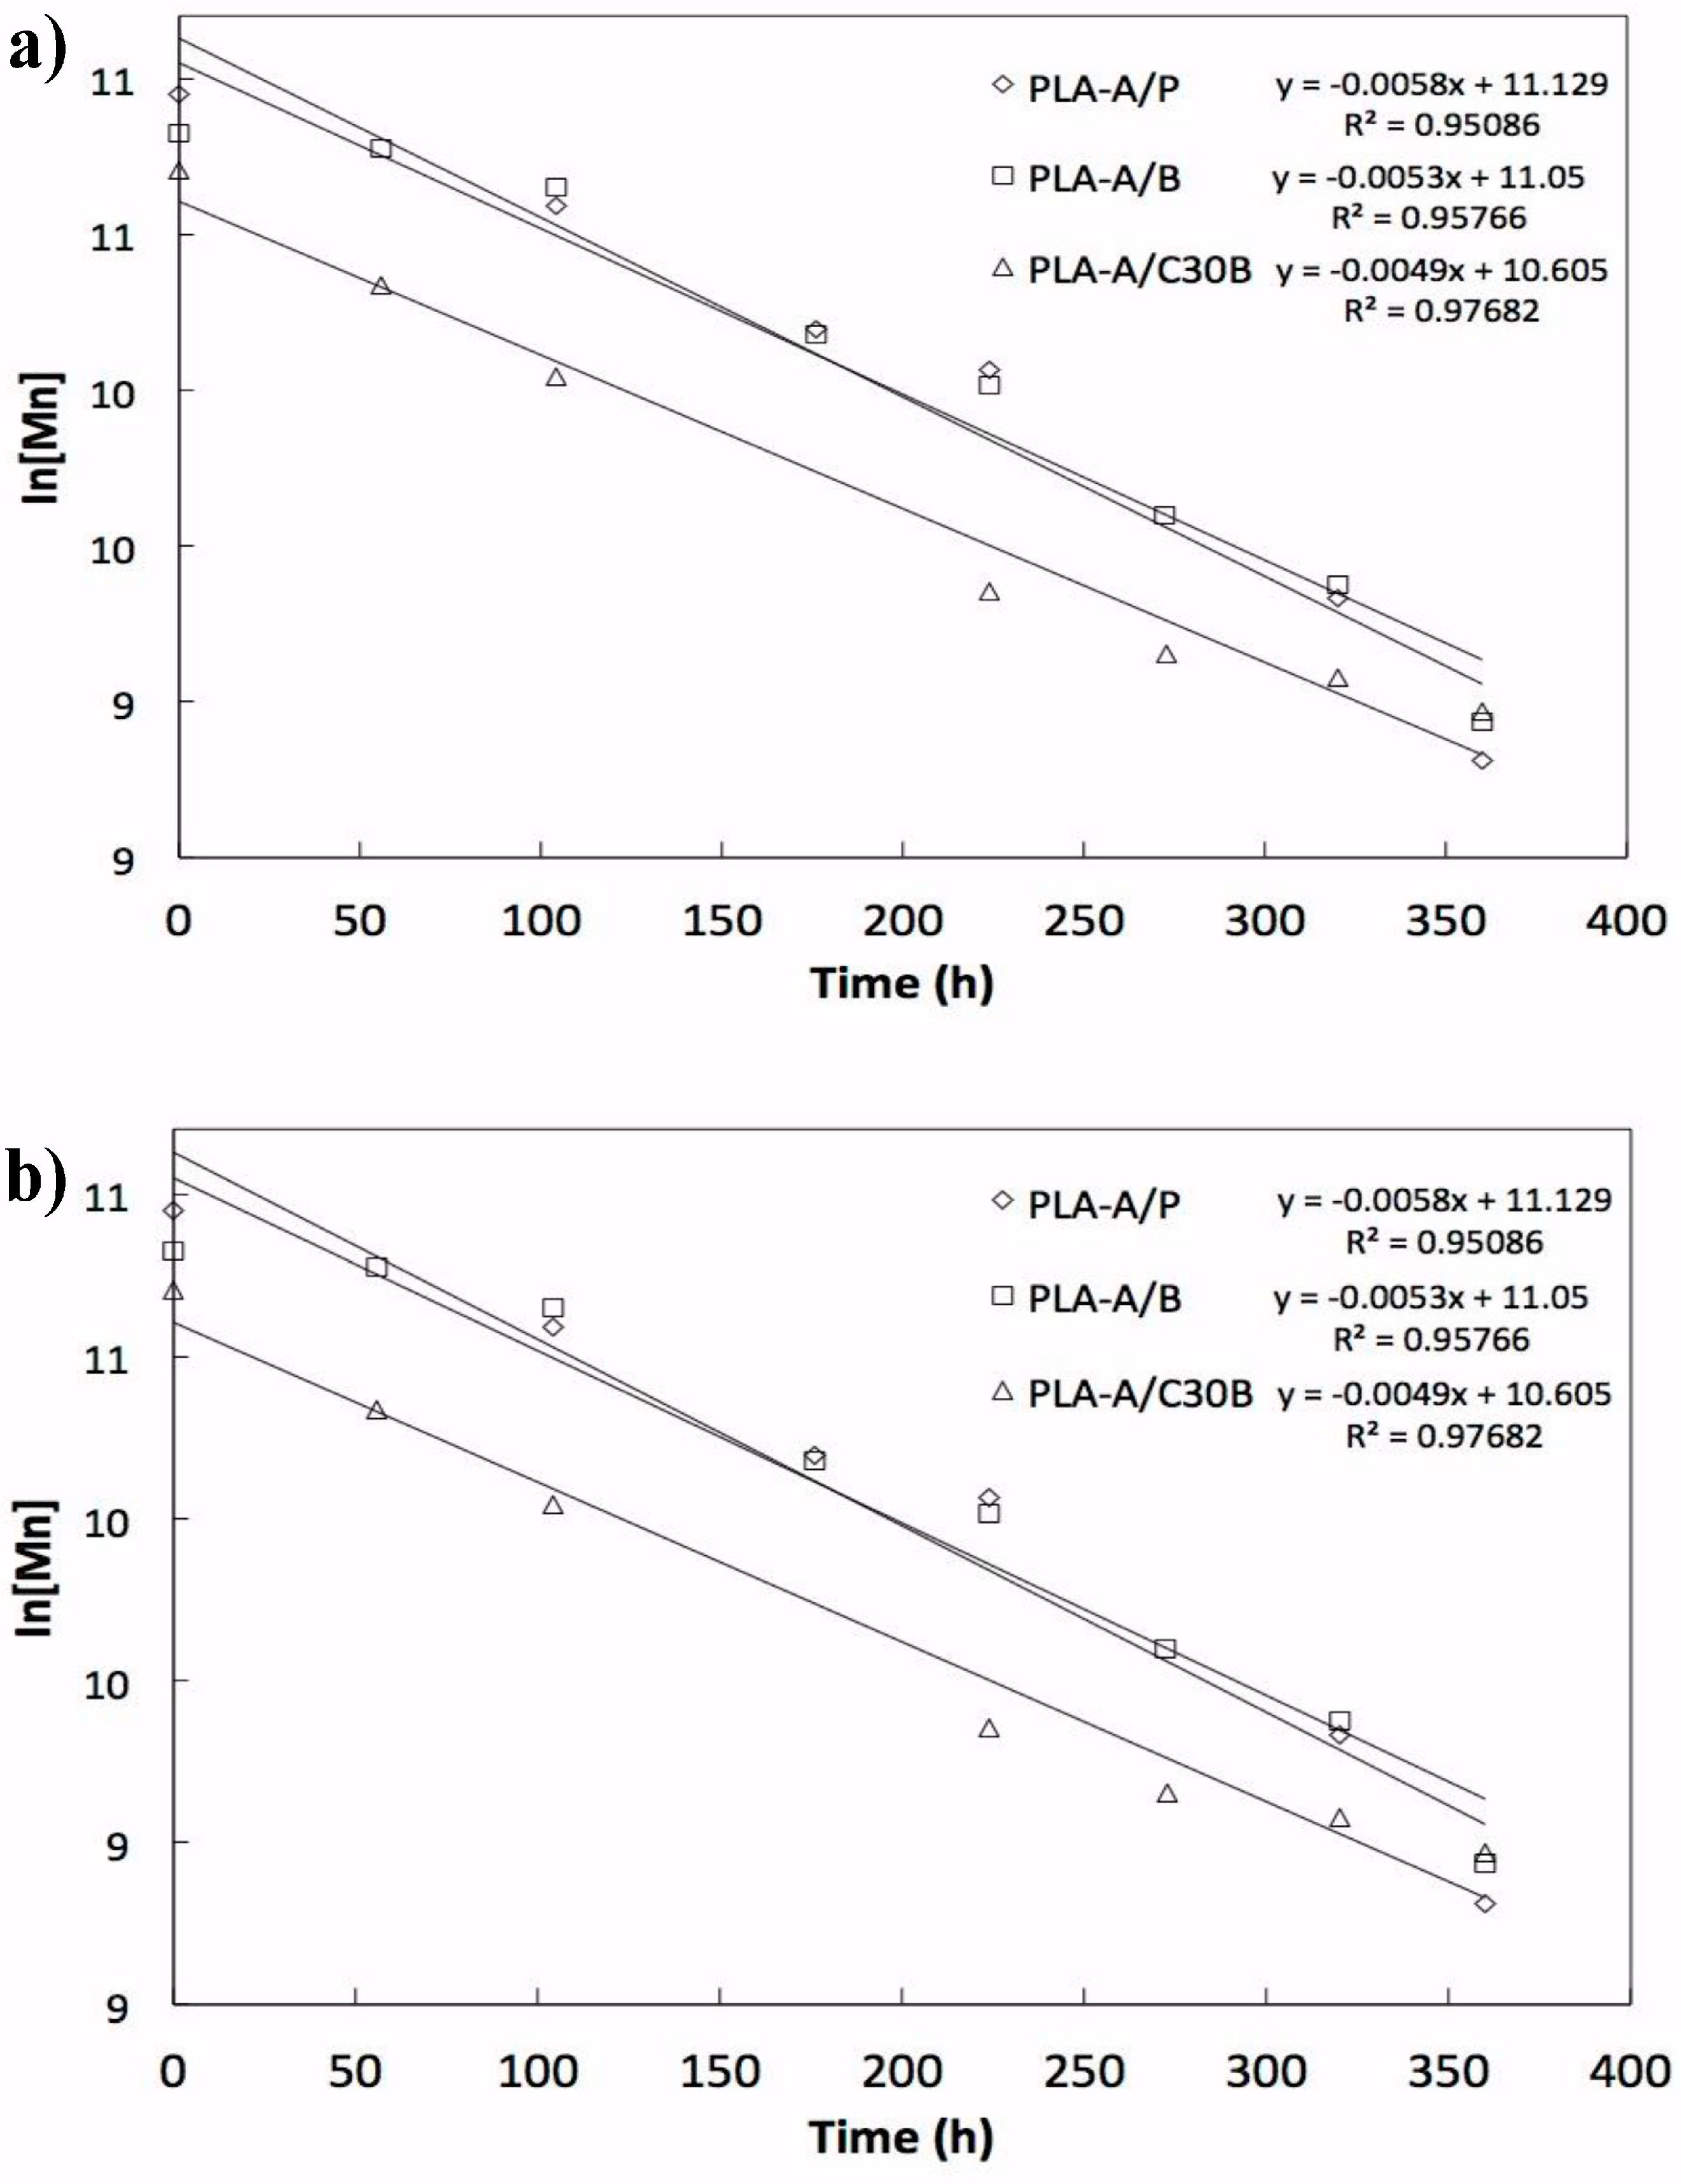
4. Number Average Molecular Weight Decay Due to Artificial Weathering
Correlation of Artificial Weathering with Natural Conditions
| Exposure time in artificial weathering (h) | Exposure time to UV (h) | Natural weathering (days) |
|---|---|---|
| 56 | 37.33 | 10 |
| 104 | 69.33 | 19 |
| 176 | 117.33 | 33 |
| 224 | 149.33 | 42 |
| 272 | 181.33 | 51 |
| 320 | 213.33 | 60 |
| 360 | 240.00 | 68 |
5. Conclusions
Acknowledgments
Author Contributions
Conflicts of Interest
References
- Tsuji, H.; Echizen, Y.; Nishimura, Y. Photodegradation of biodegradable polyesters: A comprehensive study on poly(l-lactide) and poly(ε-caprolactone). Polym. Degrad. Stab. 2006, 91, 1128–1137. [Google Scholar] [CrossRef]
- Corti, A.; Solaro, R.; Chiellini, E. Biodegradation of poly(vinyl alcohol) in selected mixed microbial culture and relevant culture filtrate. Polym. Degrad. Stab. 2002, 75, 447–458. [Google Scholar] [CrossRef]
- Han, X.; Pan, J. Polymer chain scission, oligomer production. Acta Biomater. 2011, 7, 538–547. [Google Scholar] [CrossRef]
- Nieddu, E.; Mazzucco, L.; Gentile, P.; Benko, T.; Balbo, V.; Mandrile, R.; Ciardelli, G. Preparation and biodegradation of clay composites of PLA. React. Funct. Polym. 2009, 69, 371–379. [Google Scholar] [CrossRef]
- Lee, T.; Rasak, A.; Wan, A. Polylactid Acid Handbook, 1st ed.; Elsevier: New York, NY, USA, 2013. [Google Scholar]
- Ho, C.; Wang, C.; Lin, C.; Lee, Y. Synthesis and characterization of TPO–PLA copolymer and its behavior as compatibilizer for PLA/TPO blends. J. Polym. 2008, 49, 3902–3910. [Google Scholar] [CrossRef]
- Conn, R.; Kolstad, J.; Borzelleca, J.; Dixler, D.; Filer, L., Jr.; LaDu, B.; Pariza, M. Safety assessment of polylactide (PLA) for use as a food-contact polymer. Food Chem Toxic. 1996, 4, 273–283. [Google Scholar]
- Duncan, T. Applications of nanotechnology in food packaging and food safety: Barrier materials, antimicrobials and sensors. J. Colloid Interface Sci. 2011, 363, 1–24. [Google Scholar] [CrossRef]
- Mróz, P.; Białas, S.; Mucha, M.; Kaczmarek, H. Thermogravimetric and DSC testing of poly (lactic acid) nanocomposites. Thermochim. Acta 2013, 573, 186–192. [Google Scholar] [CrossRef]
- Luo, Z.; Koo, J. Quantification of the layer dispersion degree in polymer layered silicate nanocomposites by transmission electron microscopy. J. Polym. 2008, 49, 1841–1852. [Google Scholar] [CrossRef]
- Prasun, K.; Hakkarainen, M.; Albertsson, A. Nanoclay effects on the degradation process and product patterns of polylactide. Polym. Degrad. Stab. 2012, 97, 1254–1260. [Google Scholar] [CrossRef]
- Raquez, J.; Habibi, Y.; Murariu, M.; Dubois, P. Polylactide (PLA)-based nanocomposites. Progress Polym. Sci. 2013, 38, 1504–1542. [Google Scholar] [CrossRef]
- Najafi, N.; Heuzey, M.; Carreau, P. Polylactide (PLA)-clay nanocomposites prepared by melt compounding in the presence of a chain extender. Compos. Sci. Technol. 2011, 72, 608–615. [Google Scholar] [CrossRef]
- Lucas, N.; Bienaime, C.; Belloy, C.; Queneudec, M.; Silvestre, F.; Nava, J. Polymer biodegradation: Mechanisms and estimation techniques. Chemosphere 2008, 73, 429–442. [Google Scholar] [CrossRef]
- Zaidi, L.; Kaci, M.; Bruzaud, S.; Bourmaud, A.; Grohens, Y. Effect of natural weather on the structure and properties of polylactide/Cloisite 30B nanocomposites. Polym. Degrad. Stab. 2010, 95, 1751–1758. [Google Scholar] [CrossRef]
- Sotirios, I.; Zuburtikudis, I. Structure and thermal behavior of poly(l-lactic acid) clay nanocomposites: Effect of preparation method as a function of the nanofiller modification level. J. Appl. Polym. Sci. 2011. [Google Scholar] [CrossRef]
- Picard, E. Effect of an organo-modified montmorillonite on PLA crystallization and gas barrier properties. Appl. Clay Sci. 2011, 53, 58–65. [Google Scholar] [CrossRef]
- Paul, M.; Delcourt, C.; Alexandre, M.; Degee, P.; Monteverde, F.; Dubois, P. Polylactide/montmorillonite nanocomposites: Study of the hydrolytic degradation. Polym. Degrad. Stab. 2005, 87, 535–542. [Google Scholar] [CrossRef]
- Perrin, F.; Ton, M.; Bureau, M.; Denault, J. Micro- and nano-structure in polypropylene/clay nanocomposites. Polymer 2005, 46, 11624–11634. [Google Scholar] [CrossRef]
- Mclauchlin, A.; Thomas, N. Preparation and thermal characterization of poly(lactic acid) nanocomposites prepared from organoclays based on an amphoteric surfactant. Polym. Degrad. Stab. 2009, 94, 868–872. [Google Scholar] [CrossRef]
- Lee, S.; Chen, H.; Milford, A. Preparation and characterization of tapioca starch–poly(lactic acid) nanocomposite foams by melt intercalation based on clay type. Ind. Crops Product. 2008, 28, 95–106. [Google Scholar] [CrossRef]
- Herrera, J.; Marand, E.; Little, J.; Cox, S. Polymer/clay nanocomposites as VOC barrier materials and coatings. Polymer 2009, 50, 5744–5748. [Google Scholar] [CrossRef]
- Degee, P.; Dubois, P.; Jerome, R. Bulk polymerization of lactides initiated by aluminium isopropoxide. Macromol. Chem. Phys. 1997, 198, 1985–1995. [Google Scholar] [CrossRef]
- Sakai, W.; Kinoshita, M.; Nagata, M.; Tsutsumi, N. ESR studies of photosensitized degradation of poly(l-lactic acid) via photoionization of dopant. J. Polym. Sci. A Polym. Chem. 2001, 39, 706–714. [Google Scholar]
- Yasuda, N.; Wang, Y.; Tsukegi, T.; Shirai, T.; Nishida, H. Quantitative evaluation of photodegradation and racemization of poly(l-lactic acid) under UV-C irradiation. Polym. Degrad. Stab. 2010, 95, 1238–1243. [Google Scholar] [CrossRef]
- Santonja, L.; Ribes, A.; Alamo, R. Comparative thermal, biological and photodegradation kinetics of polylactide and effect on crystallization rates. Polym. Degrad. Stab. 2013, 98, 771–784. [Google Scholar] [CrossRef]
- Kumnayaka, T.; Parthasarathay, R.; Jollands, M.; Ivanov, I. Molecular weight changes during photo-oxidation of polyethylene nanocomposites. Korea Aust. Rheol. J. 2010, 22, 173–177. [Google Scholar]
- Araujo, A.; Oliveira, M.; Oliveira, R.; Botelho, G.; Machado, A. Biodegradation assessment of PLA and its nanocomposites. Environ. Sci. Pollut. Res. 2014, 21, 9477–9486. [Google Scholar] [CrossRef]
© 2015 by the authors; licensee MDPI, Basel, Switzerland. This article is an open access article distributed under the terms and conditions of the Creative Commons Attribution license (http://creativecommons.org/licenses/by/4.0/).
Share and Cite
Chávez-Montes, W.M.; González-Sánchez, G.; López-Martínez, E.I.; De Lira-Gómez, P.; Ballinas-Casarrubias, L.; Flores-Gallardo, S. Effect of Artificial Weathering on PLA/Nanocomposite Molecular Weight Distribution. Polymers 2015, 7, 760-776. https://doi.org/10.3390/polym7040760
Chávez-Montes WM, González-Sánchez G, López-Martínez EI, De Lira-Gómez P, Ballinas-Casarrubias L, Flores-Gallardo S. Effect of Artificial Weathering on PLA/Nanocomposite Molecular Weight Distribution. Polymers. 2015; 7(4):760-776. https://doi.org/10.3390/polym7040760
Chicago/Turabian StyleChávez-Montes, Wendy Margarita, Guillermo González-Sánchez, Erika Ivonne López-Martínez, Patricia De Lira-Gómez, Lourdes Ballinas-Casarrubias, and Sergio Flores-Gallardo. 2015. "Effect of Artificial Weathering on PLA/Nanocomposite Molecular Weight Distribution" Polymers 7, no. 4: 760-776. https://doi.org/10.3390/polym7040760
APA StyleChávez-Montes, W. M., González-Sánchez, G., López-Martínez, E. I., De Lira-Gómez, P., Ballinas-Casarrubias, L., & Flores-Gallardo, S. (2015). Effect of Artificial Weathering on PLA/Nanocomposite Molecular Weight Distribution. Polymers, 7(4), 760-776. https://doi.org/10.3390/polym7040760