Modified Weibull Distribution for Analyzing the Tensile Strength of Bamboo Fibers


Abstract
:
1. Introduction
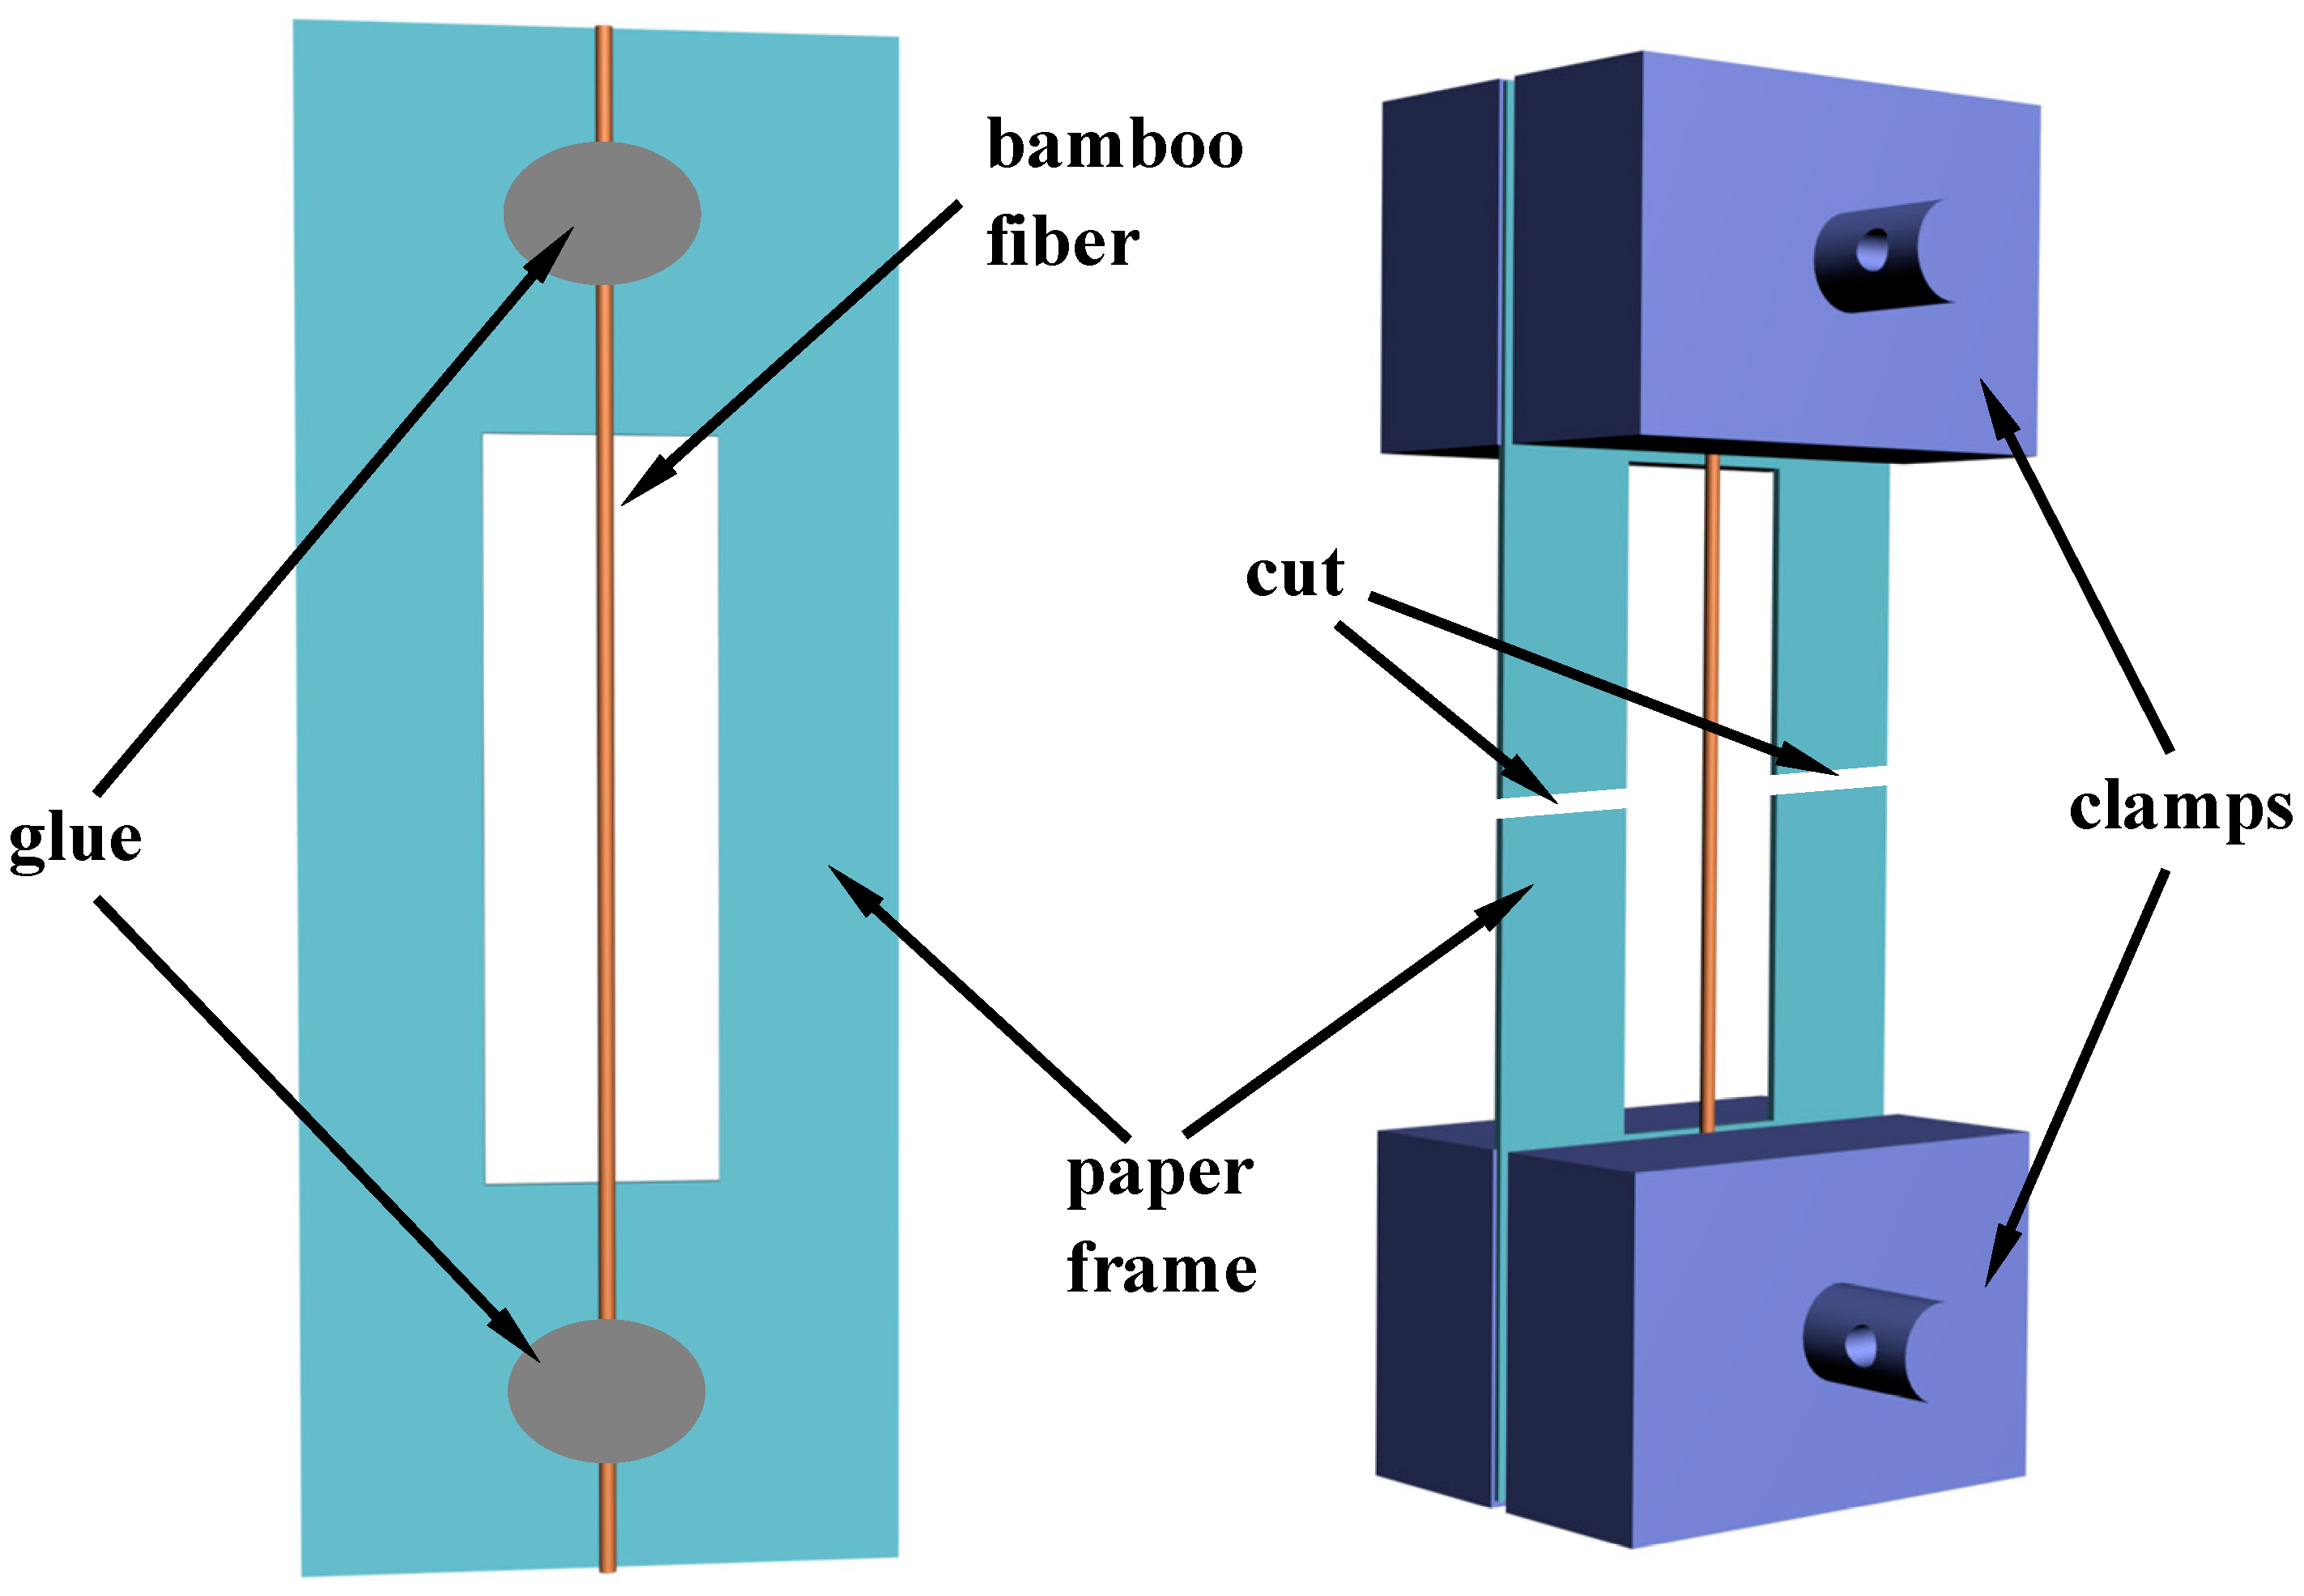
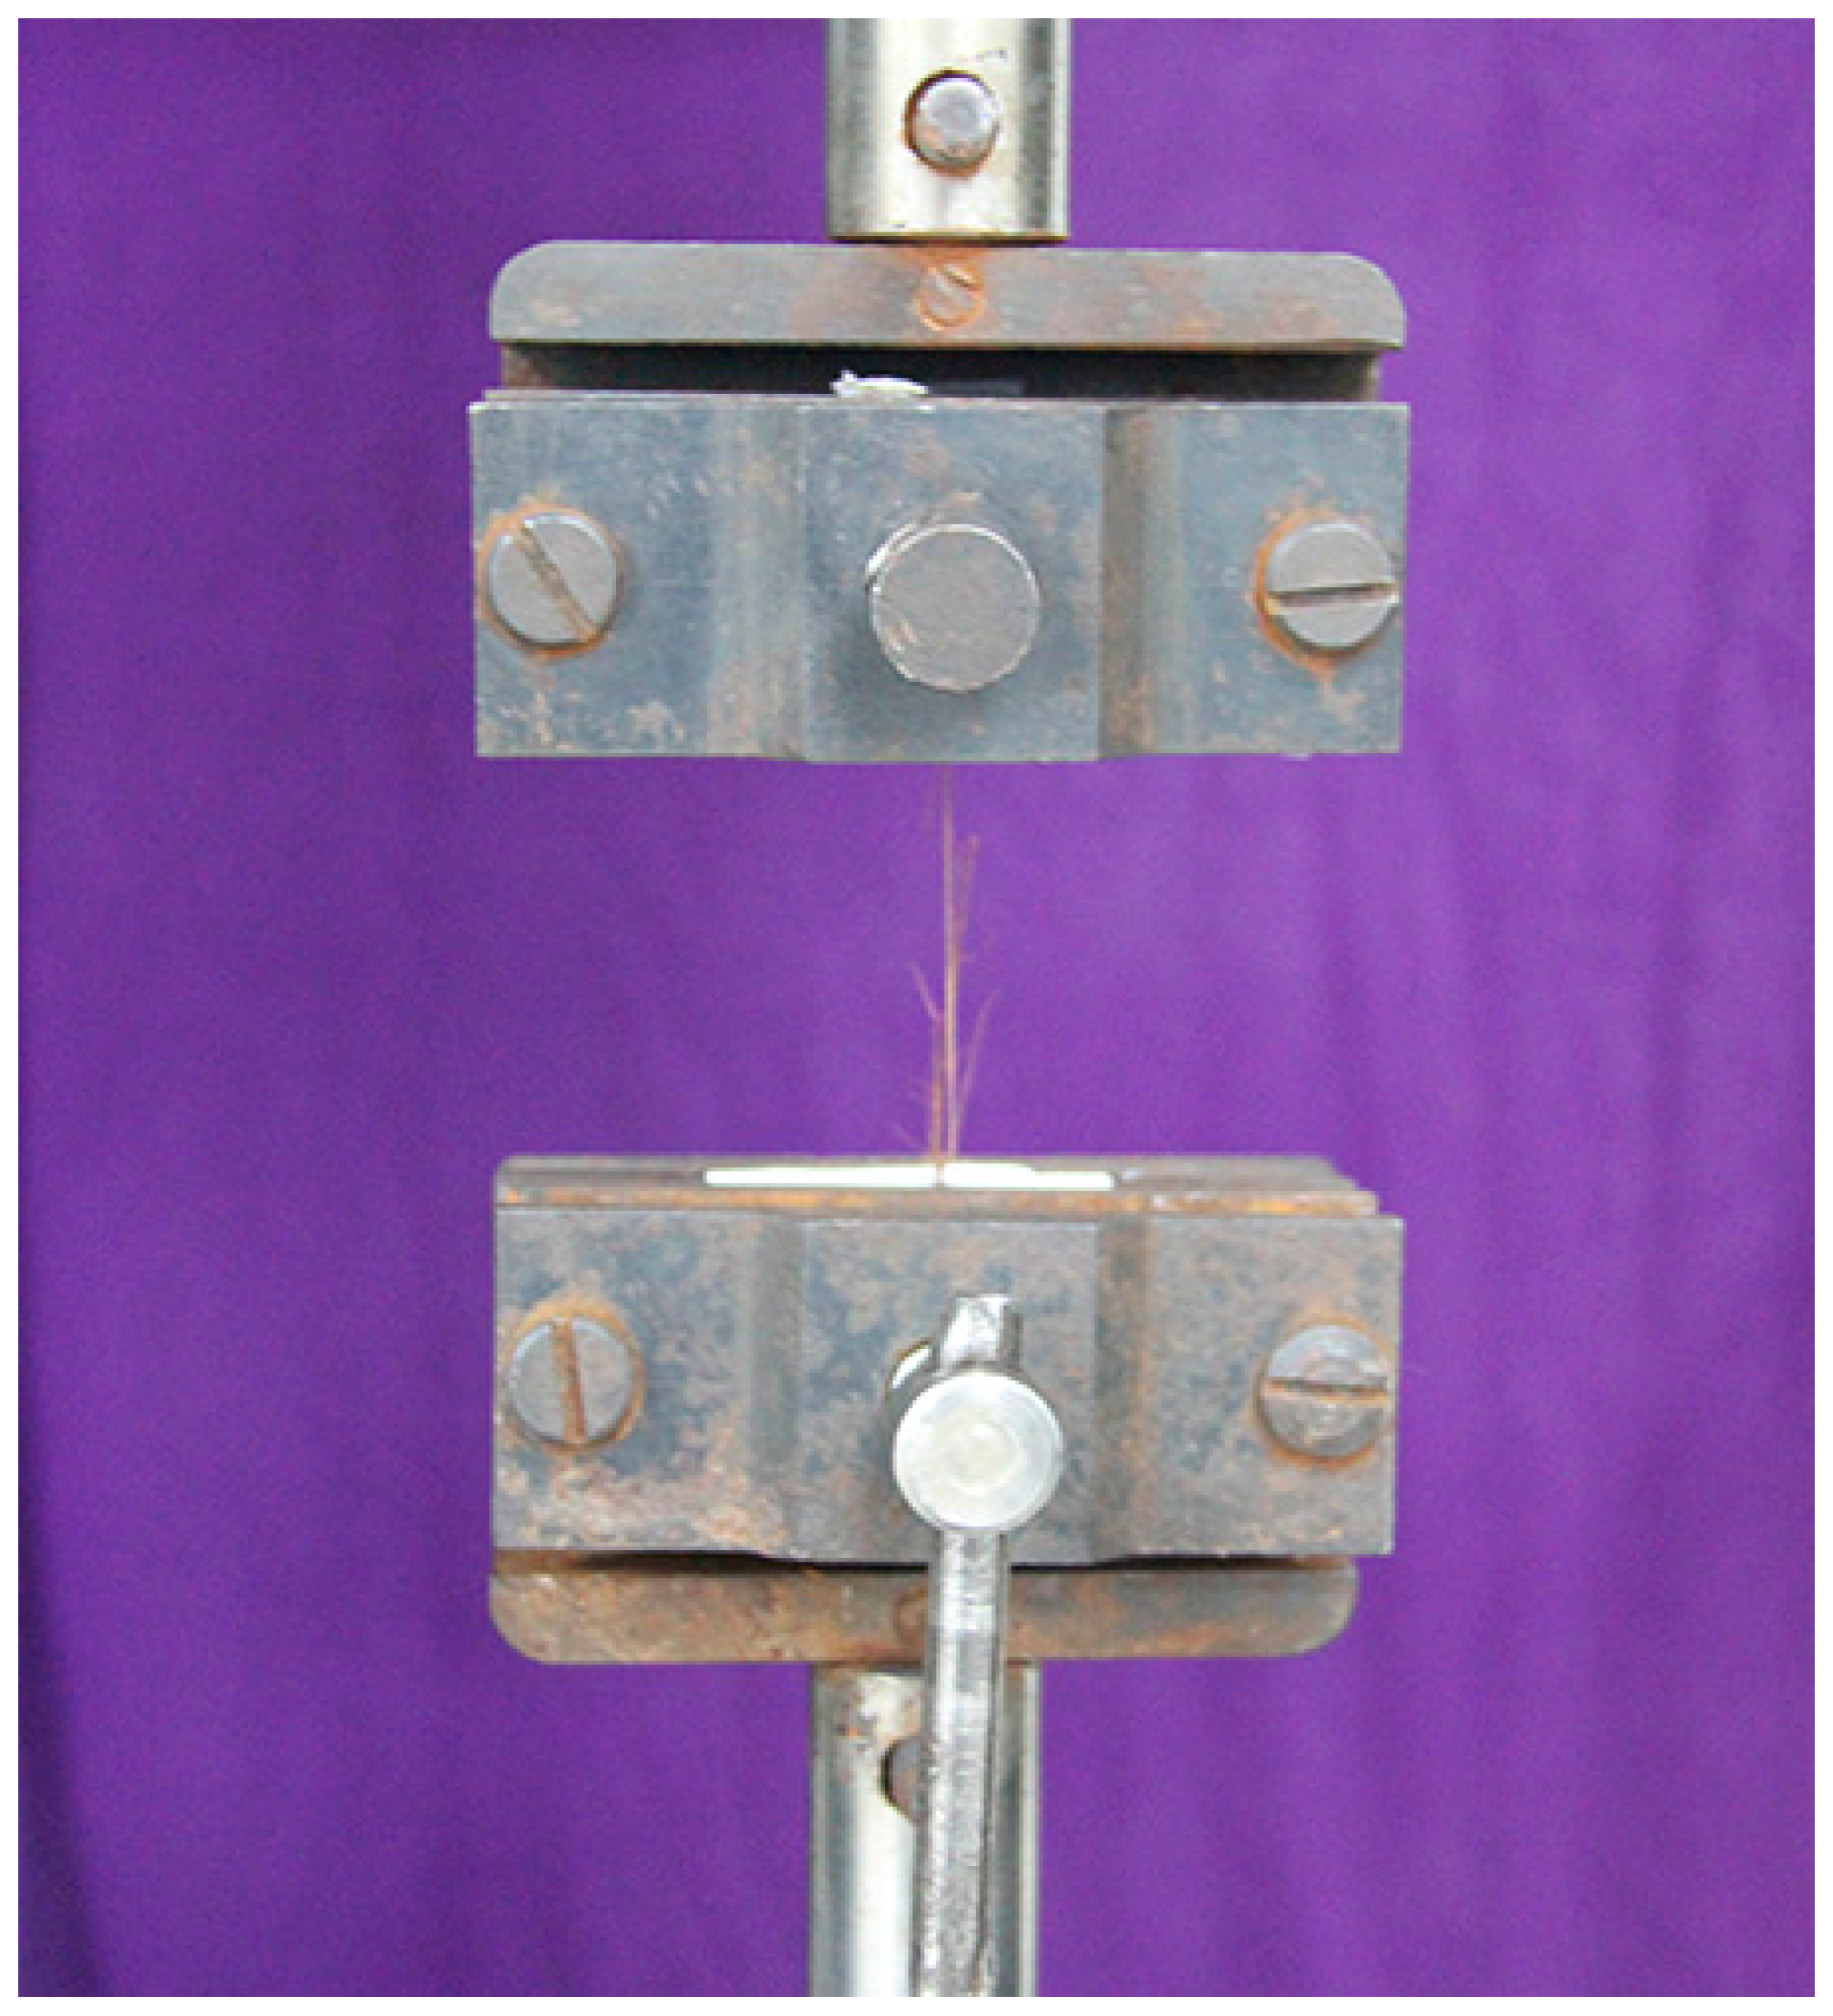
2. Experimental Procedure

3. Statistical Modeling
4. Results and Discussion
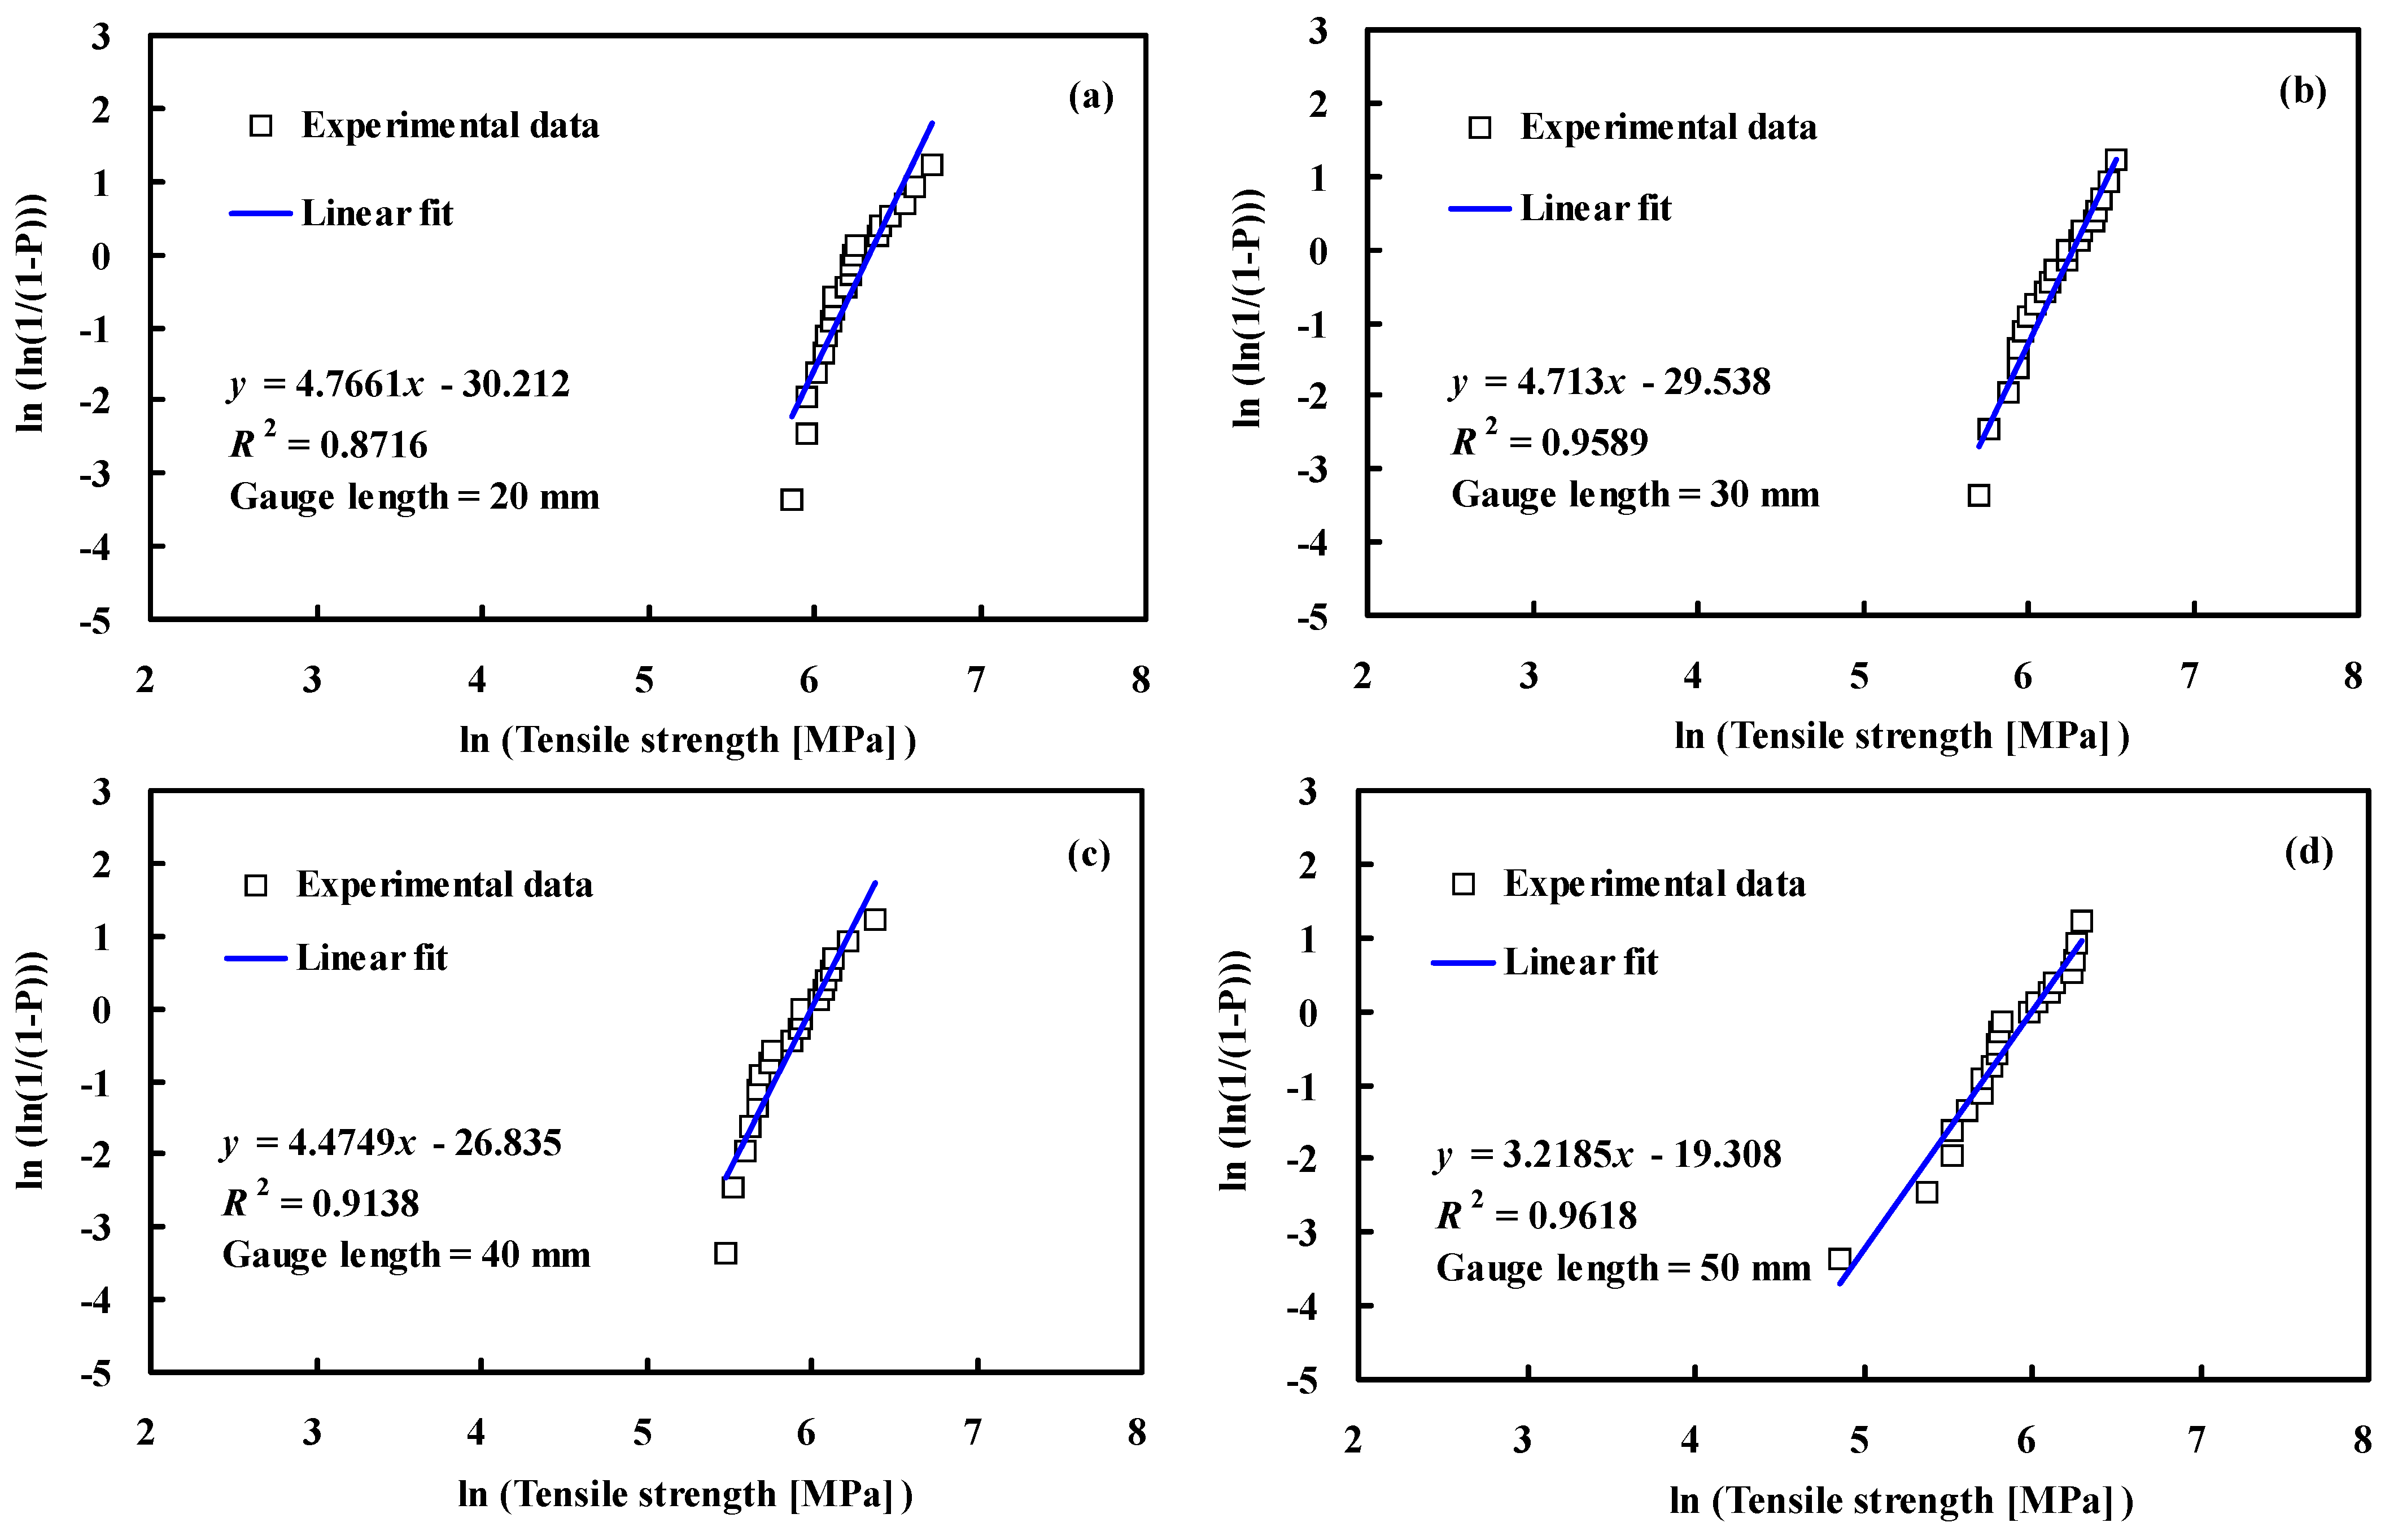
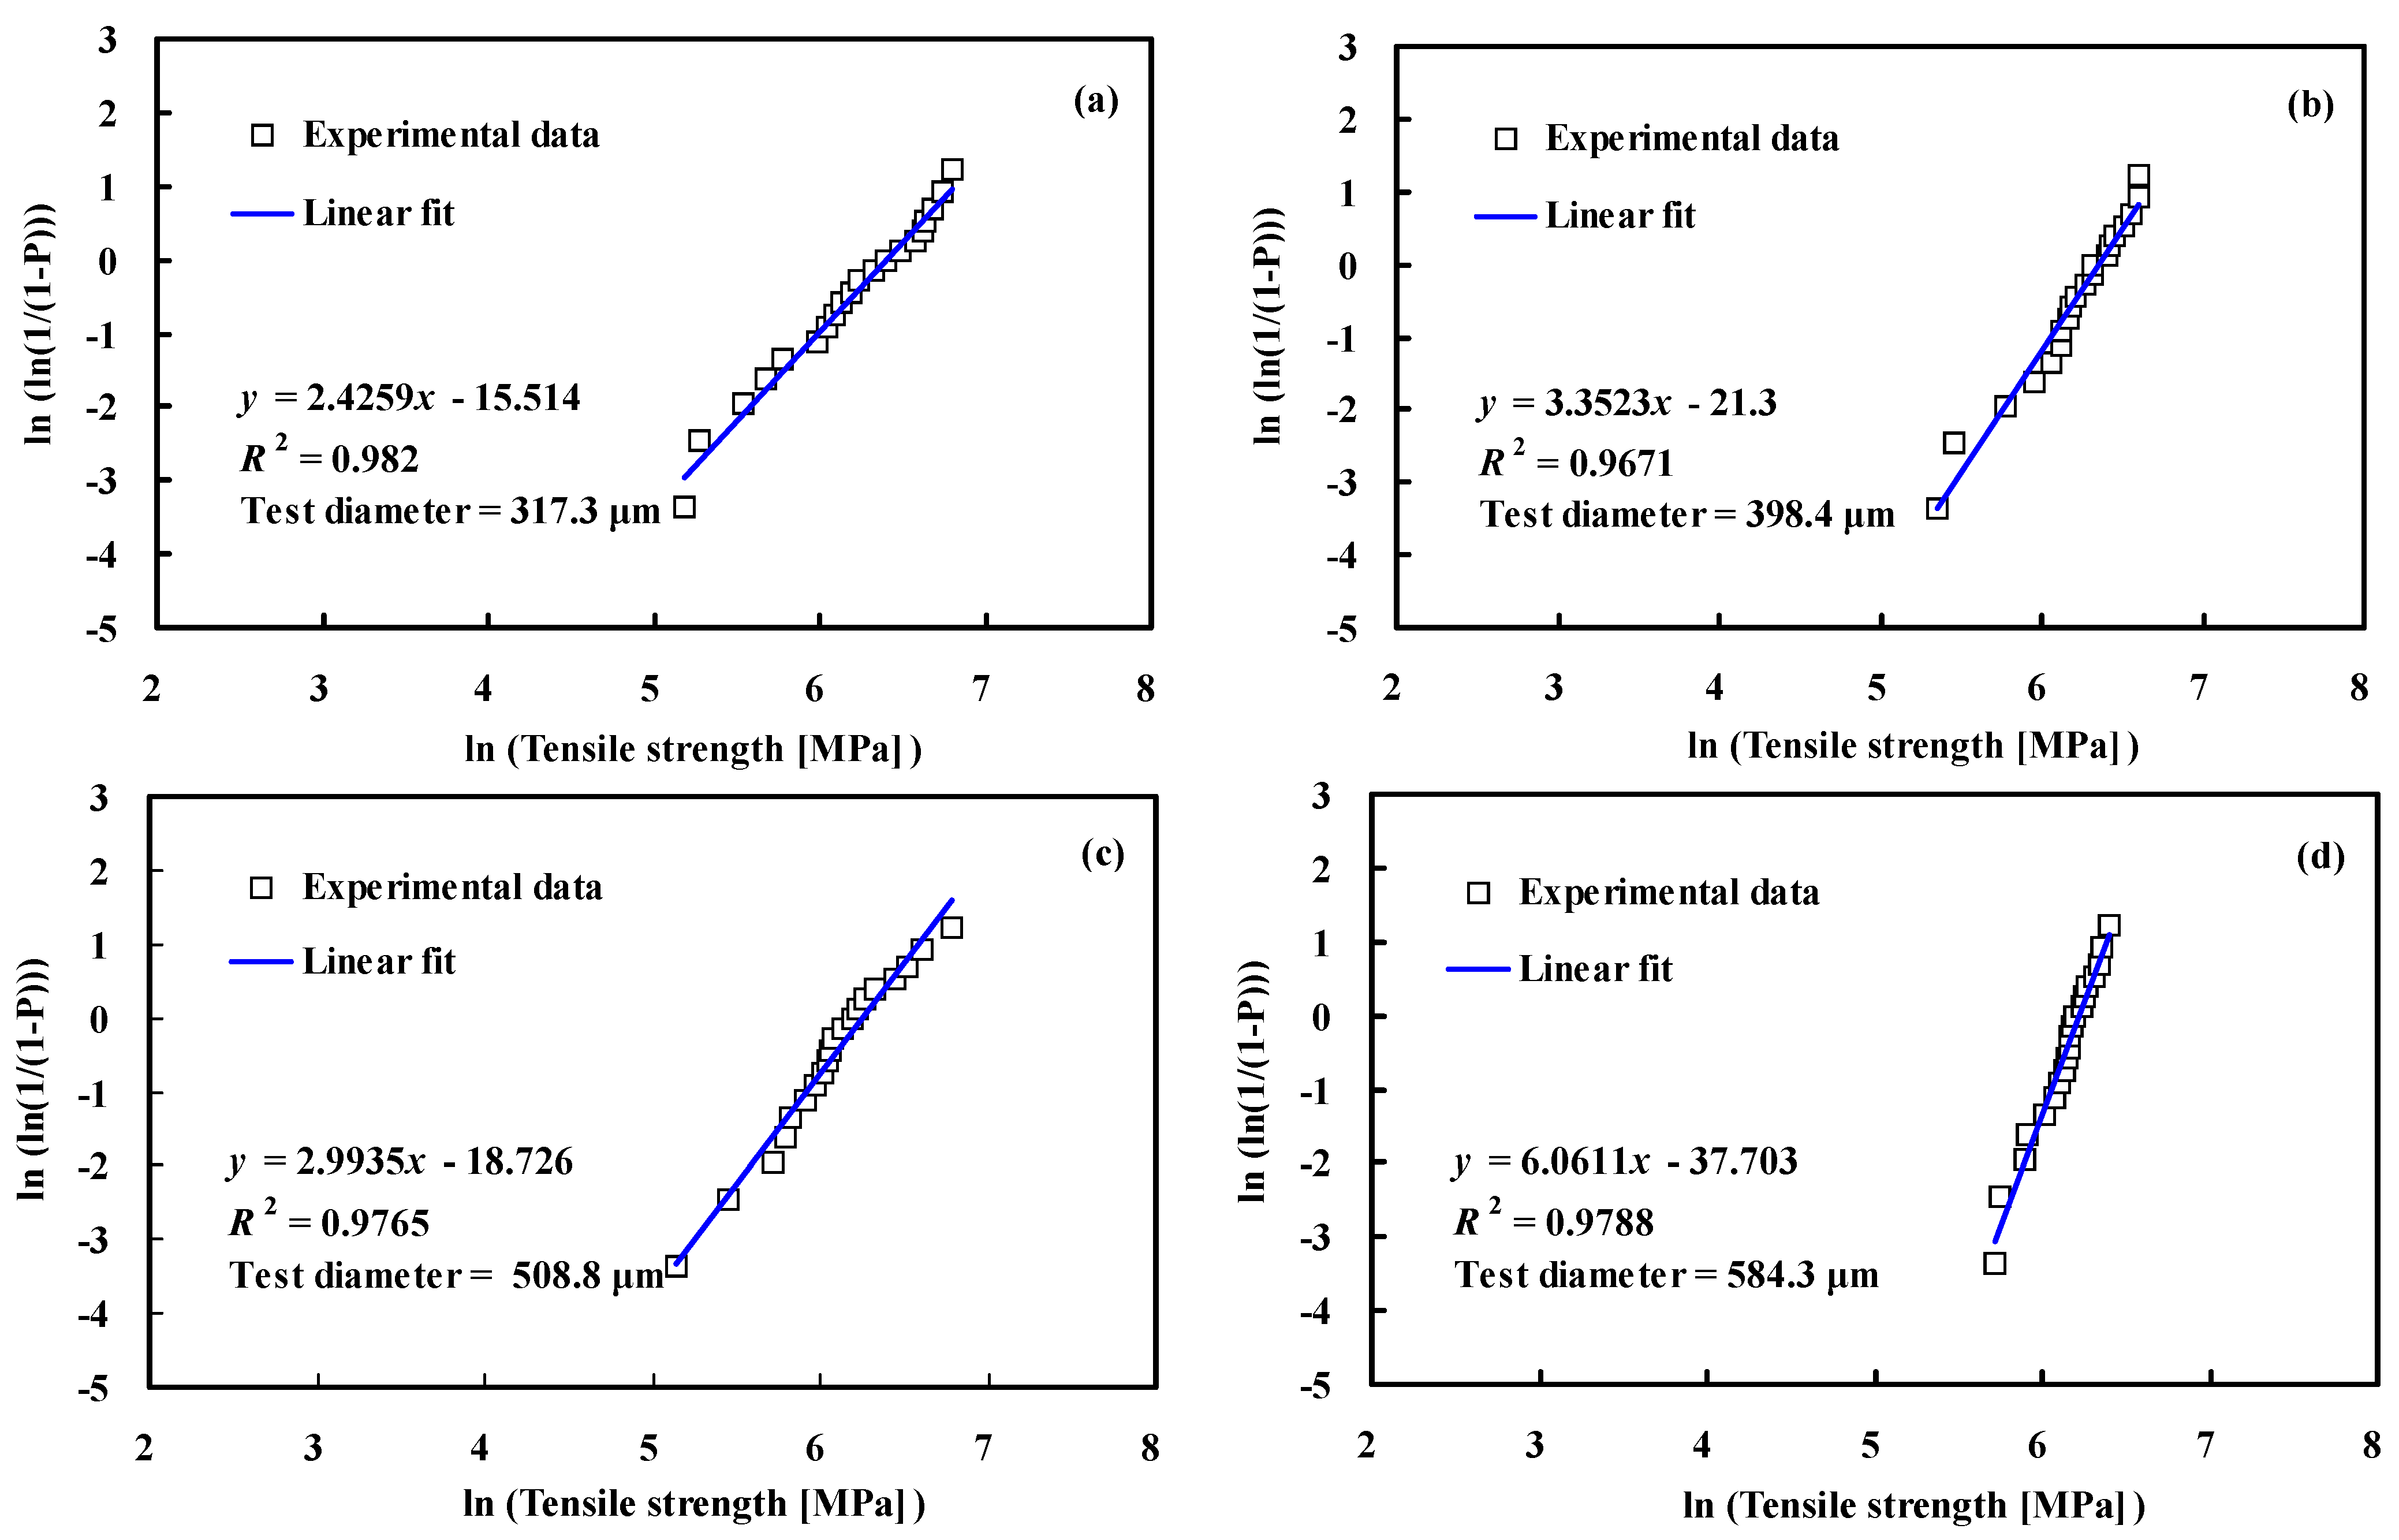
4.1. Statistical Distribution for Tensile Strength

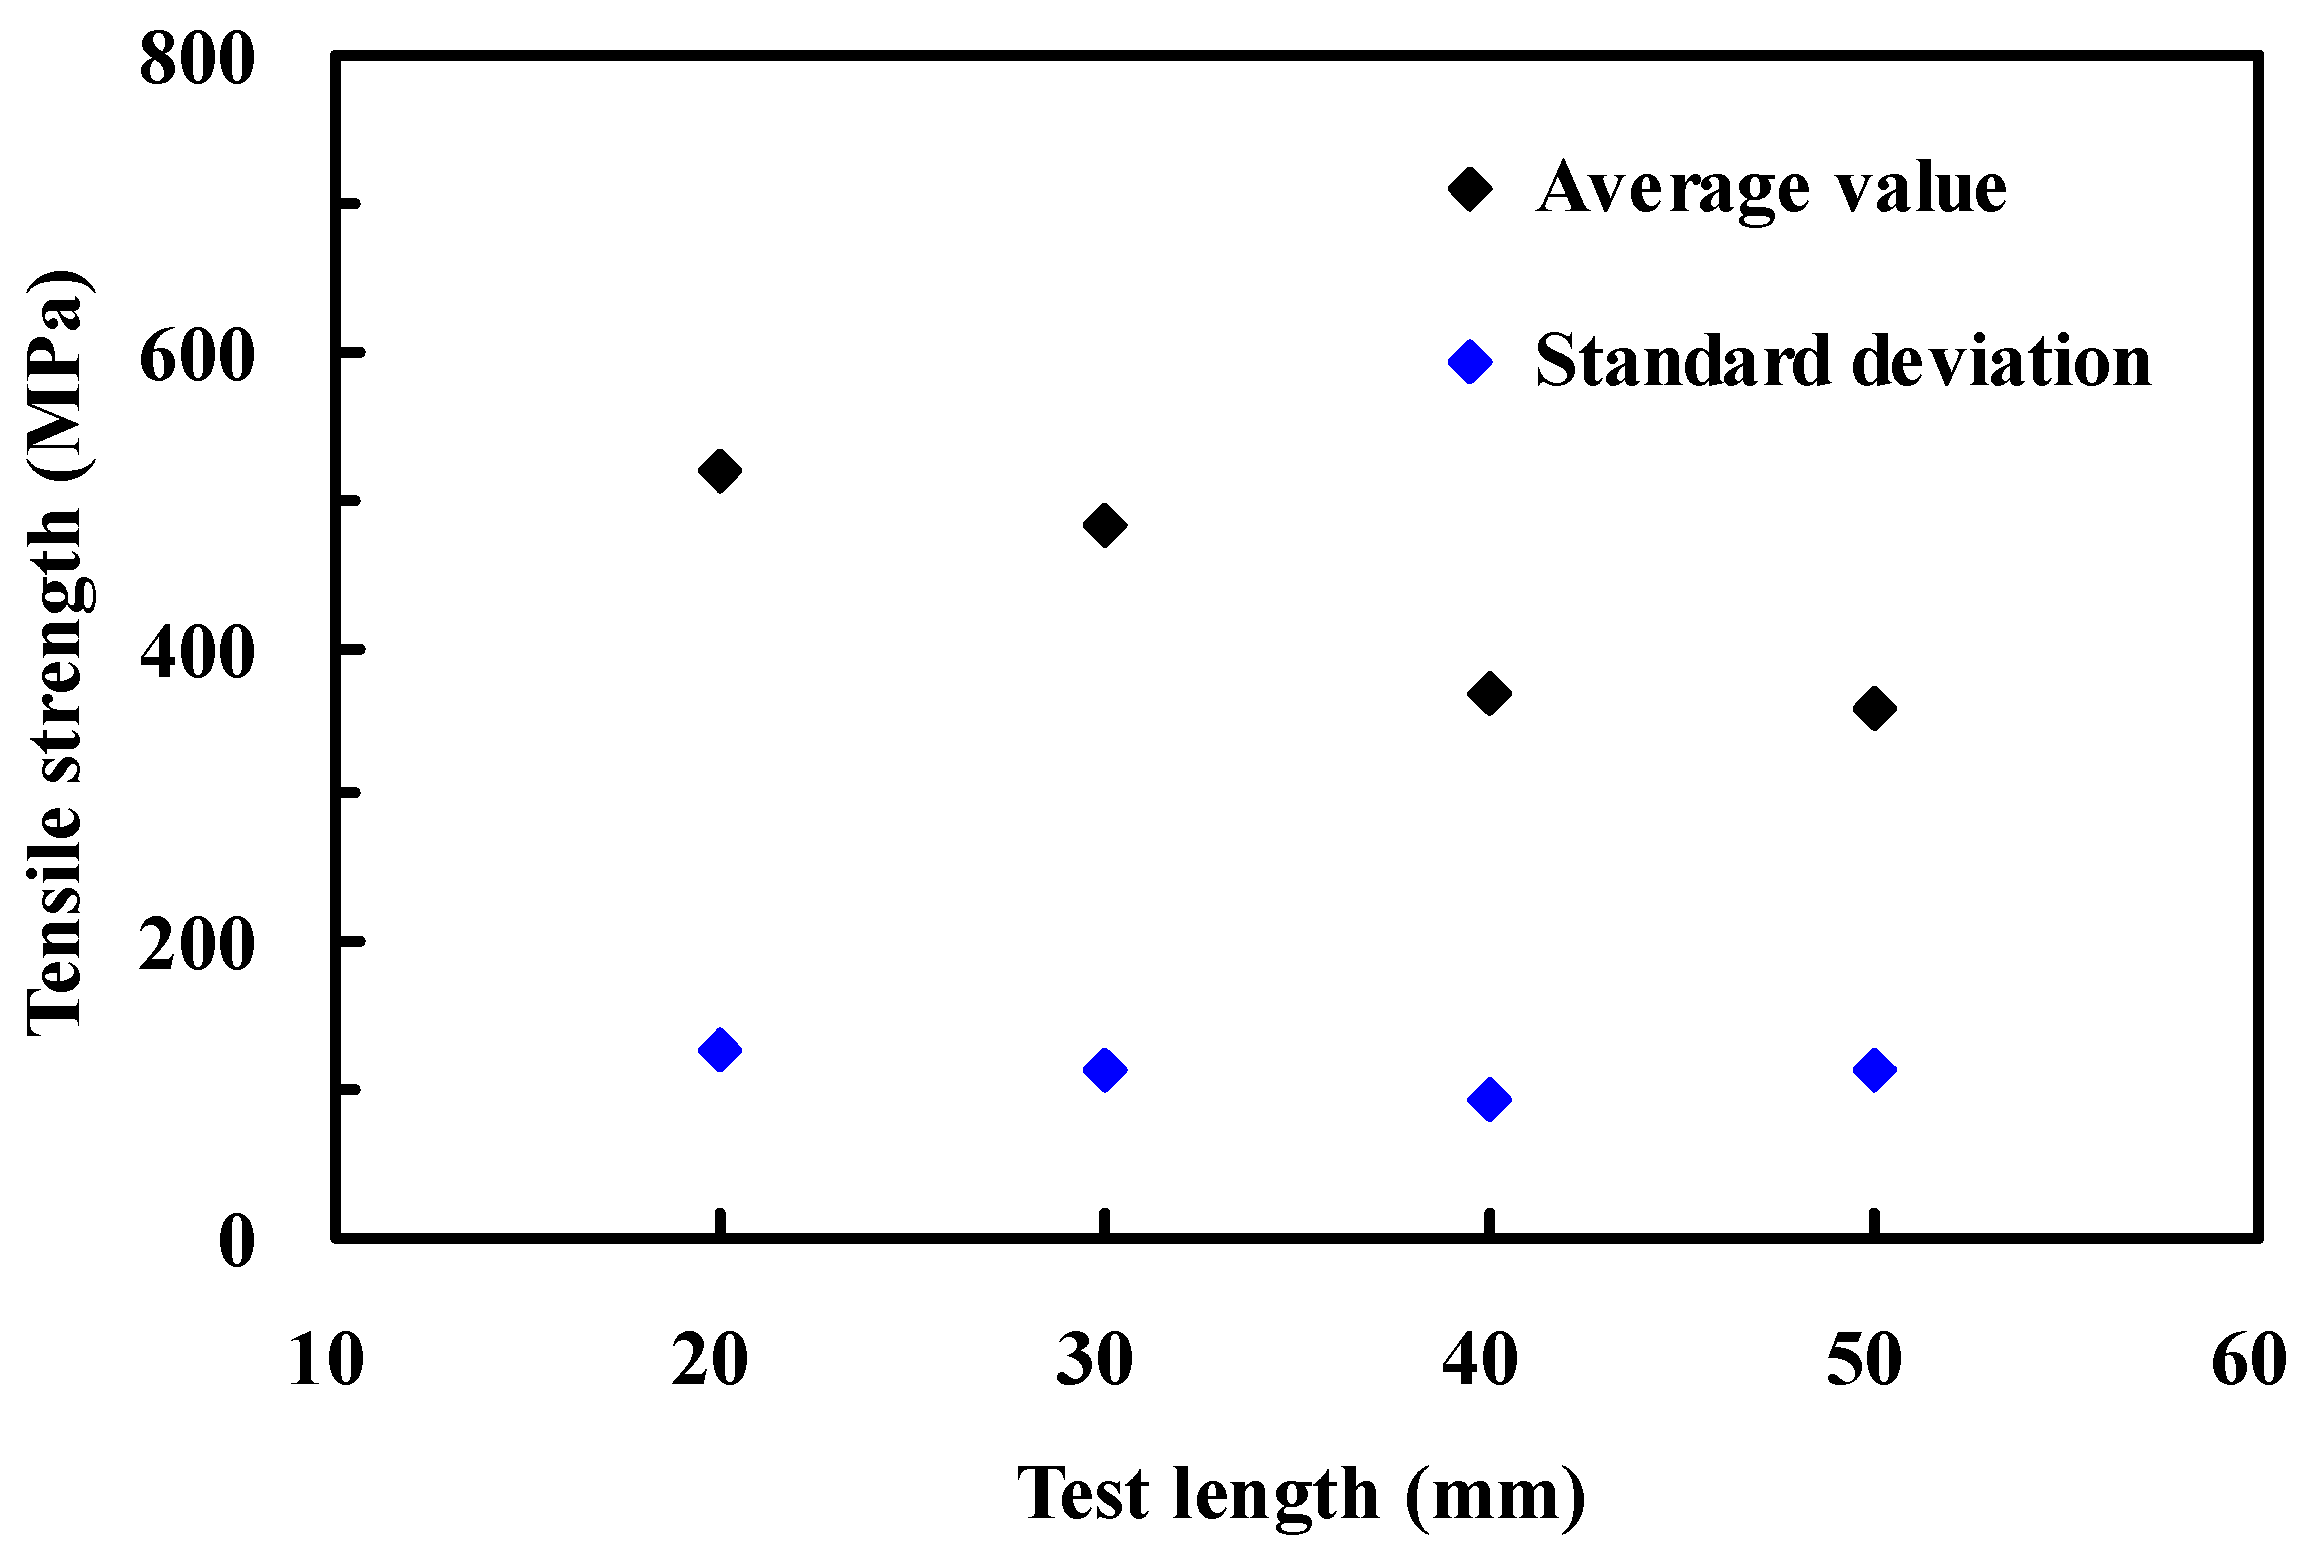
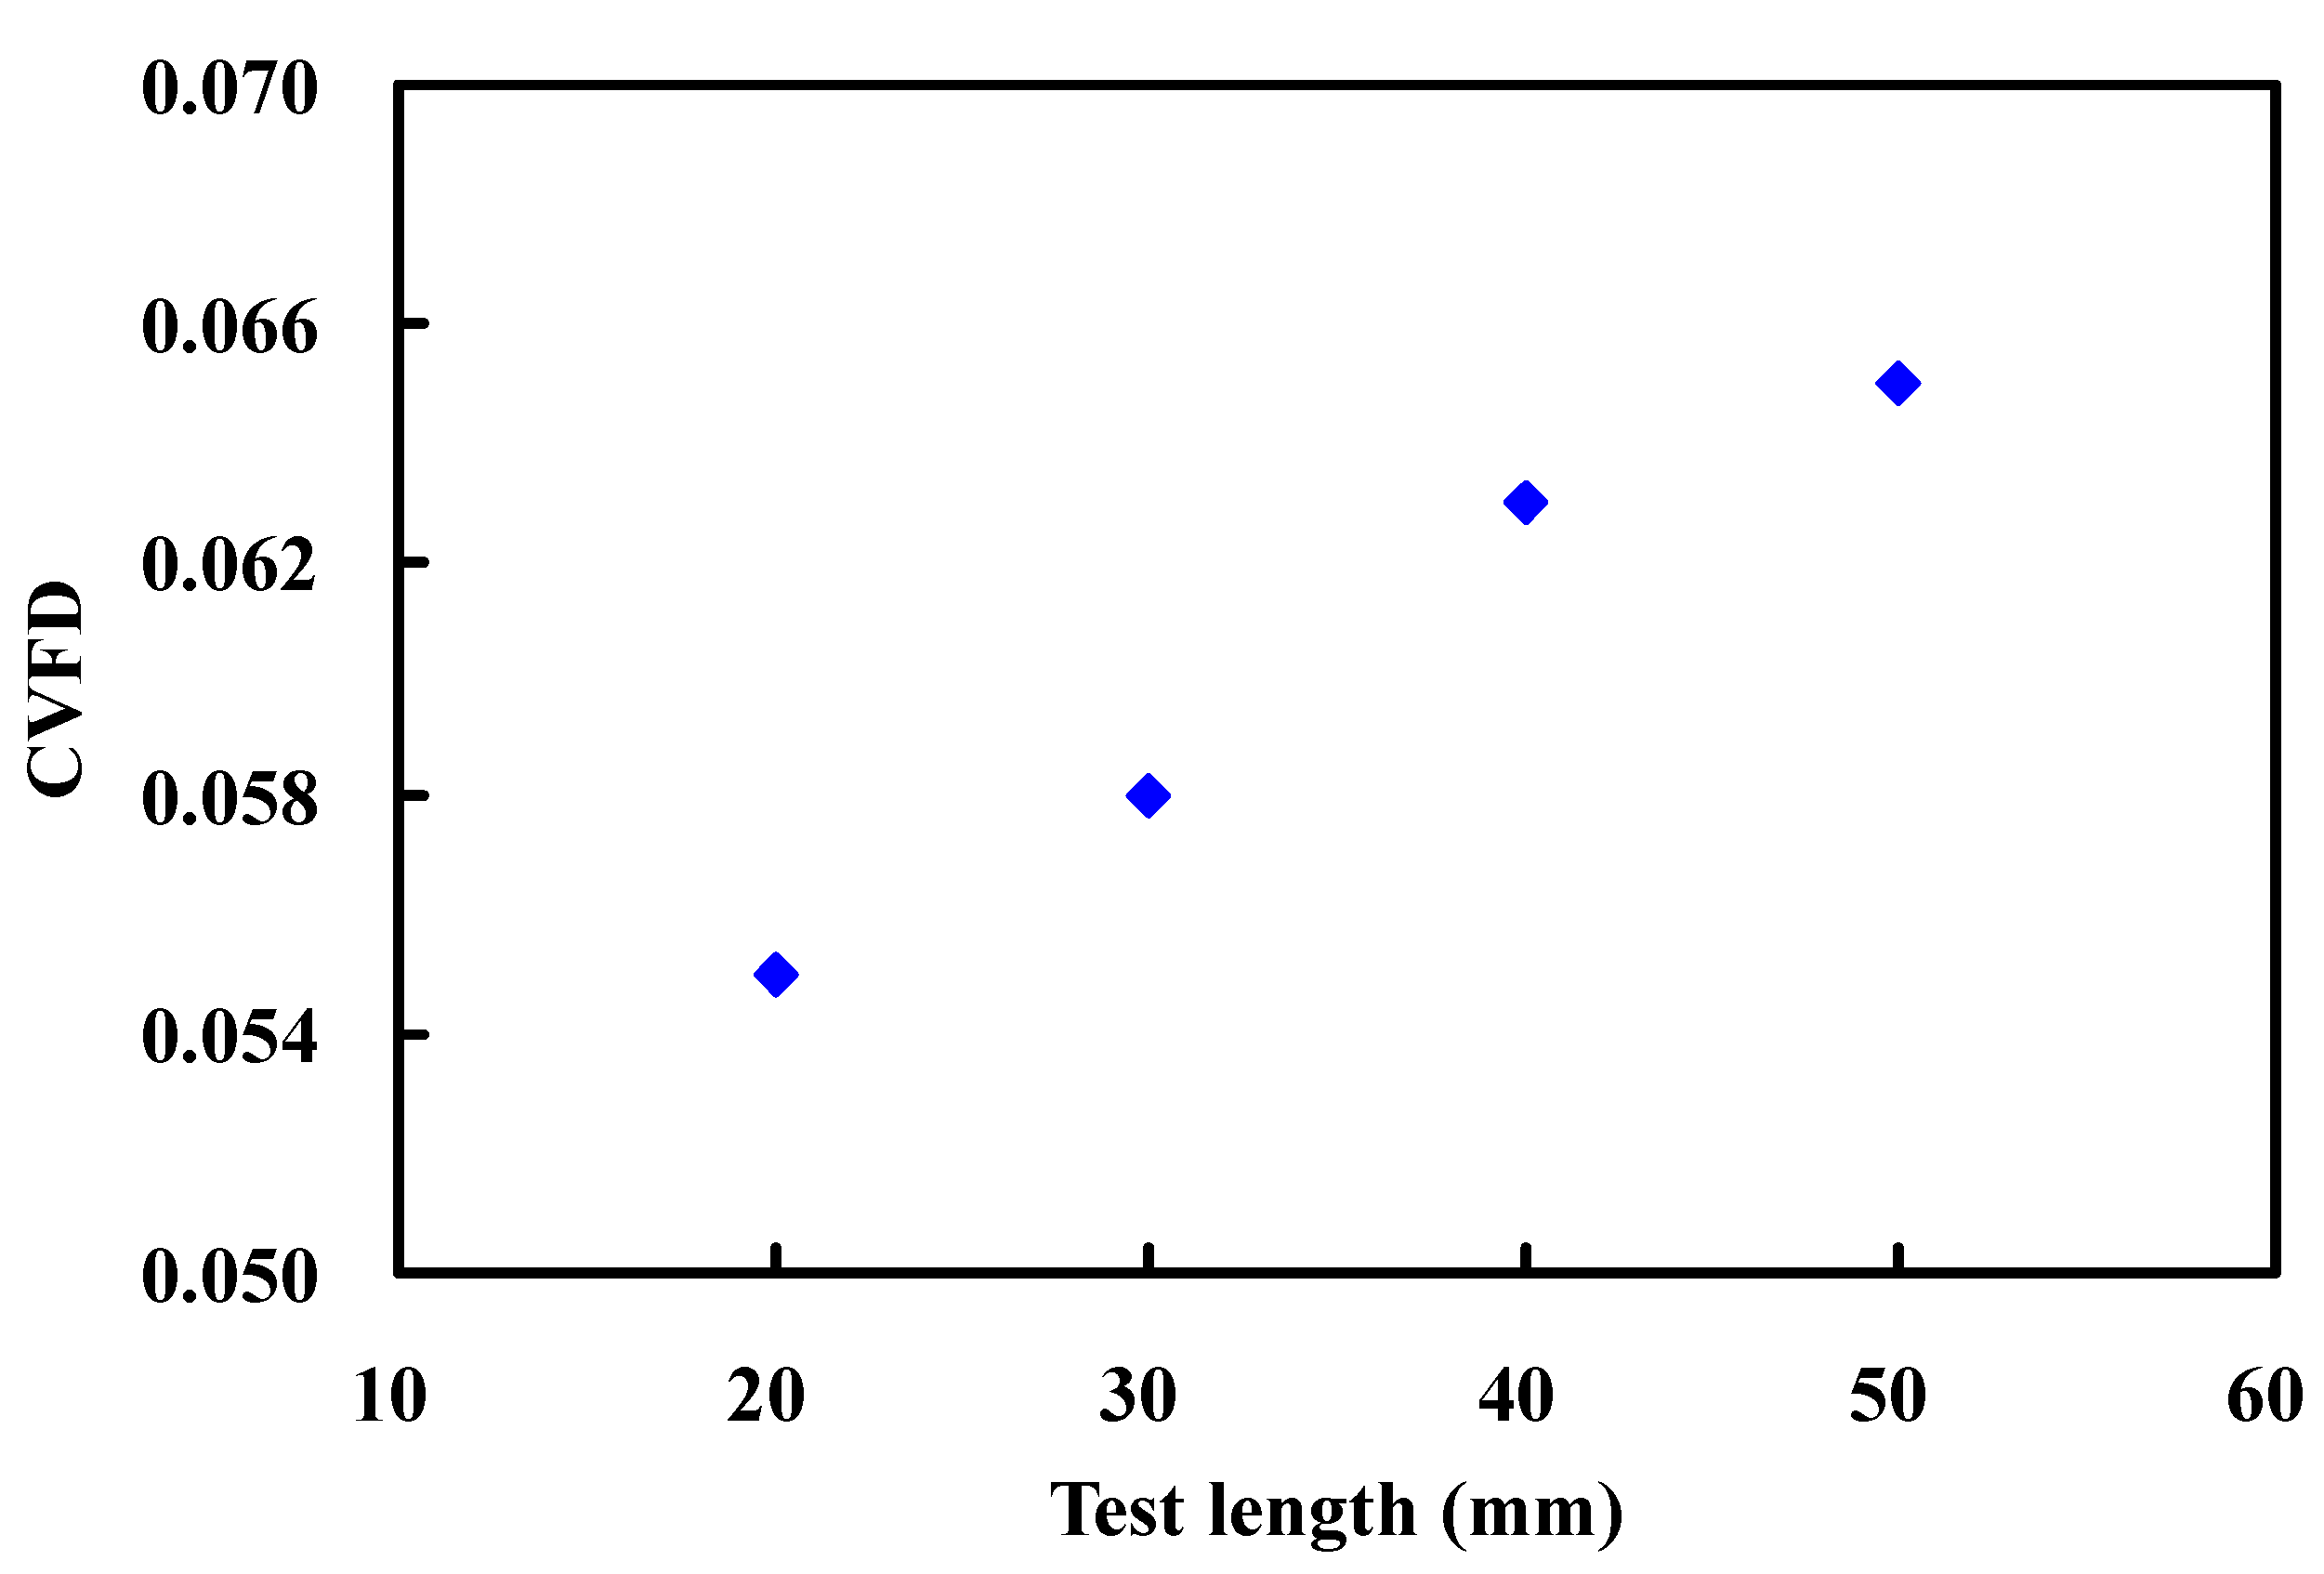
| Gauge length, L (mm) | Number of Specimens, N | Shape parameter, κ | Scale parameter, σ0 (MPa) | Linear coefficient, R2 | CVFD |
|---|---|---|---|---|---|
| 20 | 20 | 4.77 | 566 | 0.87 | 0.055 |
| 30 | 20 | 4.71 | 527 | 0.96 | 0.058 |
| 40 | 20 | 4.47 | 402 | 0.91 | 0.063 |
| 50 | 20 | 3.22 | 403 | 0.96 | 0.065 |
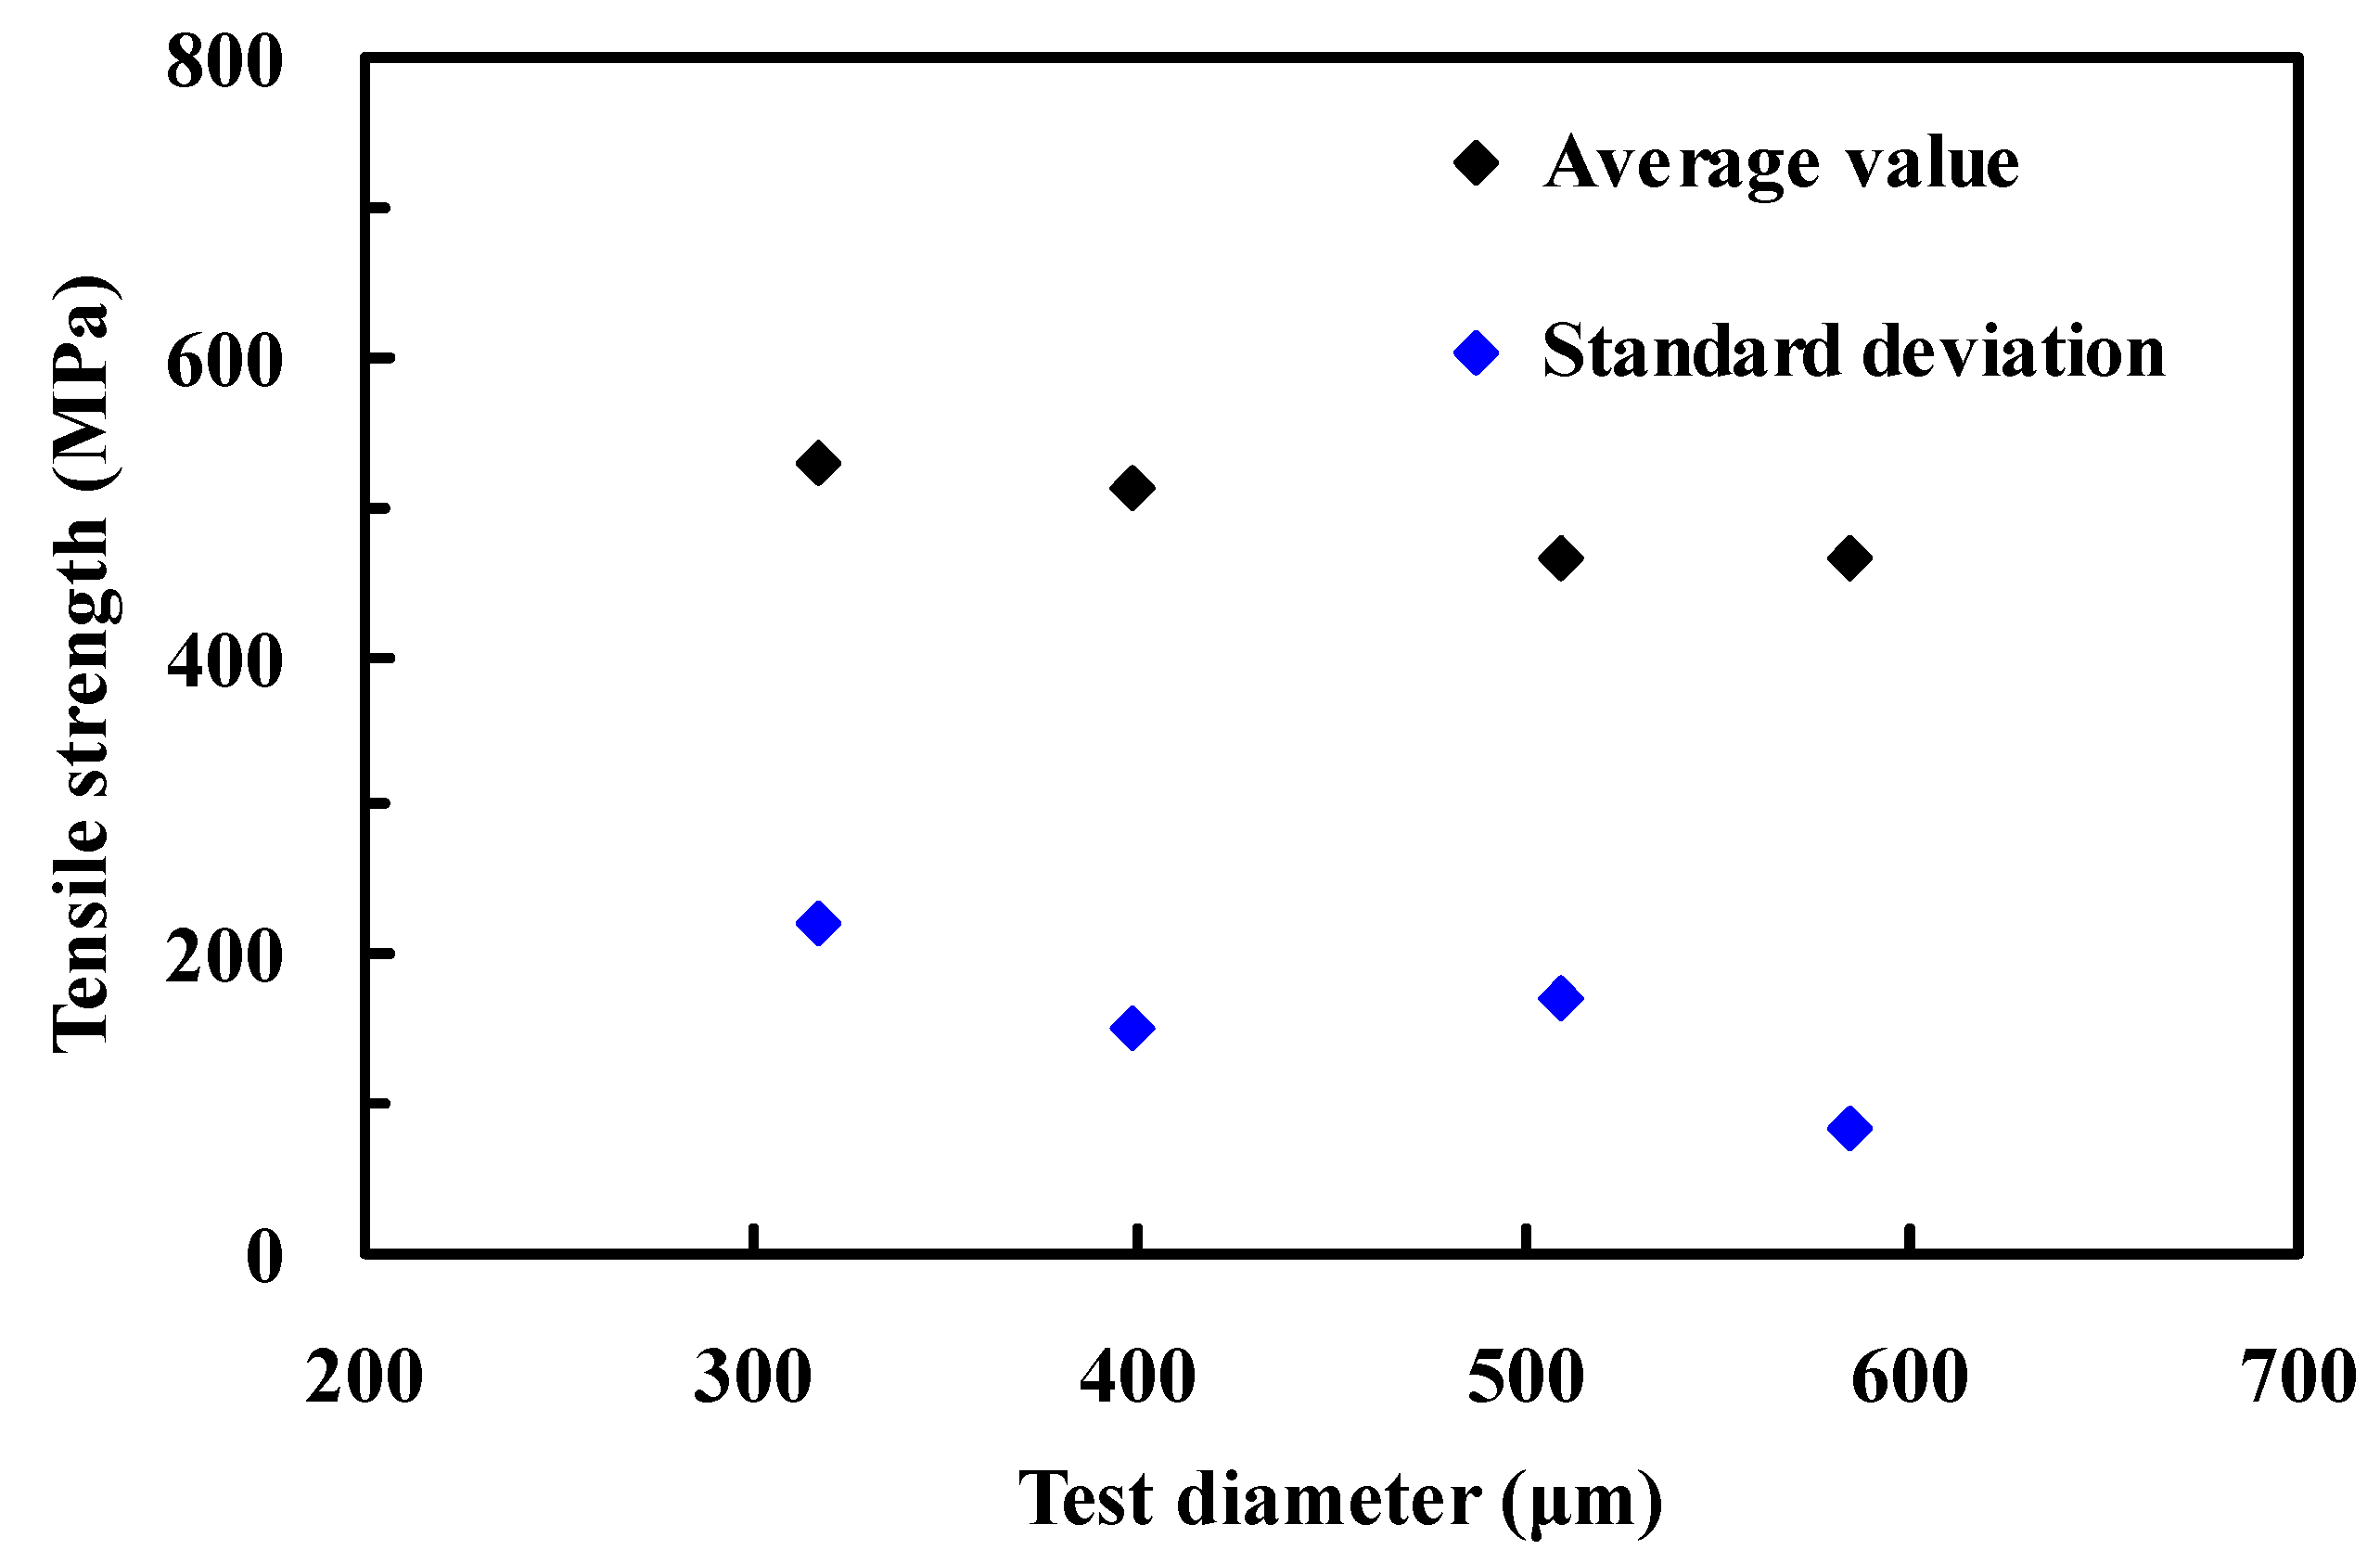
| Test diameter, D (μm) | Number of Specimens, N | Shape parameter, κ | Scale parameter, σ0 (MPa) | Linear coefficient, R2 |
|---|---|---|---|---|
| 317.3 ± 15 | 20 | 2.43 | 599 | 0.98 |
| 398.4 ± 15 | 20 | 3.35 | 575 | 0.97 |
| 508.8 ± 15 | 20 | 2.99 | 521 | 0.98 |
| 584.3 ± 15 | 20 | 6.06 | 503 | 0.98 |
4.2. Size Dependence of Fiber Strength
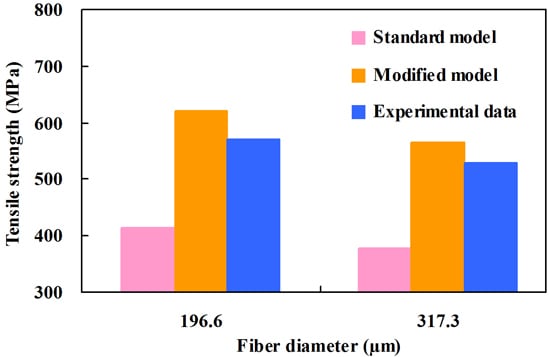
4.3. Weak-Link Scaling
| Term | Scale parameter, σ0 (MPa) | Shape parameter, κ | Exponential parameter, γ |
|---|---|---|---|
| Standard model | 1200 | 3.7 | - |
| Modified model | 1658 | 3.9 | 1.4 |
| Gauge length used for strength prediction (mm) | Predicted strength (MPa) | Measured strength a (MPa) | |
|---|---|---|---|
| Standard model | Modified model | ||
| 20 | 482 (−7.0) b | 509 (−1.7) | 518 |
| 30 | 432 (−10.6) | 440 (−8.9) | 483 |
| 40 | 400 (8.9) | 396 (8.0) | 367 |
| 50 | 376 (4.5) | 366 (1.6) | 360 |
| 60 | 358 (1.7) | 348 (−1.1) | 352 |
| Term | Scale parameter, σ0 (MPa) | Shape parameter, κ | Exponential parameter, γ |
|---|---|---|---|
| Standard model | 1200 | 10.4 | - |
| Modified model | 6909 | 3.8 | 0.8 |
| Test diameter used for strength prediction (μm) | Predicted strength (MPa) | Measured strength a (MPa) | |
|---|---|---|---|
| Standard model | Modified model | ||
| 196.6 | 414 (−27.6) b | 623 (8.9) | 572 |
| 317.3 | 378 (−28.5) | 566 (7.2) | 528 |
| 398.4 | 362 (−29.7) | 515 (0.1) | 514 |
| 508.8 | 345 (−25.8) | 462 (−0.6) | 465 |
| 584.3 | 336 (−27.8) | 439 (−5.6) | 465 |
5. Conclusions
Acknowledgments
Author Contributions
Conflicts of Interest
References
- Abdul Khalil, H.P.S.; Bhat, I.U.H.; Jawaid, M.; Zaidon, A.; Hermawan, D.; Hadi, Y.S. Bamboo fibre reinforced biocomposites: A review. Mater. Des. 2012, 42, 353–368. [Google Scholar] [CrossRef]
- Huang, X.S.; Netravali, A. Biodegradable green composites made using bamboo micro/nano-fibrils and chemically modified soy protein resin. Compos. Sci. Technol. 2009, 69, 1009–1015. [Google Scholar] [CrossRef]
- Andersons, J.; Spārniņš, E.; Joffe, R.; Wallström, L. Strength distribution of elementary flax fibres. Compos. Sci. Technol. 2005, 65, 693–702. [Google Scholar] [CrossRef]
- Peponi, L.; Biagiotti, J.; Torre, L.; Kenny, J.M.; Mondragon, I. Statistical analysis of the mechanical properties of natural fibers and their composite materials. I. Natural fibers. Polym. Compos. 2008, 29, 313–320. [Google Scholar]
- Trujillo, E.; Moesen, M.; Osorio, L.; van Vuure, A.W.; Ivens, J.; Verpoest, I. Bamboo fibres for reinforcement in composite materials: Strength Weibull analysis. Compos A 2014, 61, 115–125. [Google Scholar] [CrossRef]
- Pickering, K.L.; Murray, T.L. Weak link scaling analysis of high-strength carbon fibre. Compos. A 1999, 30, 1017–1021. [Google Scholar] [CrossRef]
- Wilson, D.M. Statistical tensile strength of Nextel™ 610 and Nextel™ 720 fibres. J. Mater. Sci. 1997, 32, 2535–2542. [Google Scholar] [CrossRef]
- Xia, Z.P.; Yu, J.Y.; Cheng, L.D.; Liu, L.F.; Wang, W.M. Study on the breaking strength of jute fibres using modified Weibull distribution. Compos. A 2009, 40, 54–59. [Google Scholar] [CrossRef]
- Berger, M.H.; Jeulin, D. Statistical analysis of the failure stresses of ceramic fibres: Dependence of the Weibull parameters on the gauge length, diameter variation and fluctuation of defect density. J. Mater. Sci. 2003, 38, 2913–2923. [Google Scholar] [CrossRef]
- Paramonov, Y.; Andersons, J. A family of weakest link models for fiber strength distribution. Compos. A 2007, 38, 1227–1233. [Google Scholar] [CrossRef]
- Zhang, Y.P.; Wang, X.G.; Pan, N.; Postle, R. Weibull analysis of the tensile behavior of fibers with geometrical irregularities. J. Mater. Sci. 2002, 37, 1401–1406. [Google Scholar] [CrossRef] [Green Version]
- Standard Test Method for Tensile Strength and Young’s Modulus for High Modulus Single-Filament Materials (Withdrawn 1998); ASTM D3379-75; ASTM International: West Conshohocken, PA, USA, 1975.
- Rao, K.M.M.; Rao, K.M. Extraction and tensile properties of natural fibers: Vakka, date and bamboo. Compos. Struct. 2007, 77, 288–295. [Google Scholar] [CrossRef]
- Amornsakchai, T.; Cansfield, D.L.M.; Jawad, S.A.; Pollard, G.; Ward, I.M. The relation between filament diameter and fracture strength for ultra-high-modulus polyethylene fibres. J. Mater. Sci. 1993, 28, 1689–1698. [Google Scholar] [CrossRef]
- Thomason, J.L. On the application of Weibull analysis to experimentally determined single fibre strength distributions. Compos. Sci. Technol. 2013, 77, 74–80. [Google Scholar] [CrossRef]
- Weibull, W.A. Statistical distribution function of wide applicability. J. Appl. Mech. 1951, 3, 293–297. [Google Scholar]
- Watson, A.S.; Smith, R.L. An examination of statistical theories for fibrous materials in the light of experimental data. J. Mater. Sci. 1985, 20, 3260–3270. [Google Scholar] [CrossRef]
- Defoirdt, N.; Biswas, S.; de Vriese, L.; Tran, L.Q.N.; van Acker, J.; Ahsan, Q.; Gorbatikh, L.; van Vuure, A.; Verpoest, I. Assessment of the tensile properties of coir, bamboo and jute fibre. Compos. A 2010, 41, 588–595. [Google Scholar] [CrossRef]
- Sutherland, L.S.; Shenoi, R.A.; Lewis, S.M. Size and scale effects in composites: I. Literature review. Compos. Sci. Technol. 1999, 59, 209–220. [Google Scholar] [CrossRef]
- Wang, F.; Shao, J.X.; Li, X. Statistics on the fracture strength of bamboo fibers. Polym. Compos. 2015. [Google Scholar] [CrossRef]
- Virk, A.S.; Hall, W.; Summerscales, J. Multiple Data Set (MDS) weak-link scaling analysis of jute fibres. Compos. A 2009, 40, 1764–1771. [Google Scholar] [CrossRef]
- Amada, S.; Ichikawa, Y.; Munekata, T.; Nagase, Y.; Shimizu, H. Fiber texture and mechanical graded structure of bamboo. Compos. B 1997, 28, 13–20. [Google Scholar] [CrossRef]
© 2014 by the authors; licensee MDPI, Basel, Switzerland. This article is an open access article distributed under the terms and conditions of the Creative Commons Attribution license (http://creativecommons.org/licenses/by/4.0/).
Share and Cite
Wang, F.; Shao, J. Modified Weibull Distribution for Analyzing the Tensile Strength of Bamboo Fibers. Polymers 2014, 6, 3005-3018. https://doi.org/10.3390/polym6123005
Wang F, Shao J. Modified Weibull Distribution for Analyzing the Tensile Strength of Bamboo Fibers. Polymers. 2014; 6(12):3005-3018. https://doi.org/10.3390/polym6123005
Chicago/Turabian StyleWang, Fang, and Jiaxing Shao. 2014. "Modified Weibull Distribution for Analyzing the Tensile Strength of Bamboo Fibers" Polymers 6, no. 12: 3005-3018. https://doi.org/10.3390/polym6123005
APA StyleWang, F., & Shao, J. (2014). Modified Weibull Distribution for Analyzing the Tensile Strength of Bamboo Fibers. Polymers, 6(12), 3005-3018. https://doi.org/10.3390/polym6123005