Article

Charge-Transfer Complexes Studied by Dynamic Force Spectroscopy

1
Molecular Nanofabrication Group, MESA+ Institute for Nanotechnology, University of Twente, P.O. Box 217, 7500AE Enschede, The Netherlands
2
Current Address, Molecular Chirality, Surfaces and Nanomaterials Group, Institut de Ciencia de Materials de Barcelona (ICMAB-CSIC), Campus de la UAB, 08193, Bellaterra, Spain
3
Key Lab of Organic Optoelectronics and Molecular Engineering, Department of Chemistry, Tsinghua University, Beijing 100084, China
*
Author to whom correspondence should be addressed.
Polymers 2013, 5(1), 269-283; https://doi.org/10.3390/polym5010269
Submission received: 2 February 2013 / Revised: 25 February 2013 / Accepted: 25 February 2013 / Published: 6 March 2013
(This article belongs to the Special Issue Supramolecular Chemistry and Self-Assembly 2013)

Abstract

:
In this paper, the strength and kinetics of two charge-transfer complexes, naphthol-methylviologen and pyrene-methylviologen, are studied using dynamic force spectroscopy. The dissociation rates indicate an enhanced stability of the pyrene-methylviologen complex, which agrees with its higher thermodynamic stability compared to naphthol-methylviologen complex.

1. Introduction

Non-covalent interactions, such as hydrogen bonds, π-π stacking, electrostatic and hydrophobic interactions, are ubiquitous in biological systems. Their inherent reversibility makes them also interesting for technological applications such as stimulus-responsive surfaces and molecular recognition. One of these non-covalent interactions is the charge-transfer (CT) interaction. A CT complex is formed when a partial transfer of charge occurs between two molecules. The molecule providing the electron (donor) and the receiver of the electron (acceptor) experience an electrostatic attraction that holds them together. The CT interaction is often evidenced by the appearance of a characteristic absorption band in the visible spectrum. The CT interaction appears in many biological systems [1,2] in particular stabilizes molecules that intercalate between DNA bases, which can be used for cancer therapy [3]. CT interactions have been also exploited in the fabrication of layer-by-layer films [4]. The acceptor, methylviologen (mv, N,N’-dimethyl-4,4’-bipyridinium), is a dictation and has been extensively used in the study of CT complexes [5,6,7,8,9]. The complexation of mv with molecules containing donor moieties has been applied to create supramolecular crystals [10] and supra-amphiphiles [11] as well as in phototherapy [12]. In particular, host-stabilized CT complexes of mv have been used as building blocks of redox-switchable supramolecular surfaces [13] and polymers [14].
Single-molecule force spectroscopy (SMFS) has been used to study weak interactions quantitatively, both of biological and synthetic origin [15,16,17] In particular, the atomic force microscope (AFM) can be easily adapted to perform this type of measurements. The kinetic properties of the studied complexes reveal themselves as a dependence of the force required to rupture the complex with the speed at which the complex is being pulled at [18]. Thus, force spectroscopy experiments are often performed covering a range of retraction speeds in what has been named dynamic force spectroscopy (DFS). The strength of CT interactions has been examined using force spectroscopy before [19,20,21]. The interaction between tetramethylphenylenediamine (TMPD) and tetracyanoquinodimethane (TCNQ) was reported to rupture at 70 pN [19], and polymers decorated with poly(9-vinylcarbazole) (PVK) were found to desorb from monolayers presenting dinitrobenzamide (DBA) and nitrobenzamide (NBA) groups at forces of 28 and 18 pN, respectively [21]. However, many of the experiments were not conducted at the single molecule level [19,20], or did not study the interaction over a dynamic range.
Here, the kinetic properties of two CT complexes, naphthol-methylviologen (nph-mv) and pyrene-methylviologen (pyr-mv, see Figure 1) are studied using DFS.
Figure 1. Compounds used in this study.
Polymers 05 00269 g001

2. Results and Discussion

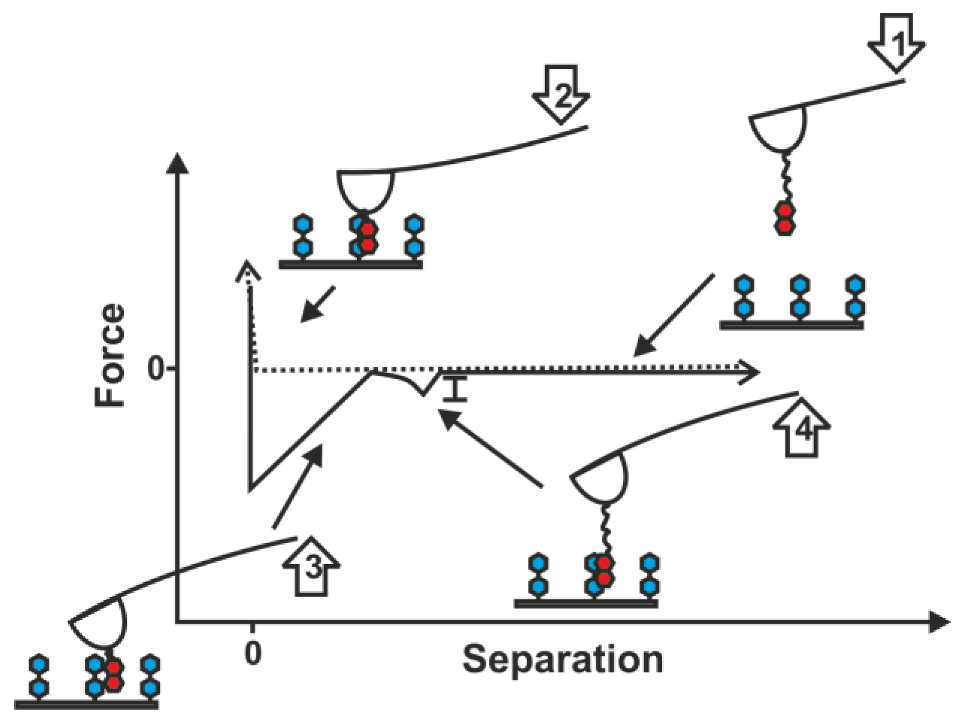
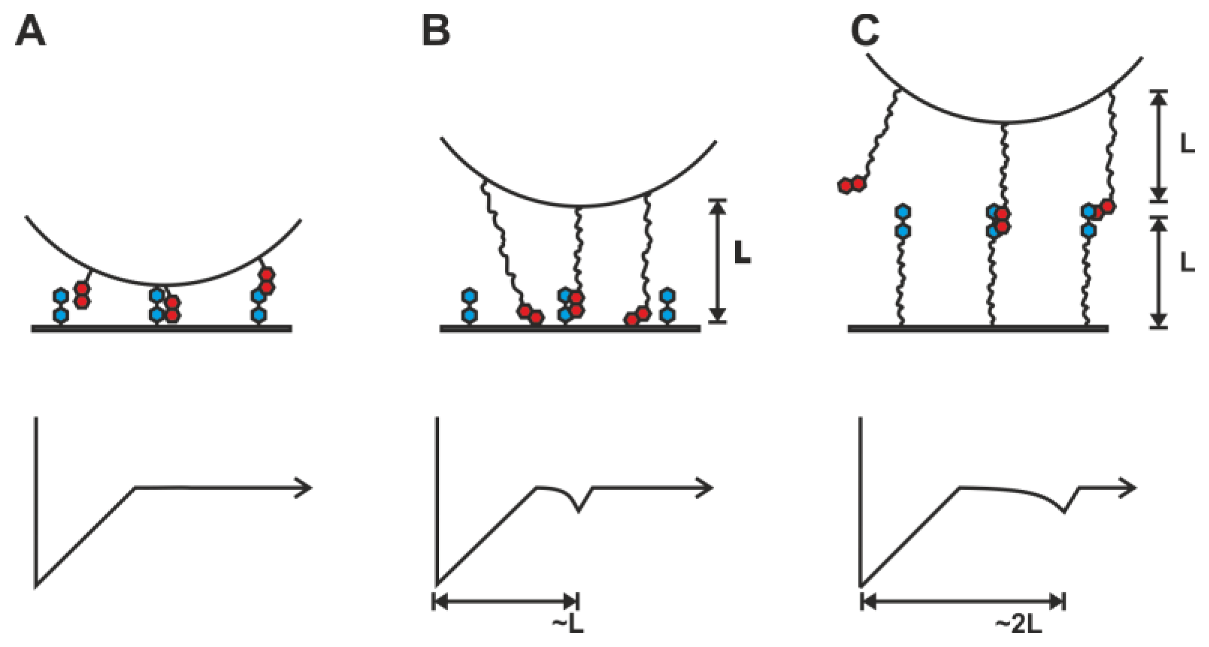
2.1. Double-Tethered DFS

In order to perform a DFS experiment the studied complex must be ruptured repeatedly in a controlled manner [15]. The complementary moieties are secured to the surface of an AFM tip and a supporting substrate. The distance between the base of the AFM cantilever and the substrate is varied by means of a piezoelectric crystal. In the starting point the two surfaces are away from each other at a distance on the order of hundreds to thousands of nm, so the AFM cantilever is relaxed. This distance is reduced until the tip makes contact to the surface, and further reduced until a predetermined deflection, which is measured using a laser beam reflecting on the cantilever, is achieved. This part of the cycle is called the approach. The system is kept in this situation for a certain amount of time (dwell time, usually 0.1–1 s) to allow the formation of the complexes. Then, the distance between the base of the cantilever and the substrate is increased at a constant speed, the so called retraction part of the cycle. In the initial phase of the retraction, the cantilever will relax, followed by a deflection on the opposite direction if an interaction occurs between the tip surface and the substrate. When the energy stored in the negatively deflected cantilever is enough to break the interaction a sudden relaxation will be detected and the cantilever will travel undeflected until the starting point. The cantilever spring constant can be calibrated using several methods to translate these deflection values into force values [22,23]. A plot of the measured force vs. the imposed distance (a force-distance curve) can be constructed using this information and the true separation from the surface can be calculated using the spring constant of the cantilever, resulting in a force-separation plot. However, it is unlikely that the interaction between the tip surface and the substrate measured in such way originates exclusively from the interaction between the studied moieties. The strongest interaction when doing this experiment in ambient conditions is the capillary force produced by the water meniscus that forms at the point of contact, which is the reason why DFS experiments are carried out inside a liquid medium in most occasions. Several other interactions, such as Van der Waals, electrostatic or hydrophobic forces can contribute to the attractive interaction between the tip and the substrate. Long polymeric linkers, in particular polyethylene glycol (PEG) [24], are usually intercalated between the tip surface and one of the moieties in order to separate this unspecific contribution from the studied interaction [25]. Thus, the typically short-ranged unspecific interactions are broken before any stress is exerted on the complex (Figure 2). Moreover, in many cases the formation of the complex requires a certain degree of freedom that can only be achieved when introducing a flexible linker instead of a direct attachment to the surface. The characteristic non-linear elasticity of polymeric linkers appears on the force-separation curve as a curved line. The slope of the points just prior to the rupture (in pN/nm) can be multiplied by the externally imposed retraction speed (in nm/s) in order to obtain the instantaneous loading rate (how fast the force was applied) that was exerted on the complex (in pN/s).
Figure 2. Force-separation curve using a tethered moiety. During the approach phase the cantilever is relaxed (1) until the tip snaps into contact with the substrate and is deflected (2). During the retraction, a negative force (unspecific interaction) is detected with a constant slope while the tip and substrate are in contact (3). After this interaction is broken, a non-linear region appears as the polymer chain is stretched (4). Finally, rupture of the specific noncovalent interaction is observed which leads back to the unconnected state (1).
Polymers 05 00269 g002
It has been shown for several systems that the force required to break a bond depends on the loading rate, which is the reason why the rupture force should be measured at different retraction speeds [18,26]. Occasionally, saw-tooth patterns are observed when multiple complexes tethered by chains of different length are successively ruptured. In our study, we only analyzed the last rupture of each force-separation curve to ensure that the observed instantaneous loading rate is not being shared with other complexes. Polymer models such as the worm-like chain (WLC) or the freely-jointed chain (FJC) can be fitted to the non-linear segments to discriminate whether more than one chain or a single chain was being pulled. This ensures that the measured force corresponds to the rupture force of a single complex, and not to two or more complexes being ruptured at the same instant. Since the thermal energy at room temperature is comparable to the energy of CT interactions, the rupture will be a thermally activated process. Thus, the rupture force will vary several pN depending on the microscopic fluctuations of the system, and several ruptures must be measured in order to obtain a reliable most probable rupture force.
However, this scheme does not rule out possible interactions between the tethered moiety and the opposite substrate. The use of the so-called double-tether approach (Figure 3), in which a linker is introduced to connect each of the complementary moieties to their corresponding surface, is used to solve this problem [27]. Only ruptures that occur when the tip and the substrate are at distances approximately two times the length of the employed linker are in this approach regarded as specific.
Figure 3. Attachment strategies and characteristic resulting force-separation curves. (A) Direct linking does not allow the estimation of the number of complexes and the rupture force can be affected by unspecific contributions. (B) Tethering one of the moieties resolves the rupture from the unspecific tip-substrate interaction, but substrate-moiety interactions are still possible. (C) Double-tethering ensures that ruptures happening when the tip-substrate distance is approx. two tether lengths originate from specific interactions.
Polymers 05 00269 g003
Following the double-tether strategy, we used a commercially available PEG crosslinker (PEG 3000) to connect amine-functionalized nph and mv derivatives to amine-functionalized AFM cantilevers and silicon substrates, respectively. Several hundreds of approach-retraction cycles were performed at different retraction speeds. The resulting force-separation curves for each retraction speed were examined using a force spectroscopy analysis tool [28], and only the ones showing non-linear features corresponding to a single polymer chain were selected. Each selected curve produced a set of data consisting of values for the rupture force, the instantaneous loading rate and the contour length of the stretched polymer. This contour length is the combined length of two polymer chains in the case of a double-tethered rupture, or just one chain in the case of an unspecific rupture. Thus, the contour lengths were used to select forces originating from ruptures of the CT complex. The average contour length of a PEG chain of 3000 g/mol is 25 nm, however, the compound is polydisperse and, when looking at the last rupture event of the curves, these events originate from the longer chains on the tip. We have used the same compound in other studies where only one of the moieties forming the complex was tethered, the other being directly attached to a substrate. In all of these experiments, we observed that more than 95% of the chains corresponding to the last rupture were shorter than 60 nm [29]. Based on this observation, we only considered for further analysis the ruptures corresponding to chains of larger contour lengths, which we attribute to double-tethered interacting pairs.
The resulting data from this filtering procedure was used to construct kernel density estimations of rupture force and instantaneous loading rate at each retracting speed. The most probable force, loading rate and their uncertainties were extracted from these densities. In some cases, a long tail of the distribution towards higher forces was observed (Figure 4). This tail has been attributed to diverse causes such as heterogeneity of chemical bonds [30] or simultaneous ruptures of more than one complex [31,32].
Figure 4. Density of probability for the rupture force of nph-mv probed at 598 nm/s. The ticks on the horizontal axis indicate individual measurements.
Polymers 05 00269 g004
A plot of the most probable rupture force vs. the most probable loading rate at each retracting speed is shown in Figure 5. The most probable rupture force, f*, increases with the loading rate, ρ. Such behavior is characteristic of complexes being pulled out of equilibrium. The relationship between these two quantities was first described in the work of Evans and Ritchie [18].
Polymers 05 00269 i001
In this expression kBT is the thermal energy, xβ is the width of the potential barrier of the interaction and k*off is the dissociation rate at zero force (the intrinsic off-rate of the complex). The solution of this equation appears as a straight line in a semilogarithmic plot. Although we could fit the data to this model (dashed line in Figure 5), we found that a better fit could be obtained ignoring the point at lower loading rate (solid line in Figure 5). The typical residual from this second fit was 10 pN, which was similar or lower to the residuals of the first fit, and in particular significantly lower than the residuals for the two data points corresponding to the slowest loading rates (24 and 17 pN). The rationale is that the complex is pulled under thermodynamic control at low loading rates, at which the dissociation force remains constant, and only follows the Evans-Ritchie model at higher loading rates. The results from the fit of the high loading rate regime suggest a potential width xβ of 0.16 ± 0.03 nm and a dissociation rate constant k*off of 14 s1 (confidence interval 8–23 s1).
Figure 5. Results from dynamic force spectroscopy (DFS) performed on the nph-mv charge-transfer (CT) complex. The lines are fits to Evans model using all points (dashed) or all but the first point and a constant force value at low loading rates (solid).
Polymers 05 00269 g005

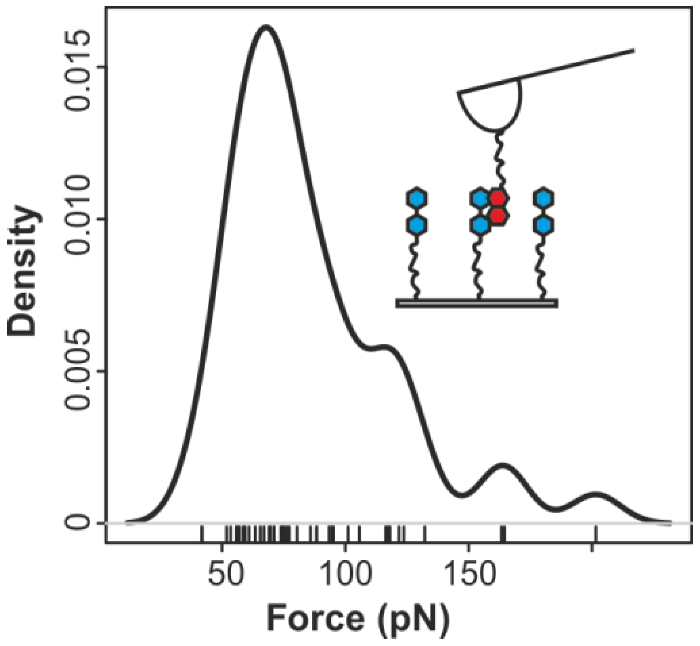
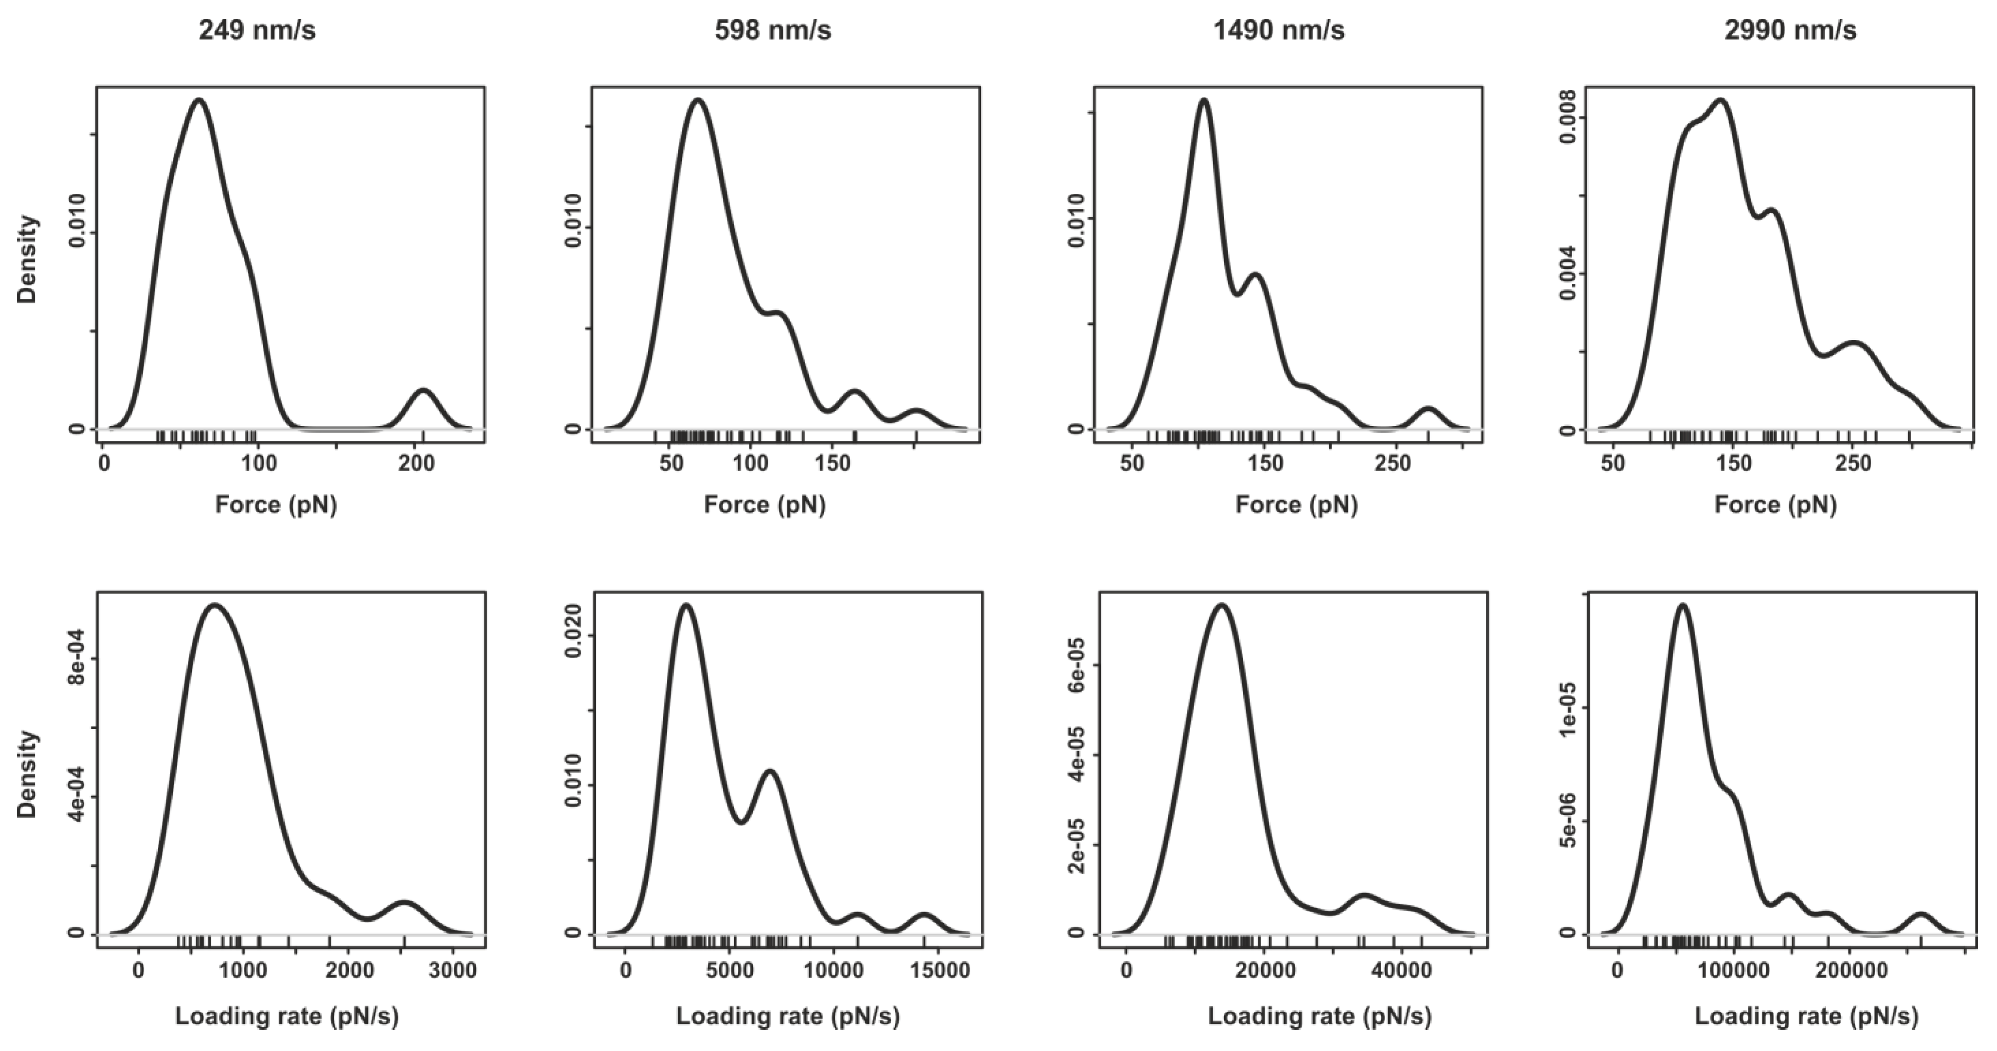
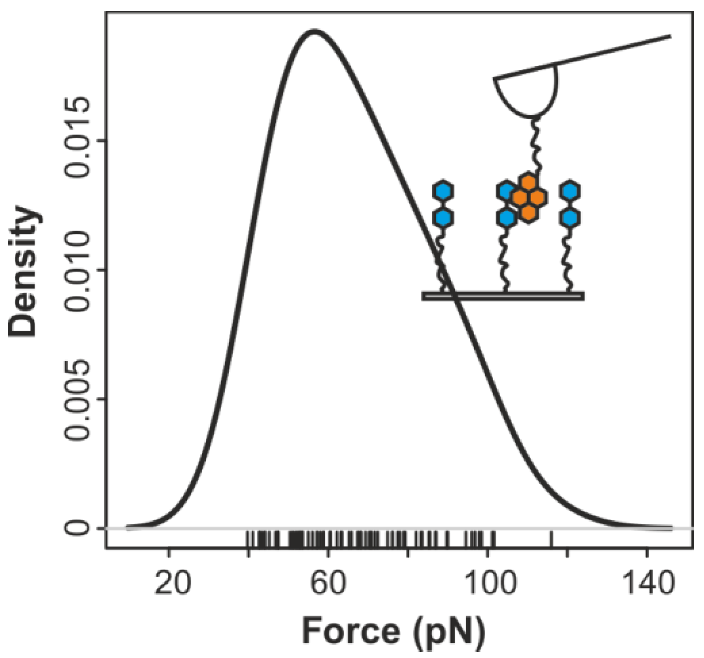
2.2. Pyrene-Methylviologen Complex

A similar surface functionalization scheme was used for substituting the amino-functionalized nph derivative by amino-functionalized pyrene, (pyr). The resulting force-distance curves were analyzed and filtered as described above. A plot showing the density of probability for the rupture force of pyr-mv is shown in Figure 6.
Figure 6. Density of probability for the rupture force of pyr-mv probed at 581 nm/s. The ticks on the horizon.
Polymers 05 00269 g006
The most probable rupture force vs. loading rate values is presented in Figure 7. In this case ignoring the lower loading rate point did not improve the fit. The fit to the Evans model of all data points suggests a potential width xβ of 0.4 ± 0.1 nm and a dissociation rate constant k*off of 2 s1 (confidence interval 0.3–13 s1).
Figure 7. Results from DFS performed on the pyr-mv CT complex. The lines are fits to Evans model using all points (dashed) or all but the first point and a constant force value at low loading rates (solid).
Polymers 05 00269 g007

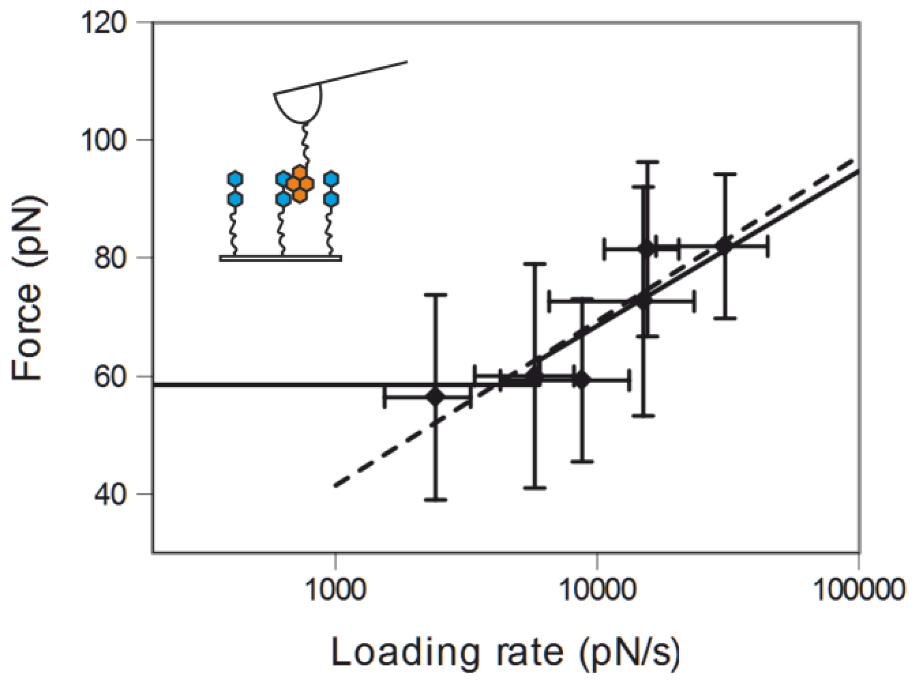
2.3. Comparing nph-mv and pyr-mv Complexes

Comparing the characteristic potential widths and dissociation rate constants of the two CT complexes studied here we rationalize the data as follows. First, the potential width is appreciably larger in the case of the pyr-mv complex (0.4 ± 0.1 nm) when compared to the nph-mv complex (0.16 ± 0.03 nm). This can be correlated to the molecular structure of pyrene and naphthol, the larger size of the surface of the pyrene molecule will allow a bigger relative displacement of the two molecules until the interaction is broken. Secondly, the lower dissociation rate constant of the pyr-mv complex (2 s−1) indicates that this complex is more stable than nph-mv (14 s−1), which is compatible with the higher equilibrium constant of the pyr-mv complex [11,33,34]. Moreover, the force vs. loading rate data of the nph-mv system are preferentially fitted to two different straight lines. The occurrence of different regimes of force vs. loading rate has been reported before for other supramolecular complexes and interpreted as the emergence of inner barriers of the potential [35,36,37]. However, at low loading rates the dependence of the rupture force on the loading rate seems to be null. This behavior has also been reported for fast rebinding π-π complexes probed at near-equilibrium, such as the interaction between pyrene and graphite [38]. A similar transition has been observed by increasing the temperature in DFS experiments using quadruple hydrogen-bonded dimmers [39]. This suggests that the nph-mv complex is being pulled close to thermodynamic equilibrium at low loading rates (under approx. 4000 pNs−1). The equilibrium rupture force for mv-nph ruptures (63 ± 20 pN) is much larger than the equilibrium rupture force observed for PVK-NBA (18 pN) and PVK-DBA (28 pN) complexes at loading rates ranging 15,000–75,000 pNs−1 [21]. However, it compares well with the TMPD-TCNQ rupture force (70 ± 15 pN) at a comparable loading rate (4500 pNs−1) [19]. Unfortunately, the TMPD-TCNQ complex was not studied at different loading rates, which would allow a comparison of the possible dynamic behavior. On the other hand, the pyr-mv complex appears to be pulled out-of-equilibrium at all explored loading rates, which agrees with the slower dissociation kinetics observed in this case.

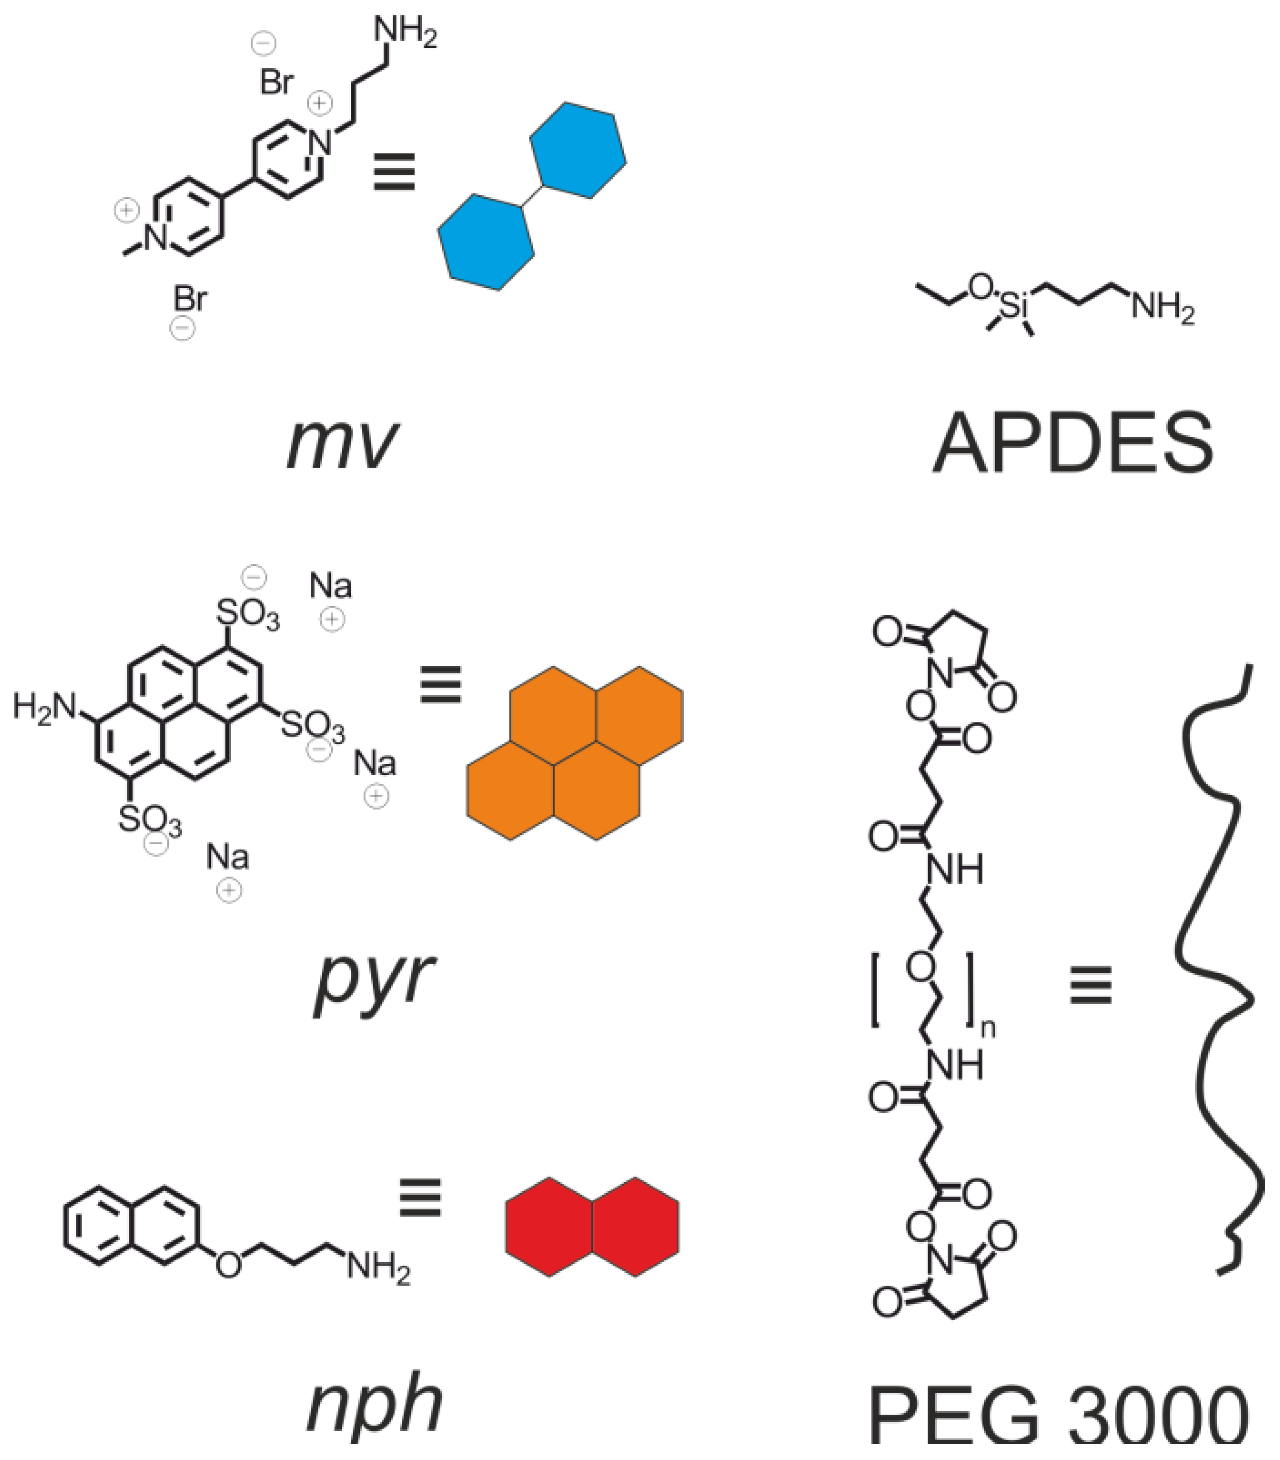
3. Experimental Section

All solvents were purchased from commercial sources and used as received unless explicitly noted. Aminopropyldimethylethoxysilane (APDES), PEG 3000 (NHS-terminated homobifunctional PEG, MW 3000) and 8-aminopyrene-1,3,6-trisulfonic acid trisodium salt (pyr) were purchased from ABCR and Sigma-Aldrich. Water was purified and deionized (MQ water, resistivity of 18.2 MΩcm−1).

3.1. 3-(2-Naphthyl)-oxy-aminopropane (nph)

A mixture of naphthol (1) (1.00 g, 6.93 mmol), 3-bromo-phthalamide (2) (1.85 g, 6.93 mmol), dry potassium carbonate (1.15g, 6.93 mmol) and 18-crown-6 ether in 60 mL of acetone was refluxed for 12 h. After cooling the mixture to room temperature, the volatiles were removed under reduced pressure. The reaction mixture was extracted with CH2Cl2. The organic layer was washed with water and dried over anhydrous MgSO4. The solvent was evaporated to obtain (3) as a white solid. Then, a mixture of (3) (0.50 g, 1.51 mmol), hydrazine (0.22 mL, 1.51 mmol) in 20 mL of ethanol was refluxed for 2 h. The mixture was then acidified to pH 1 with a solution of 1 M HCl and refluxed for 1.5 h. After this time, the pH was adjusted with a solution of 1 M NaOH and the mixture was extracted with CHCl3 and dried over anhydrous MgSO4. The volatiles were removed under pressure and a brownish solid was obtained. To this brownish solid CHCl3 was added and the white precipitated formed was filtered through celite. After removal the solvent, (4) was obtained as a brownish solid. Yield: 0.15 g, 49 %. 1H NMR (ppm): δ = 7.71–7.64 (m, CH, 3H), 7.39–7.26 (m, CH, 2H), 7.09–7.05 (m, CH, 2H), 4.11 (t, CH2, 3J(H,H) = 6.0 Hz, 2H), 3.62 (br, s), 2.90 (t, CH2, 3J(H,H) = 6.0 Hz, 2H), 1.94 (m, CH2, 3J(H,H) = 6.0 Hz, 2H). MS (ESI-ToF): m/z; 202.1 g/mol [M+H]+ (calc. 201.1 g/mol).

3.2. Substrate and AFM Cantilever Functionalization

Silicon substrates (about 1 cm2) were repeatedly washed in dichloromethane (DCM) and methanol. The substrates were oxidized in an oxygen plasma for 20 s and then immersed into a (1:200) solution of APDES in distilled dry toluene for 1 min. Then, they were rinsed with copious amounts of DCM. The amine terminated substrates were incubated for 2 h in a 200:1 DCM/N,N-Diisopropylethylamine (DIPEA) solution with PEG 3000 linker (NHS-PEG-NHS, 5 mg/ml, ~1 mM) and rinsed with DCM. The AFM cantilevers (MLCT, Bruker) were treated following the same procedure. The mv-terminated substrates were prepared incubating the substrates for 2 h in a solution of amino-terminated mv (1 mM) in 200:1 MQ water/DIPEA and rinsed with water. Finally, nph- or pyr-terminated tips were obtained by immersing the AFM cantilevers for 2 h in a solution of amino-terminated nph or pyr (1 mM) in 100:1 DCM/DIPEA or 200:1 MQ water/DIPEA, respectively, and rinsing with the corresponding solvent. The substrates and tips were kept in ultrapure water until they were used.

3.3. AFM Force Spectroscopy Measurements

All force measurements were performed with a commercial Multimode Picoforce SPM (Veeco, Digital Instruments, USA) using a liquid cell (Veeco) and saline aqueous solutions (10 mMNaCl in MQ water). The spring constants of the cantilevers were calibrated using the built-in thermal tuning software, resulting in typical values of 0.032 ± 0.006 N/m. Force-distance curves were acquired by approaching and retracting the tip at speeds ranging 500–3000 nm/s and a dwell time of 0.1 s. The tip was laterally displaced over the substrate between approach-retraction cycles, covering 1 µm2, and the maximum force applied to the surface was kept under 500 pN. Approx. 5000 curves per cantilever could be obtained, limited by the appearance of high adhesion between the tip and surface and a large decrease in the chance of observing polymer stretching. This we attribute to deterioration of the monolayers due to the repeated contact or adsorption of contaminants on the tip.

3.4. Data Analysis

We selected relevant force curves using our own plug-in script developed for Hooke [28]. Each curve (see a typical example in Figure 8) was examined for sudden changes in force (rupture events), then the data prior to the last rupture (the unbinding event happening farthest away from the surface) were fitted using a modified FJC model with a fixed Kuhn length of 7 Å [40] and the contour length was the fit parameter, and a WLC model where both the persistence length and the contour length were fit parameters. Rupture events were rejected or kept for further analysis based on the quality of the fit, which was assessed visually by comparing both fits, and numerically by comparing the fitted persistence length to the expected value of 3.5–3.8 Å, in the case of WLC fits. In the case of the FJC fits, the averaged force difference from each data point to the corresponding fitted force was compared with the standard deviation of the measured force in the non-contact area. If the ratio of these two parameters is close to 1, the difference between the fit and data can be explained by thermal noise. Pairs of rupture force and instantaneous loading rate were obtained from the valid events and an estimation of the rupture force and loading rate probability densities was obtained with the help of the statistical package R [41] by using kernel density estimation with Epanechnikov kernels and a fixed bandwidth of 10 pN in the case of force or an automatically selected bandwidth (Sheather and Jones algorithm) [42] in the case of loading rate. The resulting densities are shown in Figure 9, Figure 10.
Figure 8. Typical examples of raw experimental data of the nph- (A) and pyr (B)-mv CT complex.
Polymers 05 00269 g008
Figure 9. DFS results of the nph-mv CT complex. Density of probability for rupture force (top row) and instantaneous loading rate (bottom row) at different retraction speeds (columns).
Polymers 05 00269 g009
Figure 10. DFS results of the pyr-mv CT complex. Density of probability for rupture force (top row) and instantaneous loading rate (bottom row) at different retraction speeds (columns). The ticks in the horizontal axis indicate individual measurements.
Polymers 05 00269 g010

4. Conclusions

The rupture forces of two different CT complexes were measured at the single molecule level over a range of retraction speeds. In the case of the nph-mv complex, a transition from near-equilibrium to a loading-rate dependent behavior was observed with increasing loading rate, while the pyr-mv complex was probed far from equilibrium at all loading rates applied here. The dissociation rate constants obtained from fits of a theoretical model to the data confirm an enhanced stability of the pyr-mv complex compared to the nph-mv complex. The differences in potential width and dissociation rate constant appear to be qualitatively in concert with the differences in molecular structure of the donors. This study adds to the understanding of the kinetic behavior of CT interactions [43], which can be useful for the design of DNA intercalating drugs with improved stability and presumably will influence the reversibility of structures relying on this type of interaction such as layer-by-layer assemblies.

Acknowledgments

This work has been supported by the Dutch nanotechnology network NanoNed (Project No. TPC 6939) for financial support. AGC thanks Agaur-Beatriu de Pinós for a fellowship. PJ thanks the Netherlands Organisation for Scientific Research (NWO) for financial support.

References

  1. Shifrin, S. Charge-transfer complexes in biological systems. Ann. N.Y. Acad. Sci. 1969, 158, 148–160. [Google Scholar] [CrossRef]
  2. Gutmann, F.; Johnson, C.; Keyzer, H.; Molnar, J. Charge Transfer Complexes in Biological Systems; CRC Press: New York, NY, USA, 1997. [Google Scholar]
  3. Liao, L.B.; Zhou, H.Y.; Xiao, X.M. Spectroscopic and viscosity study of doxorubicin interaction with DNA. J. Mol. Struct. 2005, 749, 108–113. [Google Scholar] [CrossRef]
  4. Shimazaki, Y.; Mitsuishi, M.; Ito, S.; Yamamoto, M. Preparation of the layer-by-layer deposited ultrathin film based on the charge-transfer interaction. Langmuir 1997, 13, 1385–1387. [Google Scholar] [CrossRef]
  5. Ju, Z.-F.; Yao, Q.-X.; Wu, W.; Zhang, J. Strong electron-accepting methylviologen dication confined in magnetic hosts: synthesis, structural characterization, charge-transfer and magnetic properties of {(MV)2[Ni(SCN)5]·Cl·2H2O}n and {(MV)[M(N3)2(SCN)2]}n (M = Mn, Co). Dalton Trans. 2008, 3, 355–362. [Google Scholar]
  6. Prasad, D.R.; Hoffman, M.Z. Charge-transfer complexation between methyl viologen and sacrificial electron donors EDTA, triethanolamine, and cysteine. J. Phys. Chem. 1984, 88, 5660–5665. [Google Scholar] [CrossRef]
  7. Nakahara, A.; Wang, J.H. Charge-transfer complexes of methylviologen. J. Phys. Chem. 1963, 67, 496–498. [Google Scholar] [CrossRef]
  8. Monk, P.M.S.; Hodgkinson, N.M. Charge-transfer complexes of the viologens: effects of complexation and the rate of electron transfer to methyl viologen. Electrochim. Acta 1998, 43, 245–55. [Google Scholar] [CrossRef]
  9. Atherton, S.J.; Hubig, S.M.; Callan, T.J.; Duncanson, J.A.; Snowden, P.T.; Rodgers, M.A.J. Photoinduced charge separation in a micelle-induced charge-transfer complex between methylviologen and ethidium ions: a picosecond absorption spectroscopy study. J. Phys. Chem. 1987, 91, 3137–3140. [Google Scholar] [CrossRef]
  10. Kinuta, T.; Kise, Y.; Kamon, K.; Tajima, N.; Sato, T.; Kuroda, R.; Matsubara, Y.; Imai, Y. Charge-transfer host complex with channel-like cavity using disubstituted-1,1′-bi-2-naphthol and benzylviologen. Tetrahedron Lett. 2009, 50, 5786–5789. [Google Scholar] [CrossRef]
  11. Wang, C.; Guo, Y.; Wang, Y.; Xu, H.; Wang, R.; Zhang, X. Supramolecular amphiphiles based on a water-soluble charge-transfer complex: fabrication of ultralong nanofibers with tunable straightness. Angew. Chem. Int. Ed. 2009, 48, 8962–8965. [Google Scholar]
  12. Hariharan, M.; Joseph, J.; Ramaiah, D. Novel bifunctional viologen-linked pyrene conjugates:Synthesis and study of their interactions with nucleosides and DNA. J. Phys. Chem. B 2006, 110, 24678–24686. [Google Scholar] [CrossRef]
  13. Kang, J.-K.; Hwang, I.; Ko, Y.H.; Jeon, W.S.; Kim, H.-J.; Kim, K. Electrochemically controllable reversible formation of cucurbit[8]uril-stabilized charge-transfer complex on surface. Supramol. Chem. 2008, 20, 149–155. [Google Scholar] [CrossRef]
  14. Rauwald, U.; Scherman, O.A. Supramolecular block copolymers with cucurbit[8]uril in water. Angew. Chem. Int. Ed. 2008, 47, 3950–3953. [Google Scholar] [CrossRef]
  15. Bizzarri, A.R.; Cannistraro, S. The application of atomic force spectroscopy to the study of biological complexes undergoing a biorecognition process. Chem. Soc. Rev. 2010, 39, 734–749. [Google Scholar] [CrossRef]
  16. Carvalho, F.A.; Connell, S.; Miltenberger-Miltenyi, G.; Pereira, S.n.V.; Tavares, A.; Ariens, R.A.S.; Santos, N.C. Atomic force microscopy-based molecular recognition of a fibrinogen receptor on human erythrocytes. ACS Nano 2010, 4, 4609–4620. [Google Scholar] [CrossRef]
  17. Embrechts, A.; Schönherr, H.; Vancso, G.J. Rupture force of single supramolecular bonds in associative polymers by AFM at fixed loading rates. J. Phys. Chem. B 2008, 112, 7359–7362. [Google Scholar] [CrossRef]
  18. Evans, E.; Ritchie, K. Dynamic strength of molecular adhesion bonds. Biophys. J. 1997, 72, 1541–1555. [Google Scholar] [CrossRef]
  19. Skulason, H.; Frisbie, C.D. Direct detection by atomic force microscopy of single bond forces associated with the rupture of discrete charge-transfer complexes. J. Am. Chem. Soc. 2002, 124, 15125–15133. [Google Scholar] [CrossRef]
  20. Gil, R.; Guillerez, M.G.; Poulin, J.C.; Schulz, E. Charge-transfer complex study by chemical force spectroscopy: a dynamic force spectroscopic approach. Langmuir 2007, 23, 542–548. [Google Scholar] [CrossRef]
  21. Yu, Y.; Yao, Y.; Wang, L.; Li, Z. Charge-transfer interaction between poly(9-vinylcarbazole) and 3,5-dinitrobenzamido group or 3-nitrobenzamido group. Langmuir 2010, 26, 3275–3279. [Google Scholar] [CrossRef]
  22. Hutter, J.L.; Bechhoefer, J. Calibration of atomic-force microscope tips. Rev. Sci. Instrum. 1993, 64, 1868–1873. [Google Scholar]
  23. Sader, J.E.; Chon, J.W.M.; Mulvaney, P. Calibration of rectangular atomic force microscope cantilevers. Rev. Sci. Instrum. 1999, 70, 3967–3969. [Google Scholar] [CrossRef]
  24. Hinterdorfer, P.; Kienberger, F.; Raab, A.; Gruber, H.J.; Baumgartner, W.; Kada, G.; Riener, C.; Wielert-Badt, S.; Borken, C.; Schindler, H. Poly(ethylene glycol): an ideal spacer for molecular recognition force microscopy/spectroscopy. Single Mol. 2000, 1, 99–103. [Google Scholar] [CrossRef]
  25. Christian, K.R.; Borken, C.; Kienberger, K.; Schindler, H.; Hinterdorfer, P.; Gruber, H.J. Collection of long, flexible PEG-crosslinkers for molecular recognition force microscopy on single molecules. Single Mol. 2001, 2, 127–128. [Google Scholar] [CrossRef]
  26. Evans, E. Probing the relation between force—lifetime—and chemistry in single molecular bonds. Annu. Rev. Biophys. Biomol. Struct. 2001, 30, 105–128. [Google Scholar] [CrossRef]
  27. Ratto, T.V.; Langry, K.C.; Rudd, R.E.; Balhorn, R.L.; Allen, M.J.; McElfresh, M.W. Force spectroscopy of the double-tethered concanavalin-A mannose bond. Biophys. J. 2004, 86, 2430–2437. [Google Scholar] [CrossRef]
  28. Sandal, M.; Benedetti, F.; Brucale, M.; Gomez-Casado, A.; Samori, B. Hooke: an open software platform for force spectroscopy. Bioinformatics 2009, 25, 1428–1430. [Google Scholar] [CrossRef]
  29. Gomez-Casado, A.; Dam, H.H.; Yilmaz, M.D.; Florea, D.; Jonkheijm, P.; Huskens, J. Probing multivalent interactions in a synthetic host–guest complex by dynamic force spectroscopy. J. Am. Chem. Soc. 2011, 133, 10849–10857. [Google Scholar]
  30. Raible, M.; Evstigneev, M.; Bartels, F.W.; Eckel, R.; Nguyen-Duong, M.; Merkel, R.; Ros, R.; Anselmetti, D.; Reimann, P. Theoretical analysis of single-molecule force spectroscopy experiments: heterogeneity of chemical bonds. Biophys. J. 2006, 90, 3851–3864. [Google Scholar] [CrossRef]
  31. Gu, C.; Kirkpatrick, A.; Ray, C.; Guo, S.; Akhremitchev, B.B. Effects of multiple-bond ruptures in force spectroscopy measurements of interactions between fullerene C60-molecules in water. J. Phys. Chem. C 2008, 112, 5085–5092. [Google Scholar]
  32. Guo, S.; Ray, C.; Kirkpatrick, A.; Lad, N.; Akhremitchev, B.B. Effects of multiple-bond ruptures on kinetic parameters extracted from force spectroscopy measurements: Revisiting biotin-streptavidin interactions. Biophys. J. 2008, 95, 3964–3976. [Google Scholar] [CrossRef]
  33. Hsiao, J.-S.; Eckert, A.R.; Webber, S.E. Excited-state electron transfer from anthracene and pyrene covalently end-tagged onto poly(ethylene oxide). J. Phys. Chem. 1994, 98, 12032–12039. [Google Scholar]
  34. Hwang, J.H.; Lee, K.S.; Lee, S.; Park, W.J. An NMR study on the conformation of naphthalene–viologen linked compounds: effect of flexible spacer length. J. Chem. Soc. Perkin Trans. 1999, 2, 1081–1086. [Google Scholar]
  35. Odorico, M.; Teulon, J.M.; Bessou, T.; Vidaud, C.; Bellanger, L.; Chen, S.W.; Quemeneur, E.; Parot, P.; Pellequer, J.L. Energy landscape of chelated uranyl: antibody interactions by dynamic force spectroscopy. Biophys. J. 2007, 93, 645–654. [Google Scholar] [CrossRef]
  36. Evans, E. Looking inside molecular bonds at biological interfaces with dynamic force spectroscopy. Biophys. Chem. 1999, 82, 83–97. [Google Scholar] [CrossRef]
  37. Merkel, R.; Nassoy, P.; Leung, A.; Ritchie, K.; Evans, E. Energy landscapes of receptor-ligand bonds explored with dynamic force spectroscopy. Nature 1999, 397, 50–53. [Google Scholar]
  38. Zhang, Y.; Liu, C.; Shi, W.; Wang, Z.; Dai, L.; Zhang, X. Direct measurements of the interaction between pyrene and graphite in aqueous media by single molecule force spectroscopy: Understanding the π−π interactions. Langmuir 2007, 23, 7911–7915. [Google Scholar] [CrossRef]
  39. Zou, S.; Schönherr, H.; Vancso, G.J. Force spectroscopy of quadruple H-bonded dimers by AFM: Dynamic bond rupture and molecular time-temperature superposition. J. Am. Chem. Soc. 2005, 127, 11230–11231. [Google Scholar]
  40. Oesterhelt, F.; Rief, M.; Gaub, H.E. Single molecule force spectroscopy by AFM indicates helical structure of poly(ethylene-glycol) in water. New J. Phys. 1999, 1, 1–11. [Google Scholar] [CrossRef]
  41. RDC-Team. Available online: http://www.R-project.org (accessed on 1 April 2012).
  42. Sheather, S.J.; Jones, M.C. A reliable data-based bandwidth selection method for Kernel density estimation. J. R. Statist. Soc. B 1991, 53, 683–690. [Google Scholar]
  43. Lin, C.; Chinnappan, R.; Acharya, K.; Pellequer, J.L.; Jankowiak, R. On stabilization of a neutral aromatic ligand by π-cation interactions in monoclonal antibodies. Biophys. Chem. 2011, 154, 35–40. [Google Scholar]

