
Photothermal Catalysis of Cellulose to Prepare Levulinic Acid-Rich Bio-Oil

 and
and
Abstract
1. Introduction
2. Materials and Methods
2.1. Materials and Reagents
2.2. Experimental Method
2.2.1. Preparation of Catalyst
2.2.2. Photothermal Catalysis Experiment
2.3. Catalyst Characterization and Product Detection
2.3.1. Characterization and Analysis of the Catalyst
2.3.2. Detection and Analysis of Bio-Oil
3. Results and Discussion
3.1. The Effects of Photothermal Catalysis and Catalysts on the Depolymerization of Cellulose
3.2. Characterization and Analysis of Catalysts
3.3. Analysis of Pyrolysis Products
3.4. Photothermal Catalytic Condition
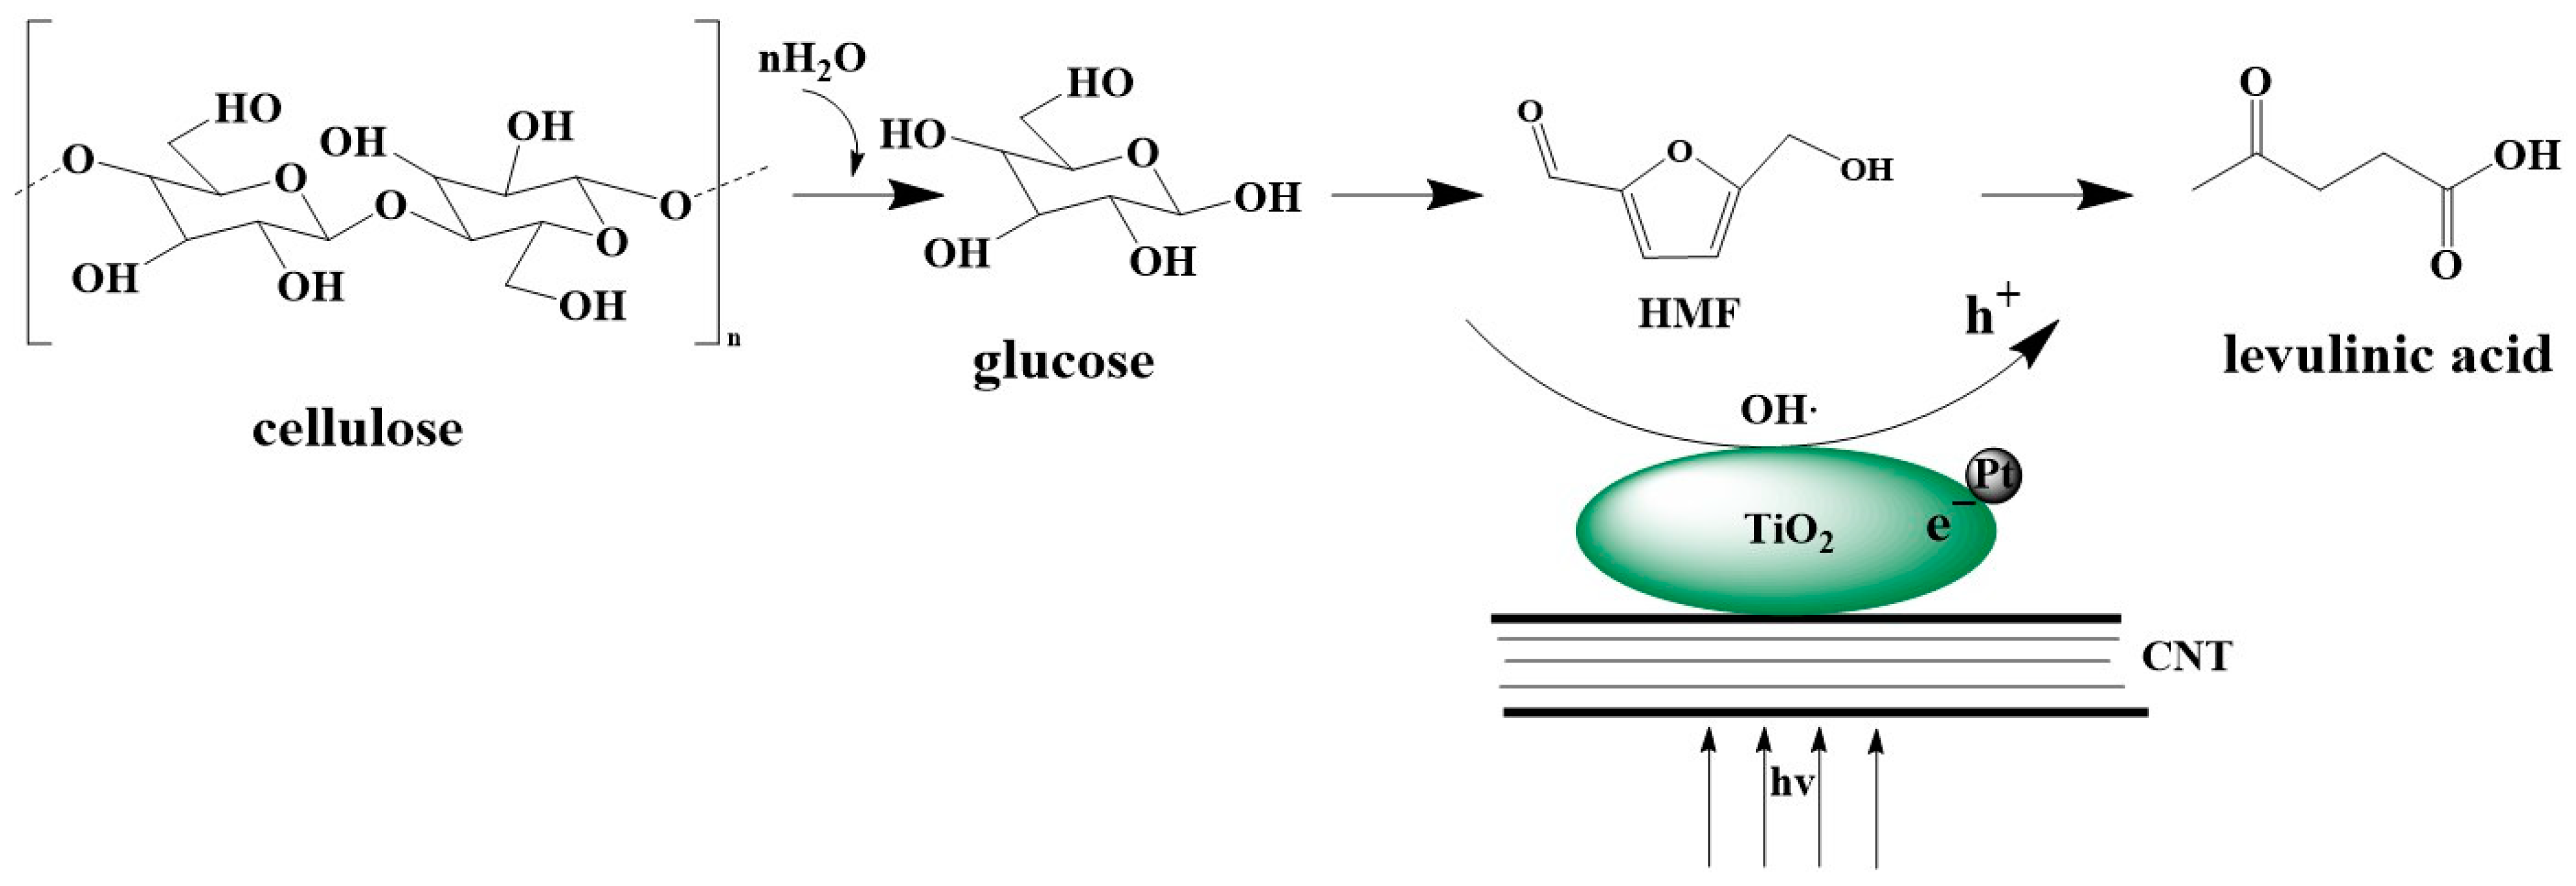
3.5. Proposed Reaction Mechanism
4. Conclusions
- (1)
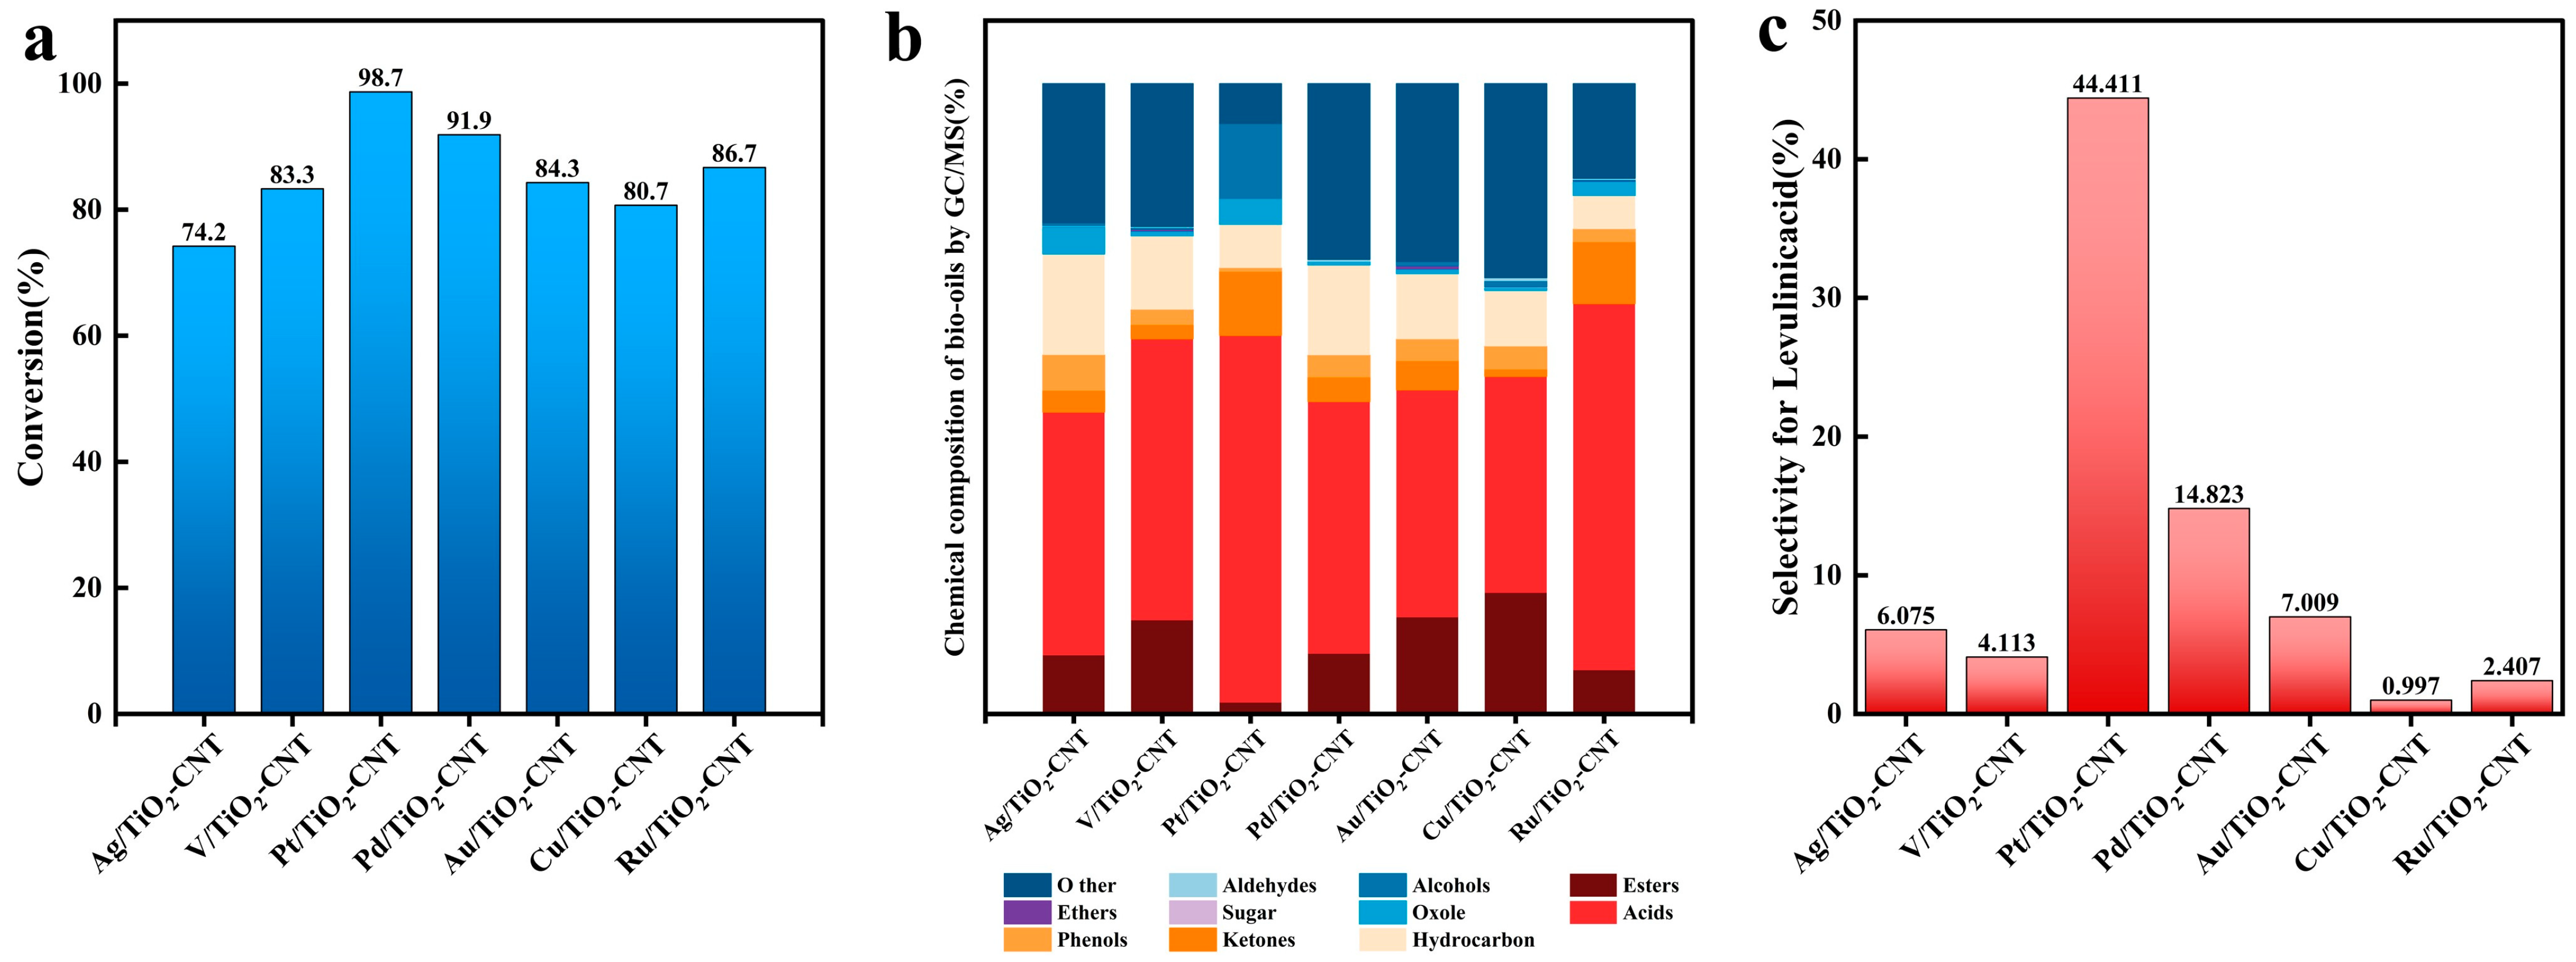
- A synergistic effect between heating and photocatalysis is present in cellulose degradation. TiO2-CNT loaded Pt exhibits the best cellulose photocatalytic performance, followed by Pd, Ru, Au, V, and Cu.
- (2)
- Photothermal catalysis increased the H/C ratio and decreased the O/C ratio of the liquid product. The calorific value of the liquid product was 21.01 MJ/kg, which was significantly higher than that of the original cellulose (13.17 MJ/kg) and that in other research (15.50 MJ/kg). Cellulose is efficiently converted into bio-oil under mild conditions.
- (3)
- Using Pt/TiO2-CNT as a catalyst, the conversion of cellulose bio-oil reached 99.44%, and the selectivity of LA reached 44.4% at 220 °C for 3 h.
Author Contributions
Funding
Institutional Review Board Statement
Data Availability Statement
Conflicts of Interest
References
- Wang, M.; Ma, J.; Liu, H.; Luo, N.; Zhao, Z.; Wang, F. Sustainable Productions of Organic Acids and Their Derivatives from Biomass via Selective Oxidative Cleavage of C–C Bond. ACS Catal. 2018, 8, 2129–2165. [Google Scholar] [CrossRef]
- Shrotri, A.; Kobayashi, H.; Fukuoka, A. Cellulose Depolymerization over Heterogeneous Catalysts. Acc. Chem. Res. 2018, 51, 761–768. [Google Scholar] [CrossRef] [PubMed]
- Xia, H.; Yan, X.; Xu, S.; Yang, L.; Ge, Y.; Wang, J.; Zuo, S. Effect of Zn/ZSM-5 and FePO4 Catalysts on Cellulose Pyrolysis. J. Chem. 2015, 2015, e749875. [Google Scholar] [CrossRef]
- Ding, Y.; Shan, B.; Cao, X.; Liu, Y.; Huang, M.; Tang, B. Development of Bio Oil and Bio Asphalt by Hydrothermal Liquefaction Using Lignocellulose. J. Clean. Prod. 2021, 288, 125586. [Google Scholar] [CrossRef]
- Bounoukta, C.E.; Megías-Sayago, C.; Ammari, F.; Ivanova, S.; Monzon, A.; Centeno, M.A.; Odriozola, J.A. Dehydration of Glucose to 5-Hydroxymethlyfurfural on Bifunctional Carbon Catalysts. Appl. Catal. B 2021, 286, 119938. [Google Scholar] [CrossRef]
- Liu, C.; Wei, L.; Yin, X.; Pan, X.; Hu, J.; Li, N.; Xu, J.; Jiang, J.; Wang, K. Synthesis of Furfural from Xylan in γ-Valerolactone/Molten Salt Hydrate Biphasic System. Chem. Eng. J. 2021, 425, 130608. [Google Scholar] [CrossRef]
- Zhu, S.; Liu, H.; Wang, S.; Gao, X.; Wang, P.; Wang, J.; Fan, W. One-Step Efficient Non-Hydrogen Conversion of Cellulose into γ-Valerolactone over AgPW/CoNi@NG Composite. Appl. Catal. B Environ. 2021, 284, 119698. [Google Scholar] [CrossRef]
- Wang, H.; Cheng, X.; Li, Z.; Jing, L.; Hu, J. Photothermal Catalytic Enhancement of Lignocellulosic Biomass Conversion: A More Efficient Way to Produce High-Value Products and Fuels. Chem. Eng. J. 2024, 496, 153772. [Google Scholar] [CrossRef]
- Shen, D.K.; Gu, S.; Bridgwater, A.V. The Thermal Performance of the Polysaccharides Extracted from Hardwood: Cellulose and Hemicellulose. Carbohydr. Polym. 2010, 82, 39–45. [Google Scholar] [CrossRef]
- Lee, S.E.; Lim, J.S.; Park, Y.-K.; Shong, B.; Lee, H. Utilizing Cocoa Bean Husk Residues from Supercritical Extraction for Biofuel Production through Hydrothermal Liquefaction. J. Supercrit. Fluids 2025, 215, 106416. [Google Scholar] [CrossRef]
- Elliott, D.C.; Hart, T.R. Catalytic Hydroprocessing of Chemical Models for Bio-Oil. Energy Fuels 2009, 23, 631–637. [Google Scholar] [CrossRef]
- Mohan, D.; Pittman, C.U., Jr.; Steele, P.H. Pyrolysis of Wood/Biomass for Bio-Oil: A Critical Review. Energy Fuels 2006, 20, 848–889. [Google Scholar] [CrossRef]
- Zhang, X.H.; Chen, H.S.; Dou, B.L.; Tan, C.Q. Research progress in production, property and industrial application of bio-oil. Chem. Ind. Eng. Prog. 2011, 30, 2404–2416. [Google Scholar] [CrossRef]
- Li, Q.; Liu, D.; Song, L.; Hou, X.; Wu, C.; Yan, Z. Efficient Hydro-Liquefaction of Woody Biomass over Ionic Liquid Nickel Based Catalyst. Ind. Crops Prod. 2018, 113, 157–166. [Google Scholar] [CrossRef]
- Liu, Q.-Y.; Wang, P.; Zhang, F.-G.; Yuan, Y.-J. Visible-Light-Driven Photocatalytic Cellulose-to-H2 Conversion by MoS2/ZnIn2S4 Photocatalyst with Cellulase Assistance. ChemPhysChem 2022, 23, e202200319. [Google Scholar] [CrossRef]
- Shi, C.; Kang, F.; Zhu, Y.; Teng, M.; Shi, J.; Qi, H.; Huang, Z.; Si, C.; Jiang, F.; Hu, J. Photoreforming Lignocellulosic Biomass for Hydrogen Production: Optimized Design of Photocatalyst and Photocatalytic System. Chem. Eng. J. 2023, 452, 138980. [Google Scholar] [CrossRef]
- Luo, S.; Ren, X.; Lin, H.; Song, H.; Ye, J. Plasmonic Photothermal Catalysis for Solar-to-Fuel Conversion: Current Status and Prospects. Chem. Sci. 2021, 12, 5701–5719. [Google Scholar] [CrossRef]
- Zhang, H.; Hou, L.; Zhang, W.; Lin, Y.; Liu, X.; Zhao, S.; Chang, C. Coupling Process for Preparing Biomass-Based Furfural and Levulinic Acid from Corncob: Extraction, Green Chemistry and Techno-Economic Assessment. Bioresour. Technol. 2024, 394, 130301. [Google Scholar] [CrossRef]
- Liu, Y.H.; Wang, S.Q.; Yang, J.T.; Cui, Z.P.; Liu, S.J.; Li, Z.H. Effect of ZnCl2 pretreatment on pyrolysis characteristics of corncob. Acta Energiae Solaris Sin. 2018, 39, 2561–2568. [Google Scholar]
- Pan, X.; Mei, S.; Huang, G.-X.; Ji, X.; Liu, W.-J.; Yu, H.-Q. Efficient Conversion of the Lignocellulosic Biomass Waste into 5-Hydroxymethylfurfural-Enriched Bio-Oil and Co Nanoparticle-Functionalized Biochar. ACS EST Eng. 2021, 1, 895–904. [Google Scholar] [CrossRef]
- Zhang, G.; Ni, C.; Huang, X.; Welgamage, A.; Lawton, L.A.; Robertson, P.K.J.; Irvine, J.T.S. Simultaneous Cellulose Conversion and Hydrogen Production Assisted by Cellulose Decomposition under UV-Light Photocatalysis. Chem. Commun. 2016, 52, 1673–1676. [Google Scholar] [CrossRef]
- Zhao, H.; Liu, P.; Wu, X.; Wang, A.; Zheng, D.; Wang, S.; Chen, Z.; Larter, S.; Li, Y.; Su, B.-L.; et al. Plasmon Enhanced Glucose Photoreforming for Arabinose and Gas Fuel Co-Production over 3DOM TiO2-Au. Appl. Catal. B Environ. 2021, 291, 120055. [Google Scholar] [CrossRef]
- Li, Z.; Gao, B.; Chen, G.Z.; Mokaya, R.; Sotiropoulos, S.; Li Puma, G. Carbon Nanotube/Titanium Dioxide (CNT/TiO2) Core–Shell Nanocomposites with Tailored Shell Thickness, CNT Content and Photocatalytic/Photoelectrocatalytic Properties. Appl. Catal. B Environ. 2011, 110, 50–57. [Google Scholar] [CrossRef]
- Mao, T.; Zha, J.; Hu, Y.; Chen, Q.; Zhang, J.; Luo, X. Research Progress of TiO2 Modification and Photodegradation of Organic Pollutants. Inorganics 2024, 12, 178. [Google Scholar] [CrossRef]
- Liu, R.; Tian, M.; Shang, W.; Cui, J.; Zhao, D.; Liu, S.; Zhao, Y.; Ding, H.; Fu, J. Normal Temperature Catalytic Degradation of Toluene over Pt/TiO2. Environ. Technol. 2022, 43, 2047–2058. [Google Scholar] [CrossRef]
- Huang, Y.-F.; Lo, S.-L. Predicting Heating Value of Lignocellulosic Biomass Based on Elemental Analysis. Energy 2020, 191, 116501. [Google Scholar] [CrossRef]
- Jia, Y.; Wang, M.; Li, B.; Liu, J.; Song, X.; Wu, M.; Yin, Y. Co-Pyrolysis of Waste Plastics and Black Liquor Catalyzed by Mo-Ni/HZSM-5 for Preparing High-Quality Bio-Oil. J. Anal. Appl. Pyrolysis 2024, 180, 106540. [Google Scholar] [CrossRef]
- He, Y.; Liu, R.; Yellezuome, D.; Peng, W.; Tabatabaei, M. Upgrading of Biomass-Derived Bio-Oil via Catalytic Hydrogenation with Rh and Pd Catalysts. Renew. Energy 2022, 184, 487–497. [Google Scholar] [CrossRef]
- Chen, M.; Shi, J.; Wang, Y.; Tang, Z.; Yang, Z.; Wang, J.; Zhang, H. Conversion of Kraft Lignin to Phenol Monomers and Liquid Fuel over Trimetallic Catalyst W-Ni-Mo/Sepiolite under Supercritical Ethanol. Fuel 2021, 303, 121332. [Google Scholar] [CrossRef]
- Guo, M.Y.; Liu, F.; Leung, Y.H.; Ng, A.M.C.; Djurišić, A.B.; Chan, W.K. TiO2–Carbon Nanotube Composites for Visible Photocatalysts—Influence of TiO2 Crystal Structure. Curr. Appl Phys. 2013, 13, 1280–1287. [Google Scholar] [CrossRef]
- Hassan, N.S.; Jalil, A.A.; Hitam, C.N.C.; Vo, D.V.N.; Nabgan, W. Biofuels and Renewable Chemicals Production by Catalytic Pyrolysis of Cellulose: A Review. Environ. Chem. Lett. 2020, 18, 1625–1648. [Google Scholar] [CrossRef]
- Maduskar, S.; Maliekkal, V.; Neurock, M.; Dauenhauer, P.J. On the Yield of Levoglucosan from Cellulose Pyrolysis. ACS Sustain. Chem. Eng. 2018, 6, 7017–7025. [Google Scholar] [CrossRef]
- Zhang, F.-J.; Oh, W.-C.; Choi, J.-G.; Zhang, K.; Meng, Z.-D.; Chen, M.-L. Photoelectrocatalytic Degradation of Methylene Blue Over M-CNT/TiO2 (M = Y, Ag, and Pt) Composite Electrodes. Fuller. Nanotub. Carbon Nanostruct. 2011, 19, 564–574. [Google Scholar] [CrossRef]
- Batalović, K.; Bundaleski, N.; Radaković, J.; Abazović, N.; Mitrić, M.; Silva, R.A.; Savić, M.; Belošević-Čavor, J.; Rakočević, Z.; Rangel, C.M. Modification of N-Doped TiO2 Photocatalysts Using Noble Metals (Pt, Pd)—A Combined XPS and DFT Study. Phys. Chem. Chem. Phys. 2017, 19, 7062–7071. [Google Scholar] [CrossRef]
- Liang, H.L.; Ren, P.; Xu, H.J.; Li, G.H.; Wang, C.P.; Bi, G.P. Preparation and performance of Ag/CNT-TiO2 photocatalyst. New Chem. Mater. 2020, 48, 281–285. [Google Scholar] [CrossRef]
- Choi, W.; Jo, H.; Choi, J.-W.; Suh, D.J.; Lee, H.; Kim, C.; Kim, K.H.; Lee, K.-Y.; Ha, J.-M. Stabilization of Acid-Rich Bio-Oil by Catalytic Mild Hydrotreating. Environ. Pollut. 2021, 272, 116180. [Google Scholar] [CrossRef]
- Polidoro, D.; Stamilla, G.; Feltracco, M.; Gambaro, A.; Perosa, A.; Selva, M. CO2-Assisted Hydrolytic Hydrogenation of Cellulose and Cellulose-Based Waste into Sorbitol over Commercial Ru/C. Green Chem. 2023, 25, 6677–6685. [Google Scholar] [CrossRef]
- Weingarten, R.; Conner, W.C.; Huber, G.W. Production of Levulinic Acid from Cellulose by Hydrothermal Decomposition Combined with Aqueous Phase Dehydration with a Solid Acid Catalyst. Energy Environ. Sci. 2012, 5, 7559–7574. [Google Scholar] [CrossRef]
- Yang, H.; Wang, L.; Jia, L.; Qiu, C.; Pang, Q.; Pan, X. Selective Decomposition of Cellulose into Glucose and Levulinic Acid over Fe-Resin Catalyst in NaCl Solution under Hydrothermal Conditions. Ind. Eng. Chem. Res. 2014, 53, 6562–6568. [Google Scholar] [CrossRef]
- Shenjie, L.; Zelin, H.; Na, M.; Zhi, G.; Kangzhong, S.; Tongtong, W.; Long, L.; Licheng, L. High-Pressure Steam Treatment with Pt/TiO2 Enhances the Low Temperature Formaldehyde Oxidation Performance. Appl. Surf. Sci. 2023, 620, 156815. [Google Scholar] [CrossRef]
- Chang, J.-H.; Wang, Y.-L.; Dong, C.-D.; Shen, S.-Y. Electrocatalytic Degradation of Azo Dye by Vanadium-Doped TiO2 Nanocatalyst. Catalysts 2020, 10, 482. [Google Scholar] [CrossRef]
- Sharma, V.; Kaur, M.; Bhandari, S. Performance Investigation of High Velocity Flame Sprayed Multi-Dimensional Ni-TiO2 and Ni-TiO2-Al2O3 Coated Hydro Turbine Steel under Slurry Erosion. Wear 2020, 462–463, 203498. [Google Scholar] [CrossRef]
- Li, H.; Bian, Z.; Zhu, J.; Huo, Y.; Li, H.; Lu, Y. Mesoporous Au/TiO2 Nanocomposites with Enhanced Photocatalytic Activity. J. Am. Chem. Soc. 2007, 129, 4538–4539. [Google Scholar] [CrossRef]
- Hu, L.; Ma, L.; Hu, G.; Zhang, W.; Liu, Y.; Xu, R.; Ge, W.; Chen, Y. Utilization of Illumination and Thermal Field in the Preparation of Jet–Fuel Components: The Photothermic Catalysis of Jatropha Oil over the M/TiO2–HZSM–5. Energy 2022, 239, 122209. [Google Scholar] [CrossRef]
- Zhang, W.; Chen, Y.; Zhuang, S.; Li, R.; Hu, L. Acid-Etched Pt/Al-MCM-41 Catalysts for Fuel Production by One-Step Hydrotreatment of Jatropha Oil. GCB Bioenergy 2021, 13, 679–690. [Google Scholar] [CrossRef]
- Batalha, N.; Astafan, A.; Dos Reis, J.C.; Pouilloux, Y.; Bouchy, C.; Guillon, E.; Pinard, L. Hydroisomerization of N-Hexadecane over Bifunctional Pt-HBEA Catalysts. Influence of Si/Al Ratio on Activity Selectivity. React. Kinet. Mech. Catal. 2015, 114, 661–673. [Google Scholar] [CrossRef]
- Sui, X.-L.; Wang, Z.-B.; Li, C.-Z.; Zhang, J.-J.; Zhao, L.; Gu, D.-M. Effect of Core/Shell Structured TiO2@C Nanowire Support on the Pt Catalytic Performance for Methanol Electrooxidation. Catal. Sci. Technol. 2016, 6, 3767–3775. [Google Scholar] [CrossRef]
- Okpalugo, T.I.T.; Papakonstantinou, P.; Murphy, H.; McLaughlin, J.; Brown, N.M.D. High Resolution XPS Characterization of Chemical Functionalised MWCNTs and SWCNTs. Carbon 2005, 43, 153–161. [Google Scholar] [CrossRef]
- Xia, W.; Wang, Y.; Bergsträßer, R.; Kundu, S.; Muhler, M. Surface Characterization of Oxygen-Functionalized Multi-Walled Carbon Nanotubes by High-Resolution X-Ray Photoelectron Spectroscopy and Temperature-Programmed Desorption. Appl. Surf. Sci. 2007, 254, 247–250. [Google Scholar] [CrossRef]
- Ma, L.; Chen, A.; Lu, J.; Zhang, Z.; He, H.; Li, C. In Situ Synthesis of CNTs/Fe–Ni/TiO2 Nanocomposite by Fluidized Bed Chemical Vapor Deposition and the Synergistic Effect in Photocatalysis. Particuology 2014, 14, 24–32. [Google Scholar] [CrossRef]
- Lou, Y.; Ma, J.; Hu, W.; Dai, Q.; Wang, L.; Zhan, W.; Guo, Y.; Cao, X.-M.; Guo, Y.; Hu, P.; et al. Low-Temperature Methane Combustion over Pd/H-ZSM-5: Active Pd Sites with Specific Electronic Properties Modulated by Acidic Sites of H-ZSM-5. ACS Catal. 2016, 6, 8127–8139. [Google Scholar] [CrossRef]
- Zhang, M.; Shao, C.; Guo, Z.; Zhang, Z.; Mu, J.; Cao, T.; Liu, Y. Hierarchical Nanostructures of Copper(II) Phthalocyanine on Electrospun TiO2 Nanofibers: Controllable Solvothermal-Fabrication and Enhanced Visible Photocatalytic Properties. ACS Appl. Mater. Interfaces 2011, 3, 369–377. [Google Scholar] [CrossRef] [PubMed]
- Chen, L.; Chen, F.; Shi, Y.; Zhang, J. Preparation and Visible Light Photocatalytic Activity of a Graphite-Like Carbonaceous Surface Modified TiO2 Photocatalyst. J. Phys. Chem. C 2012, 116, 8579–8586. [Google Scholar] [CrossRef]
- Yang, H.N.; Lee, W.H.; Choi, B.S.; Kim, W.J. Preparation of Nafion/Pt-Containing TiO2/Graphene Oxide Composite Membranes for Self-Humidifying Proton Exchange Membrane Fuel Cell. J. Membr. Sci. 2016, 504, 20–28. [Google Scholar] [CrossRef]
- Li, D.; Li, Q.; Zhou, Y.; Zhang, Q.; Ye, Q.; Yang, R.; Jiang, D. Shaping and Doping Metal–Organic Framework-Derived TiO2 to Steer the Selectivity of Photocatalytic CO2 Reduction Toward CH4. Inorg. Chem. 2024, 63, 15398–15408. [Google Scholar] [CrossRef] [PubMed]
- Zhong, D.; Zeng, K.; Li, J.; Qiu, Y.; Flamant, G.; Nzihou, A.; Vladimirovich, V.S.; Yang, H.; Chen, H. Characteristics and Evolution of Heavy Components in Bio-Oil from the Pyrolysis of Cellulose, Hemicellulose and Lignin. Renew. Sustain. Energy Rev. 2022, 157, 111989. [Google Scholar] [CrossRef]
- Cai, Y.; Fan, Y.; Li, X.; Chen, L.; Wang, J. Preparation of Refined Bio-Oil by Catalytic Transformation of Vapors Derived from Vacuum Pyrolysis of Rape Straw over Modified HZSM-5. Energy 2016, 102, 95–105. [Google Scholar] [CrossRef]
- Huang, Z.; Wufuer, A.; Wang, Y.; Dai, L. Hydrothermal Liquefaction of Pretreated Low-Lipid Microalgae for the Production of Bio-Oil with Low Heteroatom Content. Process Biochem. 2018, 69, 136–143. [Google Scholar] [CrossRef]
- Sun, J.; Xie, X.; Fan, D.; Wang, X.; Liao, W. Effect of TEMPO and Characterization of Bio-Oil from Cellulose Liquefaction in Supercritical Ethanol. Renew. Energy 2020, 145, 1949–1956. [Google Scholar] [CrossRef]
- Ma, C.; Cai, B.; Zhang, L.; Feng, J.; Pan, H. Acid-Catalyzed Conversion of Cellulose into Levulinic Acid with Biphasic Solvent System. Front. Plant Sci. 2021, 12, 630807. [Google Scholar] [CrossRef]
- Sim, S.F.; Lee, T.Z.E.; Mohd Irwan Lu, N.A.L.; Samling, B. Synchronized Analysis of FTIR Spectra and GCMS Chromatograms for Evaluation of the Thermally Degraded Vegetable Oils. J. Anal. Methods Chem. 2014, 2014, 271970. [Google Scholar] [CrossRef] [PubMed]
- Bartoli, M.; Rosi, L.; Giovannelli, A.; Frediani, P.; Frediani, M. Pyrolysis of α-Cellulose Using a Multimode Microwave Oven. J. Anal. Appl. Pyrolysis 2016, 120, 284–296. [Google Scholar] [CrossRef]
- Liu, L.; Li, Z.; Hou, W.; Shen, H. Direct Conversion of Lignocellulose to Levulinic Acid Catalyzed by Ionic Liquid. Carbohydr. Polym. 2018, 181, 778–784. [Google Scholar] [CrossRef]
- Wu, X.-F.; Yin, S.-S.; Zhou, Q.; Li, M.-F.; Peng, F.; Xiao, X. Subcritical Liquefaction of Lignocellulose for the Production of Bio-Oils in Ethanol/Water System. Renew. Energy 2019, 136, 865–872. [Google Scholar] [CrossRef]
- Ravikumar, C.; Senthil Kumar, P.; Subhashni, S.K.; Tejaswini, P.V.; Varshini, V. Microwave Assisted Fast Pyrolysis of Corn Cob, Corn Stover, Saw Dust and Rice Straw: Experimental Investigation on Bio-Oil Yield and High Heating Values. Sustain. Mater. Technol. 2017, 11, 19–27. [Google Scholar] [CrossRef]
- Zuo, Y.; Zhang, Y.; Fu, Y. Catalytic Conversion of Cellulose into Levulinic Acid by a Sulfonated Chloromethyl Polystyrene Solid Acid Catalyst. ChemCatChem 2014, 6, 753–757. [Google Scholar] [CrossRef]


| Samples No. | Catalysts 1 | Illuminating 2 | Heating | Conversion (%) |
|---|---|---|---|---|
| 1 | No catalysts | NO | NO | 0 |
| 2 | No catalysts | YES | NO | 0 |
| 3 | No catalysts | YES | YES | 70.3% |
| 4 | TiO2-CNT | NO | YES | 76.2% |
| 5 | TiO2-CNT | YES | NO | 13.6% |
| 6 | TiO2-CNT | YES | YES | 78.1% |
| 7 | Pt/TiO2-CNT | YES | NO | 22.5% |
| 8 | Pt/TiO2-CNT | NO | YES | 87% |
| 9 | Pt/TiO2-CNT | YES | YES | 98% |
| Catalysts | Surface Area 1, m2/g | Pore Volume 2, cm³/g | Average Pore Size 3, nm |
|---|---|---|---|
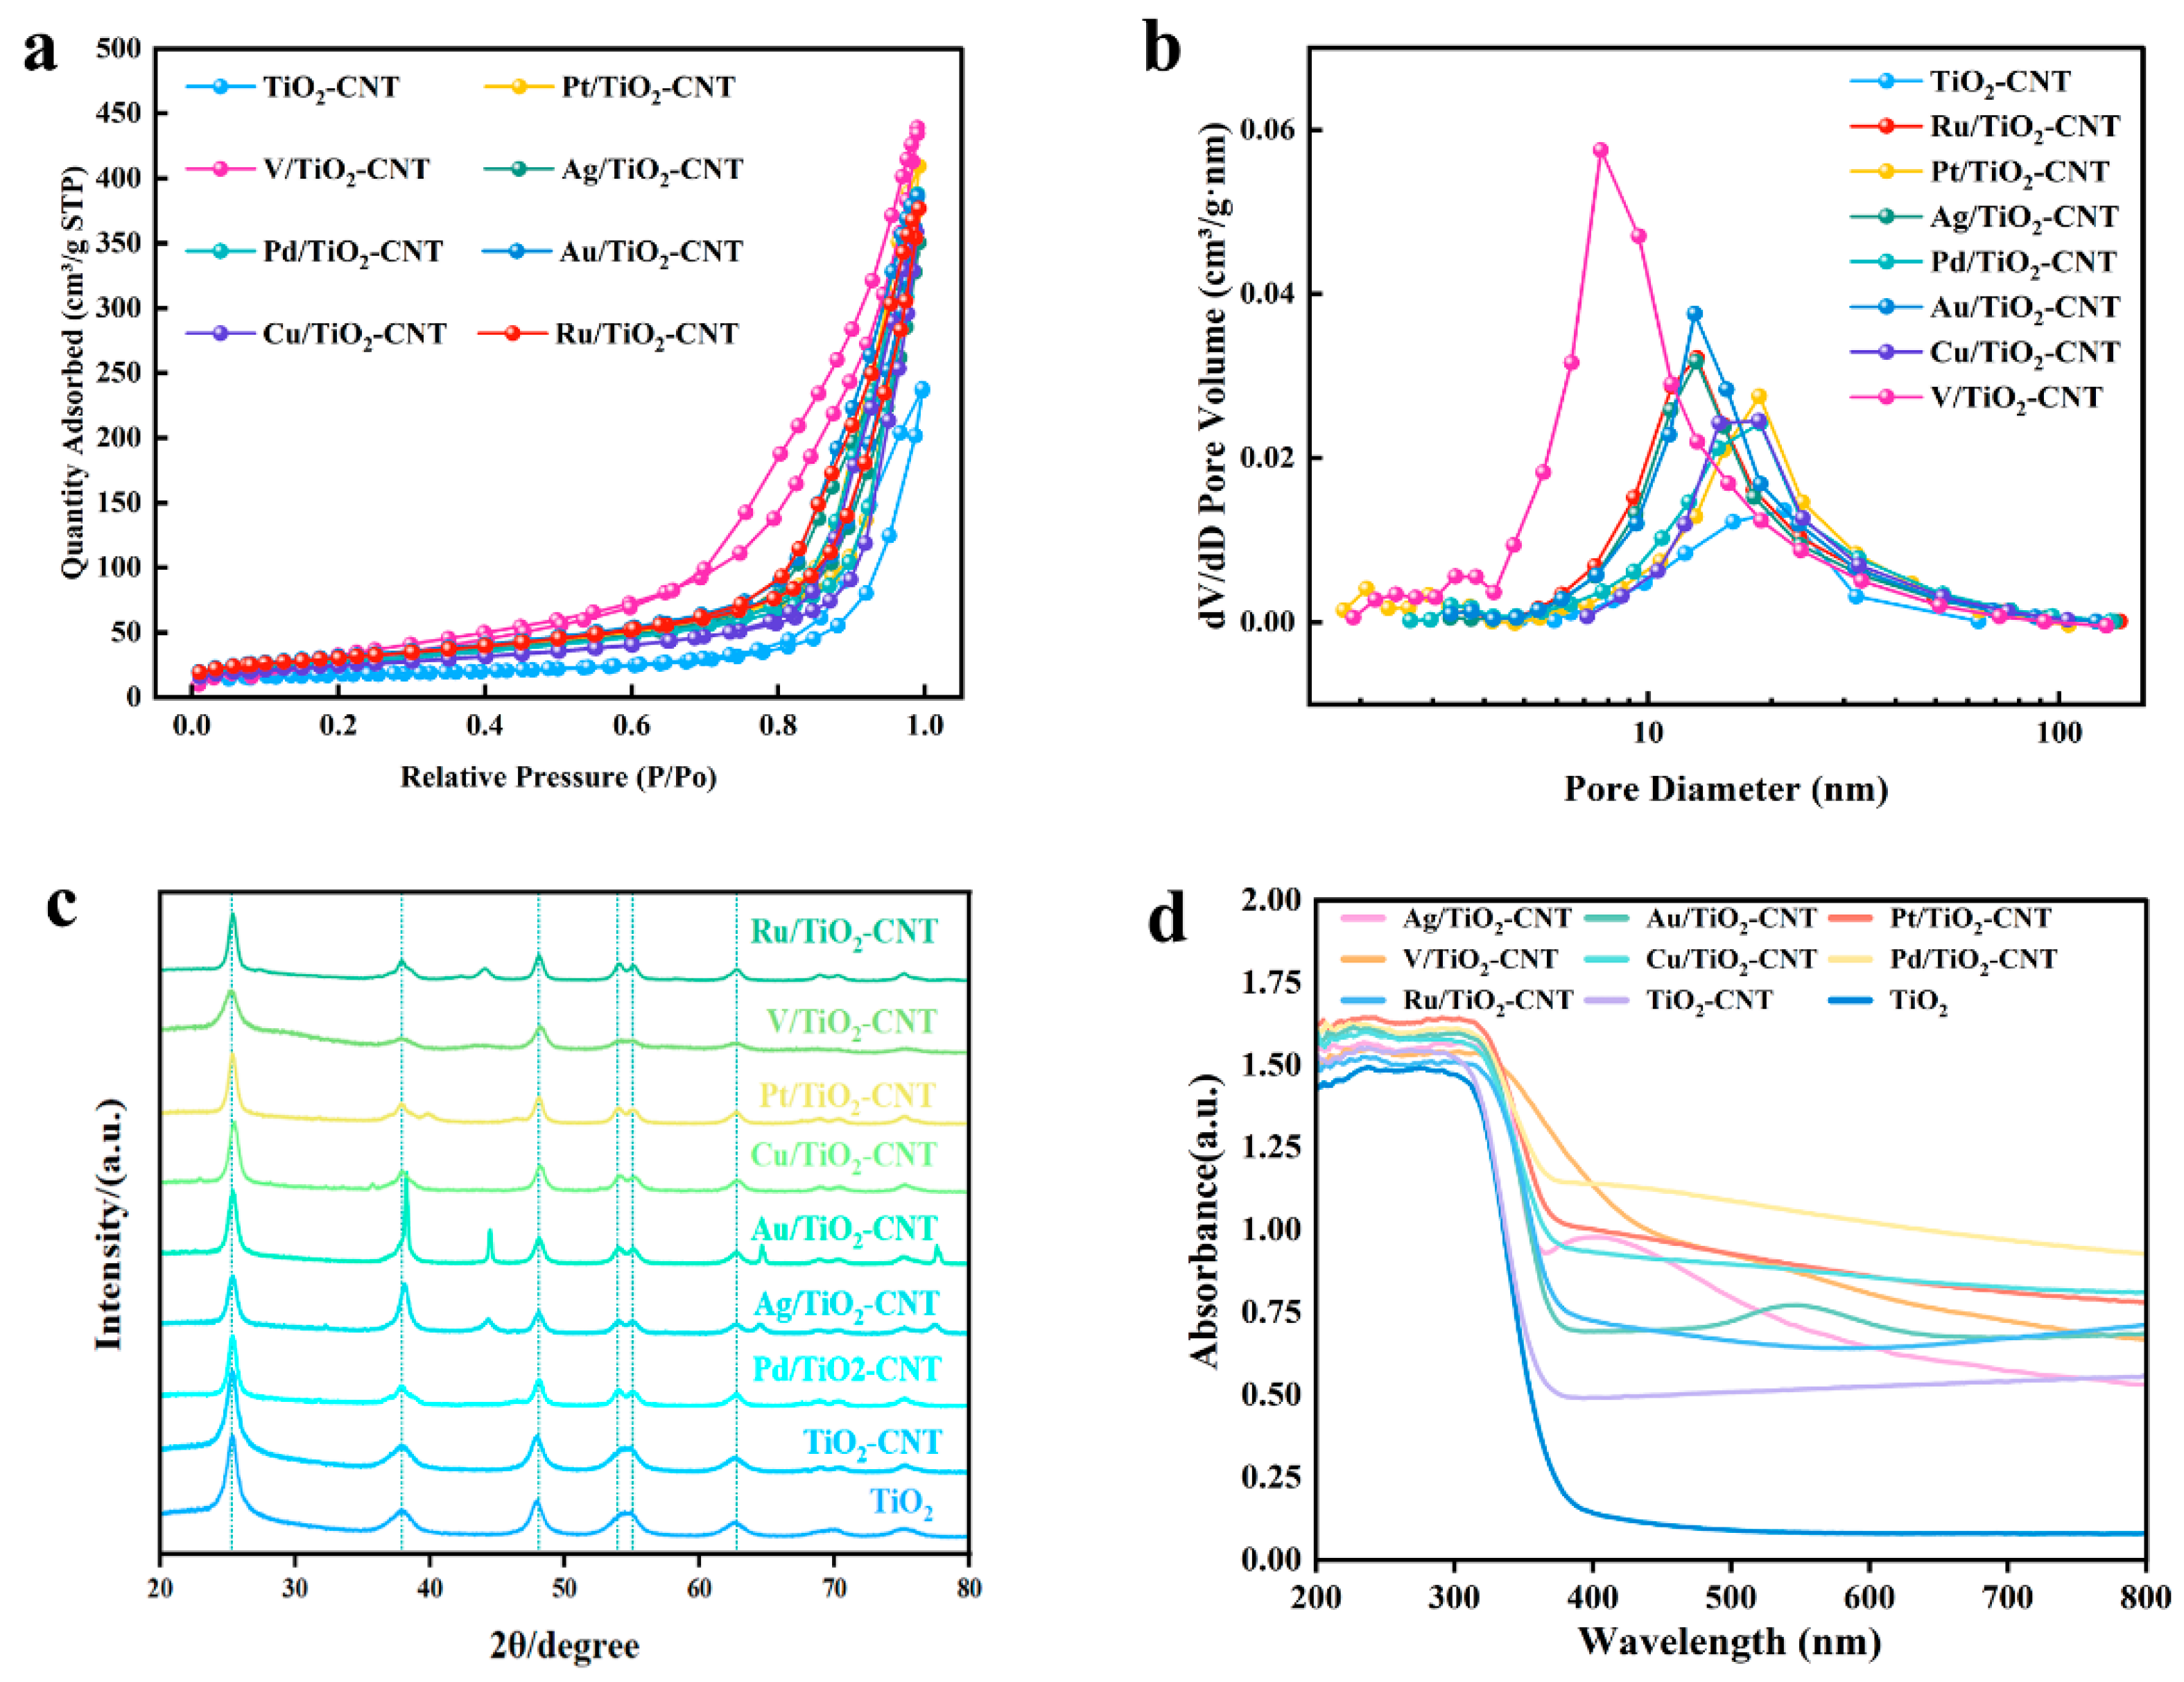
| TiO2-CNT | 60.98 | 0.37 | 22.13 |
| Ag/TiO2-CNT | 102.56 | 0.54 | 19.06 |
| V/TiO2-CNT | 212.28 | 0.72 | 12.76 |
| Pt/TiO2-CNT | 108.92 | 0.63 | 21.49 |
| Pd/TiO2-CNT | 99.41 | 0.60 | 22.24 |
| Au/TiO2-CNT | 112.10 | 0.60 | 18.83 |
| Cu/TiO2-CNT | 87.95 | 0.56 | 22.85 |
| Ru/TiO2-CNT | 108.57 | 0.58 | 18.88 |
| Sample | Elemental Content (wt.%) | HHV (MJ/kg) | |||||
|---|---|---|---|---|---|---|---|
| C | H | O | N | H/C | O/C | ||
| Cellulose | 40.87 | 5.87 | 57.53 | 0.003 | 0.14 | 1.40 | 13.17 |
| liquid | 49.85 | 4.77 | 45.33 | 0.27 | 1.14 | 0.69 | 15.50 [64] |
| liquid | 46.65 | 8.64 | 44.39 | 0.33 | 0.19 | 0.95 | 21.01 |
Disclaimer/Publisher’s Note: The statements, opinions and data contained in all publications are solely those of the individual author(s) and contributor(s) and not of MDPI and/or the editor(s). MDPI and/or the editor(s) disclaim responsibility for any injury to people or property resulting from any ideas, methods, instructions or products referred to in the content. |
© 2025 by the authors. Licensee MDPI, Basel, Switzerland. This article is an open access article distributed under the terms and conditions of the Creative Commons Attribution (CC BY) license (https://creativecommons.org/licenses/by/4.0/).
Share and Cite
Li, B.; Wang, M.; Luo, H.; Li, K.; Jia, Y.; Fu, M.; Jiang, C.; Yao, S.; Yin, Y. Photothermal Catalysis of Cellulose to Prepare Levulinic Acid-Rich Bio-Oil. Polymers 2025, 17, 857. https://doi.org/10.3390/polym17070857
Li B, Wang M, Luo H, Li K, Jia Y, Fu M, Jiang C, Yao S, Yin Y. Photothermal Catalysis of Cellulose to Prepare Levulinic Acid-Rich Bio-Oil. Polymers. 2025; 17(7):857. https://doi.org/10.3390/polym17070857
Chicago/Turabian StyleLi, Bolun, Mengyan Wang, Huixiang Luo, Kaina Li, Yanlong Jia, Mingjie Fu, Chenyu Jiang, Shuangquan Yao, and Yongjun Yin. 2025. "Photothermal Catalysis of Cellulose to Prepare Levulinic Acid-Rich Bio-Oil" Polymers 17, no. 7: 857. https://doi.org/10.3390/polym17070857
APA StyleLi, B., Wang, M., Luo, H., Li, K., Jia, Y., Fu, M., Jiang, C., Yao, S., & Yin, Y. (2025). Photothermal Catalysis of Cellulose to Prepare Levulinic Acid-Rich Bio-Oil. Polymers, 17(7), 857. https://doi.org/10.3390/polym17070857