
Preparation of Tea Tree Essential Oil–Chitosan Microcapsules and Its Effect on the Properties of Water-Based Coating

Abstract
1. Introduction
2. Materials and Methods
2.1. Materials and Equipment
2.2. Microcapsule Preparation Method and Experimental Design
2.3. Coating Preparation Method
2.4. Test and Characterization
2.4.1. Yield and Coverage Rate Testing
2.4.2. Micromorphology
2.4.3. Chemical Composition Analysis
2.4.4. Optical Performance Test
2.4.5. Roughness and Tensile Testing
2.4.6. Antibacterial Property
3. Results and Discussion
3.1. Yield and Coverage Rate
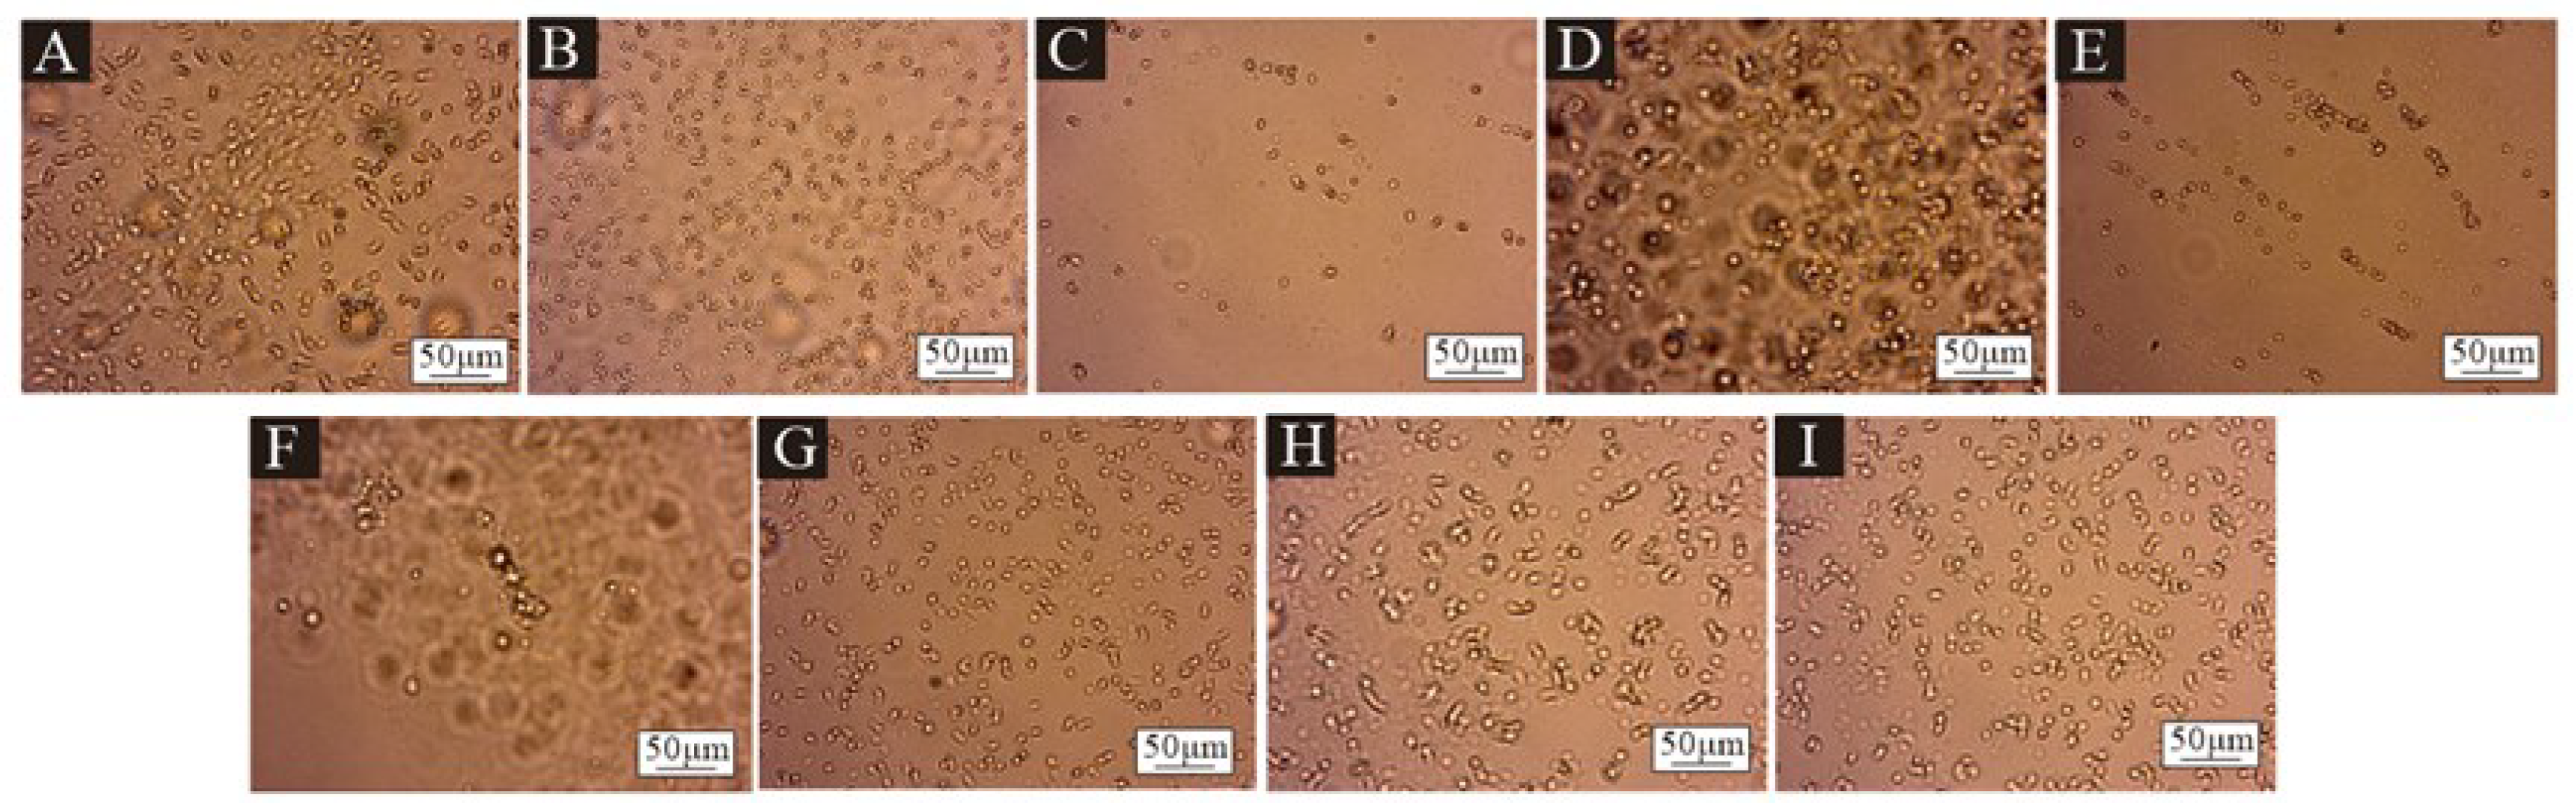
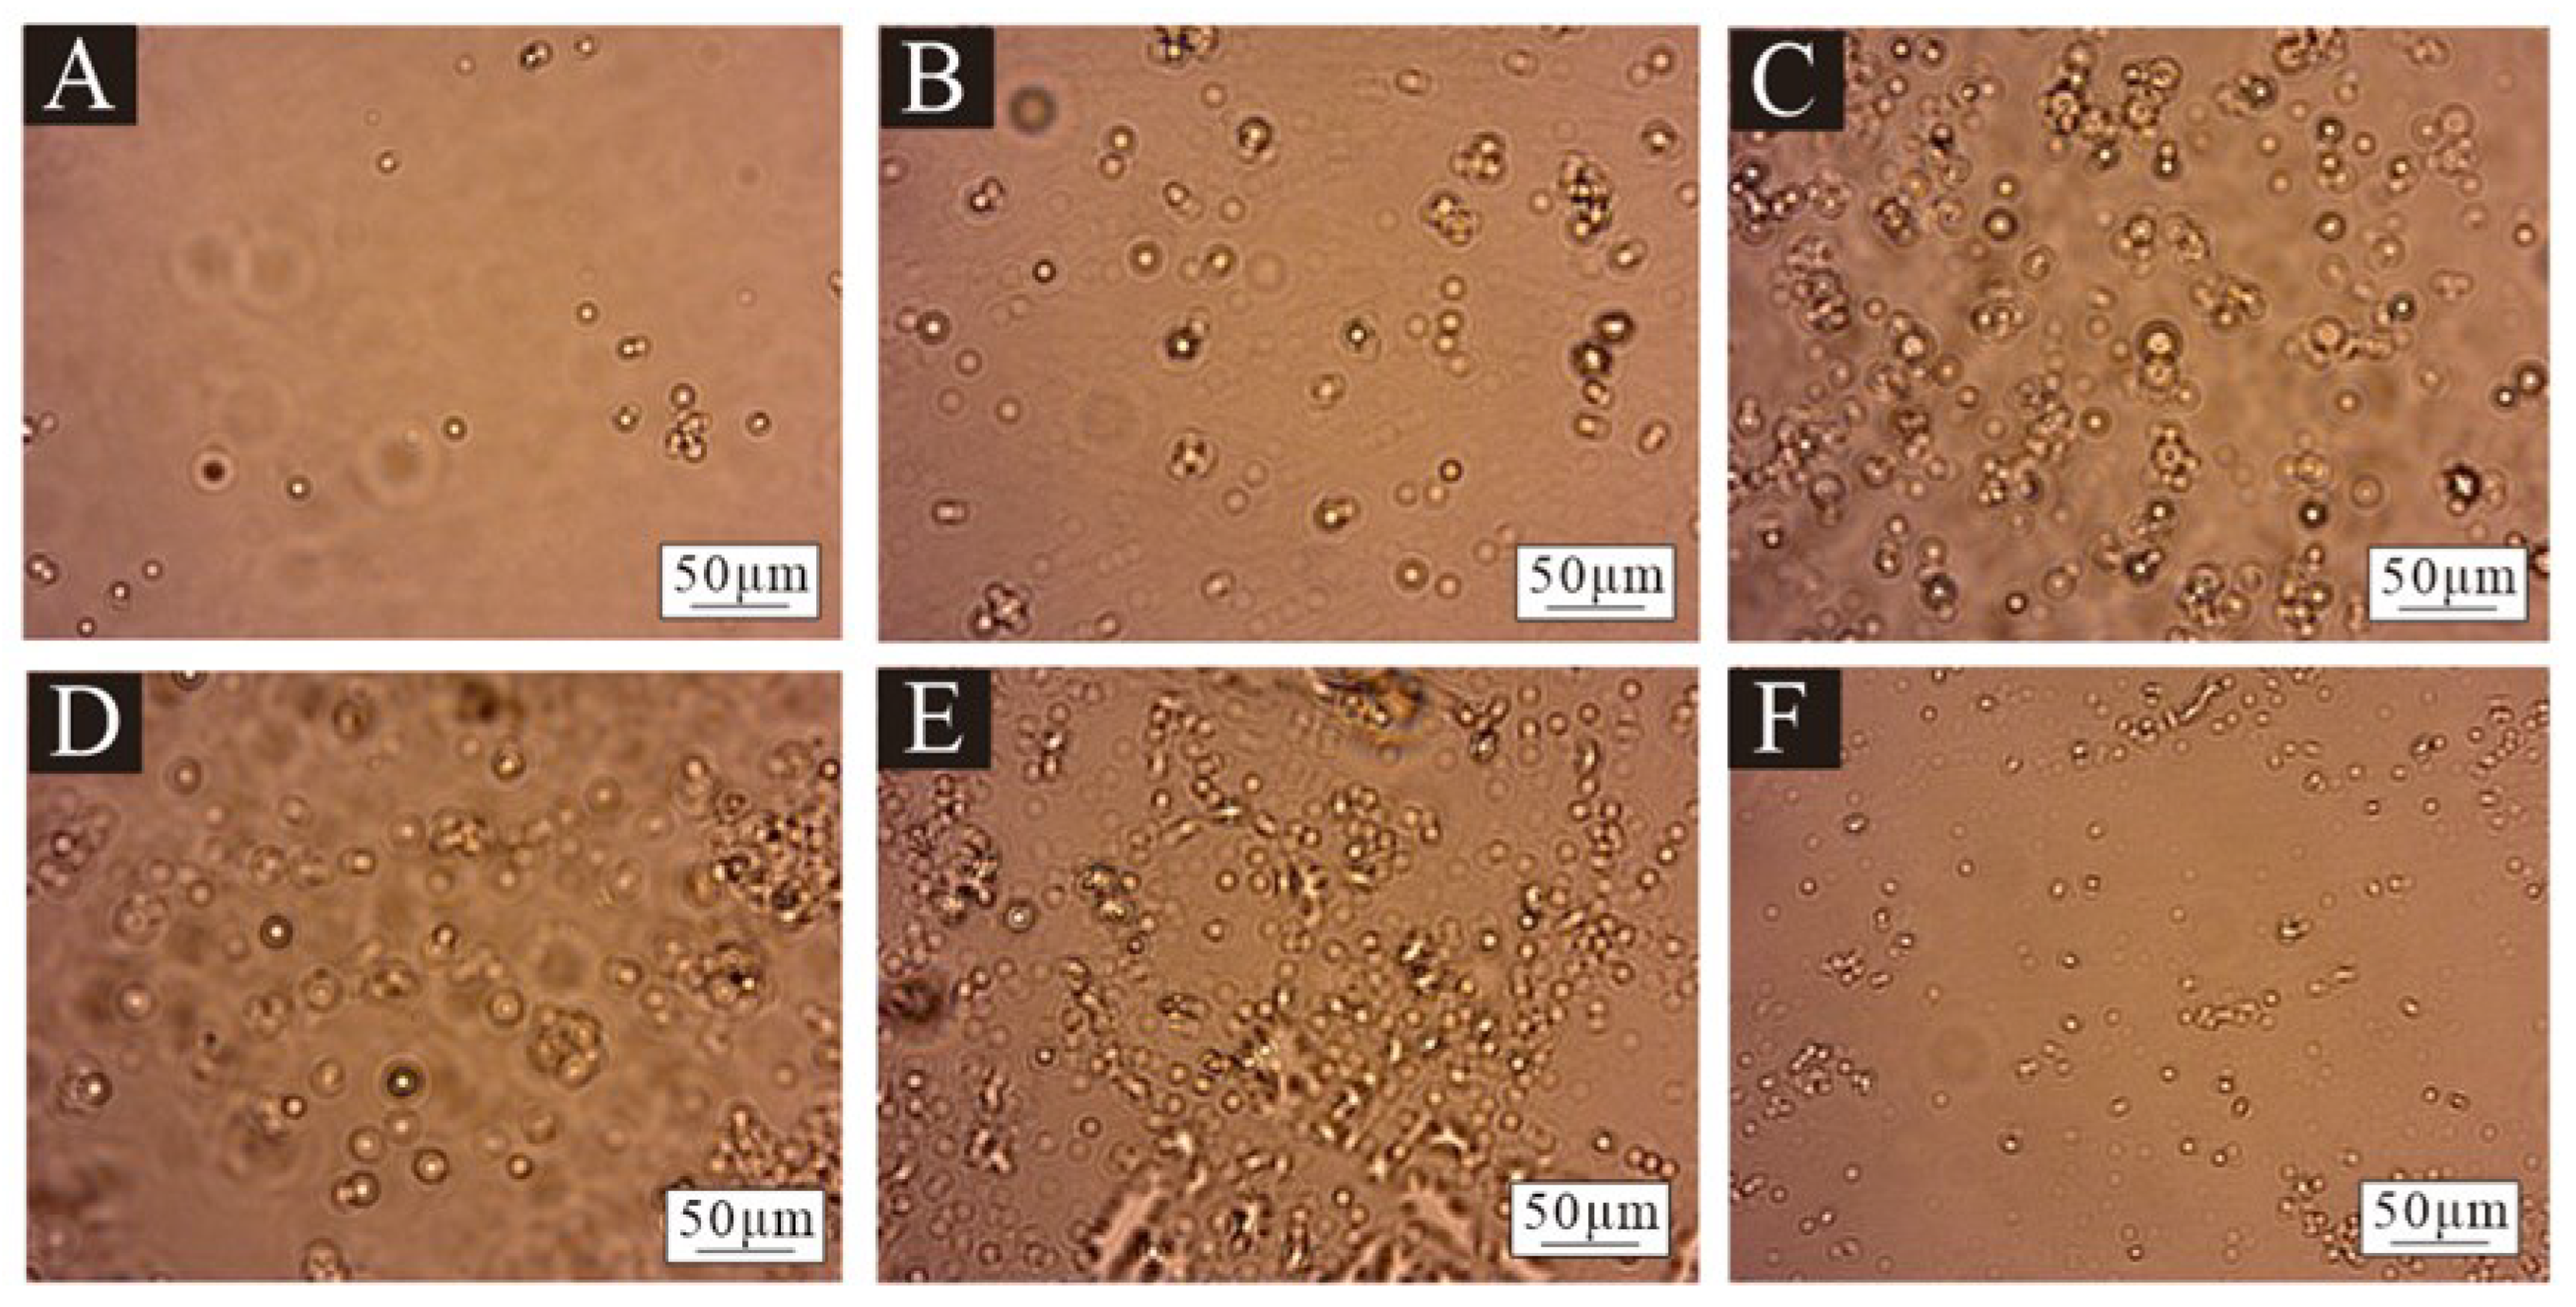
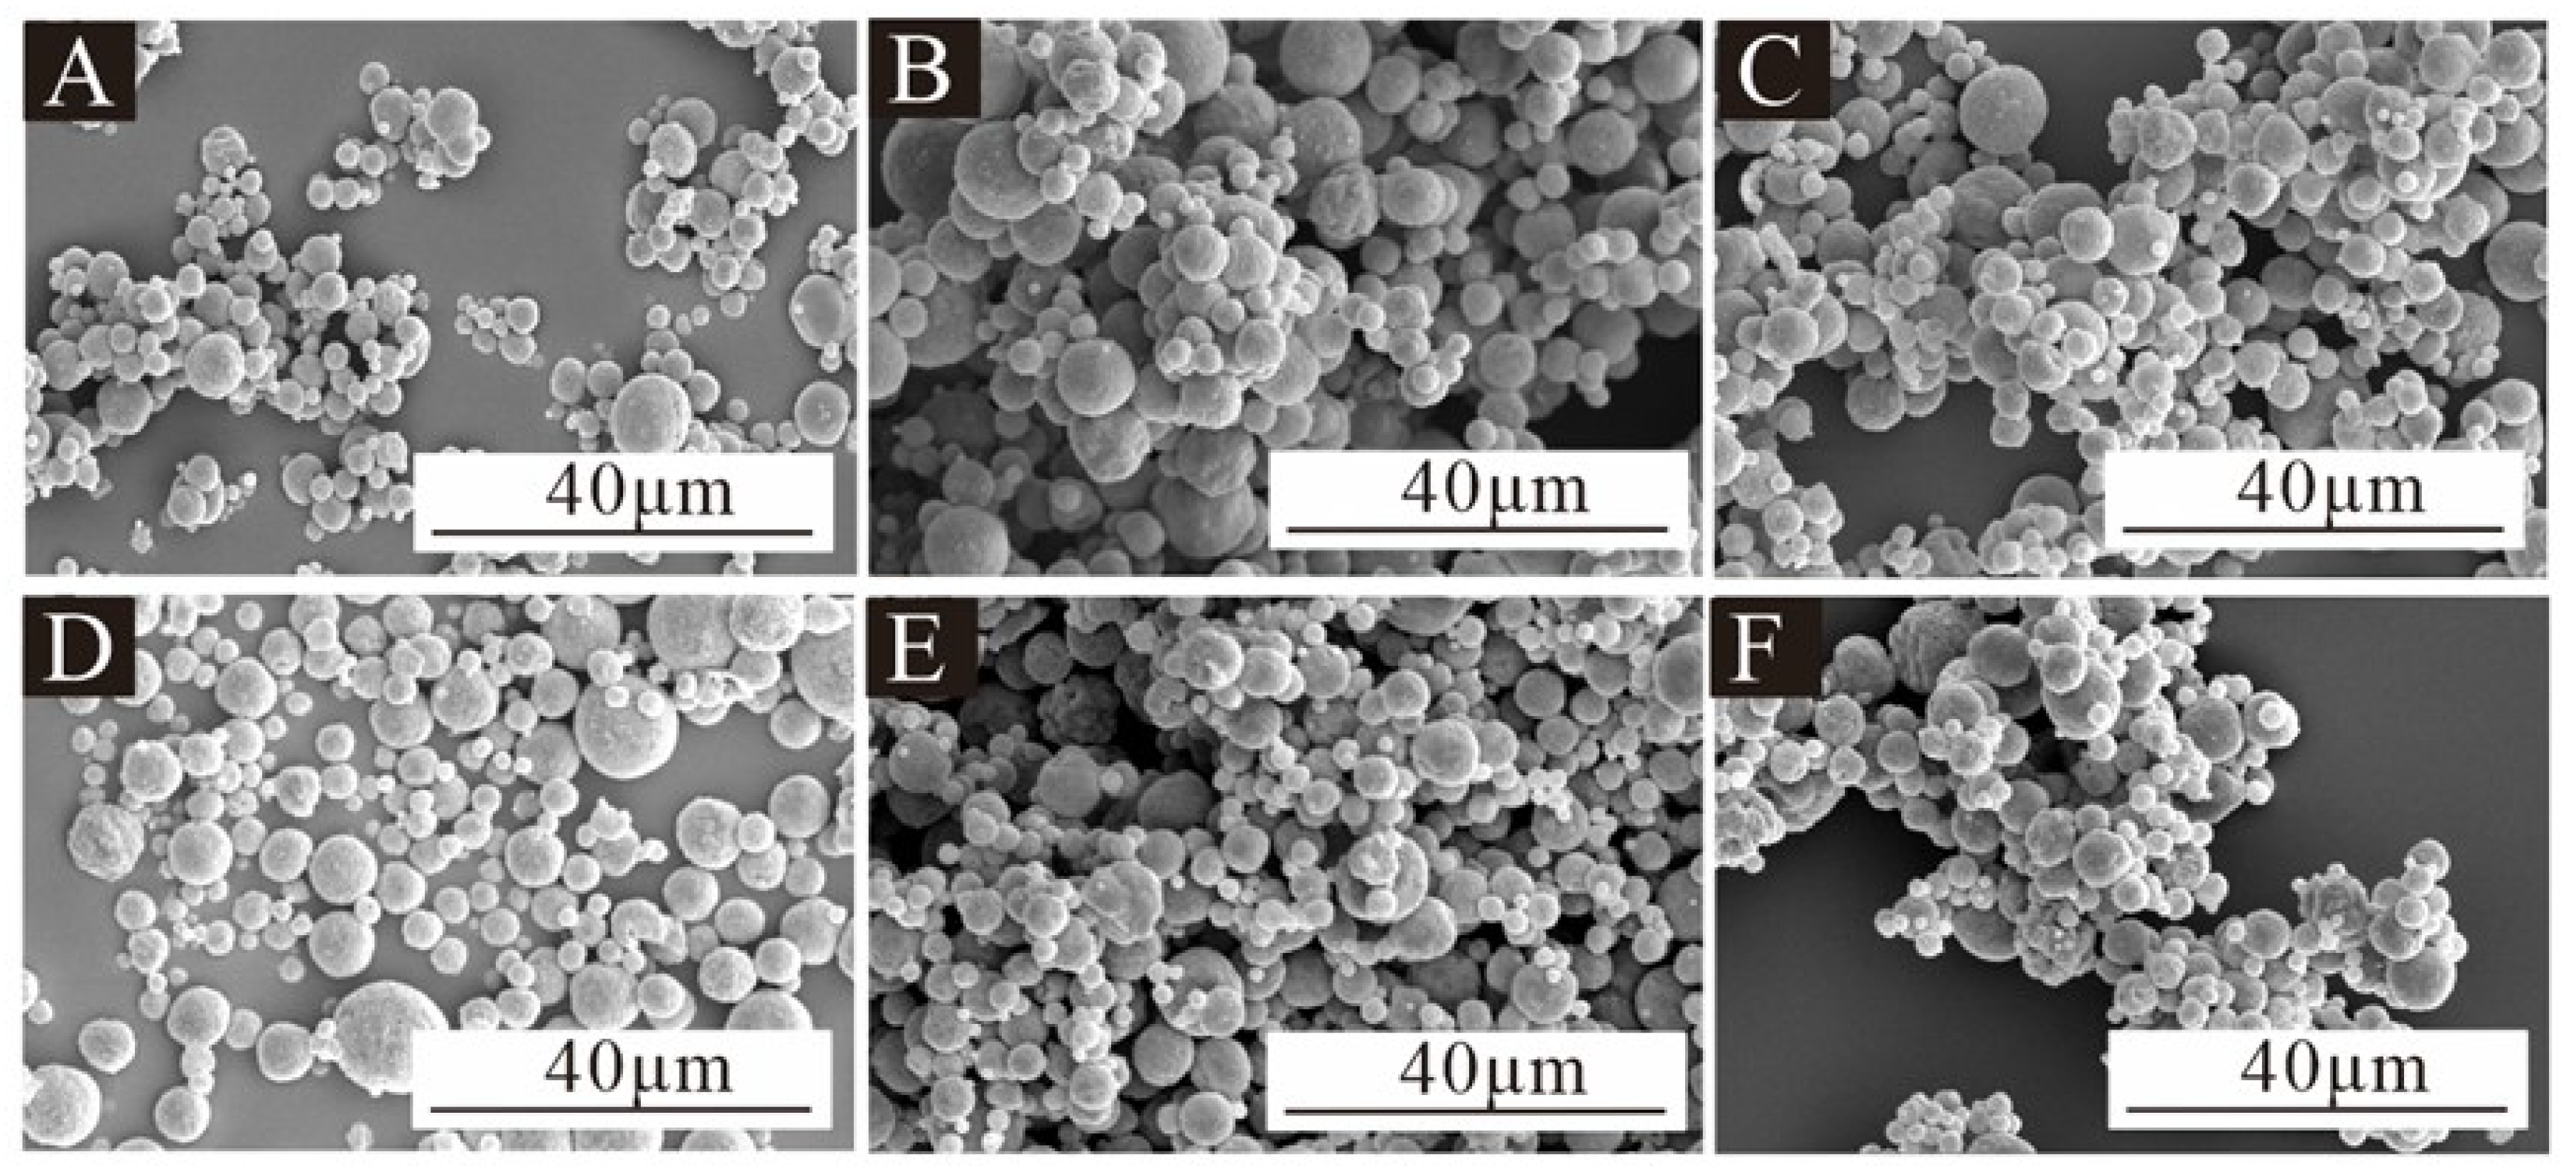
3.2. The Micromorphology of Microcapsules
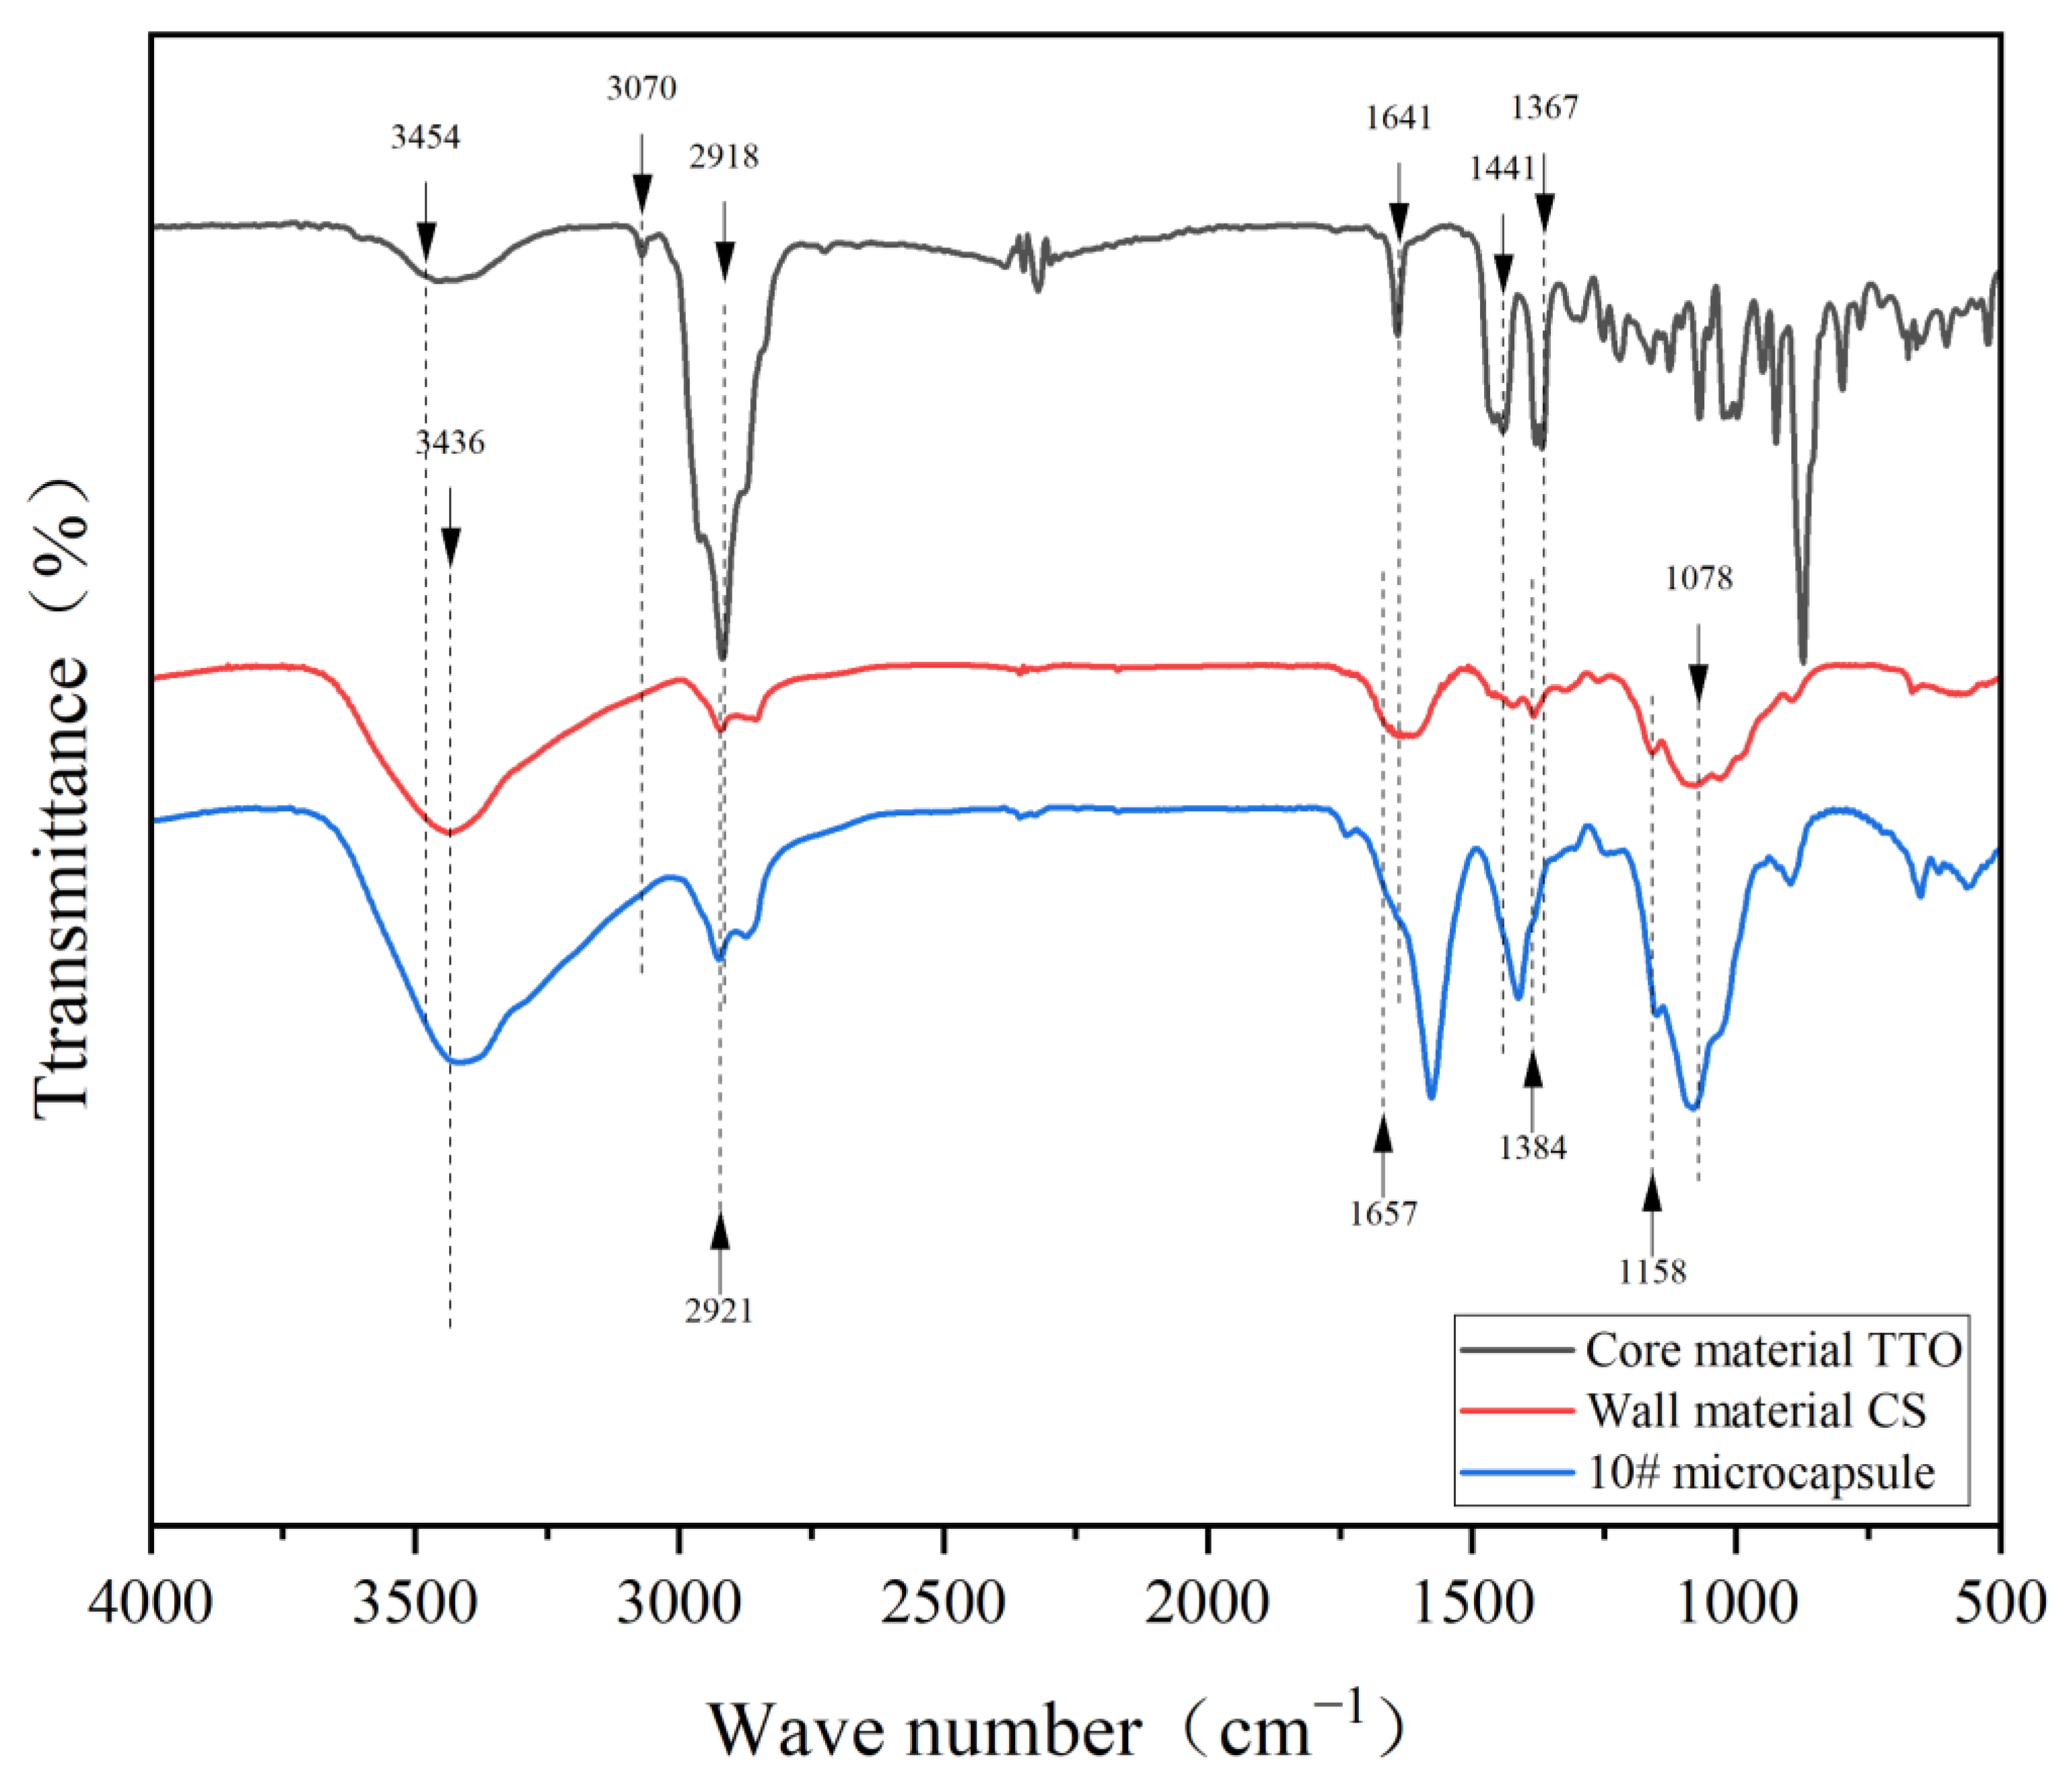
3.3. Chemical Composition Analysis of Microcapsules
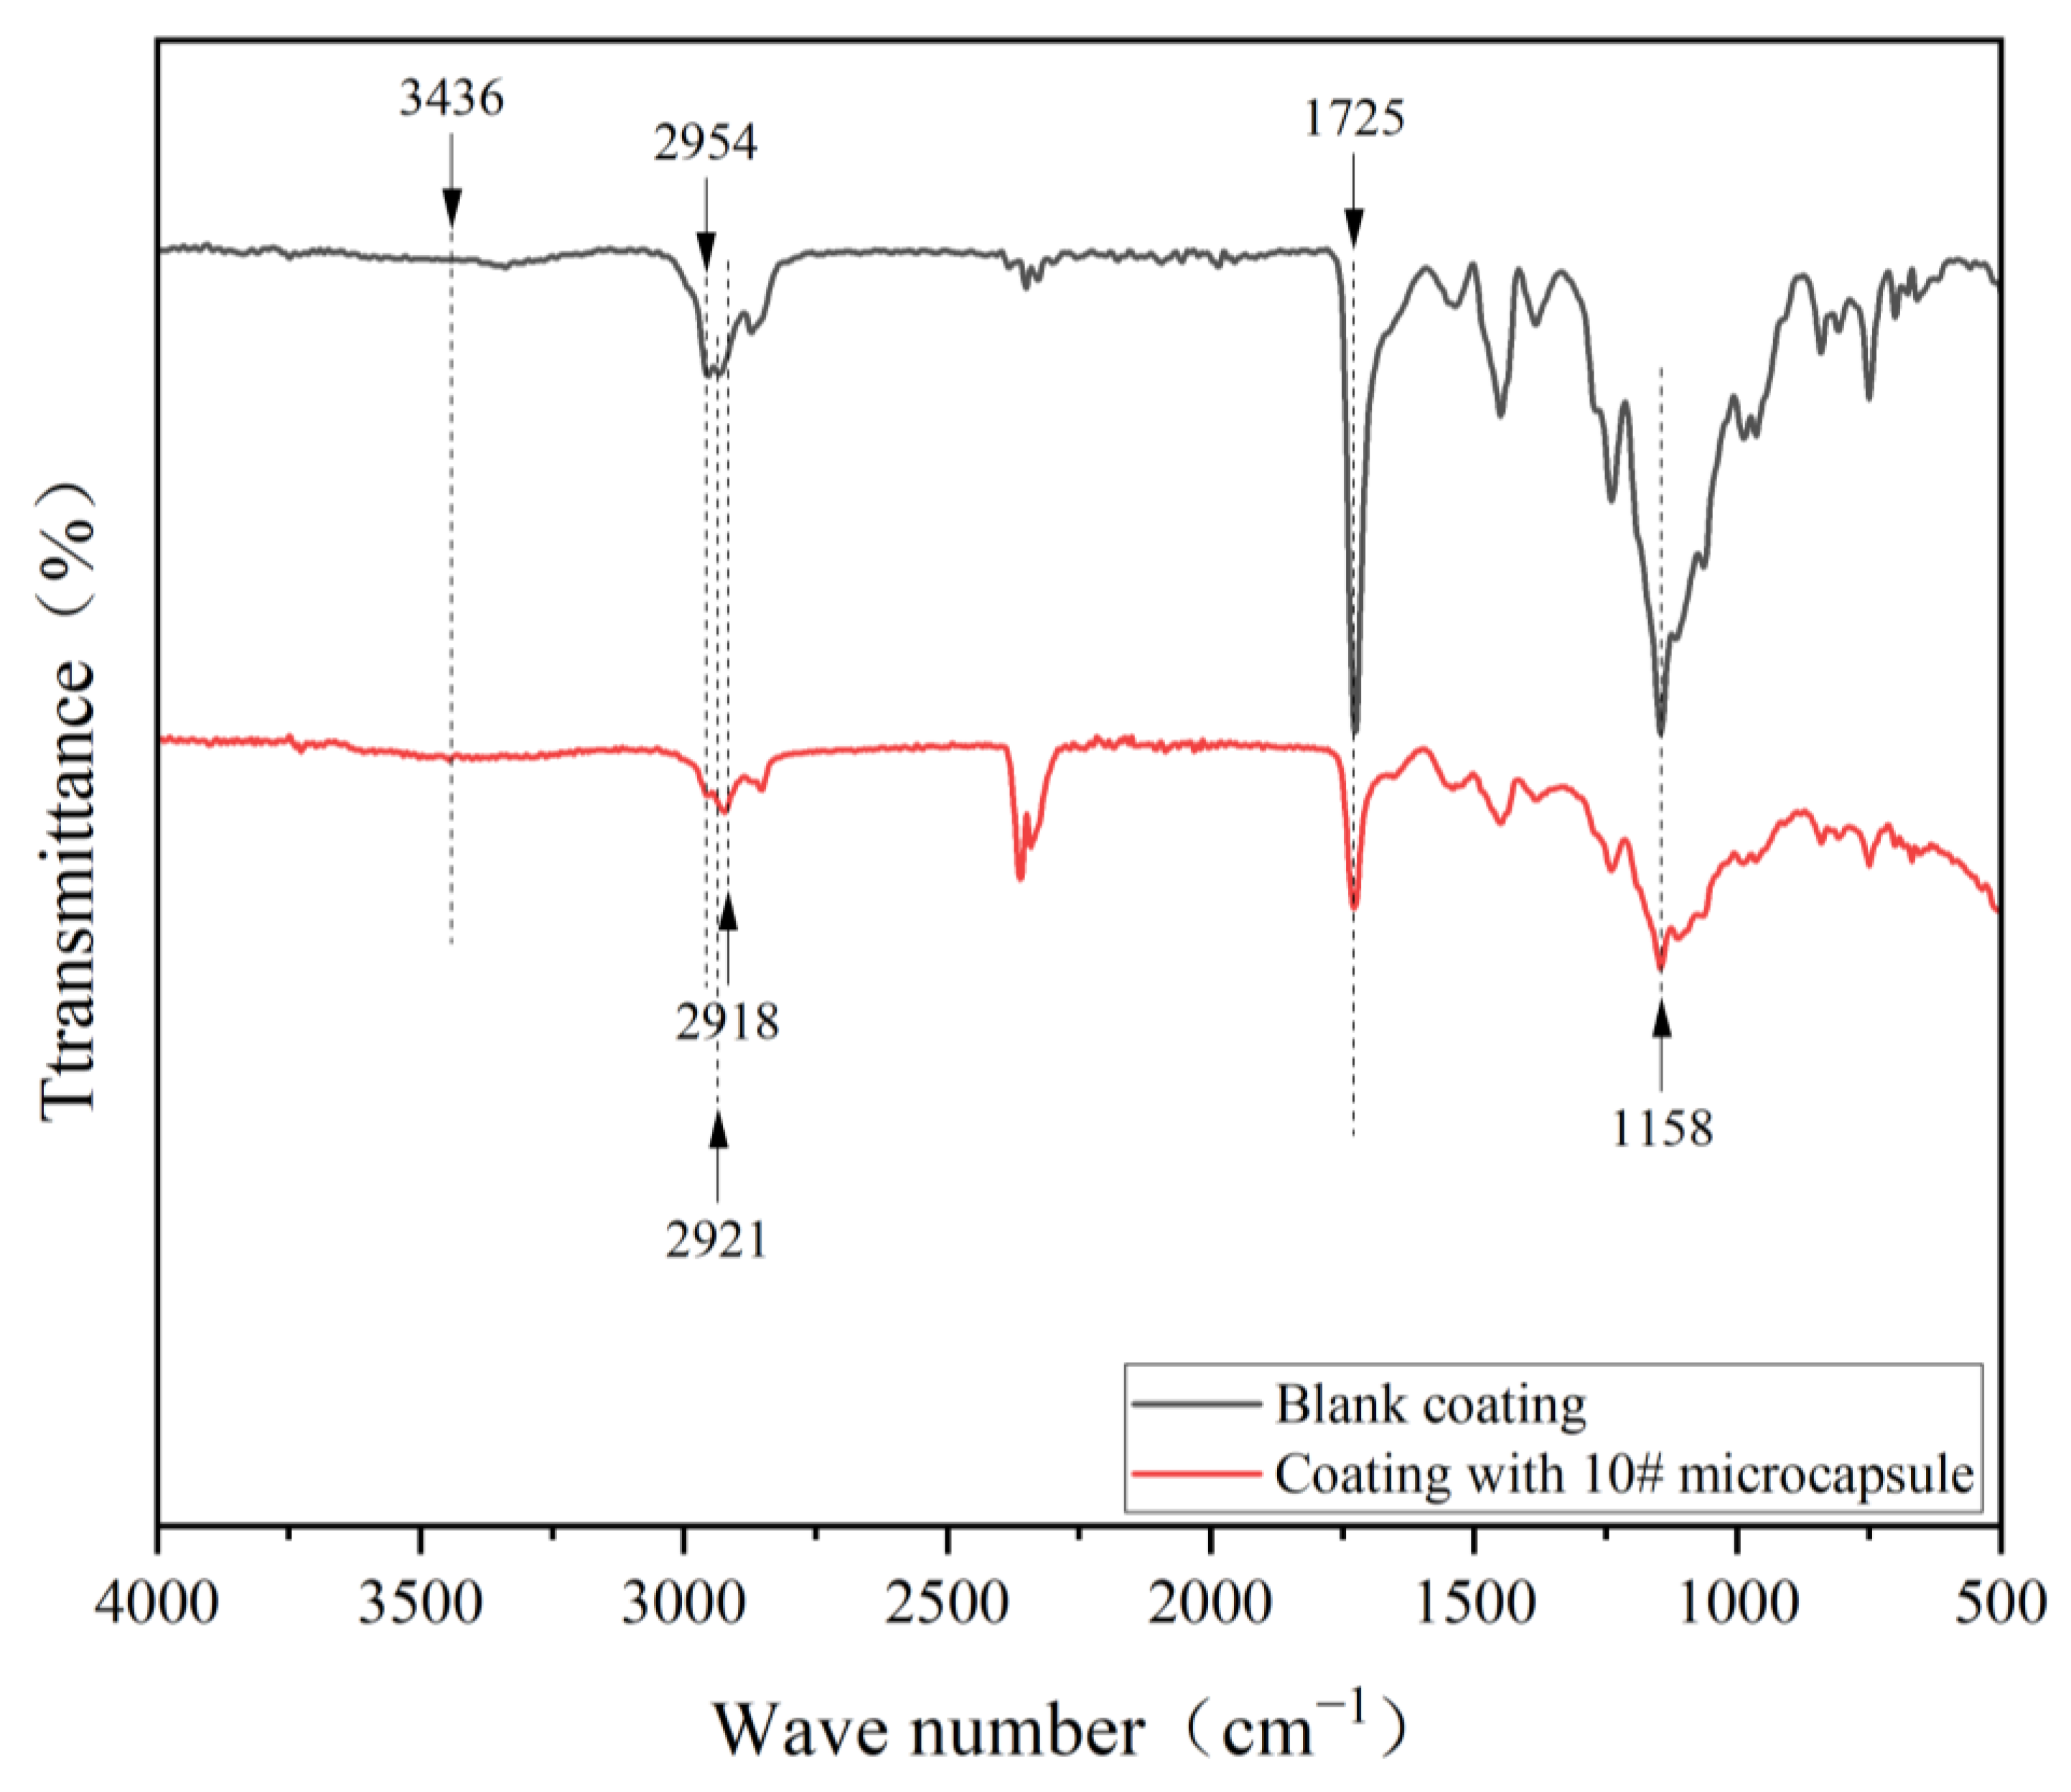
3.4. Morphology and Chemical Composition Analysis of Water-Based Coating
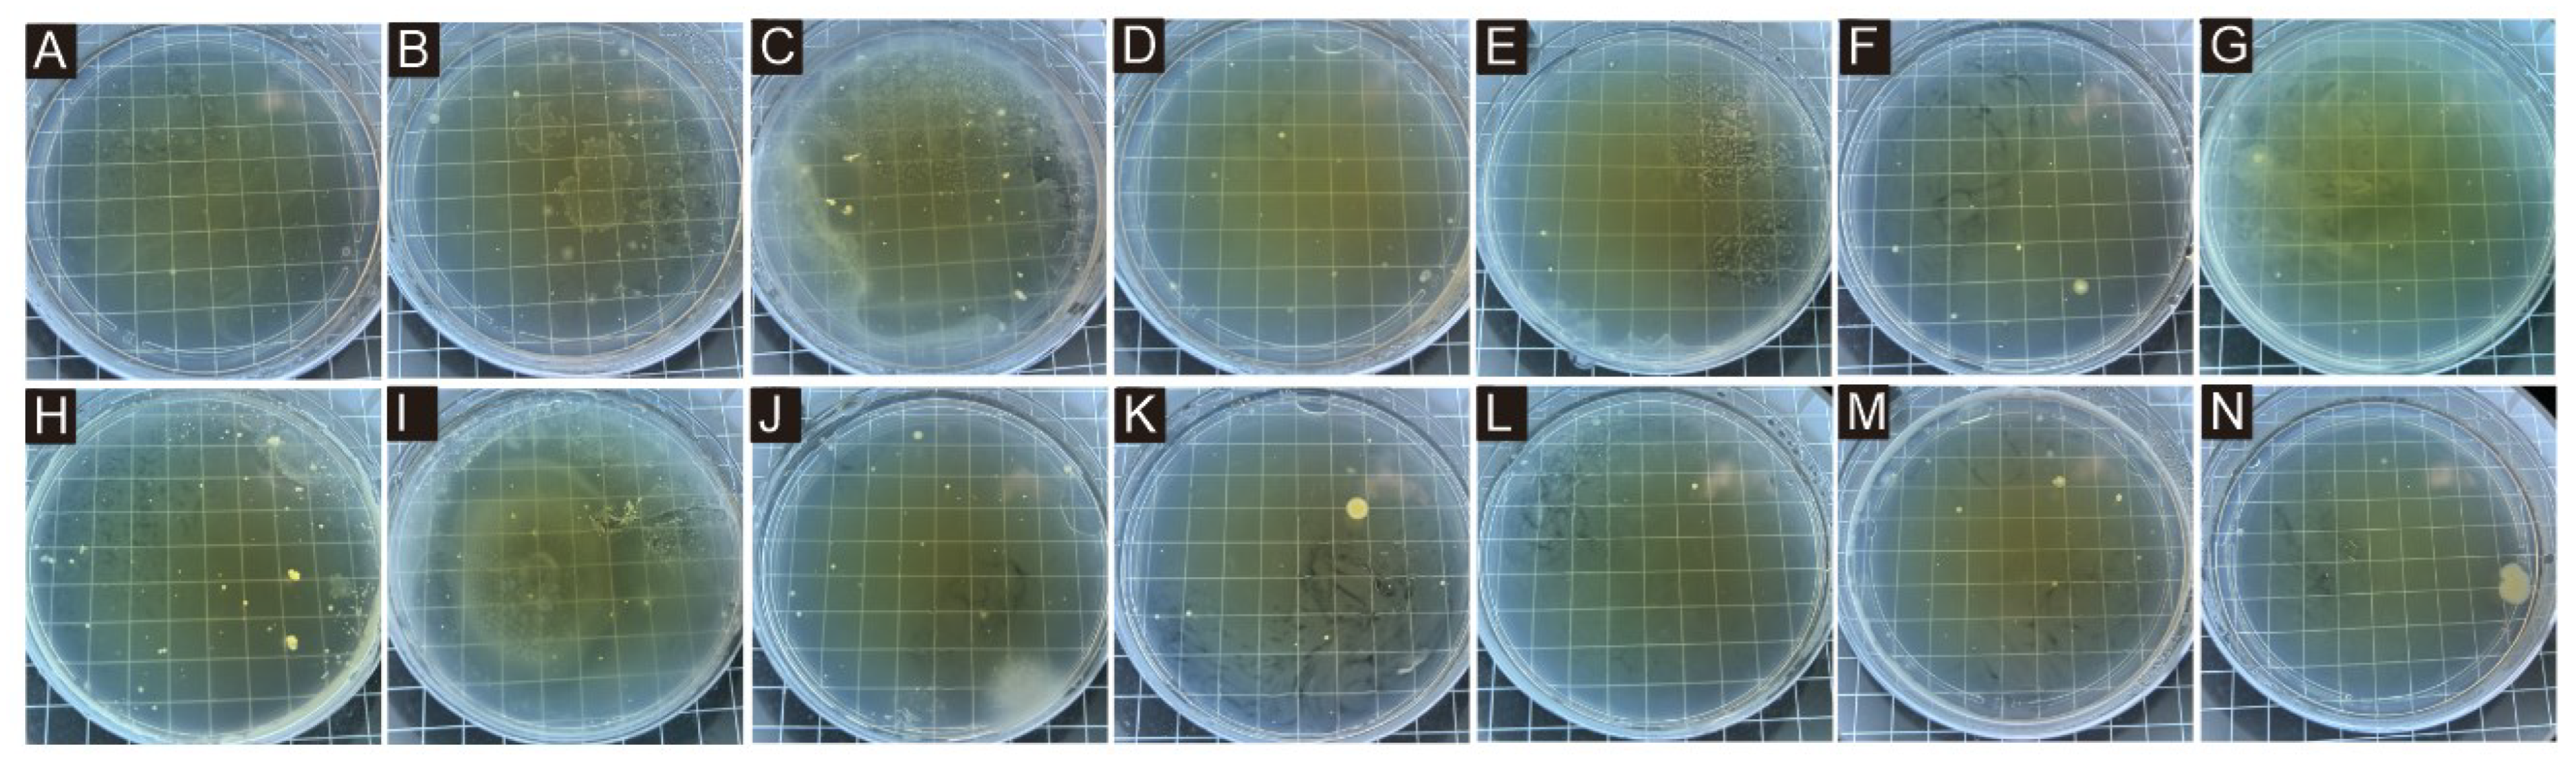
3.5. Analysis of Antibacterial Properties of Coating
3.6. Optical Properties Analysis of Coating
3.6.1. Color Difference
3.6.2. Glossiness and Light Loss Rate
3.6.3. Transmittance
3.7. Mechanical Properties Analysis of Coating
3.7.1. Roughness
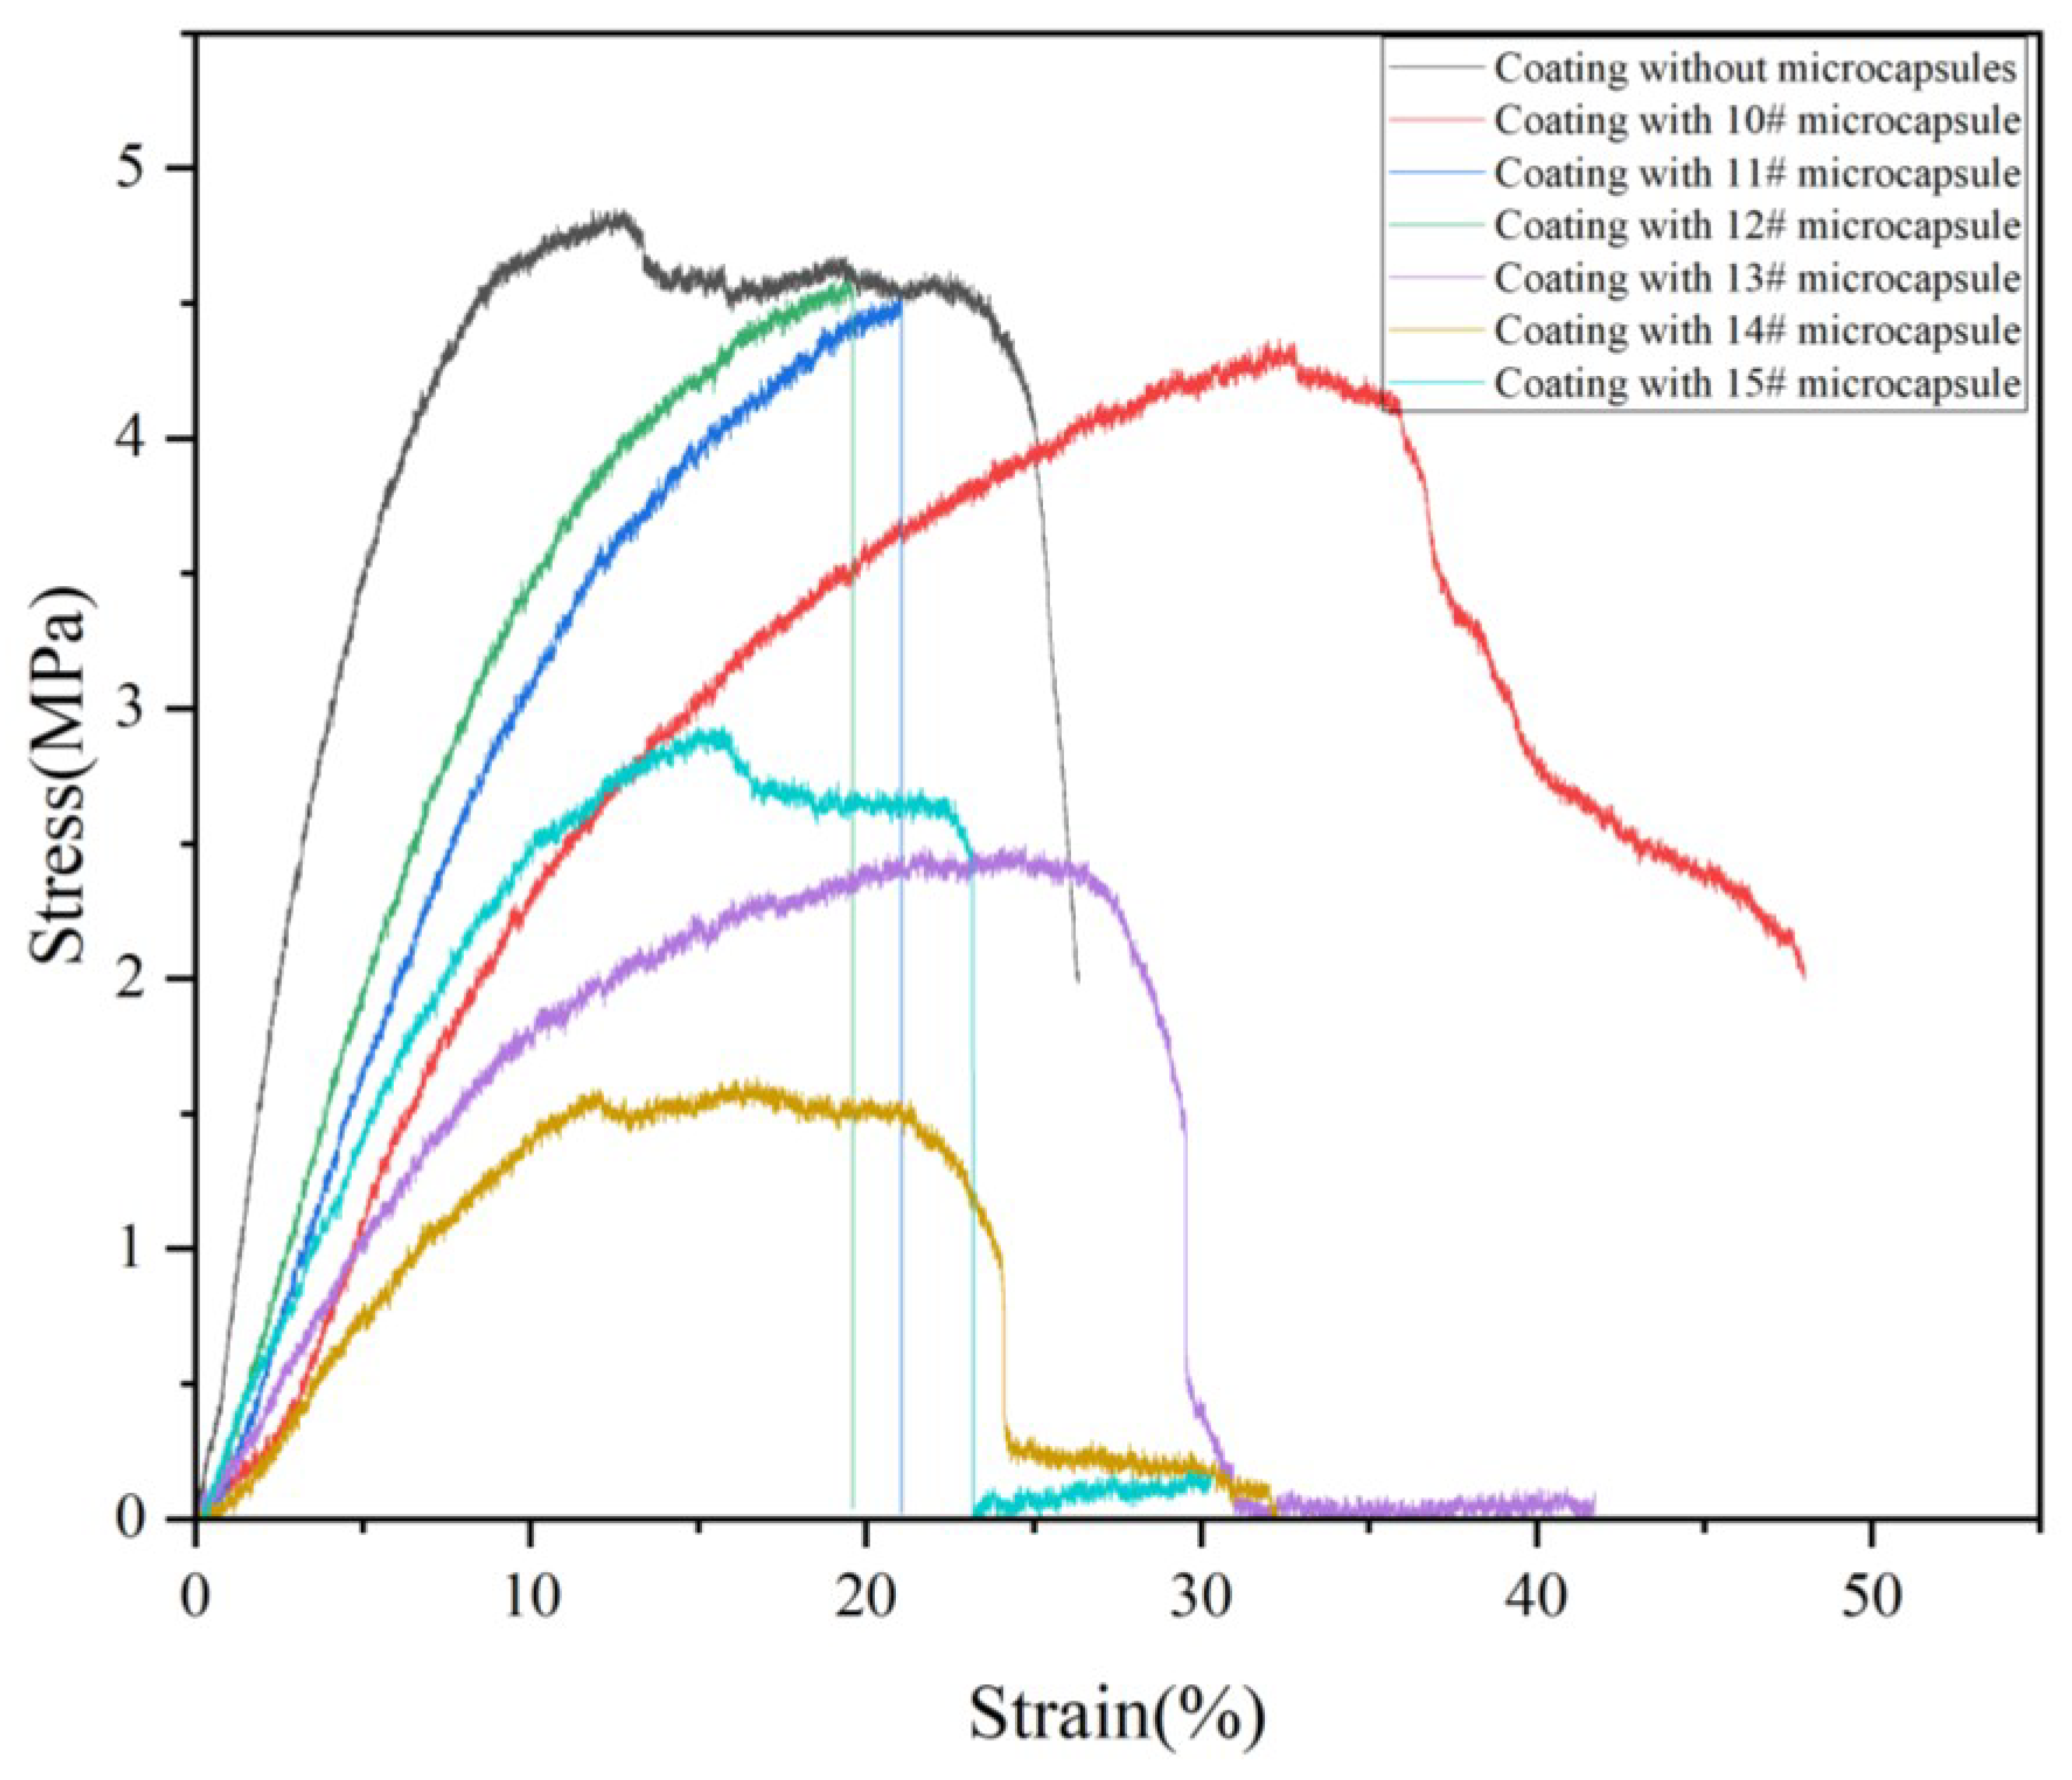
3.7.2. Elongation
4. Conclusions
Author Contributions
Funding
Institutional Review Board Statement
Informed Consent Statement
Data Availability Statement
Conflicts of Interest
References
- Wu, H.; Long, X.F.; Geng, Y.F. Companion plants of tea: From ancient to terrace to forest. Plants 2023, 12, 3061. [Google Scholar] [CrossRef] [PubMed]
- Tosun, M.N.; Taylan, G.; Zorba, N.N.D. Antibacterial and antibiofilm activities of some plant essential oils and synergistic effects of cinnamon essential oil with vancomycin against Clostridioides difficile: In vitro study. Lett. Appl. Microbiol. 2022, 75, 598–606. [Google Scholar] [PubMed]
- Hsu, J.L.; Lin, T.Y.; Chien, J.H.; Hsu, A.C.; Lin, H.H.; Yeh, A.C. A study on the release persistence of microencapsulated tea tree essential oil in hotel hot spring water. Water 2022, 14, 1391. [Google Scholar] [CrossRef]
- Johnson, J.B.; Thani, P.P.; Naiker, M.M. Through-container detection of tea tree oil adulteration using near-infrared spectroscopy (NIRS). Chem. Pap. 2023, 77, 2009–2017. [Google Scholar] [CrossRef]
- Marcos-Tejedor, F.; González-García, P.; Mayordomo, R. Solubilization in vitro of tea tree oil and first results of antifungal effect in onychomycosis. Enferm. Infecc. Microbiol. Clin. 2021, 39, 395–398. [Google Scholar]
- Kwon, S.; Yang, H.; Lee, S.S. Core-shell nanofibers as carrier systems for sustained delivery of tea tree oil. Text. Res. J. 2023, 93, 4742–4754. [Google Scholar]
- Li, Y.; Huang, D.; Yang, A.Q.; Xie, M.; Li, J.; Xiong, P.H.; Huang, C.B. Biological fermentation of plant extracts and their products in cosmetics. J. For. Eng. 2024, 9, 1–12. [Google Scholar]
- Paichitrojjana, A.; Chalermchai, T. Comparison of in vitro Killing Effect of Thai Herbal Essential Oils, Tea Tree Oil, and Metronidazole 0.75% versus Ivermectin 1% on Demodex folliculorum. Clin. Cosmet. Investig. Dermatology 2023, 16, 1279–1286. [Google Scholar]
- Yilmaz, B.H.; Yildiz, H.Y. Anthelmintic effects of peppermint (Mentha piperita), lemon (Citrus limon), and tea tree (Melaleuca alternifolia) essential oils against Monogenean parasite (Dactylogyrus sp.) on carp (Cyprinus carpio). Helminthologia 2023, 60, 125–133. [Google Scholar] [CrossRef]
- Roy, S.; Rhim, J.W. Carrageenan/agar-based functional film integrated with zinc sulfide nanoparticles and Pickering emulsion of tea tree essential oil for active packaging applications. Int. J. Biol. Macromol. 2021, 193, 2038–2046. [Google Scholar]
- Proença, L.B.; Pena, C.A.P.; da Silva, G.V.; Camargo, I.L.B.D.; Branciforti, M.C. Study of the Antibacterial Property of Tea Tree Oil and Its Incorporation Into Poly(Lactic Acid)-montmorillonite Clay Bionanocomposites. Macromol. Symp. 2020, 394, 2000073. [Google Scholar] [CrossRef]
- Zhou, J.C.; Xu, W. An aesthetic transparent wood resistant to Escherichia coli based on interface optimization. Eur. J. Wood Wood Prod. 2023, 81, 1569–1579. [Google Scholar]
- Chung, K.H.; Yang, K.S.; Kim, J.; Kim, J.C.; Lee, K.Y. Antibacterial activity of essential oils on the growth of Staphylococcus aureus and measurement of their binding interaction using optical biosensor. J. Microbiol. Biotechnol. 2007, 17, 1848–1855. [Google Scholar]
- Manna, S.; Seth, A.; Gupta, P.; Nandi, G.; Dutta, R.; Jana, S.; Jana, S. Chitosan derivatives as carriers for drug delivery and biomedical applications. ACS Biomater. Sci. Eng. 2023, 9, 2181–2202. [Google Scholar] [PubMed]
- Xu, H.J.; Chen, C.B.; Xiao, J.H.; Pan, J.Q.; Shen, L.M.; Zhang, Y. Effect of chitosan quaternary ammonium salt-modified waterborne epoxy resin on wood dimensional stability and anticorrosion/antimildew properties. J. For. Eng. 2024. Available online: https://link.cnki.net/urlid/32.1862.S.20241209.1527.001 (accessed on 10 December 2024).
- Wu, Z.H.; Chang, Y.J. Research and application of microcapsule technology in the wood industry. J. For. Eng. 2024. Available online: https://link.cnki.net/urlid/32.1862.S.20241029.1345.007 (accessed on 29 October 2024).
- Kankariya, Y.; Chatterjee, B. Biomedical Application of Chitosan and Chitosan Derivatives: A Comprehensive Review. Curr. Pharm. Des. 2023, 29, 1311–1325. [Google Scholar]
- Wang, W.Q.; Meng, Q.Y.; Li, Q.; Liu, J.B.; Zhou, M.; Jin, Z.; Zhao, K. Chitosan derivatives and their application in biomedicine. Int. J. Mol. Sci. 2020, 21, 487. [Google Scholar] [CrossRef]
- Holyavka, M.; Redko, Y.; Goncharova, S.; Lavlinskaya, W.; Sorokin, A.; Kondratyev, M.; Artyukhov, V. Novel Hybrid Catalysts of Cysteine Proteases Enhanced by Chitosan and Carboxymethyl Chitosan Micro- and Nanoparticles. Polymers 2024, 16, 3111. [Google Scholar] [CrossRef]
- Kwon, W.; Jeong, E. Detoxification Properties of Guanidinylated Chitosan Against Chemical Warfare Agents and Its Application to Military Protective Clothing. Polymers 2020, 12, 1461. [Google Scholar] [CrossRef]
- Hu, Z.Y.; Gänzle, M.G. Challenges and opportunities related to the use of chitosan as a food preservative. J. Appl. Microbiol. 2019, 126, 1318–1331. [Google Scholar] [PubMed]
- Zhu, J.H.; Chen, X.; Chen, Y.; Huang, C.; Zhong, M.J.; Hu, Y. Preparation and characterization of ternary polysaccharide hydrogels based on carboxymethyl cellulose, carboxymethyl chitosan, and carboxymethyl β-cyclodextrin. J. Int. J. Biol. Macromol. 2024, 271, 132604. [Google Scholar] [CrossRef] [PubMed]
- Liu, Y.; Hu, W.A.; Kasal, A.; Erdil, Y.Z. The State of the Art of Biomechanics Applied in Ergonomic Furniture Design. Appl. Sci.-Basel 2023, 13, 12120. [Google Scholar] [CrossRef]
- Zeng, A.R.; Wang, Y.T.; Li, D.J.; Guo, J.D.; Chen, Q.W. Preparation and antibacterial properties of polycaprolactone/quaternized chitosan blends. Chin. J. Chem. Eng. Macromol. 2021, 32, 462–471. [Google Scholar] [CrossRef]
- Zhou, C.M.; Yu, R.L.; Kaner, J. Evaluating functional ability in older adults’ object retrieval behavior from kitchen furniture using OpenPose and REBA. Sci. Rep. 2024, 14, 25560. [Google Scholar]
- Weng, M.Y.; Zhu, Y.T.; Mao, W.G.; Zhou, J.C.; Xu, W. Nano-Silica/Urea-Formaldehyde Resin-Modified Fast-Growing Lumber Performance Study. Forests 2023, 14, 1440. [Google Scholar] [CrossRef]
- Li, Y.Z.; Liu, J.M.; He, X.F.; Kong, D.X.; Zhou, C.; Wu, H.; Yang, Z.M.; Yang, Z.H.; Hu, Y. Preparation of Cinnamon Oil-Loaded Antibacterial Composite Microcapsules by In Situ Polymerization of Pickering Emulsion Templates. Macromol. Mater. 2020, 305, 1900851. [Google Scholar]
- Hu, W.G.; Zhang, J.L. Effect of growth rings on acoustic emission characteristic signals of southern yellow pine wood cracked in mode I. Constr. Build. Mater. 2022, 329, 127092. [Google Scholar]
- Wu, J.F.; Zhang, L.Y. Dissolution behavior and conformation change of chitosan in concentrated chitosan hydrochloric acid solution and comparison with dilute and semidilute solutions. Int. J. Biol. Macromol. 2019, 121, 1101–1108. [Google Scholar]
- Rubina, M.; Elmanovich, I.; Vasil’kov, A. AFM Studies of Chitosan, Gold-Chitosan, and Silver-Chitosan Films Morphology. Macromol. Symp. 2020, 389, 1900068. [Google Scholar]
- Wijesirigunawardana, P.B.; Perera, B.G.K. Development of a Cotton Smart Textile with Medicinal Properties Using Lime Oil Microcapsules. Acta. Chim. Slov. 2018, 65, 150–159. [Google Scholar] [CrossRef] [PubMed]
- Zhang, X.M.; Zhu, L.K.; Cheng, L.; Yuan, B.Z. Preparation and Release Behavior Analysis of Chitosan/Sodium Alginate/Porous Starch-Tea Tree Essential Oil Microcapsule. Chinese J. Anal. Chem. 2019, 47, 862–868. [Google Scholar]
- Hu, W.G.; Wan, H. Comparative study on weathering durability property of phenol formaldehyde resin modified sweetgum and southern pine specimens. Maderas-Cienc. Tecnol. 2022, 24, 100417. [Google Scholar] [CrossRef]
- Fei, X.N.; Liang, D.C.; Zhao, H.B.; Yang, X.P.; Yin, M.Y.; He, Z.K.; Liu, Z.F.; Fan, X.P. Preparation of chitosan-hyaluronic acid microcapsules and its dynamic release behavior analysis in a 3D-printed microchannel system: Exploration and verification. Int. J. Biol. Macromol. 2024, 273, 133031. [Google Scholar]
- Yuan, Y.; Geng, X.; Wu, H.; Kumar, R.; Wang, J.; Xiao, J.S.; Tian, H.F. Chemical composition, antimicrobial activities, and microencapsulation by complex coacervation of tea tree essential oils. J. Food Process. Preserv. 2022, 46, e16585. [Google Scholar]
- Zhang, S.; Chen, J.; Yin, X.Q.; Wang, X.Y.; Qiu, B.N.; Zhu, L.; Lin, Q. Microencapsulation of tea tree oil by spray-drying with methyl cellulose as the emulsifier and wall material together with chitosan/alginate. J. Appl. Polym. Sci. 2017, 134, 44662. [Google Scholar]
- Esparza, Y.; Ngo, T.D.; Boluk, Y. Preparation of powdered oil particles by spray drying of cellulose nanocrystals stabilized Pickering hempseed oil emulsions. Colloid Surfaces A 2020, 598, 124823. [Google Scholar]
- Uko, L.; Noby, H.; Zkria, A.; ElKady, M. Electrospraying of Bio-Based Chitosan Microcapsules Using Novel Mixed Cross-Linker: Experimental and Response Surface Methodology Optimization. Materials 2022, 15, 8447. [Google Scholar] [CrossRef]
- Zhu, L.; Liu, Y.J.; Liu, J.M.; Qiu, X.X.; Lin, L.J. Preparation and characterization of tea tree essential oil microcapsule-coated packaging paper with bacteriostatic effect. Food Chem. X 2024, 23, 101510. [Google Scholar]
- Kawakita, R.; Leveau, J.H.J.; Jeoh, T. Optimizing viability and yield and improving stability of Gram-negative, non-spore forming plant-beneficial bacteria encapsulated by spray-drying. Bioprocess Biosyst. Eng. 2021, 44, 2289–2301. [Google Scholar]
- ISO 20579-3:2021; Surface Chemical Analysis—Sample Handling, Preparation and Mounting Part 3: Biomaterials. International Standard Published: Geneva, Switzerland, 2021.
- GB/T 11186.3-1989; Methods for Measuring the Color of Paint Films—Part 3: Calculation of Color Differences. Standardization Administration of the People’s Republic of China: Beijing, China, 1989.
- GB/T 4893.6-2013; Test of Surface Coatings of Furniture—Part 6: Determination of Gloss Value. Standardization Administration of the People’s Republic of China: Beijing, China, 2013.
- ISO 2813: 2014; Paints and Varnishes—Determination of Gloss Value at 20°, 60° and 85°. International Standard Published: Geneva, Switzerland, 2014.
- ISO 25178-601:2025; Geometrical Product Specifications (GPS)—Surface Texture: Areal. International Standard Published: Geneva, Switzerland, 2025.
- ASTM D2370-16 (2021); Standard Test Method for Tensile Properties of Organic Coatings. American Society of Testing Materials: West Conshohocken, PA, USA, 2021.
- GB/T 21866-2008; Test Method and Effect for Antibacterial Capability of Paints Film. Standardization Administration of the People’s Republic of China: Beijing, China, 2008.
- GB/T 4789.2-2022; National Food Safety Standard for Microbiological Examination of Food—Determination of Total Colony Count. Standardization Administration of the People’s Republic of China: Beijing, China, 2022.
- Sun, L.J.; Feng, Y.; Qian, X.M.; Jin, S.X.; Liang, Q. Enhancing Antibacterial Performance of Viscose Spunlaced Nonwovens by Wormwood Extract Microcapsule Finishing. Fiber Polym. 2023, 24, 1275–1284. [Google Scholar] [CrossRef]
- Håkansson, A.; Nilsson, L. The effect of emulsifier concentration on turbulent drop breakup–An experimental study based on single drop visualizations. J. Colloid Interface Sci. 2025, 679, 344–353. [Google Scholar] [CrossRef]
- Zemlyakova, E.S.; Tcibulnikova, A.V.; Slezhkin, V.A.; Zubin, A.Y.; Samusev, I.G.; Bryukhanov, V.V. The infrared spectroscopy of chitosan films doped with silver and gold nanoparticles. J. Polym. Eng. 2019, 39, 415–421. [Google Scholar] [CrossRef]
- Sun, Y.J.; Zheng, H.L.; Zhao, C.; Xiao, X.F.; Xu, Y.H.; Wu, H.F.; Sun, W.Q.; Ren, M.J.; Zhu, C.Y. The Spectral Characterizations of Chitosan Based Flocculants Synthesized by Photopolymerization. Spectrosc. Spect. Anal. 2017, 37, 2527–2532. [Google Scholar]
- Grgac, S.F.; Tesla, T.; Corak, I.; Bosnjak, F.Z. Hydrothermal Synthesis of Chitosan and Tea Tree Oil on Plain and Satin Weave Cotton Fabrics. Materials 2022, 15, 5034. [Google Scholar] [CrossRef] [PubMed]
- Song, X.Y.; Wang, L.; Liu, L.; Li, J.K.; Wu, X.X. Impact of tea tree essential oil and citric acid/choline chloride on physical, structural and antibacterial properties of chitosan-based films. Food Control 2022, 141, 109186. [Google Scholar] [CrossRef]
- Qiu, S.F.; Gao, F.; Liang, Z.J.; Zhong, X.M.; Hao, L.; Chen, H.Y.; Zhou, X.H.; Zhou, H.J. Rosin modified aminated mesoporous silica adsorbed tea tree oil sustained-release system for improve synergistic antibacterial and long-term antibacterial effects. Nanotechnology 2021, 32, 275707. [Google Scholar] [CrossRef]
- Qu, H.H.; Feng, M.J.; Li, M.; Tian, D.J.; Zhang, Y.S.; Chen, X.F.; Li, G. Enhancing the carbonation and chloride resistance of concrete by nano-modified eco-friendly water-based organic coatings. Mater. Today Commun. 2023, 37, 107284. [Google Scholar] [CrossRef]
- Wang, C.; Zhou, Z.Y. Optical Properties and Lampshade Design Applications of PLA 3D Printing Materials. Bioresources 2023, 18, 1545–1553. [Google Scholar] [CrossRef]
- Wang, C.; Yu, J.H.; Jiang, M.H.; Li, J.Y. Effect of Slicing Parameters on the Light Transmittance of 3D-printed Polyethylene Terephthalate Glycol Products. Bioresources 2024, 19, 500–509. [Google Scholar] [CrossRef]
- Hu, W.G.; Yu, R.Z.; Yang, P. Characterizing Roughness of Wooden Mortise and Tenon Considering Effects of Measured Position and Assembly Condition. Forests 2024, 15, 1584. [Google Scholar] [CrossRef]
- Yu, R.Z.; Liu, Y.; Konukcu, A.C.; Hu, W.G. A method of simulating seat load for numerical analysis of wood chair structure. Wood Res. 2024, 69, 432–444. [Google Scholar]
- Wang, C.; Zhang, C.Y.; Ding, K.Q.; Jiang, M.H. Immersion Polishing Post-treatment of PLA 3D Printed Formed Parts on Its Surface and Mechanical Performance. Bioresources 2023, 18, 7995–8006. [Google Scholar] [CrossRef]
- Hu, W.G.; Luo, M.Y.; Yu, R.Z.; Zhao, Y. Effects of the selected factors on cyclic load performance of T-shaped mortise-and-tenon furniture joints. Wood Mater. Sci. Eng. 2024, 19, 2384606. [Google Scholar] [CrossRef]
- Hu, W.G.; Yu, R.Z. Study on the strength mechanism of the wooden round-end mortise-and-tenon joint using the digital image correlation method. Holzforschung 2024, 78, 519–530. [Google Scholar] [CrossRef]
- Hu, W.G.; Luo, M.Y.; Liu, Y.Q.; Xu, W.; Konukcu, A.C. Experimental and numerical studies on the mechanical properties and behaviors of a novel wood dowel reinforced dovetail joint. Eng. Fail. Anal. 2023, 152, 107440. [Google Scholar]
- Wang, C.; Yu, J.H.; Jiang, M.H.; Li, J.Y. Effect of Selective Enhancement on the Bending Performance of Fused Deposition Methods 3D-Printed PLA Models. Bioresources 2024, 19, 2660–2669. [Google Scholar]
- Hu, W.G.; Zhao, Y.; Xu, W.; Liu, Y.Q. The Influences of Selected Factors on Bending Moment Capacity of Case Furniture Joints. Appl. Sci. 2024, 14, 10044. [Google Scholar] [CrossRef]
- Chen, B.R.; Yu, X.J.; Hu, W.G. Experimental and Numerical Studies on the Cantilevered Leg Joint and its Reinforced Version Commonly Used in Modern Wood Furniture. Bioresources 2022, 17, 3952–3964. [Google Scholar]
- Chen, B.R.; Xia, H.Y.; Hu, W.G. The design and evaluation of the three-dimensional corner joints used in wooden furniture frames: Experimental and numerical. Bioresources 2022, 17, 2143–2156. [Google Scholar] [CrossRef]
- Hu, W.G.; Liu, Y.; Konucku, A.C. Study on withdrawal load resistance of screw in wood-based materials: Experimental and numerical. Wood Mater. Sci. Eng. 2023, 18, 334–343. [Google Scholar]
- Li, S.; Hu, W.G. Study on Mechanical Strength of Cantilever Handrail Joints for Chair. Bioresources 2023, 18, 209–219. [Google Scholar]


| Test Material | Purity | Producer |
|---|---|---|
| TTO | - | Jiangxi Zhonghuan Biotechnology Co., Ltd., Ji’an, China |
| CS | AR | Qingdao Boyite Biomaterials Co., Ltd., Qingdao, China |
| SDBS | AR | Shandong Longhui Chemical Co., Ltd., Jinan, China |
| Tween-80 | AR | Shanghai Kanglang Biotechnology Co., Ltd., Shanghai, China |
| Acetic acid | AR | Henan Mingao Chemical Co., Ltd., Anyang, China |
| Sodium tripolyphosphate (STPP) | AR | Yuntianhua Group Co., Ltd., Kunming, China |
| Dulux primer | - | Dulux Paint Co., Ltd., Xiamen, China |
| Nutrient agar medium | - | Sinopharm Group Chemical reagent Co., Ltd., Shanghai, China |
| Nutrient broth medium | - | Sinopharm Group Chemical reagent Co., Ltd., Shanghai, China |
| Sodium chloride | AR | Sinopharm Group Chemical reagent Co., Ltd., Shanghai, China |
| Escherichia coli | - | Beijing Baozang Biotechnology Co., Ltd., Beijing, China |
| Staphylococcus aureus | - | Beijing Baozang Biotechnology Co., Ltd., Beijing, China |
| Equipment | Model | Manufacturer |
|---|---|---|
| High-precision balance | BSA323S | Sartorius Scientific Instruments (Beijing) Co., Ltd., Beijing, China |
| Heat-collecting magnetic stirrer | DF-101S | Shenzhen Dingxin Yi experimental equipment Co., Ltd., Shenzhen, China |
| Spray dryer | JA-PWGZ100 | Shenyang Jingao Instrument Technology Co., Ltd., Shenyang, China |
| Blast drying oven | DHG-9423A | Shanghai Jinghong Experimental Equipment Co., Ltd., Shanghai, China |
| Scanning electron microscope | Quanta-200 | Thermo Fisher Technologies, Waltham, MA, USA |
| Fourier infrared spectrometer | VERTEX 80 V | Bruker GMBH, Billerica, Massachusetts, Germany |
| Constant temperature and humidity box | THA150 | Ellison Instrument Equipment (Shanghai) Co., Ltd., Shanghai, China |
| High-precision gloss meter | YG268 | Shenzhen three Enshi technology Co., Ltd., Shenzhen, China |
| High-precision spectrophotometer | DC-23D | Color Spectrum Technology (Zhejiang) Co., Ltd., Hangzhou, China |
| Ultraviolet spectrophotometer | U-3900 | Hitachi Scientific Instruments (Beijing) Co., Ltd., Beijing, China |
| Universal mechanical testing machine | AGS-X | Shimadzu Production House, Kyoto, Japan |
| Roughness meter | J8-4C | Shanghai Taiming Optical Instrument Co., Ltd., Shanghai, China |
| Ultrasonic emulsifier | XU-JY92-IIN | Shanghai Siniu Leiper Instrument Co., Ltd., Shanghai, China |
| Circulating water vacuum pump | SHZ-D (II) | Zhengzhou Huachen Instrument Co., Ltd.; Zhengzhou, China |
| Colony counter | XK97-A | Guangjurong experimental equipment business department, Chuzhou, China |
| Levels | Factor A Core–Wall Ratio | Factor B Emulsifier Concentration (%) | Factor C Mass Ratio of Tween-80 to SDBS | Factor D Oil–Water Ratio |
|---|---|---|---|---|
| 1 | 1:1 | 2.0 | 1:2 | 1:1 |
| 2 | 1.2:1 | 3.0 | 1:3 | 3:2 |
| 3 | 1.5:1 | 4.0 | 1:4 | 2:1 |
| Sample (#) | Factor A Core–Wall Ratio | Factor B Emulsifier Concentration (%) | Factor C Mass Ratio of Tween-80 to SDBS | Factor D Oil–Water Ratio |
|---|---|---|---|---|
| 1 | 1:1 | 2.0 | 1:2 | 1:1 |
| 2 | 1:1 | 3.0 | 1:3 | 3:2 |
| 3 | 1:1 | 4.0 | 1:4 | 2:1 |
| 4 | 1.2:1 | 2.0 | 1:3 | 2:1 |
| 5 | 1.2:1 | 3.0 | 1:4 | 1:1 |
| 6 | 1.2:1 | 4.0 | 1:2 | 3:2 |
| 7 | 1.5:1 | 2.0 | 1:4 | 3:2 |
| 8 | 1.5:1 | 3.0 | 1:2 | 2:1 |
| 9 | 1.5:1 | 4.0 | 1:3 | 1:1 |
| Sample (#) | CS (g) | Acetic Acid (mL) | Deionized Water for Acetic Acid (mL) | Tween-80 (g) | SDBS (g) | Deionized Water for Emulsifier (mL) | TTO (g) | STPP (g) |
|---|---|---|---|---|---|---|---|---|
| 1 | 1.000 | 0.990 | 98.010 | 0.667 | 1.333 | 98.000 | 1.000 | 0.400 |
| 2 | 1.000 | 0.657 | 65.010 | 0.750 | 2.250 | 97.000 | 1.000 | 0.400 |
| 3 | 1.000 | 0.490 | 48.510 | 1.000 | 3.000 | 96.000 | 1.000 | 0.400 |
| 4 | 1.000 | 0.490 | 48.510 | 0.500 | 1.500 | 98.000 | 1.200 | 0.400 |
| 5 | 1.000 | 0.990 | 98.010 | 0.600 | 2.400 | 97.000 | 1.200 | 0.400 |
| 6 | 1.000 | 0.657 | 65.010 | 1.333 | 2.667 | 96.000 | 1.200 | 0.400 |
| 7 | 1.000 | 0.657 | 65.010 | 0.400 | 1.600 | 98.000 | 1.500 | 0.400 |
| 8 | 1.000 | 0.490 | 48.510 | 1.000 | 2.000 | 97.000 | 1.500 | 0.400 |
| 9 | 1.000 | 0.990 | 98.010 | 1.000 | 3.000 | 96.000 | 1.500 | 0.400 |
| Sample (#) | CS (g) | Acetic Acid (mL) | Deionized Water for Acetic Acid (mL) | Tween-80 (g) | SDBS (g) | Deionized Water for Emulsifier (mL) | TTO (g) | STPP (g) |
|---|---|---|---|---|---|---|---|---|
| 10 | 2.000 | 0.100 | 99.000 | 0.400 | 1.600 | 198.000 | 2.400 | 0.400 |
| 11 | 2.000 | 0.100 | 99.000 | 0.800 | 3.2000 | 196.000 | 2.400 | 0.400 |
| 12 | 2.000 | 0.100 | 99.000 | 1.200 | 4.800 | 194.000 | 2.400 | 0.400 |
| 13 | 2.000 | 0.100 | 99.000 | 1.600 | 6.400 | 192.000 | 2.400 | 0.400 |
| 14 | 2.000 | 0.100 | 99.000 | 2.000 | 8.000 | 190.000 | 2.400 | 0.400 |
| 15 | 2.000 | 0.100 | 99.000 | 2.400 | 9.600 | 188.000 | 2.400 | 0.400 |
| Sample (#) | Factor A Core–Wall Ratio | Factor B Emulsifier Concentration (%) | Factor C Mass Ratio of Tween-80 to SDBS | Factor D Oil–Water Ratio | Output (g) | Yield (%) |
|---|---|---|---|---|---|---|
| 1 | 1:1 | 2.0 | 1:2 | 1:1 | 1.10 | 20.37 |
| 2 | 1:1 | 3.0 | 1:3 | 3:2 | 2.03 | 33.44 |
| 3 | 1:1 | 4.0 | 1:4 | 2:1 | 2.33 | 33.77 |
| 4 | 1.2:1 | 2.0 | 1:3 | 2:1 | 1.17 | 22.94 |
| 5 | 1.2:1 | 3.0 | 1:4 | 1:1 | 1.64 | 24.85 |
| 6 | 1.2:1 | 4.0 | 1:2 | 3:2 | 3.12 | 42.92 |
| 7 | 1.5:1 | 2.0 | 1:4 | 3:2 | 0.82 | 14.72 |
| 8 | 1.5:1 | 3.0 | 1:2 | 2:1 | 1.85 | 28.91 |
| 9 | 1.5:1 | 4.0 | 1:3 | 1:1 | 3.20 | 40.51 |
| Mean value 1 | 29.193 | 19.343 | 30.733 | 28.577 | ||
| Mean value 2 | 30.237 | 29.067 | 32.297 | 30.360 | ||
| Mean value 3 | 28.047 | 39.067 | 24.447 | 28.540 | ||
| Range | 2.19 | 19.723 | 7.85 | 1.82 | ||
| Factor primary and secondary level | B > C > A > D | |||||
| Optimal level | A2 | B3 | C2 | D2 | ||
| Optimal scheme | A2 B3 C2 D2 | |||||
| Factors | Deviation Sum of Squares | Free Degree | F-Ratio | F-Critical Value | Significance |
|---|---|---|---|---|---|
| A | 7.199 | 2 | 0.041 | 4.460 | |
| B | 583.553 | 2 | 3.331 | 4.460 | |
| C | 103.589 | 2 | 0.591 | 4.460 | |
| D | 6.494 | 2 | 0.037 | 4.460 | |
| Error | 700.84 | 8 |
| Sample (#) | Factor A Core–Wall Ratio | Factor B Emulsifier Concentration (%) | Factor C Mass Ratio of Tween-80 to SDBS | Factor D Oil–Water Ratio | Coverage Rate (%) |
|---|---|---|---|---|---|
| 1 | 1:1 | 2.0 | 1:2 | 1:1 | 62.5 |
| 2 | 1:1 | 3.0 | 1:3 | 3:2 | 57.5 |
| 3 | 1:1 | 4.0 | 1:4 | 2:1 | 60.0 |
| 4 | 1.2:1 | 2.0 | 1:3 | 2:1 | 67.5 |
| 5 | 1.2:1 | 3.0 | 1:4 | 1:1 | 57.5 |
| 6 | 1.2:1 | 4.0 | 1:2 | 3:2 | 50.0 |
| 7 | 1.5:1 | 2.0 | 1:4 | 3:2 | 57.5 |
| 8 | 1.5:1 | 3.0 | 1:2 | 2:1 | 47.5 |
| 9 | 1.5:1 | 4.0 | 1:3 | 1:1 | 45.0 |
| Mean value 1 | 60.000 | 62.500 | 53.333 | 55.000 | |
| Mean value 2 | 58.333 | 54.167 | 56.667 | 55.000 | |
| Mean value 3 | 50.000 | 51.667 | 58.333 | 58.333 | |
| Range | 10.000 | 10.833 | 5.000 | 3.333 | |
| Factor primary and secondary level | B > A > C > D | ||||
| Optimal level | A1 | B1 | C3 | D3 | |
| Optimal scheme | A1 B1 C3 D3 | ||||
| Factors | Deviation Sum of Squares | Free Degree | F-Ratio | F-Critical Value | Significance |
|---|---|---|---|---|---|
| A | 172.222 | 2 | 1.616 | 4.460 | |
| B | 193.066 | 2 | 1.811 | 4.460 | |
| C | 38.889 | 2 | 0.365 | 4.460 | |
| D | 22.222 | 2 | 0.208 | 4.460 | |
| Error | 426.39 | 8 |
| Sample (#) | Emulsifier Concentration (%) | Yield (%) | Coverage Rate (%) |
|---|---|---|---|
| 10 | 1.0 | 24.49 | 45.0 |
| 11 | 2.0 | 26.84 | 47.5 |
| 12 | 3.0 | 31.86 | 50.0 |
| 13 | 4.0 | 32.10 | 57.5 |
| 14 | 5.0 | 35.19 | 47.5 |
| 15 | 6.0 | 30.56 | 50.0 |
| Sample (#) | Average Number of Recovered Bacteria (CFU/piece) | Antimicrobial Rate (%) | ||
|---|---|---|---|---|
| Escherichia coli | Staphylococcus aureus | Escherichia coli | Staphylococcus aureus | |
| 0 | 207 | 186 | - | - |
| 10 | 80 | 108 | 61.35 | 41.64 |
| 11 | 155 | 83 | 25.12 | 55.38 |
| 12 | 109 | 97 | 47.34 | 47.85 |
| 13 | 56 | 45 | 72.95 | 75.81 |
| 14 | 64 | 85 | 70.53 | 54.30 |
| 15 | 81 | 47 | 60.87 | 74.73 |
| Sample (#) | L | a | b | ΔE |
|---|---|---|---|---|
| 0 | 81.43 | 1.60 | 1.60 | - |
| 10 | 82.20 | 1.67 | 2.60 | 1.26 |
| 11 | 81.63 | 0.97 | 1.37 | 0.70 |
| 12 | 81.73 | 1.43 | 1.47 | 0.37 |
| 13 | 84.10 | 1.57 | 0.83 | 2.77 |
| 14 | 81.83 | 1.93 | 2.10 | 0.72 |
| 15 | 83.37 | 2.10 | 1.27 | 2.02 |
| Sample (#) | Glossiness (GU) | Light Loss Rate (%) | ||||
|---|---|---|---|---|---|---|
| 20° | 60° | 85° | 20° | 60° | 85° | |
| 0 | 16.2 | 29.3 | 37.1 | - | - | - |
| 10 | 15.3 | 27.9 | 32.8 | 5.56 | 4.78 | 11.59 |
| 11 | 14.3 | 24.3 | 31.2 | 11.73 | 17.06 | 15.90 |
| 12 | 15.7 | 26.7 | 33.3 | 3.09 | 8.87 | 10.24 |
| 13 | 11.3 | 22.8 | 28.3 | 30.35 | 22.18 | 23.72 |
| 14 | 10.3 | 23.3 | 29.5 | 36.42 | 20.48 | 20.49 |
| 15 | 11.5 | 22.7 | 24.8 | 29.01 | 22.53 | 33.15 |
| Sample (#) | Transmittance (%) |
|---|---|
| 0 | 95.65 |
| 10 | 86.34 |
| 11 | 84.67 |
| 12 | 88.42 |
| 13 | 87.80 |
| 14 | 86.24 |
| 15 | 86.28 |
| Sample (#) | Roughness (μm) |
|---|---|
| 0 | 0.267 |
| 10 | 0.281 |
| 11 | 0.269 |
| 12 | 0.423 |
| 13 | 0.304 |
| 14 | 0.322 |
| 15 | 0.344 |
| Sample (#) | Elongation (%) | σ (MPa) | E (GPa) |
|---|---|---|---|
| 0 | 20.73 | 4.84 | 0.23 |
| 10 | 7.63 | 4.37 | 0.57 |
| 11 | 15.17 | 4.53 | 0.30 |
| 12 | 16.09 | 4.59 | 0.29 |
| 13 | 17.47 | 2.50 | 0.14 |
| 14 | 16.15 | 1.64 | 0.10 |
| 15 | 4.80 | 2.94 | 0.61 |
Disclaimer/Publisher’s Note: The statements, opinions and data contained in all publications are solely those of the individual author(s) and contributor(s) and not of MDPI and/or the editor(s). MDPI and/or the editor(s) disclaim responsibility for any injury to people or property resulting from any ideas, methods, instructions or products referred to in the content. |
© 2025 by the authors. Licensee MDPI, Basel, Switzerland. This article is an open access article distributed under the terms and conditions of the Creative Commons Attribution (CC BY) license (https://creativecommons.org/licenses/by/4.0/).
Share and Cite
Zhu, Y.; Yan, X. Preparation of Tea Tree Essential Oil–Chitosan Microcapsules and Its Effect on the Properties of Water-Based Coating. Polymers 2025, 17, 849. https://doi.org/10.3390/polym17070849
Zhu Y, Yan X. Preparation of Tea Tree Essential Oil–Chitosan Microcapsules and Its Effect on the Properties of Water-Based Coating. Polymers. 2025; 17(7):849. https://doi.org/10.3390/polym17070849
Chicago/Turabian StyleZhu, Ye, and Xiaoxing Yan. 2025. "Preparation of Tea Tree Essential Oil–Chitosan Microcapsules and Its Effect on the Properties of Water-Based Coating" Polymers 17, no. 7: 849. https://doi.org/10.3390/polym17070849
APA StyleZhu, Y., & Yan, X. (2025). Preparation of Tea Tree Essential Oil–Chitosan Microcapsules and Its Effect on the Properties of Water-Based Coating. Polymers, 17(7), 849. https://doi.org/10.3390/polym17070849