Abstract
Textile production contributes significantly to water pollution, making dye removal crucial for protecting water resources from toxic textile waste. The use of nano-adsorbents for water purification has emerged as a promising approach to removing pollutants from wastewater. Nickel Ferrite (NiFe2O4), Iron Oxide (Fe2O3), and Nickel Oxide (NiO) nanoparticles (NPs) were prepared via an auto-combustion sol–gel technique using chitosan as a capping and stabilizing agent. The prepared nanomaterials were characterized using various techniques such as XRD, UV-Vis DRS, FT-IR, Raman, EDX, SEM, and TEM to confirm their structure, particle size, morphology, functional groups on the surface, and optical properties. Subsequently, the adsorption of the methylene blue (MB) dye using the prepared nanomaterials was studied. NiFe2O4 NPs exhibited the best adsorption behavior compared to the mono-metal oxides. Moreover, all prepared nanomaterials were compatible with the pseudo-second-order model. Further investigations were conducted for NiFe2O4 NPs, showing that both the Freundlich and Langmuir isotherm models can explain the adsorption of the MB dye on the surface of NiFe2O4 NPs. Factors affecting MB dye adsorption were discussed, such as adsorbent dose, concentration of the MB dye, contact time, pH, and temperature. NiFe2O4 NPs exhibited a maximum removal efficiency of the MB dye, reaching 96.8% at pH 8. Different water sources were used to evaluate the ability of NiFe2O4 NPs to purify a wide range of water types.
1. Introduction
Globally, freshwater supplies are being threatened by increasing industrial pollution. Since water is a vital element for all living creatures, there is an escalating environmental risk associated with this [1]. The increasing use of dyes, especially reactive, direct, basic, and acidic dyes, which have high solubility in water and are difficult to remove from textiles using conventional methods, endangers human health and the environment [2,3,4,5]. Adsorption is the most economical, fast, and simple method for dye removal compared to other methods [1].
Methylene blue (MB) dye is a cationic dye from the phenothiazine family. This dye dissolves in water to give a blue solution. Moreover, it is widely used in various applications, such as biomedical applications, textiles, dyeing, food industries, and medicine. However, this dye poses significant dangers to human health because it is toxic, carcinogenic, and non-biodegradable. It is crucial to find a suitable method to remove this dye from wastewater [6].
In recent years, nanoparticles have been used in a wide variety of applications, including catalysis [7], medicine [8], batteries [9], sensors [10], fuel production [11], and cosmetics [12]. Among the different types of nanomaterials, ferrite nanoparticles (FNPs) with the general formula MFe2O4 (where M is a transition metal) have gained significant attention due to their characteristic properties [13]. Their high magnetic properties allow them to be easily separated from treated water, facilitating recovery and reuse. Consequently, nanoparticle residues in wastewater can be minimized, while the overall process cost is reduced [14,15]. Furthermore, they are characterized by large surface areas, small sizes, high reactivity, high blendability, and robust movement in solutions [16,17].
Nickel ferrite (NiFe2O4) has attracted considerable attention for its non-toxicity, low cost, high stability, and strong magnetic properties [18]. An inverse spinel cubic structure is predominantly found in nickel ferrite, with Fe3+ ions at tetrahedral sites and Ni2+ ions at octahedral sites. In response to changes in size and shape, it can exhibit paramagnetic, superparamagnetic, and ferromagnetic properties [19,20]. Additionally, it has a low band gap of 1.82 eV, indicating its capability to absorb visible light [21]. The properties of NiFe2O4 nanomaterials are significantly sensitive to the preparation methodology used in their synthesis. Various methods have been used for the preparation of NiFe2O4, including co-precipitation [22], Sol–Gel auto-combustion techniques [23], hydrothermal methods [24], microwave synthesis [25], and biosynthesis [21]. One of the most important issues in ferrite nanoparticle synthesis is to develop sustainable and efficient processes without agglomeration [26,27]. Biosynthesis, which uses plants, microorganisms, and biopolymers as capping, reducing, and stabilizing agents, has gained significant interest in recent years. It is characterized by being simple, cost-effective, and eco-friendly [28]. The Sol–Gel auto-combustion process is a straightforward one-pot procedure that is cost-effective, requires minimal time and external energy sources, and produces homogeneous crystals [29,30].
Chitosan is the second most abundant polysaccharide and is widely used as a capping agent in the preparation of metal oxide nanoparticles [31]. Moreover, it exhibits superior adsorption properties and selectivity towards metals and organic species due to its high content of hydroxyl and amino groups, which can easily be functionalized [32,33,34]. It is characterized by gel-forming capability, biodegradability, biocompatibility, and non-toxicity to living tissues, along with antibacterial, antifungal, and antitumor activity [35]. Nevertheless, it still has some limitations for use as a biosorbent, including low mechanical and chemical stability, difficult separation after adsorption, and solubility in acidic media [36]. In the preparation of metal oxide NPs, it can function as a capping, stabilizing, reducing, shape-directing, and size-controllable agent [31,37,38]. Therefore, ferrite nanoparticles that are mediated by chitosan display high adsorption capacities and can easily be separated from liquids after adsorption [39,40].
Sifontes et al. prepared highly porous CeO NPs with high surface area and small particle sizes by using chitosan as a template [41]. Additionally, Ben Amor et al. used chitosan as a capping agent in preparing ZnO NPs, which showed good dye degradability and antibacterial properties [42]. A chitosan-coated NiFe2O4 was prepared by Zeraatka et al. and demonstrated excellent removal of methyl orange and Congo red dyes [43]. Adeogun et al. suggested a one-pot co-precipitation method for chitosan/CoFe2O4 adsorbent, which was efficient for different types of anthraquinone dyes [44].
In the present study, chitosan-mediated nickel ferrite was prepared using a one-pot auto-combustion Sol–Gel technique, with chitosan as a gelling/capping agent and citric acid as a reducing agent. The as-prepared material was characterized using various microscopic and spectroscopic techniques. Nickel ferrite mediated by chitosan was investigated for its ability to remove methylene blue dye.
2. Experimental
2.1. Materials
Throughout these studies, all chemicals used were of high purity and did not require any additional purification. Furthermore, all solutions were prepared using deionized water. Chitosan (low molecular weight), citric acid powder (99.5% purity), acetic acid (99.8% purity), nickel(II) nitrate hexahydrate (>98% purity), iron(III) nitrate nonahydrate (≥98% purity), methylene blue (MB) (99.8% purity), sodium hydroxide (NaOH), and hydrochloric acid (HCl) were purchased from Sigma Aldrich, St. Louis, MO, USA.
2.2. Preparation of Fe2O3, NiO, NiFe2O4 NPs
Chitosan (3 g) was dissolved in a 0.1 M acetic acid solution. Ten grams of each metal precursor were dissolved in 50 mL of deionized water and added to the chitosan solution. The metal precursor solutions for NiFe2O4 were mixed before being combined with the chitosan. The solution was stirred continuously in a magnetic stirrer until homogeneous. Subsequently, 50 mL of 4% citric acid was added. At this point, the solution quickly changed to a deep black color, confirming the formation of nanoparticles (NPs). After two hours of magnetic stirring at 70 °C, a gel was formed. The gel was then auto-combusted and calcined at 500 °C for 4 h. Figure 1 shows the complete synthesis scheme of the prepared materials.
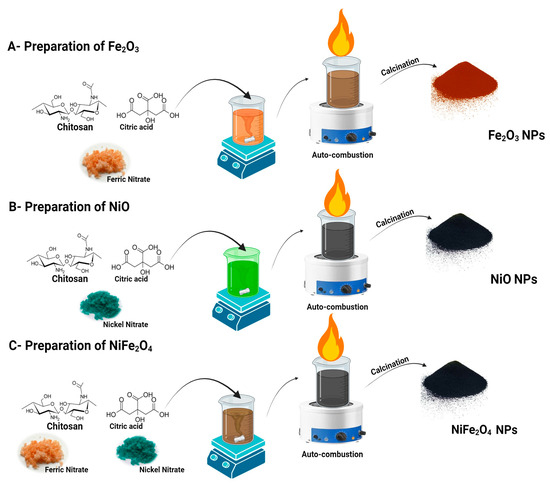
Figure 1.
The schematic representation of the auto-combustion Sol–Gel synthesis of NiFe2O4 NPs using different chitosan as capping agent and citric acid as reducing agent.
2.3. Characterization
2.3.1. X-Ray Diffraction (XRD)
An X-ray diffractometer model k Alpha manufactured by (Thermofisher, Waltham, MA, USA) was used to examine the formation of NiFe2O4, Fe2O3, and NiO nanoparticles, as well as their crystallinity and particle size, using a Cu Kα X-ray source (1.54056 Å) at 40 kV, in the range of 5 to 80 degrees 2θ. Particle size was calculated using the Scherrer equation [45]:
where K = Scherrer constant, θ = Bragg angle, λ = wavelength of the X-ray beam used (1.54184 Å), and β = the Full width at half maximum (FWHM) of the peak.
2.3.2. UV-Visible Spectroscopy
An X-ray diffractometer (Bruker’s D8 Advance) was used to examine the formation of NiFe2O4, Fe2O3, and NiO nanoparticles, as well as their crystallinity and particle size, using a Cu Kα X-ray source (1.54056 Å) at 40 kV, in the range of 5 to 80 degrees 2θ. Particle size was calculated using the Scherrer equation [45]:
where α = Absorption coefficient, A = Tailing parameter constant, h = Planck’s constant, Eg = Optical band gap, ν = Frequency of incident photons.
αhν = A(hν − Eg)n
2.3.3. Fourier Transform Infrared Spectroscopy (FTIR)
The functional groups of adsorbent sample play a critical role in improving adsorption. Therefore, a Fourier Transform Infrared Spectrometer (Model: Bruker Optics GmbH & Co., Rosenheim, Germany) was used to investigate the functional groups on the surface of the material.
2.3.4. Transmission Electron Microscopy (TEM)
Transmission Electron Microscopes JET-1400FLASH (JEOL, Tokyo, Japan)was used to examine shape and size of the nanoparticles.
2.3.5. Scanning Electron Microscopy with Energy Dispersive X-Ray Analysis (SEM-EDX)
(Hitachi S-3400N SEM, Hitachi, Chiyoda, Japan) was used to examine the morphology, purity, and elemental composition of the samples.
2.3.6. Raman Spectroscopy
A Raman microscope (Bruker, Billerica, MA, USA) is used to examine the structural characteristics of nanomaterials.
2.4. Determination of MB Dye Concentration in Solution
The concentration of MB dye was determined using a UV-VIS double-beam PC scanning spectrophotometer (UVD-2960) (Labomed, Inc., Los Angeles, CA, USA). A variety of concentrations of MB dye were prepared (1, 10, 20, 30, and 40 ppm). The standard curve of absorbance versus concentration is shown in Figure 2.
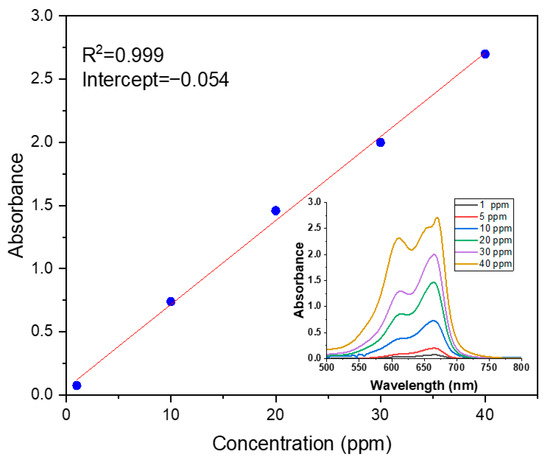
Figure 2.
Calibration curve of UV-Vis absorption.
2.5. Adsorption Experiment
Adsorption experiments were conducted in a 50 mL capped conical flask using 25 mL of methylene blue (MB) dye solution under ambient conditions and normal pH, except when studying the effects of pH and temperature. The MB dye solution was filtered using a syringe filter (Type: Nylon 6, 0.22 μm, Tianjin Jinteng Experiment Equipment Co., Ltd., Tianjin, China). In this study, the impact of several factors, such as adsorbent dosage, MB dye concentration, pH, and temperature, on the adsorption and desorption of MB dye on the surface of as-prepared NiFe2O4 was examined. The removal percentage of MB dye and the amount of adsorbed MB dye per unit mass (mg/g) were calculated using the following equations [46]:
where Ao and At are the absorbance of MB dye at t = 0 and t = t, Co and Ct are the concentration (ppm) of MB dye at t = 0 and t = t, qt is the amount of dyes adsorbed on the solid phase, V is the volume of solution in (L), m is the adsorbent weight in gram. qt is the amount of dyes that adsorbed on the surface of solid phase (mg/g).
The kinetic adsorption experiments were conducted using 25 mL of MB dye solution (10 ppm) and 0.15 g of adsorbent under continuous magnetic stirring. The samples and the adsorbent were separated at varying times. A similar experiment, conducted at a different temperature, was performed to study the adsorption isotherm.
2.6. Water Samples Collection and Experiments
Tap water was collected from the laboratory at King Abdulaziz University in Jeddah. Before collecting the sample, the water was allowed to flow for seven minutes. Seawater samples were taken from the Red Sea. Both tap water and seawater were filtered twice to remove any solid particles. Mineral water was purchased from the Saudi market. Deionized and distilled water were obtained from the deionizer and distilled water units in the laboratory at King Abdulaziz University. Adsorption experiments were conducted in a 50 mL conical flask using 25 mL of methylene dye (10 ppm) solution and 0.15 g of adsorbent under ambient.
3. Results and Discussions
3.1. Characterization Results
3.1.1. X-Ray Diffraction Results
The XRD patterns of Fe2O3, NiO, and NiFe2O4 NPS are shown in Figure 3. Fe2O3 patterns in Figure 3a were compared by JCPDS card file no. 33-0664 of α-Fe2O3 NPs and JCPDS card file no. JCPDS Card No. 019-0629 for Fe3O4 [47,48]. The XRD patterns exhibited distinguishable peaks at 2θ = 24.15°, 35.80°, 40.88°, 49.57°, 54.11°, 62.82°, and 64.16°, which correspond to the lattice planes (012), (104), (110), (113), (024), (116), (214), and (300) of α-Fe2O3 NPs, respectively [47].
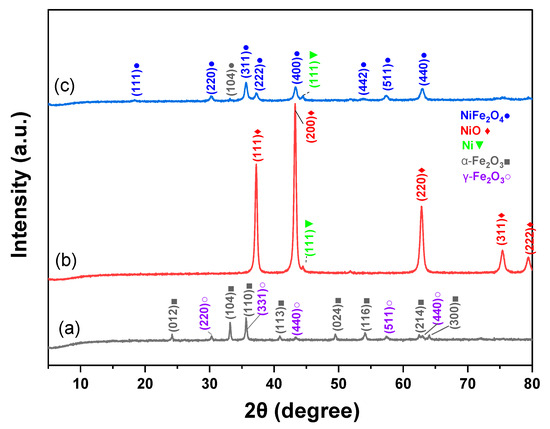
Figure 3.
XRD patterns of (a) Fe2O3, (b) NiO, and (c) NiFe2O4 NPs.
The prominent diffraction peaks that appeared at 2θ = 30.31°, 35.66°, 43.29°, 57.46°, and 62.94° are related to (220), (331), (440), (511), and (440) Fe3O4 lattice planes, respectively [48,49]. According to JCPDS card file no. 78-0643, the diffraction peaks at around 2θ = 37.26°, 43.29°, 62.94°, 75.38°, and 79.53° shown in Figure 3b correspond to the (111), (200), (220), (311), and (222) lattice planes of NiO, respectively [50,51]. The peaks at around 33.18° and 44.48° are related to the iron oxide and metallic Ni NPs, respectively [52,53]. Based on JCPDS card file no. 10-0325, NiFe2O4 with cubic spinel structure is formed [54]. The peaks at around 2θ = 18.40°, 30.31°, 35.66°, 37.26°, 43.29°, 53.89°, 57.33°, 62.94°, and 75.27° correspond to the (111), (220), (311), (222), (400), (331), (511), (440), and (533) NiFe2O4 lattice planes of NiFe2O4, respectively, which agree with the results published in [52,55]. The crystallite sizes of Fe2O3, NiO, and NiFe2O4 NPs were 29.52, 19.09, and 13.00 nm, respectively.
3.1.2. UV-Vis Spectra Analysis
Optical properties of Fe2O3, NiO, and NiFe2O4 samples have been investigated using UV-vis Diffuse reflectance spectra (DRS). Figure 4a shows the absorbance spectra of as-prepared samples. Fe2O3 shows a steep absorption edge in the range of 400–550 nm. This can be returned to the Fe-O electronic transition [56]. The pure NiO exhibits a 423 nm absorption band edge in the visible region. Interestingly, the optical absorbance spectrum of the NiFe2O4 has excellent absorption the visible region. The values of band gap energy (Eg) of Fe2O3, NiO, and NiFe2O4 in were found to be 1.92, 2.19, and 1.88 eV, respectively, as shown in Figure 4b–d.
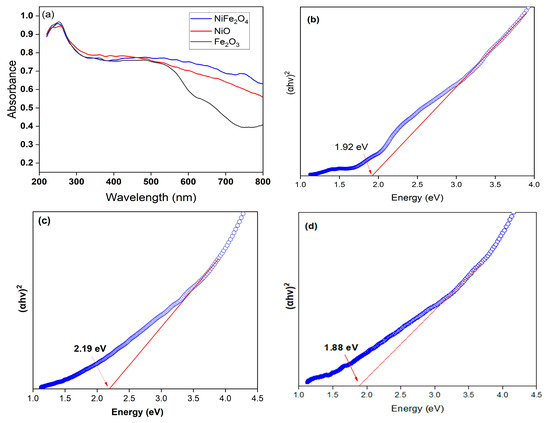
Figure 4.
UV-visible diffuse reflectance spectra (UV-DRS) of (a) Fe2O3, NiO, NiFe2O4 NPs, (b) band gap of Fe2O3, (c) band gap of NiO, and (d) band gap of NiFe2O4.
3.1.3. (FTIR) Analysis Spectra
FTIR spectra of Fe2O3, NiO, and NiFe2O4 nanoparticles (NPs) are shown in Figure 5 and were compared with the FTIR spectra of chitosan in [57]. The peaks at around 3430, 3435, and 3436 cm−1 may result from overlapping stretching vibrations of O-H and N-H bonds. The peaks at around 1630 and 1631 cm−1 may be related to the bending vibrations of O-H. The peaks at around 2861, 2874, and 2875 cm−1 are attributed to amide band I. Furthermore, the peaks at around 1462, 1463, and 1434 cm−1 are caused by vibrations of the O-H within the ring. Additionally, the peaks at 1379 and 1383 cm−1 are associated with C-H vibrations within the ring. The broad bands around 1116 cm−1 include stretching vibrations of glycosidic bonds, C–O, and C–O–C in the skeleton structure of chitosan [57,58,59].
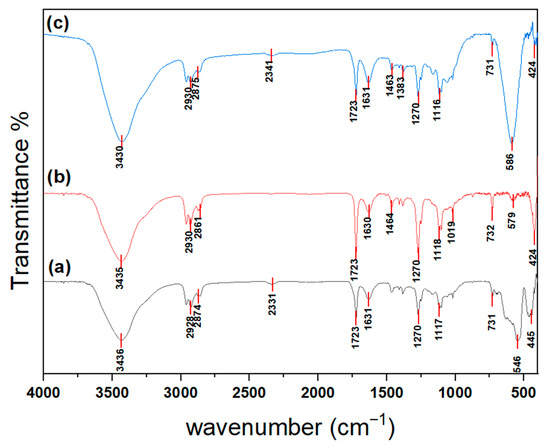
Figure 5.
FTIR spectrum of (a) Fe2O3, (b) NiO, and (c) NiFe2O4 NPs.
In the FTIR spectrum of Fe2O3 (a), the two peaks at around 546 and 445 cm−1 correspond to the Fe–O stretching and bending vibrations of Fe2O3 [60]. Furthermore, the band at around 731 cm−1 is generated from the Fe-O-Fe bond stretching vibration [61]. Panel (b) shows the FTIR spectrum of NiO NPs; the bands at 579 and 424 cm−1 are assigned to Ni-O stretching vibration modes [62,63]. The FTIR spectrum of NiFe2O4 (c) shows two peaks at 586 and 424 cm−1, associated with stretching vibration bonds between nickel and oxygen ions at tetrahedral (Th) (Ni-O) sites and between iron and oxygen ions at octahedral (Oh) (Fe–O) sites. These observations indicate the formation of a spinel ferrite structure [64,65,66,67].
3.1.4. Raman Analysis
Raman spectroscopy is used to confirm the formation of crystalline and amorphous structures and to assess the purity of the samples. The Raman spectra of Fe2O3 in panel (a) confirm the rhombohedral structure of Fe2O3 based on space group No. 148 R-3 [68]. The Raman spectra presented in Figure 6a depict the characteristic features of the freshly prepared Fe2O3 sample. This Raman spectrum prominently reveals significant peaks associated with α-Fe2O3. Simultaneously, discernible signals can be attributed to magnetite (Fe3O4) and maghemite (γ-Fe2O3).
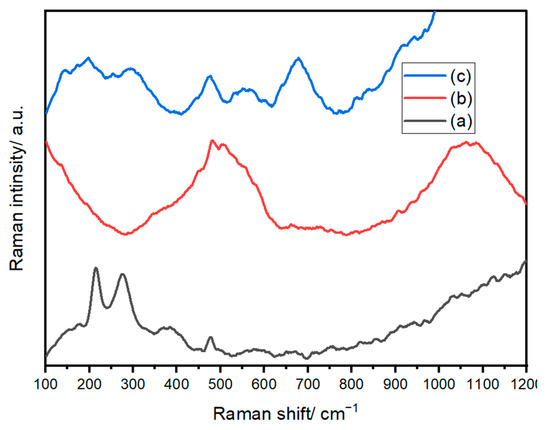
Figure 6.
Raman spectra of (a) Fe2O3, (b) NiO, and (c) NiFe2O4 NPs.
Furthermore, some shifts in the spectral peaks are evident, which can be attributed to variations in the size and shape of the particles comprising the sample. Specifically, the strong peaks observed at 214, 275, 385, 475, and 576 cm−1 have been confidently attributed to the A1g and Eₑ modes of α-Fe2O3. Additionally, the presence of signals at 384 cm−1 and 650 cm−1 is likely linked to γ-Fe2O3 and Fe3O4, respectively, as indicated in reference [69].
In Figure 6b, the Raman spectrum of the prepared Ni/NiO nanosized structure reveals distinct characteristic peaks. Notably, the spectrum features prominent peaks at 500 and 1031 cm−1, corresponding to the first-order longitudinal (LO) mode and the second-order longitudinal (2LO) mode of NiO, respectively. These peaks indicate the vibrational characteristics of the Ni-O bonds within the structure. A sharp, well-defined emission around 557 cm−1 can be attributed to the presence of Ni defects [70], introducing a unique spectral signature. Additionally, the signals at 460 and 700 cm−1 correspond to the first-order transverse mode (TO) and the second-order transverse mode (2TO) [71], respectively, further contributing to the comprehensive characterization of the Ni/NiO nanosized structure. In Figure 6c, we observe the Raman spectrum of the prepared Ni/Fe2O4 compound, which exhibits the inverse spinel structure of AB2O4. These Raman spectra exhibit exceptional quality and closely resemble previously reported results for NiFe2O4. Particularly, we observe broad bands positioned at approximately 676, 551, 477, 294, and 197 cm−1. Each of these bands can be associated with specific vibrational modes, namely A1g(1), T2g(3), T2g(2), Eₑ, and T2g(1), as documented in reference [72]. It’s important to note that the broadening of the peaks in the spectrum of the as-prepared sample is a distinctive characteristic of its nanocrystalline structure. This feature underscores the unique structural attributes of the Ni/Fe2O4 compound, which are clearly reflected in its Raman spectrum.
3.1.5. TEM Analysis
The TEM image in Figure 7a shows the aggregated spherical morphology of NiFe2O4 nanoparticles (NPs). The average particle size of NiFe2O4 NPs is 11.50 nm, calculated from the TEM image using ImageJ software (https://imagej.net/ij/) based on 20 particles, as shown in Figure 7b. By comparing the average particle size of NiFe2O4 NPs obtained from the TEM image with the crystallite size obtained from the XRD patterns, it is evident that they are close in value. The aggregation of NiFe2O4 NPs can be attributed to the high magnetic properties of the NiFe2O4 NPs.
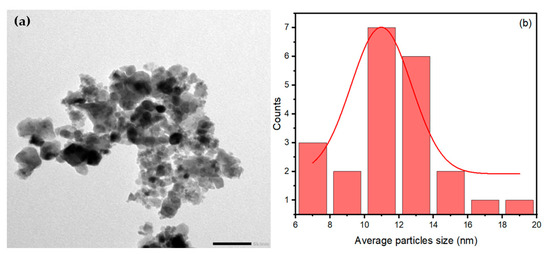
Figure 7.
(a)TEM image of NiFe2O4 and (b) particle size distribution histogram.
3.1.6. SEM/EDX Analysis
The SEM images of Fe2O3, NiO, and NiFe2O4 nanoparticles (NPs) are shown in Figure 8a–c. The particles are aggregated due to the magnetic properties of the NPs and the increased surface area, which leads to higher surface energies and strong interparticle attraction. This result agrees with [73]. The EDX spectra of the Fe2O3, NiO, and NiFe2O4 NPs are presented in Figure 8d–f. The EDX spectrum of Fe2O3 in Figure 8d confirms the formation of Fe2O3 with high purity. The carbon detected is a result of incomplete calcination of organic compounds [74]. In Figure 8e, the EDX spectrum of NiO shows the presence of Ni and O signals, confirming the high purity of the formed NiO NPs. The EDX spectrum of NiFe2O4 NPs in Figure 8f confirms the presence of Ni, Fe, and O in the nanocomposite structure. The high purity of the samples is confirmed by the absence of other peaks.
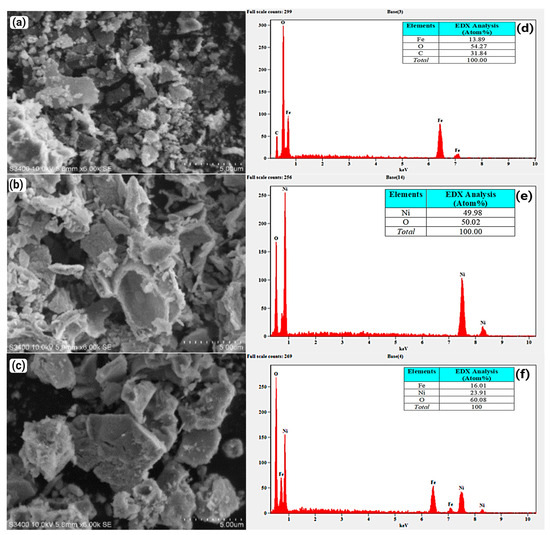
Figure 8.
(a–c) are SEM images of Fe2O3, NiO, and NiFe2O4 respectively, (d–f) EDX spectra of Fe2O3, NiO, and NiFe2O4, respectively.
3.2. Removal Study of MB Dye
3.2.1. Effect of NiFe2O4 Dosage
To effectively remove MB dye, the amount of NiFe2O4 nanoparticles (NPs) used is an essential aspect. The adsorbent amount was adjusted from 0.2 to 0.8 g/100 mL, with a pH of 6, dye concentration of 40 mg/L, and mixing time of 180 min. As clearly shown in Figure 9a, as the amount of NiFe2O4 NPs increased, the MB dye removal also increased. This is consistent with the fact that when the amount of NiFe2O4 increases, the surface area also increases, leading to a greater number of active sites necessary for the adsorption process of MB dye [75]. Consequently, the adsorption capacity of MB dye decreased as the amount of NiFe2O4 increased, as shown in Figure 9b. This result agrees with [76,77], as higher adsorbent dosages tend to agglomerate, reducing adsorption efficiency. The percentage of MB dye removal by NiFe2O4 increased with longer contact times, as illustrated in Figure 9a. Initially, the removal of MB dye was rapid until a certain point, after which the dye settled on the adsorbent surface, and contact time did not significantly affect the rate of removal [78]. According to the experimental results, the removal of MB dye showed little change when increasing NiFe2O4 from 0.6 g to 0.8 g; therefore, 0.6 g of NiFe2O4 was used in the subsequent experiments.
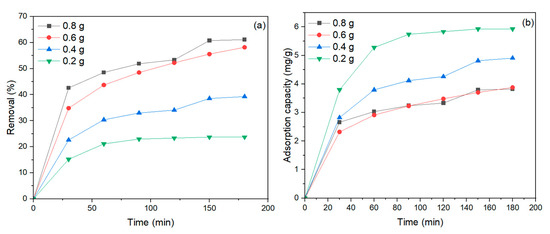
Figure 9.
(a) Effect of NiFe2O4 dose on the removal (%) of MB dye vis contact time, (b) Effect of NiFe2O4 dose on equilibrium adsorption capacity and removal efficiency of MB dye.
3.2.2. Effect of MB Dye Concentration
One of the essential factors in MB dye adsorption by NiFe2O4 is the initial concentration of MB dye. Different dye concentrations were tested to assess the influence of the initial MB dye concentration on the removal percentage (1–40 mg/L) with a 0.6 g dosage of NiFe2O4 and pH = 6. According to Figure 10a, MB dye removal decreases as the concentration increases, from 92.7% at 1 mg/L to 58.14% at 50 mg/L. This suggests saturation of binding sites on the NiFe2O4 surface as the MB dye concentration increases [79]. Moreover, the adsorption capacity decreases as the MB dye concentration rises. The removal of MB dye was rapid at first, then slowed down, reaching equilibrium after 120 min of contact time for initial concentrations from 10 to 50 mg/L, as shown in Figure 10b. Therefore, the contact time will be set to 120 min for the next experiment. There was no significant change in the removal of MB dye between 1 and 10 mg/L after 120 min, indicating that adsorption will be enhanced with a 10 mg/L initial MB concentration.
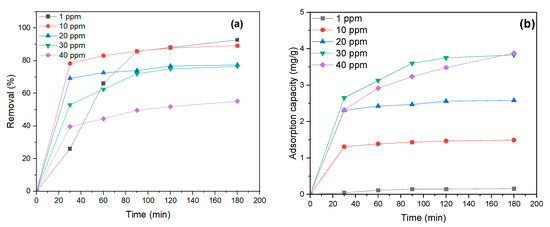
Figure 10.
(a) Effect of MB dye concentration on the removal percentage and (b) effect of MB dye concentration on Adsorption capacity.
3.2.3. Synergistic Effect
The synergistic effect of NiFe2O4 nanoparticles (NPs) is clearly observed in Figure 11, where the MB removal efficiency of NiFe2O4 is significantly better compared to Fe2O3 and NiO under constant parameters. This result agrees with findings from [80,81], which suggest that the presence of two metals can provide active sites that work together synergistically to adsorb the MB dye.
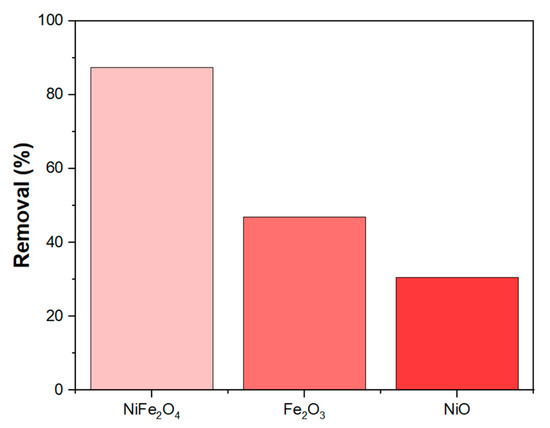
Figure 11.
Exhibits synergistic effect in NiFe2O4 NPs.
3.2.4. Kinetic Studies and Mechanism
Several kinetic models are commonly used to describe the adsorption process. Pseudo-first-order, Pseudo-second-order, Intra-particle diffusion, Liquid film diffusion, and Fractional power models were fitted to understand the nature of the adsorption of MB dye on the surface of NiFe2O4, Fe2O3, and NiO NPs.
The pseudo-first-order kinetic model (Lagergren equation) describes the correlation between the rate at which sorption sites on the adsorbents are occupied and the number of remaining unoccupied sites [82]. It can be expressed by the following linear equation:
A constant rate of adsorption is represented by k1 the pseudo-first order (min−1). The amount of MB dye adsorbed is qe, the amount of dye adsorbed at equilibrium, and qt, which is the amount of dye adsorbed at time t (min).
Pseudo-second-order kinetics model explains how the adsorption capacity of the adsorbent changes over time. This relationship can be determined using Equation (6):
where qt is the equilibrium concentration of MB dye at equilibrium and qe is the equilibrium concentration at time t (mins), and k2 is the pseudo-second-order rate constant (g/mg·min).
Elovich kinetic model describes second-order kinetics for a solid surface with heterogeneous energy, although it does not propose specific mechanisms for adsorption [83]. The linear equation of the Elovich model is expressed by Equation (7):
where α represents the initial rate of adsorption (g/mg·min) and b indicates the extent of surface coverage and activation energy for chemisorption (mg/g·min).
The intra-particle diffusion kinetic model indicates that intraparticle diffusion limits the overall reaction rate when the catalyst particle size is large or when the intrinsic reaction rate is faster than the diffusion rate of reacting molecules within the catalyst pores. The degree of inhibition on the overall velocity depends on particle size, shape, intrinsic reaction velocity, and diffusion rate. Additionally, if intraparticle diffusion is the rate-limiting step, the amount adsorbed at any given time is directly proportional to the square root of the contact time and passes through the origin, as stated in the literature.
Liquid film diffusion model
Fractional power model
According to the pseudo-first-order plot of the experimental data Figure 12. The calculated equilibrium adsorption capacities (qe) are equal to 0.71, 1.33, and 0.73 mg/g for NiFe2O4, Fe2O3, and NiO NPs, respectively as shown in Table 1. These values do not match the experimental equilibrium adsorption capacities. Moreover, the R2 value is lower than that of the pseudo-second-order model. This indicates the pseudo-first-order model does not adequately describe the adsorption process. In contrast, the pseudo-second-order model showed a better fit to the experimental data, with the highest R2 value and a closer match between calculated (qcalc.) and experimental q(exp)values. This suggests that the adsorption of MB dye on the surface of NiFe2O4 or NiO can be described by the second-order rate equation. However, Fe2O3 NPs exhibited the highest R2value when analyzed using the intra-particle diffusion kinetic model, which can effectively describe its adsorption mechanism.
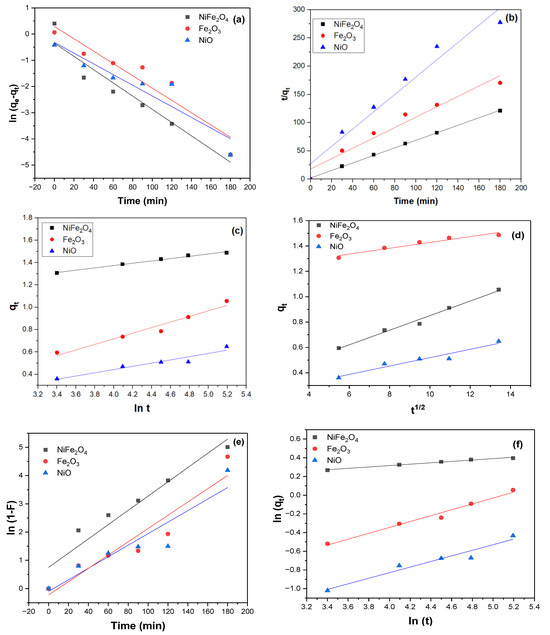
Figure 12.
(a) Pseudo first order kinetics model, (b) Pseudo second order kinetics model, (c) Elovich kinetic model, (d) Intra-particle diffusion kinetic model. (e) Liquid film diffusion model, (f) Fractional power model for as prepared samples (experiment conditions: 0.6 g of adsorbent, 20 ppm of MB dye, pH = 6, and T = 291.5 K).

Table 1.
Different Kinetic models parameters for MB dye adsorbed NiFe2O4, Fe2O3, and NiO NPs.
3.2.5. Adsorption Isotherms
Adsorption isotherm studies are an integral part of understanding adsorption processes and determining which isotherm model best describes the adsorption behavior. In isothermal studies, the amount of MB dye adsorbed on the NiFe2O4 NPs was measured at different concentrations while keeping the temperature constant. This data was then used to fit Langmuir, Freundlich, and Temkin isotherm models to determine the best model that can describe the adsorption process of MB dye on the surface of NiFe2O4 NPs.
According to the Langmuir model isotherm theory, adsorbate molecules are monolayer homogeneously adsorbed on the solid surface because the active sites are the same energy [84,85]. The Langmuir linear equation is express as the following:
where Ce is the equilibrium concentration of the MB dye (mg/L), and qe is the amount of MB dye adsorbed on NiFe2O4 NPs at equilibrium (mg/g). Moreover, KL is the Langmuir constant (mg/g) that represents the monolayer adsorption capacity, and qmax is the coverage capacity of a monolayer at maximum.
According to the Freundlich isothermal model theory, adsorption takes place on a heterogeneous surface with multiple layers [86,87]. Freundlich’s linear equation is expressed as follows:
where Ce is the equilibrium concentration of the MB dye (mg/L), qe is the amount of MB dye adsorbed on NiFe2O4 NPs at equilibrium, KF is a constant that gives an approximate measure of adsorption capacity, and 1/n gives information about adsorption strength [88].
Temkin’s isotherm model theory assumes that all molecules in the layer have a linear decrease in the heat of adsorption with increasing surface coverage. This assumption implies that the interaction between the adsorbate molecules and the solid surface weakens as the surface becomes more crowded with adsorbed molecules [89]. The linear equation of Temkin isotherm can be expressed by the following equation:
where is the heat of sorption constant and KT is Temkin isotherm constant [90].
A linearized form of Langmuir equation for MB is illustrated in Figure 13a, the Freundlich linear equation is represented in Figure 13b, and Temkin isotherm linear equation is shown in Figure 13c. Langmuir, Freundlich, and Temkin regression coefficients are shown in Table 2. The correlation coefficient (R2) exhibited that the adsorption of MB on the surface of NiFe2O4 showed a better applicability with both Langmuir and Freundlich model. Although the Freundlich model fits the adsorption data just slightly better according to R2 value. Adsorbates are generally favorably adsorbed on adsorbents when n > 1. According to Table 2, NiFe2O4 is an appropriate dye for MB adsorption from aqueous solutions since n is greater than 1 [91]. The Langmuir isotherm (RL) value can be used to determine the favorability of an adsorption process. When the RL value is between 0 and 1 (0 < RL < 1), the adsorption process is considered favorable. If RL equals 1, the process is linear, while an RL value of 0 indicates irreversibility. When RL exceeds 1 (RL > 1), the process is deemed unfavorable. In our study, the RL values, a critical parameter of the Langmuir isotherm, fall between 0 and 1, signifying the favorable nature of the sorption process. On the other hand, because R2 is low, the Temkin model cannot reflect equilibrium isotherms for MB dye on the surface of NiFe2O4 NPs [92].
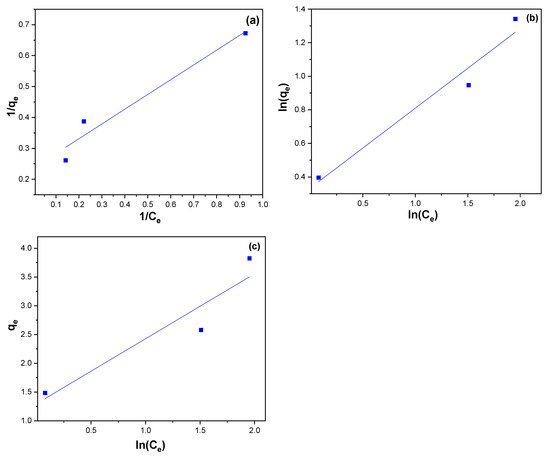
Figure 13.
(a) Langmuir (b) Freundlich, and (c) Temkin isotherm linear equation for MB removal using NiFe2O4 NPs.

Table 2.
Langmuir, Freundlich, Temkin Adsorption Isotherm.
3.2.6. Effect of pH
There is a strong correlation between the adsorption of MB dye by NiFe2O4 nanocomposite and solution pH [93,94,95]. pH changes facilitate the ionization of adsorbate molecules and functional groups on adsorbent surfaces, thus affecting adsorption capacity. In general, surface charges on adsorbents change with pH in solution, impacting their adsorption rate [96]. The effect of pH on the MB dye removal percentage by NiFe2O4 was tested over a range from pH 2 to pH 10 using an initial MB dye concentration of 10 ppm, as shown in Figure 14. According to the graph, pH significantly affected the adsorption of MB on NiFe2O4. The amount of MB removed increased with the initial pH, reaching 96.8% at an initial pH of 8, before decreasing, which describes a bell-shaped curve. In high pH solutions, the adsorbent surfaces become more negatively charged, making them more likely to adsorb positively charged dyes. Conversely, the adsorption of negatively charged dyes is more efficient in low pH solutions, as the adsorbent surface becomes more positively charged [97]. Therefore, at low pH, the adsorption of the MB dye decreases, likely due to the positive charge on the NiFe2O4 NP surfaces caused by excess hydrogen ions, resulting in intermolecular repulsion with the positively charged MB dye. As pH increases, MB dye removal rises to a maximum at pH 8, attributed to the increased negative charge on the NiFe2O4 surface, which enhances electrostatic attraction with the MB dye. The adsorption of MB dye sharply decreases at pH 10, a behavior also reported in some studies [98,99,100]. This may be due to the hydrolysis of NiFe2O4 surfaces, which creates positively charged sites on the surface.
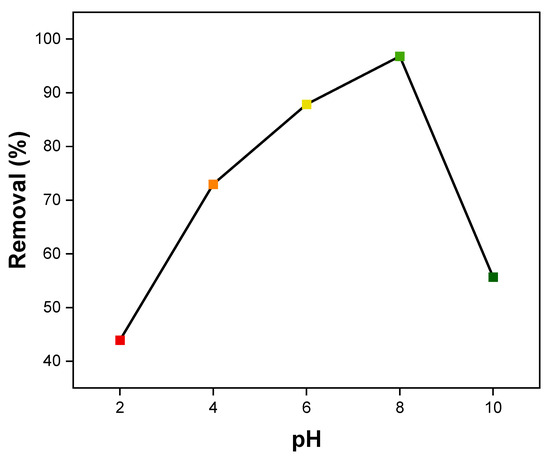
Figure 14.
Effect of pH on MB dye adsorption by NiFe2O4 NPs.
3.2.7. Effect of Temperature and Thermodynamics
The effect of temperature on the adsorption of MB dye by NiFe2O4 was investigated. As shown in Figure 15a,b, the relationship between the removal percentage and the adsorption capacity of MB adsorbed onto NiFe2O4 nanoparticles (NPs) at different temperatures (278.15, 291.15, 303.15, and 323.15 K) was examined under constant parameters. Increasing the temperature led to an increase in both the adsorption capacity and the removal percentage of MB dye, from 85.48% to 95.75%. The enhanced removal of MB dye by NiFe2O4 NPs with rising temperature can be attributed to several factors. Firstly, higher temperatures enhance the solubility of MB dye, leading to more collisions between the NiFe2O4 and the MB dye, thereby increasing the adsorption capacity. Furthermore, elevated temperatures can cause an expansion in the pore size of the NiFe2O4 surface, which subsequently increases its adsorption capacity. This expansion provides more available sites for MB dye molecules to attach, enhancing the overall adsorption process. Additionally, increasing temperature can improve the process by enhancing the mobility of MB dye molecules [101]. Thermodynamic studies were conducted to determine how temperature influences the adsorption of MB dye by NiFe2O4. As part of our investigation into the effect of temperature on adsorption, Equations (11)–(13) were used to determine the thermodynamic parameters relevant to the adsorption process:
where D is the constant of the adsorption equilibrium of the isotherm fits equal to (), R is the universal gas constant (R = 8.3144 J/mol·K), and T is the temperature (K) [102].
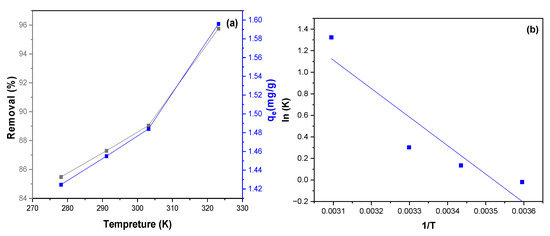
Figure 15.
(a) the effect of temperature on the removal percentage of MB dye by NiFe2O4. (b) plot of lnD vis 1/T(K) to the thermodynamic parameter calculations for adsorption of MB dye by NiFe2O4.
According to Table 3, the results show that the enthalpy change (ΔH) is positive. This indicates that the adsorption process is endothermic, requiring energy input. As the temperature increases, more energy becomes available, leading to enhanced adsorption. The negative ΔG value indicates that the adsorption of MB dye onto the surface of NiFe2O4 nanoparticles (NPs) is thermodynamically favorable. This suggests that the process is spontaneous and can occur without additional energy input under standard conditions. The positive ΔS value indicates an increase in disorder or randomness between the MB dye solution and NiFe2O4 NPs during the adsorption process. Furthermore, the ΔG value ranges from 0 to −20 kJ/mol, and the ΔH value is less than 40 kJ/mol, indicating that the adsorption process is of a physical nature [103,104].

Table 3.
Thermodynamic data for the adsorption of MB dye by NiFe2O4.
3.2.8. Environmental Study
To investigate the suitability of NiFe2O4 for removing MB dye in actual environmental samples, various samples were collected from multiple sources, including saltwater from the Red Sea, distilled water from a laboratory distiller, drinking water purchased from the Saudi market, and tap water from the King Abdulaziz University laboratory. The MB dye removal percentages varied across the different samples, with deionized water showing the highest removal percentage, followed by distilled water, drinking water, tap water, and seawater, as depicted in Figure 16. The decrease in removal percentages can be attributed to the presence of pollutants in the samples. These pollutants may interact with the MB dye, competing for the active sites on the NiFe2O4 nanoparticles. As a result, the effectiveness of the dye removal process is reduced [105].
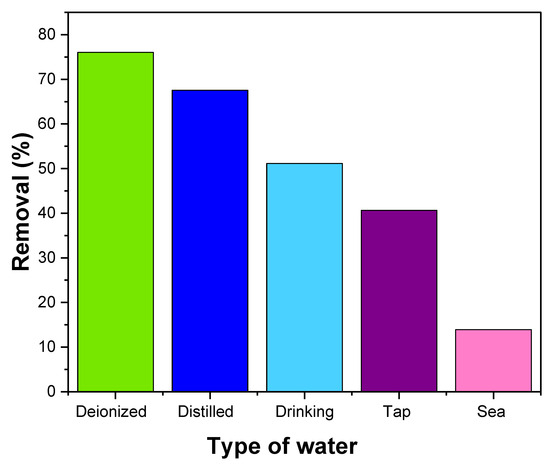
Figure 16.
Effect of NiFe2O4 NPs in removal of MB dye from different types of water.
In Table 4, there is comparison between prepared NiFe2O4 NPs and the previous studied of metal ferrite NPs.

Table 4.
Comparison of the adsorption of organic dyes onto different metal ferrite adsorbents.
3.2.9. Proposed Mechanisms of MB Dye on the Surface of NiFe2O4 NPs
As shown in Figure 17, the mechanism of adsorption of MB dye on the surface of NiFe2O4 involves: (1) Electrostatic forces, (2) Hydrogen bonds, and (3) π-π interactions. Electrostatic forces, the cationic MB dye is attracted to the negative surface of NiFe2O4 NPs. Hydrogen bonds, it arises due to attraction between MB dye and functional group on the surfaces of NiFe2O4 NPs. π-π interactions, it produces from the interaction between aromatic rings in MB dye and the surface of NiFe2O4 NPs [113].
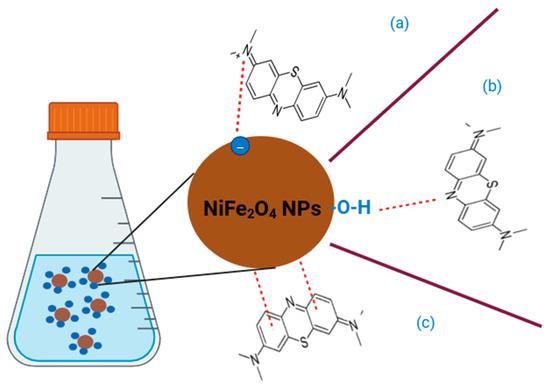
Figure 17.
The mechanism of adsorption of MB dye on the surface of NiFe2O4 (a) Electrostatic forces, (b) Hydrogen bonds, and (c) π-π interactions.
4. Conclusions
In this study, NiFe2O4, Fe2O3, and NiO NPs were successfully prepared using a simple green method. The characterization results confirm the structure of as-prepared materials with the presence of metallic Ni NPs that grew during the preparation step on the surface of NiO and NiFe2O4 NPs. The NiFe2O4 NPs showed the best optical properties when compared with as-prepared mono-metal oxides. FTIR confirms the presence of functional groups that can enhance the adsorption process. NiFe2O4 showed the best MB dye removal performance compared to NiO and Fe2O3 NPs. Moreover, the adsorption process of NiFe2O4, NiO and Fe2O3 NPs follows the pseudo-second-order kinetic model with K2 = 0.218 (g/mg·min). Freundlich isothermal model theory gave the best applicability to describe the adsorption of MB on the surface of NiFe2O4 NPs. Moreover, thermodynamic studies showed that the adsorption of the MB dye on the surface of NiFe2O4 is spontaneous, endothermic, and feasible in nature. Furthermore, NiFe2O4 NPs showed good performance in removing the MB dye from different types of water. This indicates that the prepared NiFe2O4 NPs are considered a promising material for future water purification applications.
Author Contributions
Methodology, L.M.A.; Software, A.A.A.; Validation, A.A.A.; Investigation, A.A.A.; Resources, M.A.M.; Data curation, A.A.A.; Writing—original draft, A.A.A.; Writing—review & editing, L.M.A.; Visualization, L.M.A.; Supervision, L.M.A. and M.A.M.; Project administration, M.A.M.; Funding acquisition, M.A.M. All authors have read and agreed to the published version of the manuscript.
Funding
The authors would like to express their gratitude to the Deanship of Scientific Research (DSR), king Abdulaziz university, Jeddah, Saudi Arabia, for providing financial support for this project under grant number KEP-PhD: 97-247-1443.
Data Availability Statement
The original contributions presented in this study are included in the article. Further inquiries can be directed to the corresponding author.
Conflicts of Interest
The authors declare no conflict of interest.
References
- Dutta, S.; Gupta, B.; Srivastava, S.K.; Gupta, A.K. Recent advances on the removal of dyes from wastewater using various adsorbents: A critical review. Mater. Adv. 2021, 2, 4497–4531. [Google Scholar] [CrossRef]
- Benkhaya, S.; M’rabet, S.; El Harfi, A. A review on classifications, recent synthesis and applications of textile dyes. Inorg. Chem. Commun. 2020, 115, 107891. [Google Scholar] [CrossRef]
- Chen, J.; Xiong, Y.; Duan, M.; Li, X.; Li, J.; Fang, S.; Qin, S.; Zhang, R. Insight into the Synergistic Effect of Adsorption-Photocatalysis for the Removal of Organic Dye Pollutants by Cr-Doped ZnO. Langmuir 2020, 36, 520–533. [Google Scholar] [CrossRef]
- Znad, H.; Abbas, K.; Hena, S.; Awual, M.R. Synthesis a novel multilamellar mesoporous TiO2/ZSM-5 for photo-catalytic degradation of methyl orange dye in aqueous media. J. Environ. Chem. Eng. 2018, 6, 218–227. [Google Scholar] [CrossRef]
- Hynes, N.R.J.; Kumar, J.S.; Kamyab, H.; Sujana, J.A.J.; Al-Khashman, O.A.; Kuslu, Y.; Ene, A.; Kumar, B.S. Modern enabling techniques and adsorbents based dye removal with sustainability concerns in textile industrial sector—A comprehensive review. J. Clean. Prod. 2020, 272, 122636. [Google Scholar] [CrossRef]
- Khan, I.; Saeed, K.; Zekker, I.; Zhang, B.; Hendi, A.H.; Ahmad, A.; Ahmad, S.; Zada, N.; Ahmad, H.; Shah, L.A.; et al. Review on Methylene Blue: Its Properties, Uses, Toxicity and Photodegradation. Water 2022, 14, 242. [Google Scholar] [CrossRef]
- Astruc, D. Introduction: Nanoparticles in Catalysis. Chem. Rev. 2020, 120, 461–463. [Google Scholar] [CrossRef]
- Lin, W. Introduction: Nanoparticles in Medicine. Chem. Rev. 2015, 115, 10407–10409. [Google Scholar] [CrossRef] [PubMed]
- Ding, J.; Xu, R.; Yan, C.; Xiao, Y.; Xu, L.; Peng, H.; Park, H.S.; Liang, J.; Huang, J.-Q. Review on nanomaterials for next-generation batteries with lithium metal anodes. Nano Sel. 2020, 1, 94–110. [Google Scholar] [CrossRef]
- Kumar, A.; Choudhary, A.; Kaur, H.; Mehta, S.; Husen, A. Metal-based nanoparticles, sensors, and their multifaceted application in food packaging. J. Nanobiotechnol. 2021, 19, 256. [Google Scholar] [CrossRef]
- Dabirian, E.; Hajipour, A.; Mehrizi, A.A.; Karaman, C.; Karimi, F.; Loke-Show, P.; Karaman, O. Nanoparticles application on fuel production from biological resources: A review. Fuel 2023, 331, 125682. [Google Scholar] [CrossRef]
- Aloisi, M.; Rossi, G.; Colafarina, S.; Guido, M.; Cecconi, S.; Poma, A.M.G. The Impact of Metal Nanoparticles on Female Reproductive System: Risks and Opportunities. Int. J. Environ. Res. Public Health 2022, 19, 3748. [Google Scholar] [CrossRef]
- Reddy, D.H.K.; Yun, Y.S. Spinel ferrite magnetic adsorbents: Alternative future materials for water purification? Coord. Chem. Rev. 2016, 315, 90–111. [Google Scholar] [CrossRef]
- Kefeni, K.K.; Mamba, B.B.; Msagati, T.A.M. Application of spinel ferrite nanoparticles in water and wastewater treatment: A review. Sep. Purif. Technol. 2017, 188, 399–422. [Google Scholar] [CrossRef]
- Kefeni, K.K.; Mamba, B.B. Photocatalytic application of spinel ferrite nanoparticles and nanocomposites in wastewater treatment: Review. Sustain. Mater. Technol. 2020, 23, e00140. [Google Scholar] [CrossRef]
- Khan, M.; Tahir, M.N.; Adil, S.F.; Khan, H.U.; Siddiqui, M.R.H.; Al-warthan, A.A.; Tremel, W. Graphene based metal and metal oxide nanocomposites: Synthesis, properties and their applications. J. Mater. Chem. A 2015, 1, 13828–13841. [Google Scholar] [CrossRef]
- Lu, F.; Astruc, D. Nanocatalysts and other nanomaterials for water remediation from organic pollutants. Coord. Chem. Rev. 2020, 408, 213180. [Google Scholar] [CrossRef]
- Hafeez, H.Y.; Mohammed, J.; Ndikilar, C.E.; Suleiman, A.B.; Sa’id, R.S.; Muhammad, I. Synergistic utilization of magnetic rGO/NiFe2O4-g-C3N4 S-Scheme heterostructure photocatalyst with enhanced charge carrier separation and transfer: A highly stable and robust photocatalyst for efficient solar fuel (hydrogen) generation. Ceram. Int. 2023, 49, 5269–5278. [Google Scholar] [CrossRef]
- Hasan, I.; Bassi, A.; Alharbi, K.H.; BinSharfan, I.I.; Khan, R.A.; Alslame, A. Sonophotocatalytic Degradation of Malachite Green by Nanocrystalline Chitosan-Ascorbic Acid@NiFe2O4 Spinel Ferrite. Coatings 2020, 10, 1200. [Google Scholar]
- Liu, S.Q.; Xiao, B.; Feng, L.R.; Zhou, S.S.; Chen, Z.G.; Liu, C.B.; Chen, F.; Wu, Z.-Y.; Xu, N.; Oh, W.-C.; et al. Graphene oxide enhances the Fenton-like photocatalytic activity of nickel ferrite for degradation of dyes under visible light irradiation. Carbon 2013, 64, 197–206. [Google Scholar] [CrossRef]
- Alamier, W.M.; Hasan, N.; Nawaz, M.S.; Ismail, K.S.; Shkir, M.; Malik, M.A.; Oteef, M.D.Y. Biosynthesis of NiFe2O4 nanoparticles using Murayya koenigii for photocatalytic dye degradation and antibacterial application. J. Mater. Res. Technol. 2023, 22, 1331–1348. [Google Scholar] [CrossRef]
- Ahmad, N.; Alam, M.; Ansari, A.A.; Alrayes, B.F.; Ahmed, M.; Alotaibi, M.A. Nickel ferrite nanomaterials: Synthesis, characterization and properties. Nanosci. Nanotechnol. Lett. 2017, 9, 1688–1695. [Google Scholar] [CrossRef]
- Bharati, V.A.; Patade, S.R.; Bajaj, S.; Parlikar, R.; Keche, A.P.; Sondur, V.V. Structural and magnetic properties of nickel ferrite nanoparticles prepared by solution combustion method. J. Phys. Conf. Ser. 2020, 1644, 012005. [Google Scholar] [CrossRef]
- Zhou, J.; Ma, J.; Sun, C.; Xie, L.; Zhao, Z.; Tian, H.; Wang, Y.; Tao, J.; Zhu, X. Low-temperature synthesis of NiFe2O4 by a hydrothermal method. J. Am. Ceram. Soc. 2005, 88, 3535–3537. [Google Scholar] [CrossRef]
- Saffarzadeh, S.; Nabiyouni, G.; Heidary, F. A short time microwave method for synthesis of magnetic NiFe2O4/NiO nanocomposites as a clean technology in photocatalytic degradation of water pollutants. J. Mater. Sci. Mater. Electron. 2019, 30, 8171–8181. [Google Scholar] [CrossRef]
- Duraisamy, E.; Das, H.T.; Sharma, A.S.; Elumalai, P. Supercapacitor and photocatalytic performances of hydrothermally-derived Co3O4/CoO@carbon nanocomposite. New J. Chem. Previous 2018, 37, 6114–6124. [Google Scholar] [CrossRef]
- Shaheen, I.; Ahmad, K.S.; Zequine, C.; Gupta, R.K.; Thomas, A.G.; Malik, M.A. Modified sol-gel synthesis of Co3O4 nanoparticles using organic template for electrochemical energy storage. Energy 2021, 218, 119502. [Google Scholar] [CrossRef]
- Dikshit, P.K.; Kumar, J.; Das, A.K.; Sadhu, S.; Sharma, S.; Singh, S.; Gupta, P.K.; Kim, B.S. Green synthesis of metallic nanoparticles: Applications and limitations. Catalysts 2021, 11, 902. [Google Scholar] [CrossRef]
- Kombaiah, K.; Vijaya, J.J.; Kennedy, L.J.; Bououdina, M. Studies on the microwave assisted and conventional combustion synthesis of Hibiscus rosa-sinensis plant extract based ZnFe2O4 nanoparticles and their optical and magnetic properties. Ceram. Int. 2016, 42, 2741–2749. [Google Scholar] [CrossRef]
- Sivakumar, P.; Ramesh, R.; Ramanand, A.; Ponnusamy, S.; Muthamizhchelvan, C. Preparation and properties of nickel ferrite (NiFe2O4) nanoparticles via sol-gel auto-combustion method. Mater. Res. Bull. 2011, 46, 2204–2207. [Google Scholar] [CrossRef]
- Phan, T.T.V.; Phan, D.T.; Cao, X.T.; Huynh, T.C.; Oh, J. Roles of chitosan in green synthesis of metal nanoparticles for biomedical applications. Nanomaterials 2021, 11, 273. [Google Scholar] [CrossRef] [PubMed]
- Wu, F.C.; Tseng, R.L.; Juang, R.S. A review and experimental verification of using chitosan and its derivatives as adsorbents for selected heavy metals. J. Environ. Manag. 2010, 91, 798–806. [Google Scholar] [CrossRef]
- Miretzky, P.; Cirelli, A.F. Fluoride removal from water by chitosan derivatives and composites: A review. J. Fluor. Chem. 2011, 132, 231–240. [Google Scholar] [CrossRef]
- Bhatnagar, A.; Sillanpää, M. Applications of chitin- and chitosan-derivatives for the detoxification of water and wastewater—A short review. Adv. Colloid Interface Sci. 2009, 152, 26–38. [Google Scholar] [CrossRef]
- Dash, M.; Chiellini, F.; Ottenbrite, R.M.; Chiellini, E. Chitosan—A versatile semi-synthetic polymer in biomedical applications. Prog. Polym. Sci. 2011, 36, 981–1014. [Google Scholar] [CrossRef]
- Reddy, D.H.K.; Lee, S.M. Application of magnetic chitosan composites for the removal of toxic metal and dyes from aqueous solutions. Adv. Colloid Interface Sci. 2013, 201–202, 68–93. [Google Scholar] [CrossRef]
- Phan, T.T.V.; Hoang, G.; Nguyen, V.T.; Nguyen, T.P.; Kim, H.H.; Mondal, S.; Manivasagan, P.; Moorthy, M.S.; Lee, K.D.; Junghwan, O. Chitosan as a stabilizer and size-control agent for synthesis of porous flower-shaped palladium nanoparticles and their applications on photo-based therapies. Carbohydr. Polym. 2019, 205, 340–352. [Google Scholar] [CrossRef]
- Phan, T.T.V.; Nguyen, V.T.; Ahn, S.H.; Oh, J. Chitosan-mediated facile green synthesis of size-controllable gold nanostars for effective photothermal therapy and photoacoustic imaging. Eur. Polym. J. 2019, 118, 492–501. [Google Scholar] [CrossRef]
- Hosseinzadeh, H.; Ramin, S. Effective removal of copper from aqueous solutions by modified magnetic chitosan/graphene oxide nanocomposites. Int. J. Biol. Macromol. 2018, 113, 859–868. [Google Scholar] [CrossRef] [PubMed]
- Zhou, L.; Jin, J.; Liu, Z.; Liang, X.; Shang, C. Adsorption of acid dyes from aqueous solutions by the ethylenediamine-modified magnetic chitosan nanoparticles. J. Hazard. Mater. 2011, 185, 1045–1052. [Google Scholar] [CrossRef]
- Sifontes, A.B.; Gonzalez, G.; Ochoa, J.L.; Tovar, L.M.; Zoltan, T.; Cañizales, E. Chitosan as template for the synthesis of ceria nanoparticles. Mater. Res. Bull. 2011, 46, 1794–1799. [Google Scholar] [CrossRef]
- Ben Amor, I.; Hemmami, H.; Laouini, S.E.; Mahboub, M.S.; Barhoum, A. Sol-Gel Synthesis of ZnO Nanoparticles Using Different Chitosan Sources: Effects on Antibacterial Activity and Photocatalytic Degradation of AZO Dye. Catalysts 2022, 12, 1611. [Google Scholar] [CrossRef]
- Zeraatkar Moghaddam, A.; Ghiamati, E.; Pourashuri, A.; Allahresani, A. Modified nickel ferrite nanocomposite/functionalized chitosan as a novel adsorbent for the removal of acidic dyes. Int. J. Biol. Macromol. 2018, 120, 1714–1725. [Google Scholar] [CrossRef]
- Adeogun, A.I.; Osideko, O.A.; Idowu, M.A.; Shappur, V.; Akinloye, O.A.; Ramesh Babu, B. Chitosan supported CoFe2O4 for the removal of anthraquinone dyes: Kinetics, equilibrium and thermodynamics studies. SN Appl. Sci. 2020, 2, 795. [Google Scholar] [CrossRef]
- Thomas, S.; Kalarikkal, N.; Abraham, A.R. (Eds.) Design, Fabrication, and Characterization of Multifunctional Nanomaterials, 1st ed.; Micro & Nano Technologies; Elsevier: Amsterdam, The Netherlands, 2022; pp. 543–556. [Google Scholar]
- Caetano, P.M.A.; Simoes, N.M.; Pinto, P.S.; Fernandez-Outon, L.E.; Albuquerque, A.S.; MacEdo, W.A.A.; Ardissona, J.D. Application of nickel ferrite nanoparticles in adsorption of amoxicillin antibiotic. J. Braz. Chem. Soc. 2020, 31, 2452–2461. [Google Scholar] [CrossRef]
- Aich, D.; Saha, S.; Kamilya, T. Synthesis and characterization of star shaped α-Fe2O3/Au nanocomposites. Mater. Today Proc. 2020, 43, 1154–1159. [Google Scholar] [CrossRef]
- Bandgar, S.; Dhumal, J.; Bandgar, S.; Zipare, K.; Shahane, G. Fe3O4 Ferrofluid Nanoparticles: Synthesis and Rheological Behavior Size-Controlled Synthesis and Characterization of Superparamagnetic Mn-Zn Ferrite Nanoparticles for Ferrofluid Application View project synthesis of ferrite nanoparticles for ferrofluid ap. Int. J. Mater. Chem. Phys. 2015, 1, 141–145. [Google Scholar]
- Bhosale, M.A.; Ummineni, D.; Sasaki, T.; Nishio-Hamane, D.; Bhanage, B.M. Magnetically separable γ-Fe2O3 nanoparticles: An efficient catalyst for acylation of alcohols, phenols, and amines using sonication energy under solvent free condition. J. Mol. Catal. A Chem. 2015, 404–405, 8–17. [Google Scholar] [CrossRef]
- Mohseni Meybodi, S.; Hosseini, S.A.; Rezaee, M.; Sadrnezhaad, S.K.; Mohammadyani, D. Synthesis of wide band gap nanocrystalline NiO powder via a sonochemical method. Ultrason. Sonochem. 2012, 19, 841–845. [Google Scholar] [CrossRef]
- Serafin, J.; Llorca, J. Nanoshaped Cerium Oxide with Nickel as a Non-Noble Metal Catalyst for CO2 Thermochemical Reactions. Molecules 2023, 28, 2926. [Google Scholar] [CrossRef]
- Parishani, M.; Nadafan, M.; Dehghani, Z.; Malekfar, R.; Khorrami, G.H.H. Optical and dielectric properties of NiFe2O4 nanoparticles under different synthesized temperature. Results Phys. 2017, 7, 3619–3623. [Google Scholar] [CrossRef]
- Wang, H.; Kou, X.; Zhang, J.; Li, J. Large scale synthesis and characterization of Ni nanoparticles by solution reduction method. Bull. Mater. Sci. 2008, 31, 97–100. [Google Scholar] [CrossRef]
- Naidu, T.M.; Narayana, P.V.L. Synthesis and Characterization of Fe-TiO2 and NiFe2O4 Nanoparticles and Its Thermal Properties. J. Nanosci. Technol. 2019, 5, 769–772. [Google Scholar] [CrossRef]
- Iraqui, S.; Kashyap, S.S.; Rashid, M.H. NiFe2O4nanoparticles: An efficient and reusable catalyst for the selective oxidation of benzyl alcohol to benzaldehyde under mild conditions. Nanoscale Adv. 2020, 2, 5790–5802. [Google Scholar] [CrossRef]
- Maji, S.K.; Mukherjee, N.; Mondal, A.; Adhikary, B. Synthesis, characterization and photocatalytic activity of α-Fe2O3 nanoparticles. Polyhedron 2012, 33, 145–149. [Google Scholar] [CrossRef]
- Zhang, B.; Wu, Y.; Fan, Y. Synthesis of Novel Magnetic NiFe2O4 Nanocomposite Grafted Chitosan and the Adsorption Mechanism of Cr(VI). J. Inorg. Organomet. Polym. Mater. 2019, 29, 290–301. [Google Scholar] [CrossRef]
- Ngah, W.S.W.; Fatinathan, S. Adsorption of Cu(II) ions in aqueous solution using chitosan beads, chitosan-GLA beads and chitosan-alginate beads. Chem. Eng. J. 2008, 143, 62–72. [Google Scholar] [CrossRef]
- Huang, X.Y.; Mao, X.Y.; Bu, H.T.; Yu, X.Y.; Jiang, G.B.; Zeng, M.H. Chemical modification of chitosan by tetraethylenepentamine and adsorption study for anionic dye removal. Carbohydr. Res. 2011, 346, 1232–1240. [Google Scholar] [CrossRef]
- Mohammadikish, M. Hydrothermal synthesis, characterization and optical properties of ellipsoid shape α-Fe2O3 nanocrystals. Ceram. Int. 2014, 40, 1351–1358. [Google Scholar] [CrossRef]
- Du, Y.; Fan, H.; Wang, L.; Wang, J.; Wua, J.; Dai, H. α-Fe2O3 nanowires deposited diatomite: Highly efficient absorbents for the removal of arsenic. J. Mater. Chem. A 2013, 1, 7729–7737. [Google Scholar] [CrossRef]
- Chen, X.; Chen, X.; Zhang, F.; Yang, Z.; Huang, S. One-pot hydrothermal synthesis of reduced graphene oxide/carbon nanotube/α-Ni(OH)2 composites for high performance electrochemical supercapacitor. J. Power Sources 2013, 243, 555–561. [Google Scholar] [CrossRef]
- Azharudeen, A.M.; Karthiga, R.; Rajarajan, M.; Suganthi, A. Fabrication, characterization of polyaniline intercalated NiO nanocomposites and application in the development of non-enzymatic glucose biosensor. Arab. J. Chem. 2020, 13, 4053–4064. [Google Scholar] [CrossRef]
- Kombaiah, K.; Vijaya, J.J.; Kennedy, L.J.; Kaviyarasu, K. Catalytic studies of NiFe2O4 nanoparticles prepared by conventional and microwave combustion method. Mater. Chem. Phys. 2019, 221, 11–28. [Google Scholar] [CrossRef]
- Saravanakumar, B.; Muthu Lakshmi, S.; Ravi, G.; Ganesh, V.; Sakunthala, A.; Yuvakkumar, R. Electrochemical properties of rice-like copper manganese oxide (CuMn2O4) nanoparticles for pseudocapacitor applications. J. Alloys Compd. 2017, 723, 115–122. [Google Scholar] [CrossRef]
- Ali, K.S.A.; Mohanavel, V.; Gnanavel, C.; Vijayan, V.; Senthilkumar, N. Structural and optical behavior of SnS2/NiFe2O4 NCs prepared via novel two-step synthesis approach for MB and RhB dye degradation under sun light irradiation. Res. Chem. Intermed. 2021, 47, 1941–1954. [Google Scholar] [CrossRef]
- Aji Udhaya, P.; Bessy, T.C.; Meena, M. Antibacterial activity of nickel and magnesium substituted ferrite nanoparticles synthesized via self-combustion method. Mater. Today Proc. 2019, 8, 169–175. [Google Scholar] [CrossRef]
- Tahir, M.; Fakhar-e-Alam, M.; Atif, M.; Mustafa, G.; Ali, Z. Investigation of optical, electrical and magnetic properties of hematite α-Fe2O3 nanoparticles via sol-gel and co-precipitation method. J. King Saud. Univ-Sci. 2023, 35, 102695. [Google Scholar] [CrossRef]
- Santillán, J.M.J.; Muñetón Arboleda, D.; Coral, D.F.; Fernández van Raap, M.B.; Muraca, D.; Schinca, D.C.; Muraca, D.; Schinca, D.C.; Scaffardi, L.B. Optical and magnetic properties of Fe nanoparticles fabricated by femtosecond laser ablation in organic and inorganic solvents. ChemPhysChem 2017, 18, 1192–1209. [Google Scholar] [CrossRef]
- Terlemezoglu, M.; Surucu, O.; Isik, M.; Gasanly, N.M.; Parlak, M. Temperature-dependent optical characteristics of sputtered NiO thin films. Appl. Phys. A 2022, 128, 50. [Google Scholar] [CrossRef]
- Salunkhe, P.; AVMA; Kekuda, D. Investigation on tailoring physical properties of Nickel Oxide thin films grown by dc magnetron sputtering. Mater. Res. Express 2020, 7, 16427. [Google Scholar] [CrossRef]
- Ahlawat, A.; Sathe, V.G.; Reddy, V.R.; Gupta, A. Mossbauer, Raman and X-ray diffraction studies of superparamagnetic NiFe2O4 nanoparticles prepared by sol–gel auto-combustion method. J. Magn. Magn. Mater. 2011, 323, 2049–2054. [Google Scholar] [CrossRef]
- Chandra Devsharma, S.; Rahman, M.L.; Hossain, M.J.; Biswas, B.; Ahmed, M.F.; Sharmin, N. Elucidation of structural, electromagnetic, and optical properties of Cu–Mg ferrite nanoparticles. Heliyon 2024, 10, e33578. [Google Scholar] [CrossRef]
- Hoang, C.V.; Thoai, D.N.; Cam, N.T.D.; Phuong, T.T.T.; Lieu, N.T.; Hien, T.T.T.; Nhiem, D.N.; Pham, T.-D.; Tung, M.H.T.; Tran, N.T.T.; et al. Large-Scale Synthesis of Nanosilica from Silica Sand for Plant Stimulant Applications. ACS Omega 2022, 7, 41687–41695. [Google Scholar] [CrossRef]
- Mohammed, M.I.; Abdul Razak, A.A.; Hussein Al-Timimi, D.A. Modified multiwalled carbon nanotubes for treatment of some organic dyes in wastewater. Adv. Mater. Sci. Eng. 2014, 2014, 201052. [Google Scholar] [CrossRef]
- Bassareh, H.; Karamzadeh, M.; Movahedirad, S. Synthesis and characterization of cost-effective and high-efficiency biochar for the adsorption of Pb2+ from wastewater. Sci. Rep. 2023, 13, 15608. [Google Scholar] [CrossRef] [PubMed]
- Uddin, M.T.; Rahman, M.A.; Rukanuzzaman, M.; Islam, M.A. A potential low cost adsorbent for the removal of cationic dyes from aqueous solutions. Appl. Water Sci. 2017, 7, 2831–2842. [Google Scholar] [CrossRef]
- Yahya CJFbt Choong, T.S.Y.; Li, F.; Ghani, W.A.W.A.K.; Aziz, F.N.A.A.; Jamil, S.N.A.M. Tailing Ash for the Removal of Methylene Blue from Aqueous Solutions by Batch Adsorption. Processes 2023, 11, 2282. [Google Scholar] [CrossRef]
- Kohzadi, S.; Marzban, N.; Godini, K.; Amini, N.; Maleki, A. Effect of Hydrochar Modification on the Adsorption of Methylene Blue from Aqueous Solution: An Experimental Study Followed by Intelligent Modeling. Water 2023, 15, 3220. [Google Scholar] [CrossRef]
- Ulfa, M.; Oktaviani, S.L.; Mulyani, B.; Sholeha, N.A. Metal Oxide for Fast Adsorption System in the Methylene Blue Removal. Indones. J. Chem. 2025, 25, 619–637. [Google Scholar] [CrossRef]
- Fu, F.; Cheng, Z.; Lu, J. Synthesis and use of bimetals and bimetal oxides in contaminants removal from water: A review. RSC Adv. 2015, 5, 85395–85409. [Google Scholar] [CrossRef]
- Zhou, J.; Yang, S.; Yu, J.; Shu, Z. Novel hollow microspheres of hierarchical zinc-aluminum layered double hydroxides and their enhanced adsorption capacity for phosphate in water. J. Hazard. Mater. 2011, 192, 1114–1121. [Google Scholar] [CrossRef]
- Mezenner, N.Y.; Bensmaili, A. Kinetics and thermodynamic study of phosphate adsorption on iron hydroxide-eggshell waste. Chem. Eng. J. 2009, 147, 87–96. [Google Scholar] [CrossRef]
- Li Dqiang Wang, J.; Guo Zguo Li, J.; Shuai, J. Pectin gels cross-linked by Ca2+: An efficient material for methylene blue removal. J. Mol. Liq. 2017, 238, 36–42. [Google Scholar] [CrossRef]
- Lagergren, S.K. About the theory of so-called adsorption of soluble substances. Sven Vetenskapsakad Handingarl 1898, 24, 1–39. [Google Scholar]
- Freundlich, H.M.F. Over the adsorption in solution. J. Phys. Chem. 1906, 57, 1100–1107. [Google Scholar]
- Dhaif-Allah, M.A.H.; Taqui, S.N.; Syed, U.T.; Syed, A.A. Kinetic and isotherm modeling for acid blue 113 dye adsorption onto low-cost nutraceutical industrial fenugreek seed spent. Appl. Water Sci. 2020, 10, 58. [Google Scholar] [CrossRef]
- Voudrias, E.; Fytianos, F.; Bozani, E. Sorption description isotherms of dyes form aqueous solutions and waste waters with different sorbent materials. Glob. Nest Int. J. 2002, 4, 75–83. [Google Scholar]
- Ringot, D.; Lerzy, B.; Chaplain, K.; Bonhoure, J.P.; Auclair, E.; Larondelle, Y. In vitro biosorption of ochratoxin A on the yeast industry by-products: Comparison of isotherm models. Bioresour. Technol. 2007, 98, 1812–1821. [Google Scholar] [CrossRef]
- Ayawei, N.; Ebelegi, A.N.; Wankasi, D. Modelling and Interpretation of Adsorption Isotherms. J. Chem. 2017, 2017, 3039817. [Google Scholar] [CrossRef]
- Naghdi, M.; Taheran, M.; Pulicharla, R.; Rouissi, T.; Brar, S.K.; Verma, M.; Surampalli, R.Y. Pine-wood derived nanobiochar for removal of carbamazepine from aqueous media: Adsorption behavior and influential parameters. Arab. J. Chem. 2019, 12, 5292–5301. [Google Scholar] [CrossRef]
- Hasani, N.; Selimi, T.; Mele, A.; Thaçi, V.; Halili, J.; Berisha, A.; Sadiku, M. Theoretical, Equilibrium, Kinetics and Thermodynamic Investigations of Methylene Blue Adsorption onto Lignite Coal. Molecules 2022, 27, 1856. [Google Scholar] [CrossRef]
- Huynh, P.T.; Nguyen, D.-K.; Nguyen, P.-H.; Dinh, V.-P. Adsorption of Methyl Orange and Methylene Blue from aqueous solutions using thermally treated biomass of pine leaves (Pinus kesiya). Preprint 2023. [Google Scholar] [CrossRef]
- Afroze, S.; Sen, T.K. A Review on Heavy Metal Ions and Dye Adsorption from Water by Agricultural Solid Waste Adsorbents. Water Air Soil Pollut. 2018, 229, 225. [Google Scholar] [CrossRef]
- Yagub, M.T.; Sen, T.K.; Afroze, S.; Ang, H.M. Dye and its removal from aqueous solution by adsorption: A review. Adv. Colloid Interface Sci. 2014, 209, 172–184. [Google Scholar] [CrossRef]
- Sen, T.K.; Afroze, S.; Ang, H.M. Equilibrium, kinetics and mechanism of removal of methylene blue from aqueous solution by adsorption onto pine cone biomass of Pinus radiata. Water Air Soil Pollut. 2011, 218, 499–515. [Google Scholar] [CrossRef]
- Turp, S.M.; Turp, G.A.; Ekinci, N.; Özdemir, S. Enhanced adsorption of methylene blue from textile wastewater by using natural and artificial zeolite. Water Sci. Technol. 2020, 82, 513–523. [Google Scholar] [CrossRef]
- Mahmoud, D.K.; Salleh, M.A.M.; Karim, W.A.W.A.; Idris, A.; Abidin, Z.Z. Batch adsorption of basic dye using acid treated kenaf fibre char: Equilibrium, kinetic and thermodynamic studies. Chem. Eng. J. 2012, 181–182, 449–457. [Google Scholar] [CrossRef]
- Amode, J.O.; Santos, J.H.; Md Alam, Z.; Mirza, A.H.; Mei, C.C. Adsorption of methylene blue from aqueous solution using untreated and treated (Metroxylon spp.) waste adsorbent: Equilibrium and kinetics studies. Int. J. Ind. Chem. 2016, 7, 333–345. [Google Scholar] [CrossRef]
- Pavan, F.A.; Mazzocato, A.C.; Gushikem, Y. Removal of methylene blue dye from aqueous solutions by adsorption using yellow passion fruit peel as adsorbent. Bioresour. Technol. 2008, 99, 3162–3165. [Google Scholar] [CrossRef]
- Seidmohammadi, A.; Asgari, G.; Leili, M.; Dargahi, A.; Mobarakian, A. Effectiveness of quercus branti activated carbon in removal of methylene blue from aqueous solutions. Arch. Hyg. Sci. 2015, 4, 217–225. [Google Scholar]
- Calvete, T.; Lima, E.C.; Cardoso, N.F.; Vaghetti, J.C.P.; Dias, S.L.P.; Pavan, F.A. Application of carbon adsorbents prepared from Brazilian-pine fruit shell for the removal of reactive orange 16 from aqueous solution: Kinetic, equilibrium, and thermodynamic studies. J. Environ. Manag. 2010, 91, 1695–1706. [Google Scholar] [CrossRef]
- Shakib, F.; Koohi, A.D.; Kamran-Pirzaman, A. Adsorption of methylene blue by using novel chitosan-g-itaconic acid/bentonite nanocomposite-equilibrium and kinetic study. Water Sci. Technol. 2017, 75, 1932–1943. [Google Scholar] [CrossRef]
- Etemadinia, T.; Allahrasani, A.; Barikbin, B. ZnFe2O4@SiO2@Tragacanth gum nanocomposite: Synthesis and its application for the removal of methylene blue dye from aqueous solution. Polym. Bull. 2019, 76, 6089–6109. [Google Scholar] [CrossRef]
- Hassan, A.A.; Ali, M.E.M.; Abdel-Latif, S.A.; Hasani, I.W.; Fahim, Y.A. Efficient removal of Remazol Red dye from aqueous solution using magnetic nickel ferrite nanoparticles synthesized via aqueous reflux. Sci. Rep. 2025, 15, 17527. [Google Scholar] [CrossRef] [PubMed]
- Ding, Z.; Wang, W.; Zhang, Y.; Li, F.; Liu, J.P. Synthesis, characterization and adsorption capability for Congo red of CoFe2O4 ferrite nanoparticles. J. Alloys Compd. 2015, 640, 362–370. [Google Scholar] [CrossRef]
- Hashem, A.A.; Abd El-Wahab, R.M.; Selim, M.M.A.; Badawy, A.A. Nanozinc ferrites @ silica as efficient adsorbent for dye removal from wastewater: Synthesis and adsorption studies. Int. J. Environ. Sci. Technol. 2024, 21, 9157–9173. [Google Scholar] [CrossRef]
- Gayathri Manju, B.; Mathangi, J.B.; Raji, P.; Helen Kalavathy, M. Equilibrium and kinetic studies on methylene blue adsorption by simple polyol assisted wet hydroxyl route of NiFe2O4 nanoparticles. J. Environ. Health Sci. Eng. 2019, 17, 539–547. [Google Scholar] [CrossRef]
- Algarni, T.S.; Al-Mohaimeed, A.M.; Al-Odayni, A.B.; Abduh, N.A.Y. Activated Carbon/ZnFe2O4 Nanocomposite Adsorbent for Efficient Removal of Crystal Violet Cationic Dye from Aqueous Solutions. Nanomaterials 2022, 12, 3224. [Google Scholar] [CrossRef]
- Vergis, B.R.; Kottam, N.; Hari Krishna, R.; Nagabhushana, B.M. Removal of Evans Blue dye from aqueous solution using magnetic spinel ZnFe2O4 nanomaterial: Adsorption isotherms and kinetics. Nano-Struct. Nano-Objects 2019, 18, 100290. [Google Scholar] [CrossRef]
- Firmino, H.C.T.; Nascimento, E.P.; Costa, K.C.; Arzuza, L.C.C.; Araujo, R.N.; Sousa, B.V.; Neves, G.A.; Morales, M.A.; Menezes, R.R. High-Efficiency Adsorption Removal of Congo Red Dye from Water Using Magnetic NiFe2O4 Nanofibers: An Efficient Adsorbent. Materials 2025, 18, 754. [Google Scholar] [CrossRef]
- Tan, L.V.; Tham, N.T.H.; Thinh, P.V. Removal of anionic azo dye from aqueous solution using the magnetic NiFe2O4 decorated-exfoliated graphite. IOP Conf. Ser. Mater. Sci. Eng. 2020, 991, 012086. [Google Scholar] [CrossRef]
- Liang, H.; Zhu, C.; Wang, A.; Chen, F. Facile preparation of NiFe2O4/biochar composite adsorbent for efficient adsorption removal of antibiotics in water. Carbon Res. 2024, 3, 2. [Google Scholar] [CrossRef]
Disclaimer/Publisher’s Note: The statements, opinions and data contained in all publications are solely those of the individual author(s) and contributor(s) and not of MDPI and/or the editor(s). MDPI and/or the editor(s) disclaim responsibility for any injury to people or property resulting from any ideas, methods, instructions or products referred to in the content. |
© 2025 by the authors. Licensee MDPI, Basel, Switzerland. This article is an open access article distributed under the terms and conditions of the Creative Commons Attribution (CC BY) license (https://creativecommons.org/licenses/by/4.0/).