You are currently viewing a new version of our website. To view the old version click .
Polymers
  • Article
  • Open Access

Published: 5 October 2025

Production of Hydrogen-Rich Syngas via Biomass-Methane Co-Pyrolysis: Thermodynamic Analysis

,
,
and
1
Key Comprehensive Laboratory of Forestry, College of Forestry, Northwest A&F University, Yangling 712100, China
2
College of Forestry, Shanxi Agricultural University, Taigu 030801, China
3
Biorefining Research Institute (BRI) and Department of Chemical Engineering, Lakehead University, Thunder Bay, ON P7B 5E1, Canada
4
Nottingham Ningbo China Beacons of Excellence Research and Innovation Institute, University of Nottingham Ningbo China, Ningbo 315048, China
Polymers2025, 17(19), 2695;https://doi.org/10.3390/polym17192695 
(registering DOI)

Abstract

This study presents a thermodynamic equilibrium analysis of hydrogen-rich syngas production via biomass–methane co-pyrolysis, employing the Gibbs free energy minimization method. A critical temperature threshold at 700 °C is identified, below which methanation and carbon deposition are thermodynamically favored, and above which cracking and reforming reactions dominate, enabling high-purity syngas generation. Methane addition shifts the reaction pathway towards increased reduction, significantly enhancing carbon and H2 yields while limiting CO and CO2 emissions. At 1200 °C and a 1:1 methane-to-biomass ratio, cellulose produces 50.84 mol C/kg, 119.69 mol H2/kg, and 30.65 mol CO/kg; lignin yields 78.16 mol C/kg, 117.69 mol H2/kg, and 19.14 mol CO/kg. The H2/CO ratio rises to 3.90 for cellulose and 6.15 for lignin, with energy contents reaching 43.16 MJ/kg and 52.91 MJ/kg, respectively. Notably, biomass enhances methane conversion from 25% to over 53% while sustaining a 67% H2 selectivity. These findings demonstrate that syngas composition and energy content can be precisely controlled via methane co-feeding ratio and temperature, offering a promising approach for sustainable, tunable syngas production.

1. Introduction

Global economic expansion and fossil fuel depletion, coupled with environmental challenges, are driving the transition to sustainable energy systems [1,2,3]. Biomass energy stands out as a carbon-neutral, widely available renewable resource, capable of conversion into solid, liquid, and gaseous fuels, making it a cornerstone of future energy infrastructure [4,5,6]. Among thermochemical technologies, gasification is especially attractive for producing syngas (a mixture of H2 and CO), an essential feedstock for advanced fuels and chemicals [7,8,9,10,11].
However, the low hydrogen-to-carbon (H/C) and high oxygen-to-carbon (O/C) ratios of biomass inherently limit syngas quality, resulting in low H2/CO ratios, reduced heating value, and substantial tar formation—all detrimental to downstream utilization [12,13]. Thus, upgrading biomass-derived syngas is vital. This study investigates methane co-processing—a hydrogen-rich co-reactant—to overcome these limitations and enable high-value, hydrogen-rich syngas production [2,12]. Previous studies demonstrated experimental feasibility (e.g., Palumbo et al. [13] showed efficient hydrogen-enriched syngas via high-temperature biomass–methane gasification with steam). Lalsare et al. [7] clarified methane’s mechanistic role, activating steam reforming and suppressing methane formation, thereby driving selective hydrogen production. Methane enrichment also enhances combustion performance in dual-fuel systems [1].
Despite experimental progress, most prior work focuses on specific conditions and outcomes, lacking fundamental thermodynamic insight, especially at the initial biomass–methane co-pyrolysis stage, where complex competing reactions occur. Thermodynamic equilibrium analysis based on Gibbs free energy minimization is ideal, but prior models often omit critical aspects like tar formation [6]. This work addresses these gaps by building an inclusive thermodynamic framework for biomass–methane co-pyrolysis, explicitly incorporating tar formation. Using cellulose and lignin as model biomass compounds, we systematically evaluate temperature and feedstock ratio effects, aiming to elucidate synergistic mechanisms and guide optimization for high-yield hydrogen production.

2. Materials and Methods

2.1. Materials

Pure cellulose (C6H10O5) and lignin (C11H12O4) are used as model biomass components [14,15], enabling controlled study of gasification chemistry without interference from heteroatoms (S, N) or minerals (K, Na). Thermodynamic properties for all species are sourced mainly from HSC Chemistry 6.0 (Table 1). A custom database was created for cellulose/lignin [15], while other species used default library values.
Table 1. Thermodynamic parameters of substances at 25 °C.

2.2. Related Reactions

The co-pyrolysis of biomass and methane is a complex process involving multiple simultaneous reactions [11,16]. The primary reaction is pyrolysis or gasification of methane and biomass (Equations (1)–(3)), which involves various competing side reactions [6,11], including the Boudouard reaction (Equation (4)), methanation (Equations (5)–(7)), the water–gas reaction (Equation (8)), the water–gas shift reaction (Equation (9)), and reforming reactions (Equations (10) and (11)). The specific reaction equations are as follows:
Pyrolysis or gasification:
CH 4 ( g ) C ( s ) + 2 H 2 ( g )
C 6 H 10 O 5 ( s ) C ( s ) + 5 H 2 ( g ) + 5 CO ( g )
C 11 H 12 O 4 ( s ) 7 C ( s ) + 6 H 2 ( g ) + 4 CO ( g )
Boudouard reaction:
2 CO ( g ) C ( s ) + CO 2 ( g )
Methanation:
C ( s ) + 2 H 2 ( g ) CH 4 ( g )
CO ( g ) + 3 H 2 ( g ) CH 4 ( g ) + H 2 O ( g )
CO 2 ( g ) + 4 H 2 ( g ) CH 4 ( g ) + 2 H 2 O ( g )
Water–gas reaction:
C ( s ) + H 2 O ( g ) CO ( g ) + H 2 ( g )
Water–gas shift reaction (WGSR):
CO ( g ) + H 2 O ( g ) CO 2 ( g ) + H 2 ( g )
Reforming reaction
CH 4 ( g ) + H 2 O ( g ) CO ( g ) + 3 H 2 ( g )
CH 4 ( g ) + CO 2 ( g ) 2 CO ( g ) + 2 H 2 ( g )
Gibbs free energy change (ΔG) is a fundamental concept in thermodynamics, used to determine the spontaneity and equilibrium state of chemical reactions or physical processes under given conditions. It is defined as [17]:
Δ G = Δ H T Δ S
where ΔG is minimized at equilibrium, ΔH represents the change in the system’s enthalpy, T denotes temperature in Kelvin, and ΔS represents the change in the system’s entropy.
Using the Reaction Equations module within HSC Chemistry 6.0, the temperature-dependent ΔG were systematically calculated for all considered reactions across the range of 100–1200 °C.

2.3. Determination of Equilibrium Compositions

A thermodynamic equilibrium model based on Gibbs free energy minimization was established to investigate biomass–methane co-pyrolysis systems, utilizing the Equilibrium Compositions module in the HSC Chemistry 6.0 software. The model considered cellulose and lignin (kg basis) as biomass components along with methane (kg basis) as co-reactants, with the product spectrum encompassing C, H2O, CH4, H2, CO2, CO, and tar. To improve predictive accuracy, tar formation was explicitly accounted for, enabling a more comprehensive representation of gasification behavior and secondary reaction pathways. Benzene (C6H6) was usually employed as a representative tar model compound for gasification [1,18]. The thermodynamic framework consistently applied ideal gas law assumptions at standard pressure (1 atm), with all species properties sourced from established databases and phase equilibria explicitly considered in all calculations. The analysis systematically evaluated the effects of temperature (100–1200 °C) and biomass-to-methane mass ratios (1:0, 1:0.25 or 4, 1:0.5 or 2, 1:1 or 1, 0:1) on the composition of product gas and the tendency of tar formation, providing fundamental insights into the co-pyrolysis behavior of these feedstocks.

2.4. Determination of Energy Recovery Efficiency

Heating value serves as a critical parameter for evaluating the energy quality of fuels. A higher heating value indicates greater energy release during combustion. Furthermore, the energy conversion efficiency during fuel transformation into other energy forms is equally essential. Consequently, in gasification processes, the energy recovery efficiency (also termed cold gas efficiency, CGE) represents a key performance indicator for assessing the technology’s efficacy [6,13]. The energy recovery efficiency is defined as [6]:
E η = E out E in × 100 %
E in = E biomass + E CH 4 = H H V biomass × n biomass + L H V CH 4 × n CH 4
E out = E C + E CH 4 + E H 2 + E CO = L H V C × n C + L H V CH 4 × n CH 4 + L H V H 2 × n H 2 + L H V CO × n CO
where Eη, Ein, and Eout represent energy recovery efficiency, input energy, and output energy, respectively. HHVbiomass represents the high heating value of the biomass, and LHVi represents the low heating value of each chemical species contained in syngas, that is defined in Table 1, kg/mol. ni represents the mole fraction of each chemical species contained in syngas, mol.

3. Results

3.1. Gibbs Free Energy Variation in Key Reactions

The Gibbs free energy changes (ΔG) of key biomass-methane co-pyrolysis reactions (Equations (1)–(11)) exhibit distinct temperature-dependent behavior between 100 and 1200 °C (Figure 1). The ΔG values for most reactions decreased with increasing temperature. The thermodynamic landscape demonstrates two characteristic regimes. When temperatures are below 700 °C, biomass-methane co-pyrolysis favors two competing pathways: methanation and carbon deposition [19]. Methanation reactions (Equations (5)–(7)), being exothermic and thermodynamically favorable (ΔG < 0), consume H2 to form CH4, while the Boudouard reaction (Equation (4)) promotes solid carbon deposition via CO disproportionation. Above 700 °C, methane cracking (Equation (1)) and reforming reactions (Equations (10) and (11)), become thermodynamically favorable, while the water-gas shift reaction (Equation (9)) approaches optimal equilibrium, maximizing H2 production. The combined effect of these reactions leads to enhanced syngas yields with improved H2/CO ratios, particularly under steam-rich conditions.
Figure 1. Variation in ΔG with temperature for various reactions during biomass-CH4 co-pyrolysis.

3.2. Equilibrium Product Distribution

3.2.1. Pure Feedstock Pyrolysis

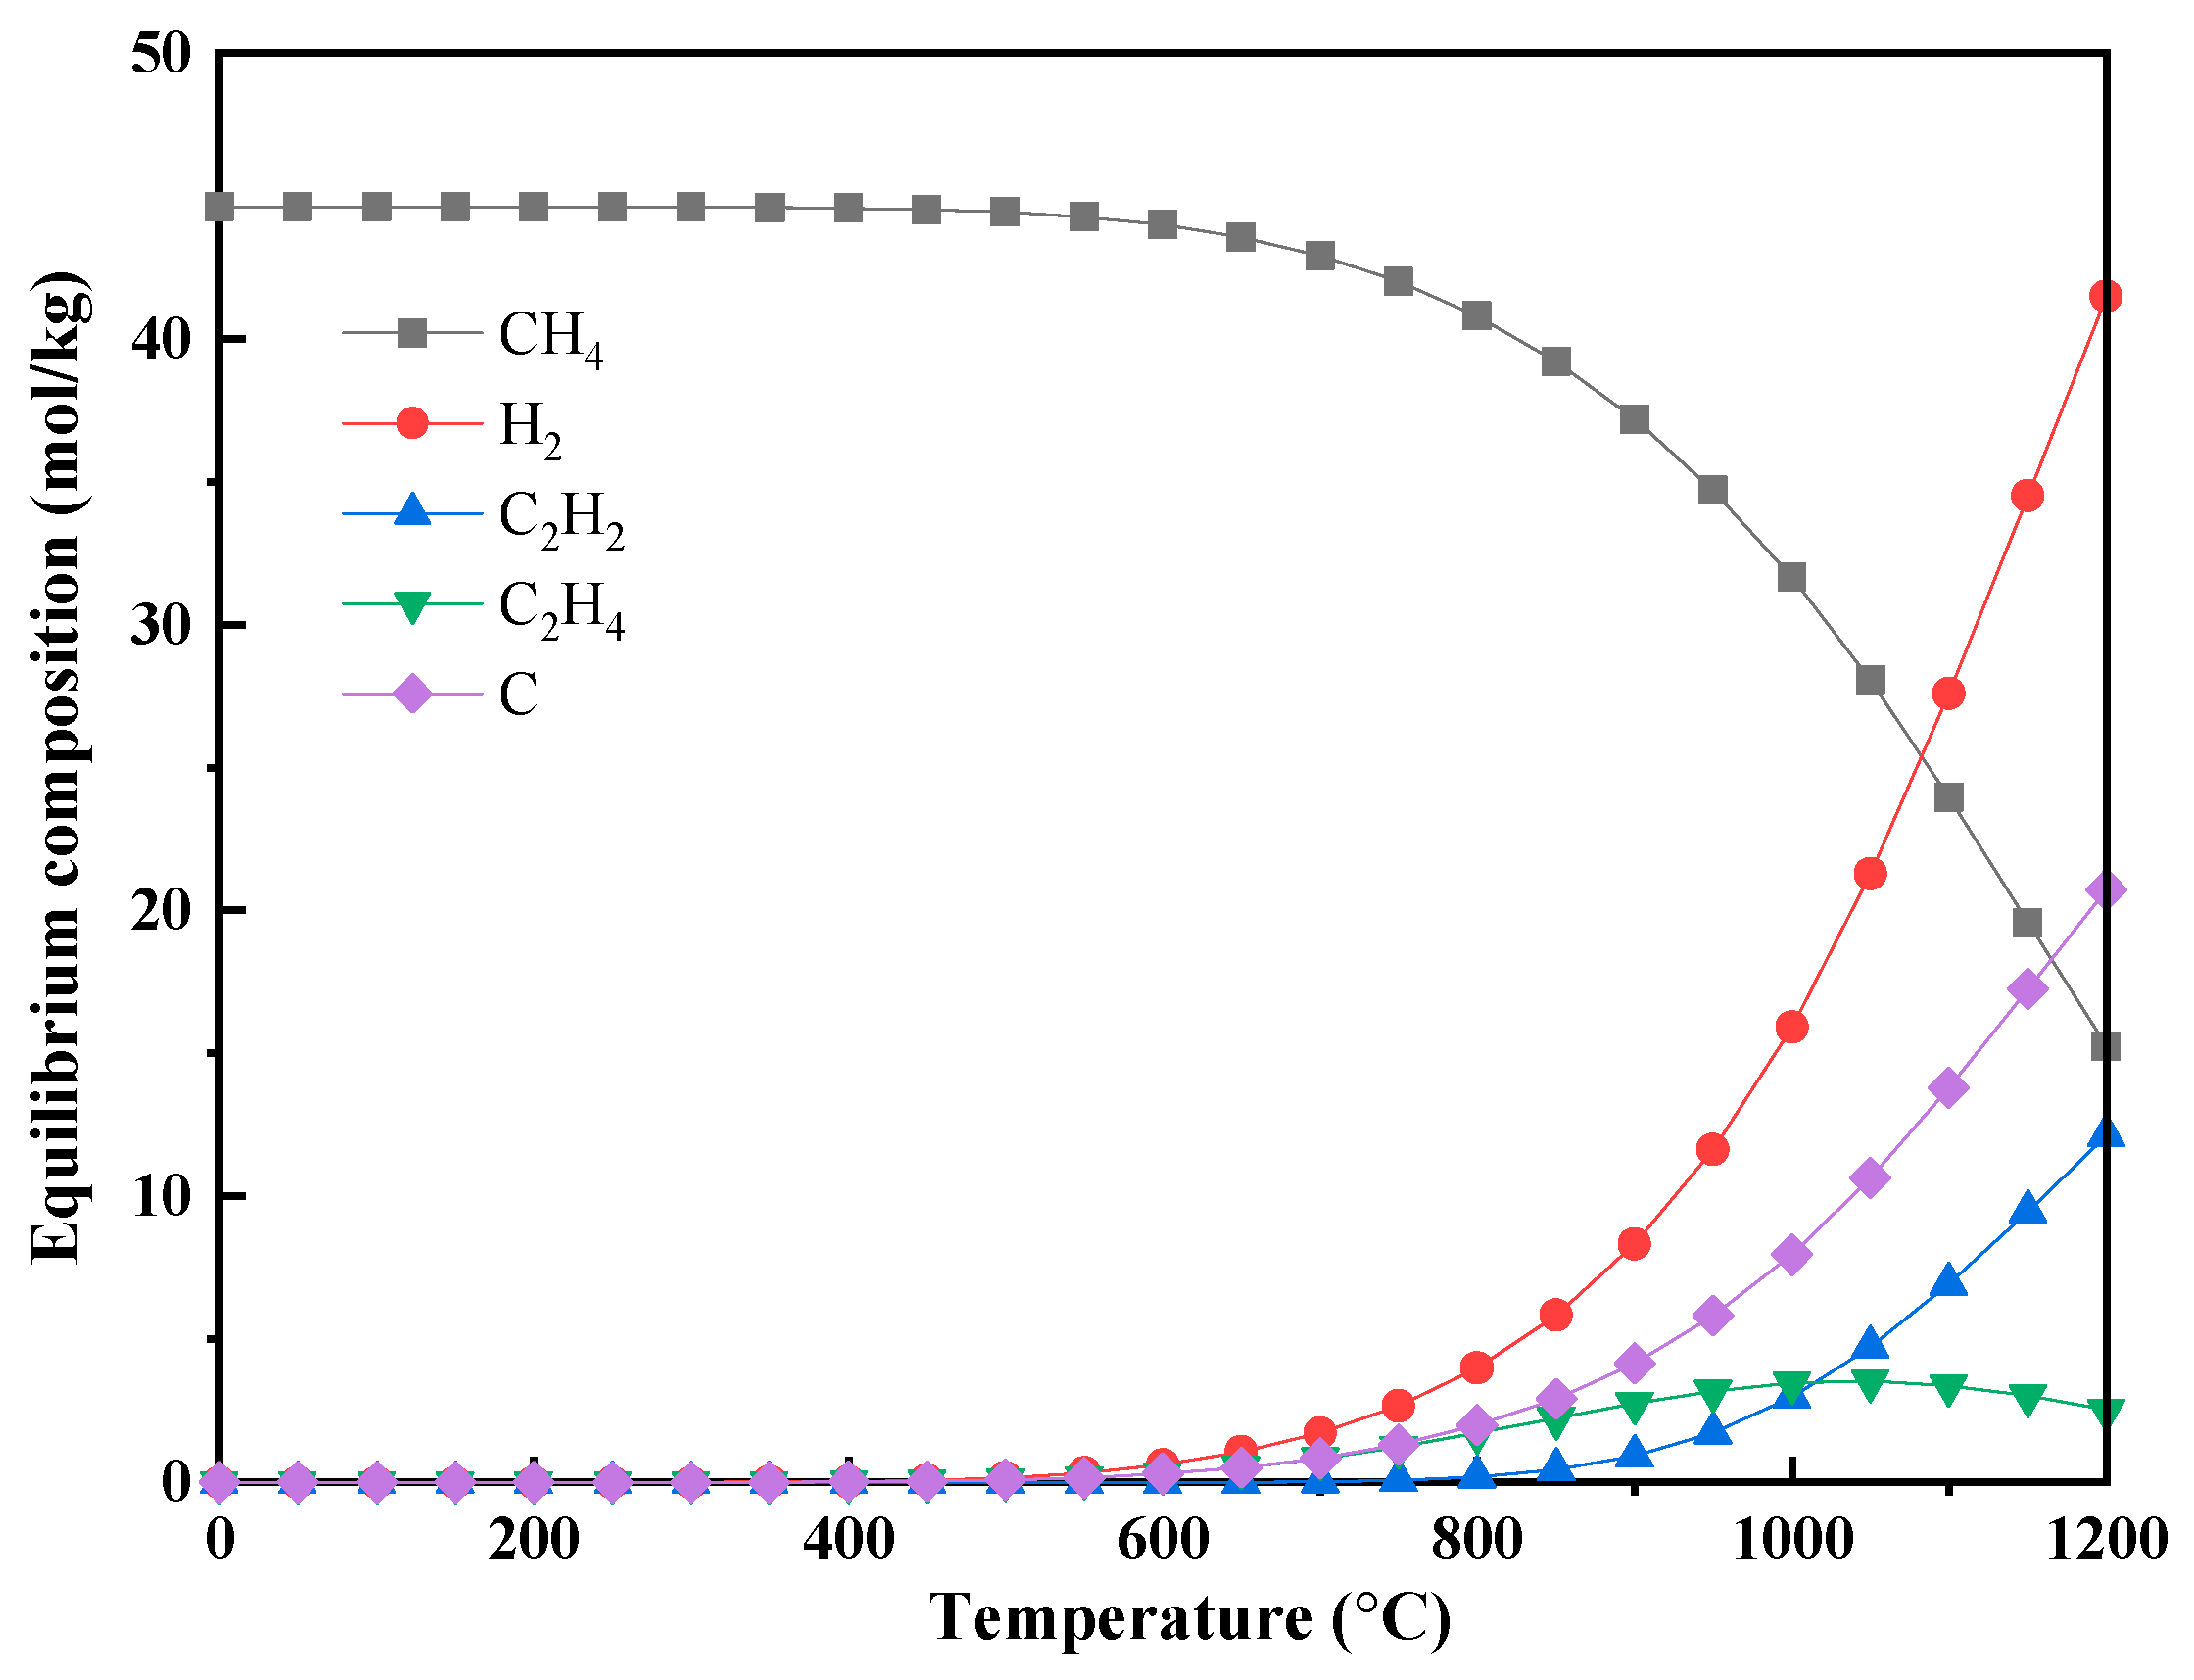
The equilibrium compositions for pure methane, cellulose, and lignin pyrolysis are shown in Figure 2 and Figure 3.
Figure 2. Equilibrium compositions of methane pyrolysis under different temperatures (p = 1 bar, 1 kg CH4).
Figure 3. Equilibrium compositions of biomass gasification under different temperatures (p = 1 bar, biomass 1 kg): (a) CE; (b) LG.
For pure methane (Figure 2), equilibrium conversion increases with temperature, reaching 24.90 wt.% with an H2 selectivity of 66.65% at 1200 °C. The mass yields of solid carbon (C) and hydrogen (H2) at 1200 °C were 20.75 and 41.49 mol per kg of methane, respectively. The dominant reaction is methane pyrolysis (Equation (1)), which becomes thermodynamically favorable above approximately 650 °C. Concurrently, secondary reactions arise at elevated temperatures, such as Equation (16) (CH4 → C2H4 + H2), forming ethylene (C2H4). As the temperature further increases to 800 °C, the equilibrium methane conversion reaches approximately 2.41 wt%, at which point Equation (17) (2CH4 → C2H2 + 3H2) becomes detectable, resulting in acetylene (C2H2) formation. When the temperature exceeds 1000 °C, Equation (18) (C2H2 → 2C(s) + H2) intensifies, further promoting the generation of solid carbon (i.e., carbon deposition).
The main secondary reaction pathways at high temperatures include [20]:
2 CH 4 ( g ) C 2 H 4 ( g ) + 2 H 2 ( g )   ( Ethylene   formation )
2 CH 4 ( g ) C 2 H 2 ( g ) + 3 H 2 ( g )   ( Acetylene   formation )
C 2 H 2 ( g ) 2 C ( s ) + H 2 ( g )   ( Carbon   deposition )
While the complete mechanism of methane decomposition remains complex and is not entirely resolved, there is broad agreement that it proceeds via stepwise dehydrogenation [21]. The generally accepted pathway involves initial ethane (C2H6) formation, followed by its conversion to ethylene (C2H4) and finally to acetylene (C2H2) in the last decomposition stage [20]:
2 CH 4 H 2 C 2 H 6 H 2 C 2 H 4 H 2 C 2 H 2 H 2 2 C
Although high temperatures increase methane conversion from a thermodynamic standpoint, the substantial energy input required makes this strategy economically unattractive on an industrial scale. Simulated results for methane cracking are consistent with experimental data [22,23]. However, actual methane conversion at elevated temperatures remains low due to kinetic limitations: the uncatalyzed cracking rate is slow and the reaction strongly favors the formation of solid carbon, driven by its low Gibbs free energy. Consequently, achieving close to thermodynamic equilibrium in methane pyrolysis typically necessitates catalytic intervention to accelerate reaction kinetics [24,25].
For biomass components (Figure 3), the equilibrium product distribution is highly dependent on the feedstock type. At 1200 °C, lignin (LG) yields 33.65 mol/kg (40.38 wt%) of solid carbon, much higher than the 6.58 mol/kg (7.90 wt%) produced from cellulose (CE). In contrast, cellulose generates substantially more CO (30.3 mol/kg) compared to lignin (19.16 mol/kg). These results align closely with previous experimental findings [26,27]. The evolution of H2O, CH4, CO2, and H2 also demonstrates distinct temperature-dependent behaviors for each biomass type.
Solid carbon originates primarily from the decomposition of the raw biomass and decreases thermodynamically as the temperature rises, stabilizing at a residual level at higher temperatures [28]. Notably, in the 300–500 °C range, carbon depletion slows or even reverses slightly due to the Boudouard reaction (Equation (4)), where CO disproportions into solid carbon and CO2. At temperatures between 600 and 1200 °C, the water-gas reaction (Equation (8)) becomes predominant in consuming fixed carbon.
The evolution of water vapor during biomass thermal conversion exhibits three temperature-dependent stages, governed by material structure and thermodynamics [29]. Below 200 °C, moisture is released via physical desorption, involving primarily the liberation of free hydroxyl groups (-OH) without breaking any chemical bonds. Between 200 and 600 °C, chemical dehydration dominates through aliphatic and phenolic hydroxyl condensation and decarboxylation. Above 600 °C, water is consumed by gas-phase reactions like water–gas reaction (Equation (8), water-gas shift reaction (Equation (9)), and steam reforming (Equation (10)), leading to near-zero net production. The yield of water differs markedly between cellulose and lignin, reflecting their distinct compositions [27].
Both methane (CH4) and carbon dioxide (CO2) concentrations show similar trends with temperature, rising initially before declining toward zero. The corresponding peak production temperatures occur at approximately 300 °C for CH4 and 600 °C for CO2. The observed increase in methane can be attributed not only to direct biomass cracking but also to methanation reactions between C/CO and H2 (Equations (5)–(7), T < 600 °C). The rise in CO2 production likely originates from the Boudouard reaction (Equation (4), T < 600 °C) and water-gas shift reactions (Equation (9), T < 800 °C). At elevated temperatures (>800 °C), both CH4 and CO2 are consumed through methane pyrolysis (Equation (1)) and reforming reactions (Equations (10) and (11)), leading to their eventual depletion and concomitant production of CO and H2.

3.2.2. Biomass–Methane Co-Pyrolysis

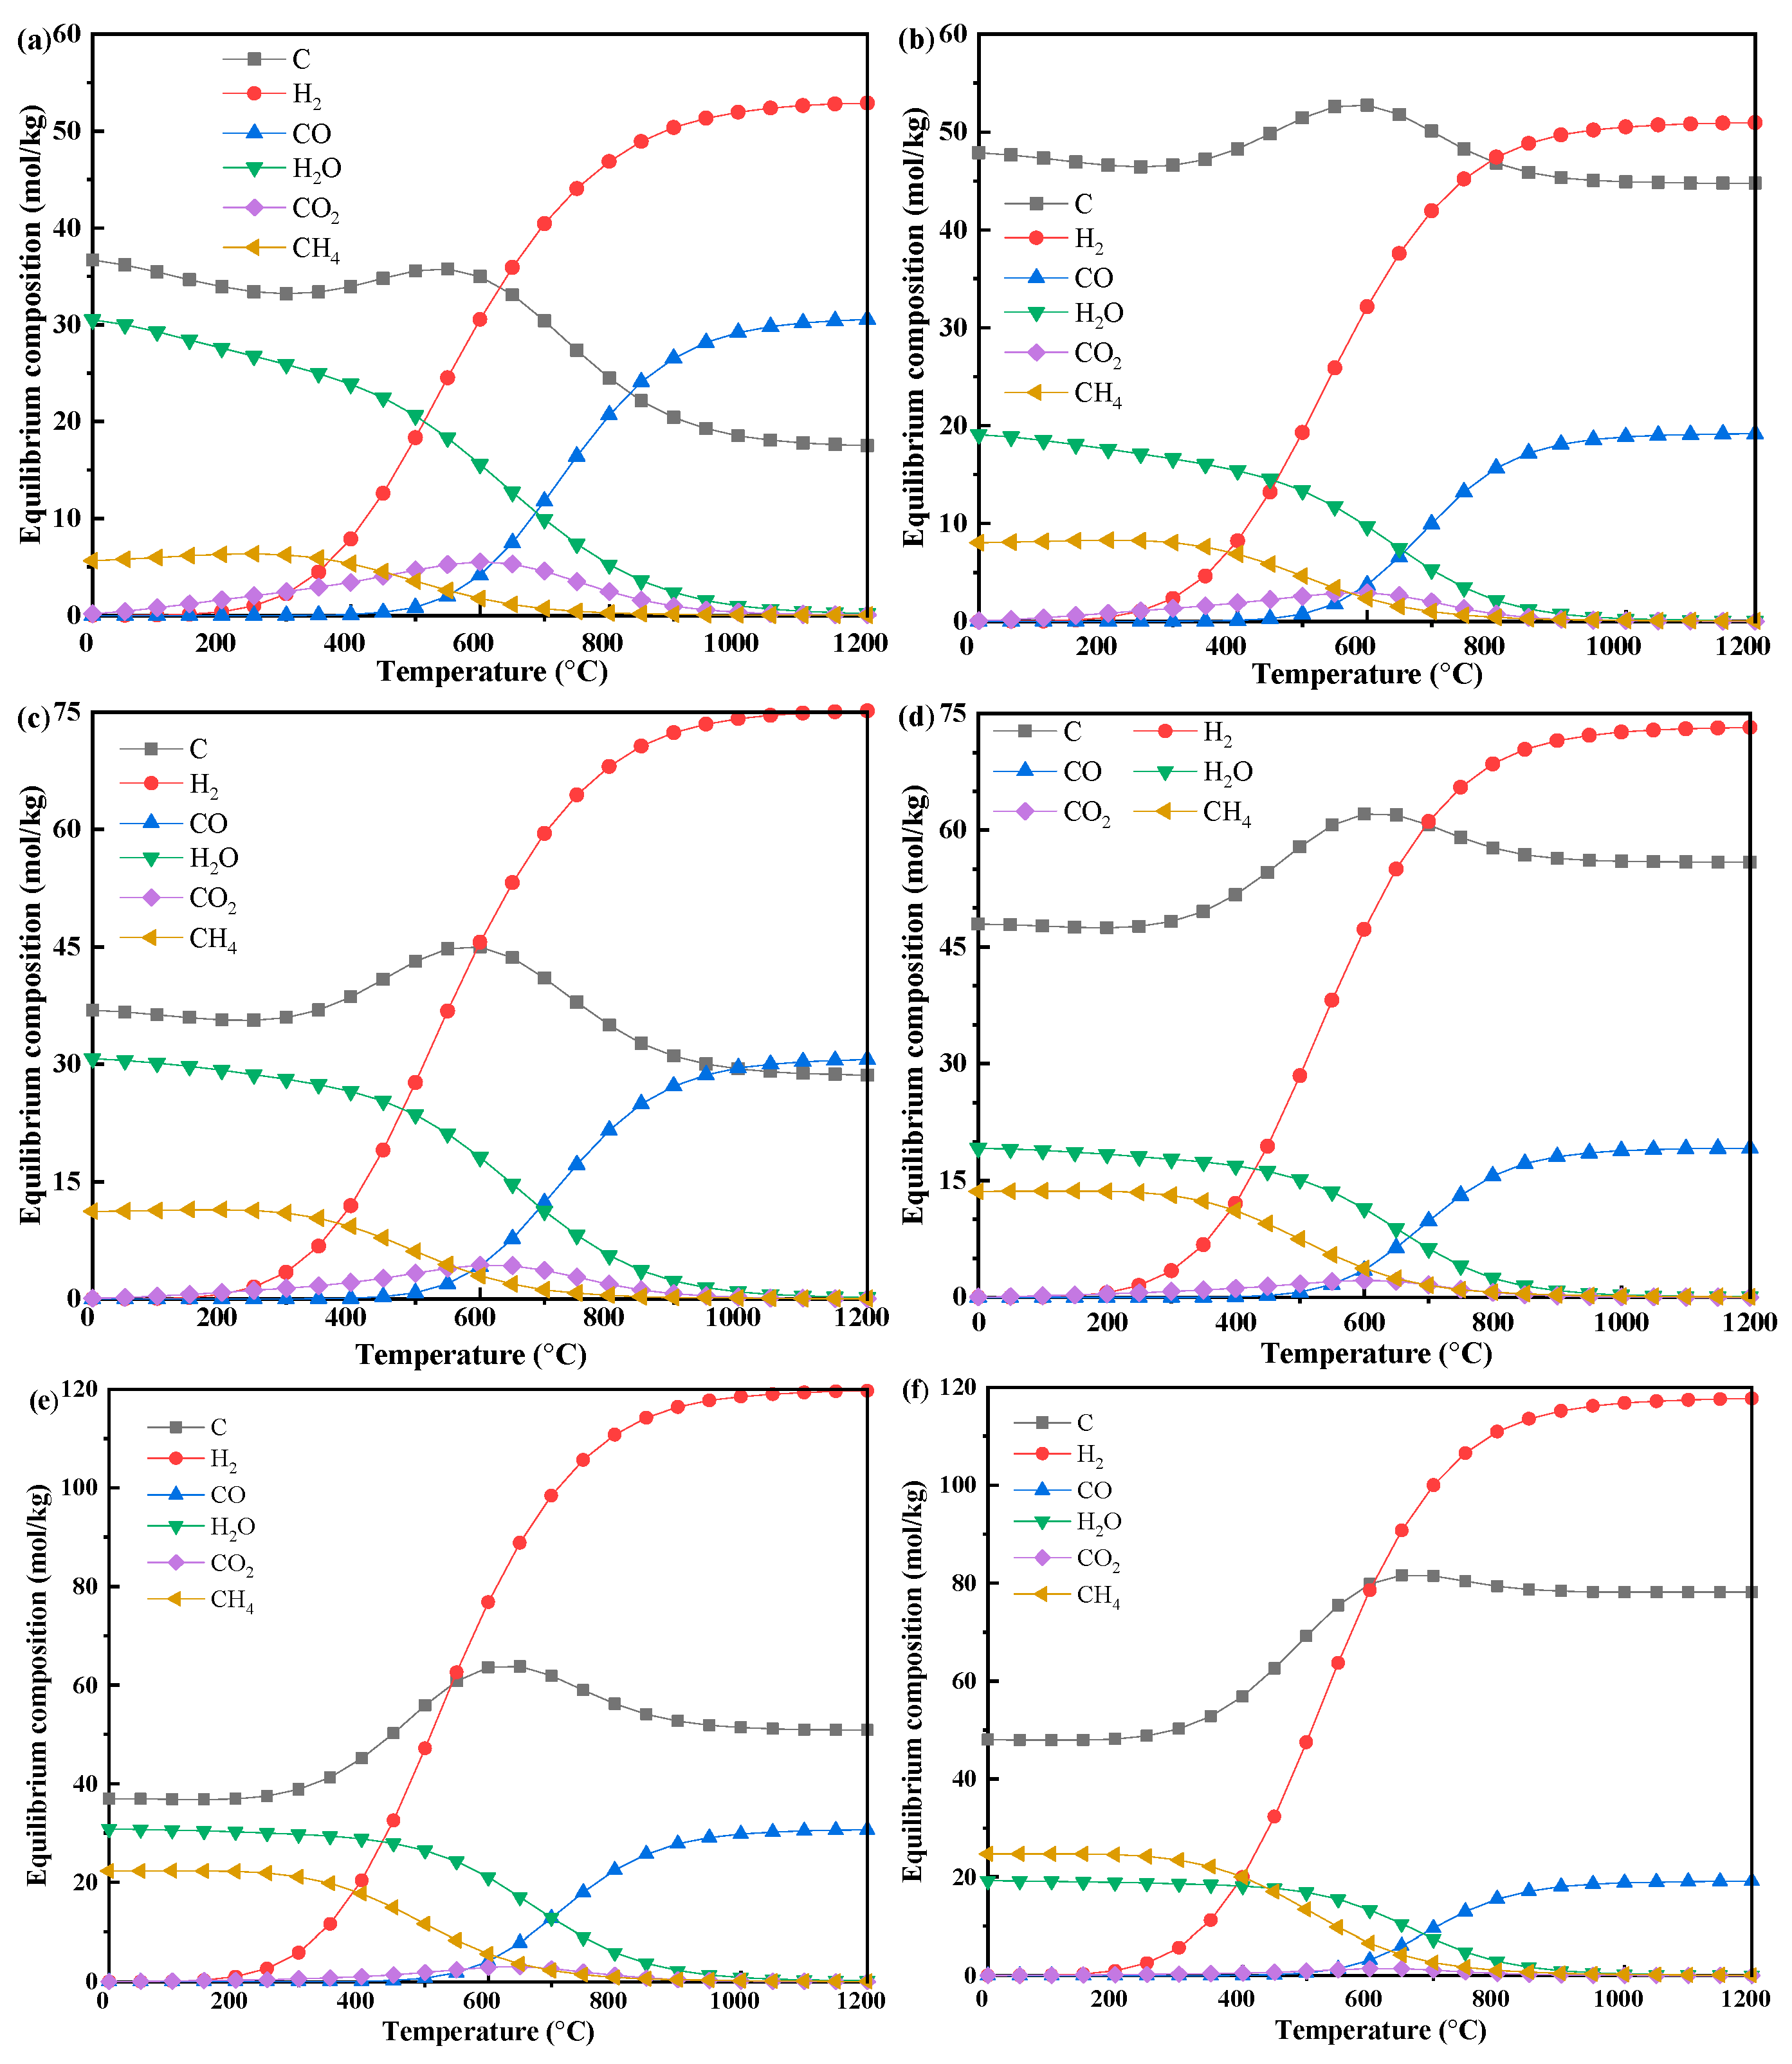
The equilibrium product distributions for biomass–methane mixtures at various mass ratios (ranging from 1:0.25 up to 1:1) are presented in Figure 4. The general temperature-dependent trends for major species (C, CH4, CO2, H2O, H2, CO) were consistent with those of pure biomass gasification, but the equilibrium concentrations were modified. Specifically, concentrations of C, CH4, and CO2 exhibit bell-shaped trends as temperature increases, while H2O content steadily declines. In contrast, H2 and CO show sigmoidal increases with temperature until reaching a plateau.
Figure 4. Influence of methane addition on the equilibrium compositions during biomass- methane co-pyrolysis under different temperatures (p = 1 bar, biomass 1 kg): (a) CE:CH4 = 4, (b) LG:CH4 = 4; (c) CE:CH4 = 2, (d) LG:CH4 = 2; (e) CE:CH4 = 1, (f) LG:CH4 = 1.
Importantly, higher methane content leads to a substantial enhancement in the yields of both solid carbon and H2, whereas the yield of CO remains remarkably stable across all conditions. At 1200 °C, for example, cellulose-based systems display an increase in carbon yield from 17.53 mol/kg to 50.86 mol/kg, and H2 yield rises from 52.89 mol/kg to 119.69 mol/kg as the biomass-to-methane ratio increases from 1:0.25 to 1:1, with CO maintaining approximately 30.6 mol/kg. Lignin exhibits similar temperature-dependent behavior but with characteristically higher carbon yields (44.77 to 78.16 mol/kg) and lower CO production (19.15 mol/kg) when compared to cellulose.

3.2.3. H2/CO Ratio and Tar Formation Characteristics

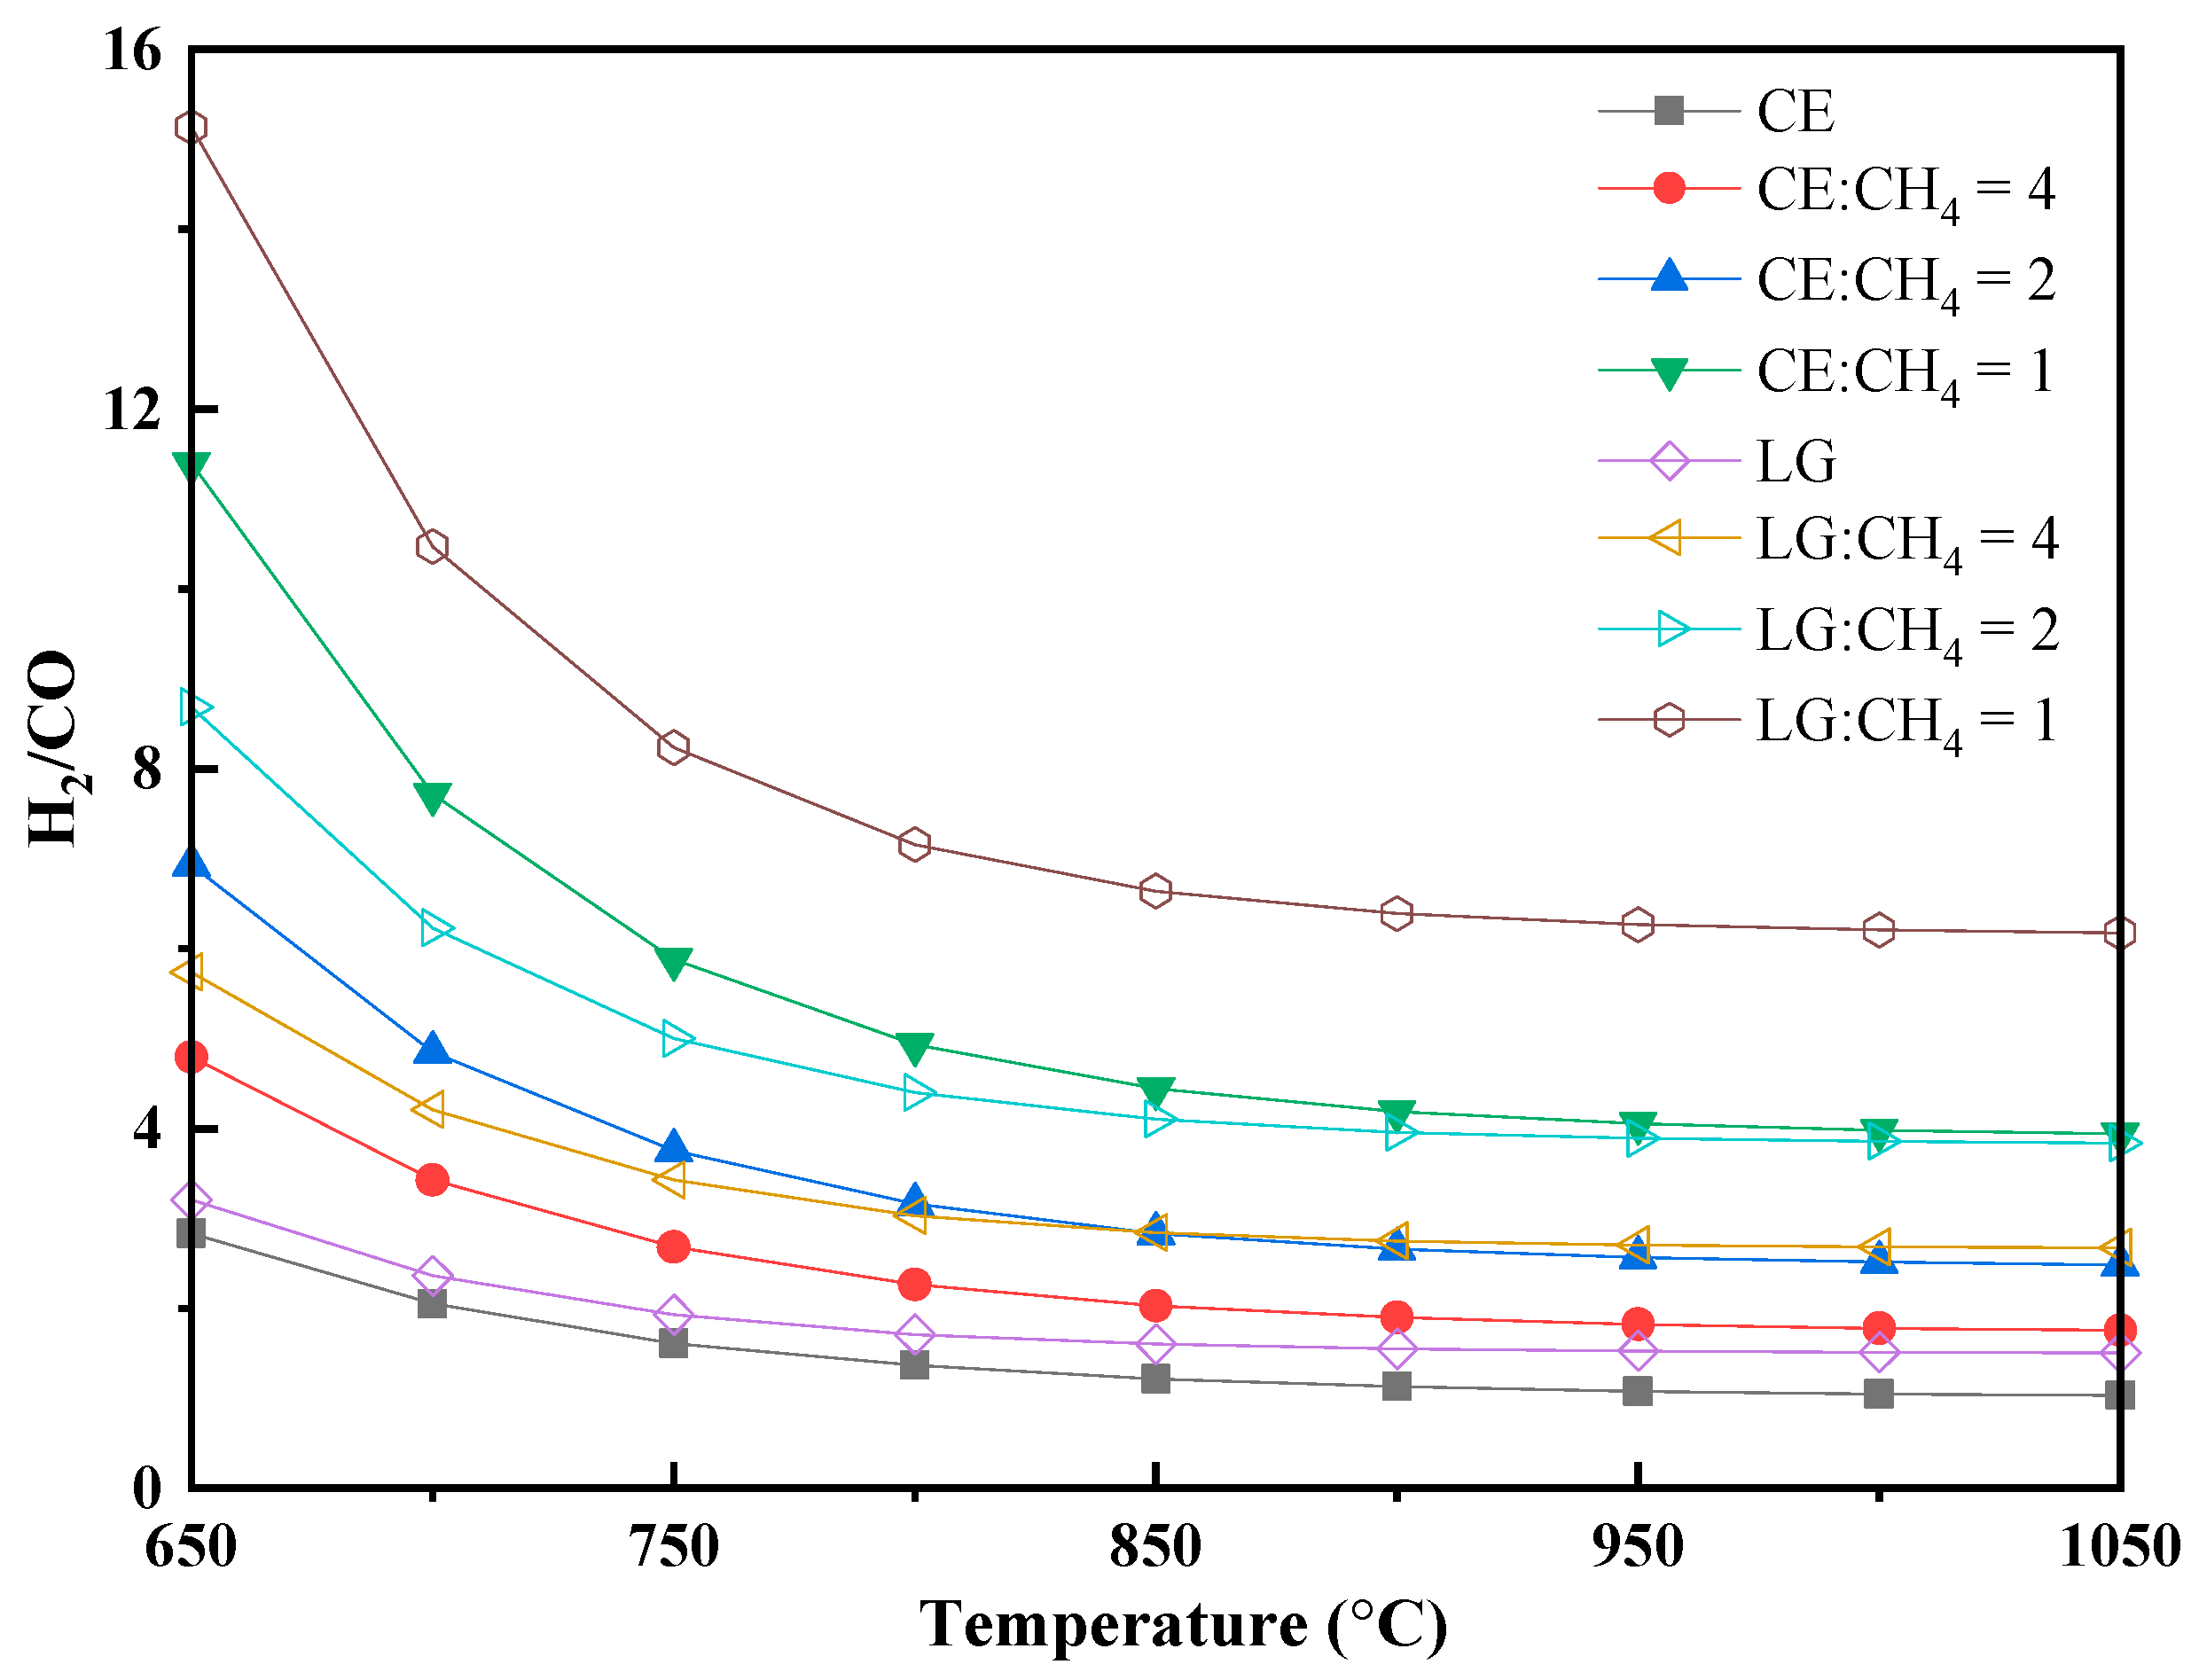
The H2/CO ratio of the syngas is strongly influenced by both the biomass-to-methane ratio and the reaction temperature (Figure 5). Higher methane content and lower temperatures resulted in a higher H2/CO ratio. Temperature-dependent analysis reveals an inverse correlation between H2/CO ratio and reaction temperature above 700 °C. This behavior stems from competing reaction pathways: while methane pyrolysis (Equation (1)), water-gas (Equation (8)), and reforming reactions (steam reforming, Equation (10): CH4 + H2O → CO + 3H2; dry reforming, Equation (11): CH4 + CO2 → 2CO + 2H2) are all thermally activated, the reverse water-gas shift reaction (Equation (9), CO2 + H2 → CO + H2O) becomes increasingly dominant at higher temperatures, effectively consuming H2 and consequently reducing the H2/CO ratio in the product gas [30].
Figure 5. Change in the ratio of H2/CO for biomass–methane co-pyrolysis under different temperatures (p = 1 bar, biomass 1 kg).
For pure biomass at 1200 °C, the syngas derived from lignin features a higher H2/CO ratio (1.50) than that from cellulose (1.01), reflecting lignin’s higher H2 yield and cellulose’s greater CO production per mass. When the biomass-to-methane ratio is set at 1:1, the H2/CO ratios increase dramatically to 3.91 for cellulose and 6.15 for lignin systems. These elevated H2/CO ratios (>2) are considered optimal for downstream applications such as liquid fuel synthesis via Fischer–Tropsch processes [8,10].
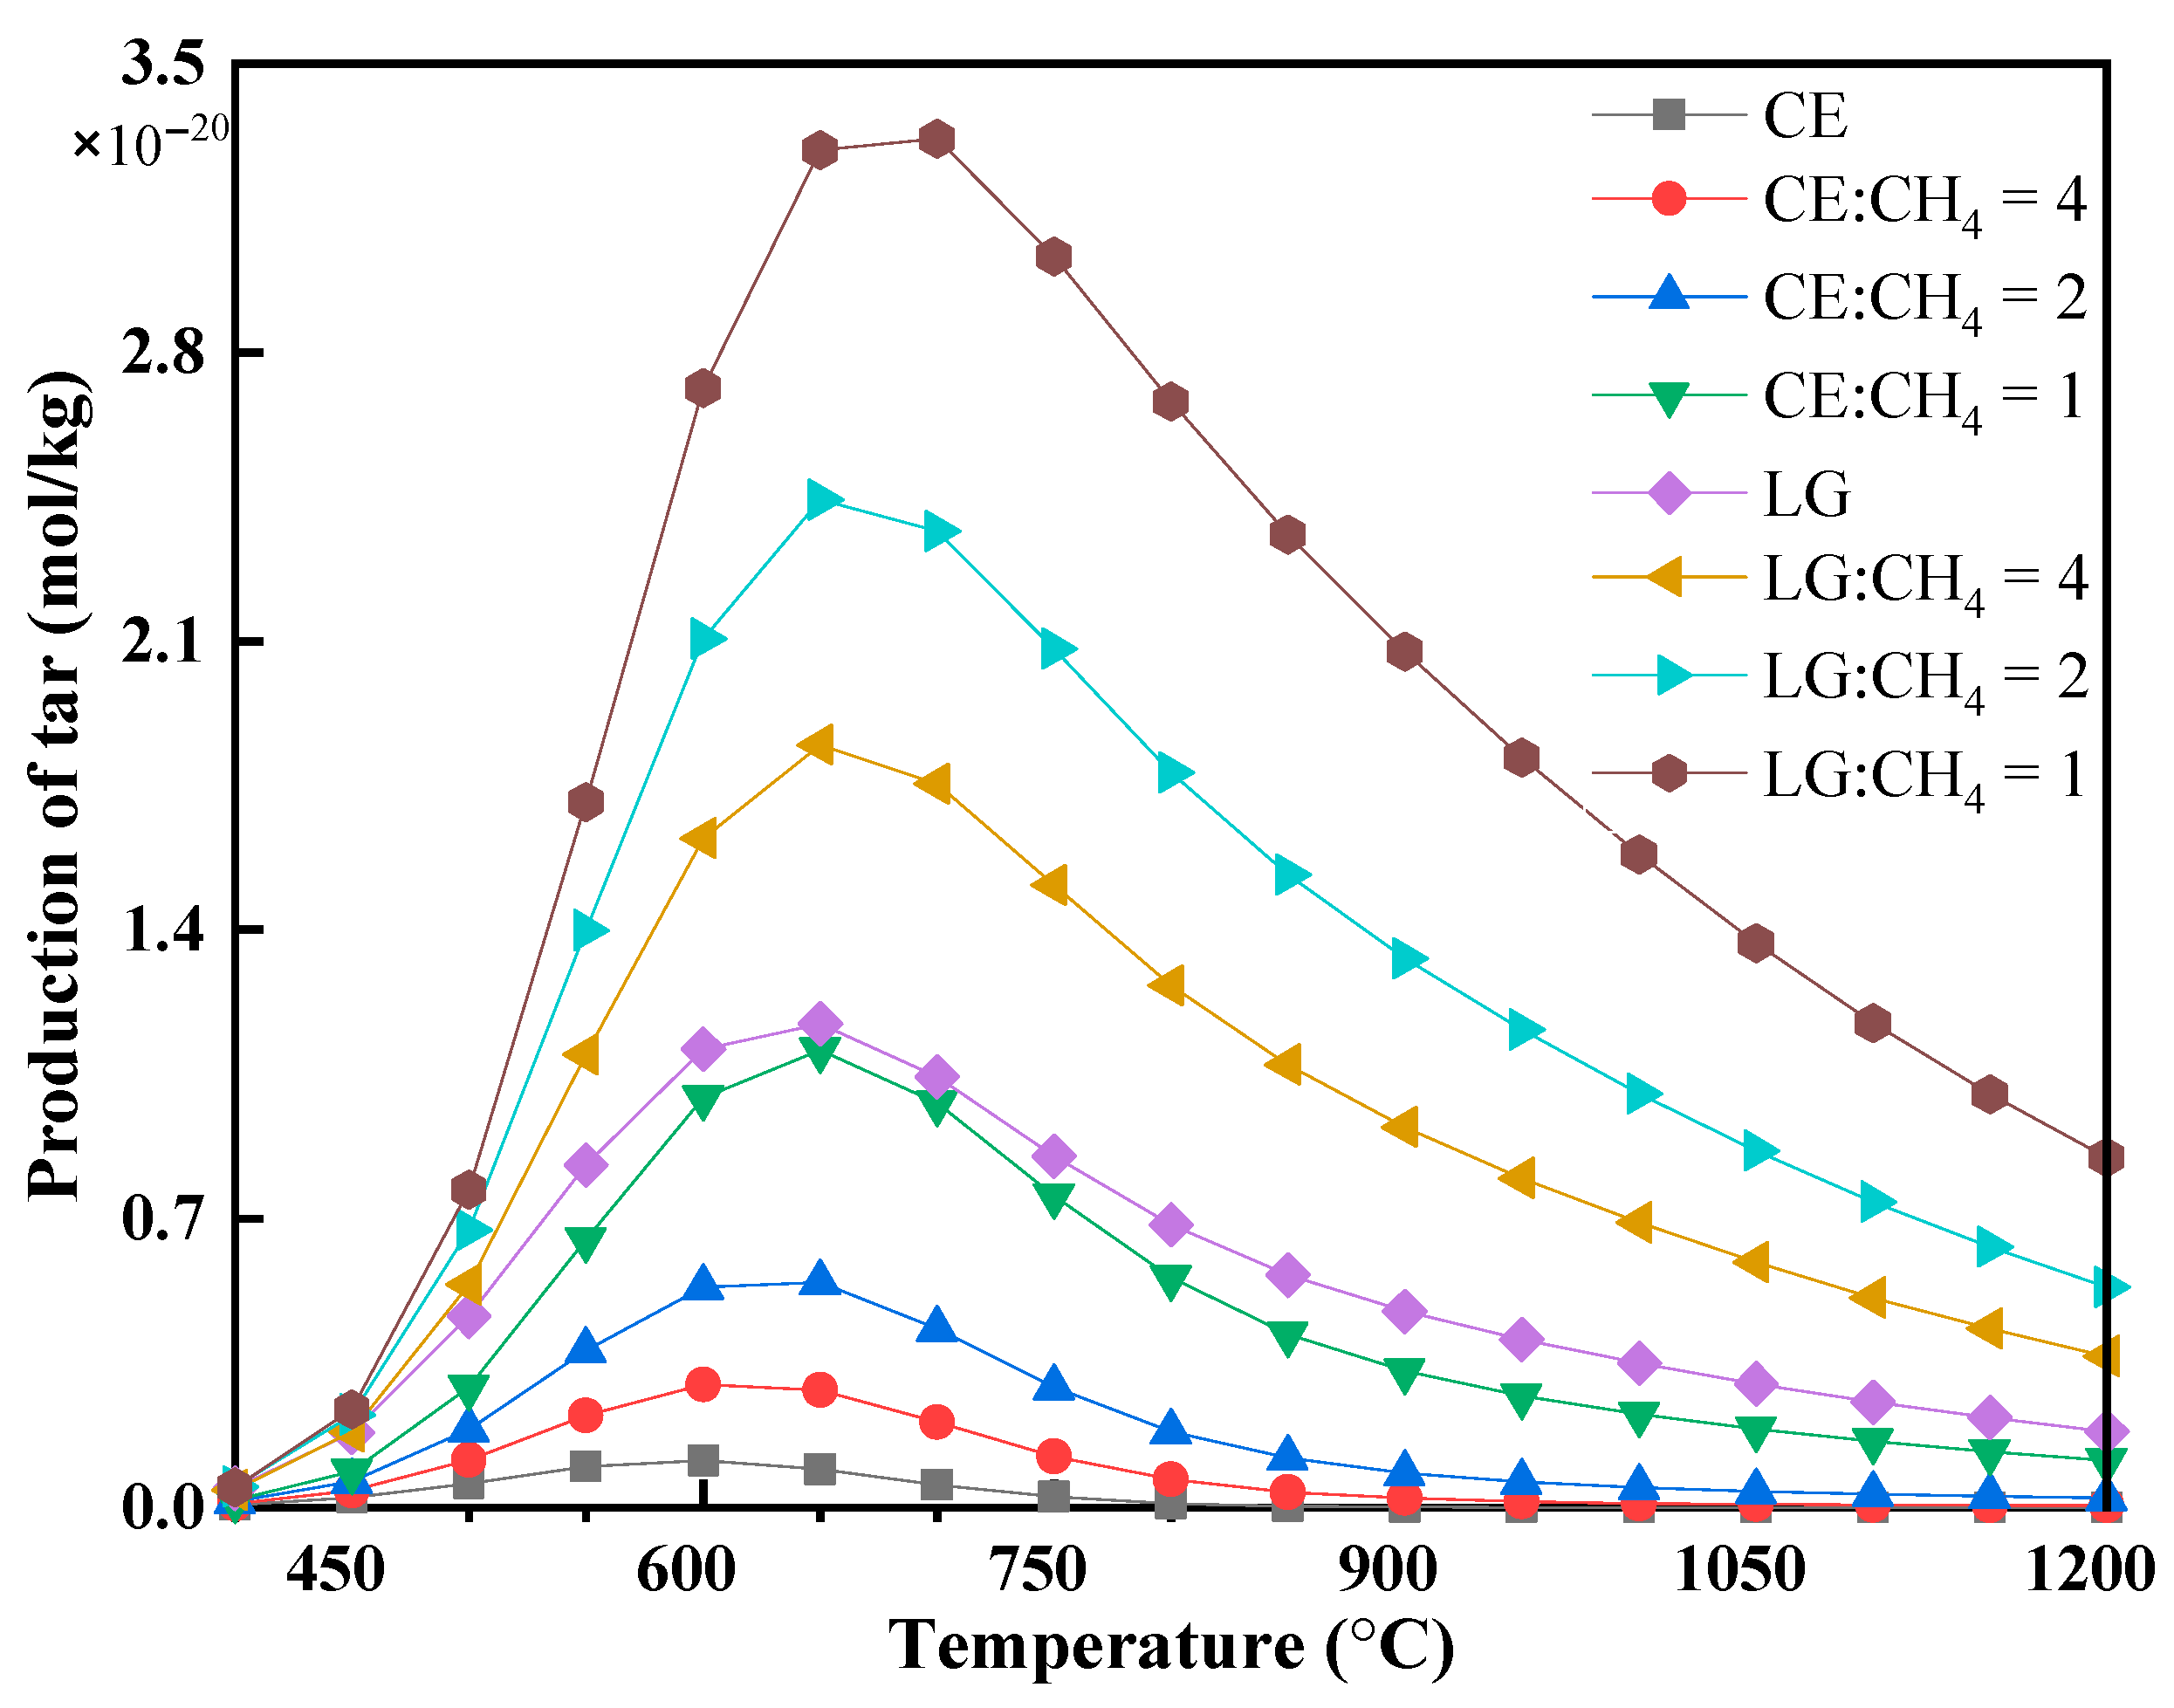
Understanding tar formation and its decomposition is equally important for effective gasification process design and catalyst optimization [8,31]. The equilibrium yield of tar exhibits a unimodal trend with temperature—increasing to a peak near 600 °C before declining at higher temperatures (Figure 6). Across the temperature spectrum, lignin consistently produces more tar than cellulose. Additionally, supplementing the biomass with methane leads to substantially higher equilibrium tar yields compared to pure biomass gasification under equivalent conditions.
Figure 6. Tar formation during biomass-methane co-pyrolysis under different temperatures (p = 1 bar, biomass 1 kg).

3.3. Energy Recovery Efficiency

The energy of products and corresponding energy recovery efficiency were quantitatively assessed using the calculation methods defined in Equations (13)–(15), with detailed results presented in Table 2.
Table 2. Energy of products and energy recovery efficiency of co-pyrolysis of biomass and methane under different temperatures.
For pure feedstocks, energy recovery efficiency improves as reaction temperature increases. In pure methane pyrolysis, the energy content of the gas products rises from 36.43 MJ/kg CH4 at 800 °C to 38.53 MJ/kg CH4 at 1000 °C. Correspondingly, the energy recovery efficiency improves from 72.68% to 76.87%. However, the incremental energy gain of just 2.1 MJ/kg CH4 over this temperature range is economically disadvantageous given the significant energy input necessary for operating at higher temperatures.
For pure biomass pyrolysis, both cellulose and lignin show increased energy output with rising temperature, though their energy recovery efficiencies differ notably. Cellulose undergoes a particularly dramatic improvement: product energy increases from 13.4 MJ/kg biomass (Eη = 82.74%) at 800 °C to 16.1 MJ/kg biomass (Eη = 99.36%) at 1000 °C, reflecting near-complete conversion at the highest temperature assessed. By contrast, lignin’s efficiency remains substantially lower, reaching only 15.13 MJ/kg (61.77%) at 800 °C and 16.08 MJ/kg (65.62%) at 1000 °C.
In the biomass–methane co-pyrolysis system, increasing methane loading (from 0 to 1 kg CH4/kg biomass) boosts total energy output, but its effect on energy recovery efficiency varies by biomass type. For cellulose, Eη d decreases with methane addition—from 82.74% (pure biomass, 800 °C) to 60.74% at the same temperature with methane—while for lignin, Eη increases from 61.77% to 68.34% at 800 °C as methane content rises.

4. Discussion

4.1. Thermodynamic Driving Forces and Reaction Pathways

The calculated ΔG serves as a fundamental indicator of reaction spontaneity and equilibrium in biomass–methane co-pyrolysis systems. A critical thermodynamic threshold is observed at 700 °C: below this temperature, competing methanation and carbon deposition reactions are favored, consuming H2 and depositing solid carbon, which hinders efficient syngas production [19]. Above 700 °C, the equilibrium shifts toward methane cracking and steam or dry reforming reactions, resulting in a substantial increase in both total syngas yield and the H2/CO ratio, making the syngas especially suitable for downstream applications such as Fischer–Tropsch synthesis (H2/CO > 2) [32,33]. Additionally, targeted steam injection can further suppress undesirable side reactions such as methanation and carbon deposition, allowing selective production of high-purity, hydrogen-rich syngas [19]. These thermodynamic findings align closely with the experimental results of Lalsare et al. [7], underscoring that, upon methane addition, the shift in product distribution is driven not by methane accumulation, but by its active participation in reforming reactions that enhance hydrogen yield. Therefore, maintaining reaction conditions above 700 °C with controlled steam addition is key to maximizing H2-rich syngas while minimizing byproduct formation during biomass–methane co-pyrolysis.

4.2. Influence of Biomass Molecular Structure

The pronounced differences in product distributions between cellulose and lignin (Figure 3) arise from their distinct molecular architectures, which dictate unique thermal decomposition pathways and resultant equilibrium states [27]. These structural contrasts manifest primarily in two ways: the stability of the carbon framework and the characteristics of oxygen-containing functional groups.
Firstly, lignin features a highly cross-linked aromatic network stabilized by strong C–C and ether bonds (>300 kJ/mol), imparting high thermal stability that encourages carbon retention and condensation reactions—and consequently, higher solid carbon and tar yields [28]. In contrast, cellulose possesses a linear polysaccharide structure with weaker glycosidic bonds (70 kJ/mol), facilitating depolymerization and volatilization and resulting in higher gas yields.
Secondly, functional group composition impacts gas-phase product speciation. Lignin contains methoxy (-OCH3) and alkyl side chains that act as methyl donors, leading to significantly increased methane production via methyl radical recombination [31]. Cellulose, which lacks these groups, produces minimal methane. Its high concentration of labile carboxyl (-COOH) groups (Ea ≈ 90 kJ/mol) makes it a major source of CO2 through decarboxylation [34], while CO2 from lignin typically forms via rearrangement of more stable carbonyl groups.
Further distinctions arise in the formation of CO and H2. Cellulose efficiently generates CO through β-scission of carbohydrate rings and benefits from higher oxygen mobility, yielding 1.58 times more CO than lignin at equilibrium. Cellulose’s aliphatic chain structure also more efficiently undergoes aromatization and dehydrogenation of furanic intermediates at high temperature (>600 °C), promoting slightly higher H2 yields than lignin [28,29]. These observations highlight cellulose’s greater facility for converting oxygen functional groups to CO and its molecular structure to H2.
In summary, the observed product distribution is fundamentally governed by the molecular architecture of the biomass: lignin’s stable aromatic and cross-linked framework favors carbon and methane formation, while cellulose’s reactive aliphatic polysaccharide structure favors gasification and efficient syngas production.

4.3. Synergistic Mechanisms in Co-Pyrolysis

The analysis of product evolution across temperatures reveals distinct regimes governed by different reaction pathways. At low temperatures (<600 °C), methane remains mostly inert, and any CH4 detected below 300 °C arises from biomass decomposition, serving as a baseline for methane’s influence. As temperature increases above 800 °C, reforming reactions begin to dominate, converting primary pyrolysis products into solid carbon (C), CO, and H2, establishing unique high-temperature equilibrium states. Notably, for both cellulose and lignin, increasing the methane input consistently yields higher amounts of reduced products (C, CH4, H2) and inhibits oxidized species (CO2, CO), indicating a reproducible shift toward more reductive product composition [7,13].
At high temperatures (800–1200 °C), the impact of methane addition becomes pronounced. Thermodynamic decoupling analysis—subtracting pure component pyrolysis yields from the co-pyrolysis output—demonstrates clear synergistic effects:
(1)
Methane enhances biomass conversion: At a 1:1 ratio, cellulose produces an additional 30.10 mol C/kg and 78.20 mol H2/kg, while lignin yields an extra 57.41 mol C/kg and 76.20 mol H2/kg compared to theoretical values from individual pyrolysis.
(2)
Biomass catalyzes methane cracking: Co-pyrolysis significantly boosts methane conversion, raising it from 24.90% for pure methane to over 53% with biomass present, nearly doubling the yield while maintaining high H2 selectivity (~67%).
This mutual enhancement demonstrates a profound thermodynamic and kinetic synergy. The observed enhancement in H2 yield and the shift toward a more reductive environment suggest a potential mechanism involving reactive intermediates. Consistent with previous kinetic research, methane pyrolysis generates radicals (such as ·H and ·CH3) that promote hydrodeoxygenation (HDO) and cracking during biomass conversion [7]. Therefore, the thermodynamic shift observed in our model can be rationally interpreted as a consequence of such radical chain interactions. Simultaneously, the generated biochar functions catalytically, providing active surfaces for these radical processes and facilitating carbon nucleation, thus lowering the activation energy for methane cracking [7,35]. The overall shift toward a reductive environment is fundamentally driven by the high H/Ceff ratio of methane (4.0), which counterbalances the comparatively low H/Ceff ratio of biomass (0.1–1.5).
In essence, co-pyrolysis synergy improves product quality via two primary mechanisms: radical-mediated tar cracking, which increases H2 yield, and optimization of the overall H/C ratio for producing desirable syngas [7,13,16]. Furthermore, the methane decomposition pathway (CH4 → C + 2H2) offers a thermodynamically feasible route with near-zero CO2 emissions, effectively complementing the carbon-neutral nature of biomass and aligning with the development of low-carbon energy technologies [3].

4.4. Implications for Process Optimization and Challenges

The H2/CO ratio serves as a critical indicator for evaluating syngas quality and determining its suitability for downstream applications, particularly catalytic conversion processes. The inverse correlation between H2/CO ratio and temperature above 700 °C is due to the increasing dominance of the reverse water-gas shift reaction (RWGS), which preferentially consumes H2 at higher temperatures [30]. The ability to tune the H2/CO ratio from 1.0 to over 6.0 by adjusting the biomass-to-methane ratio and temperature (Figure 5) provides crucial flexibility for tailoring syngas to specific downstream applications, such as Fischer–Tropsch synthesis [8].
However, pursuing an optimal H2/CO ratio must be balanced against tar formation challenges. Tar yield follows a unimodal trend with temperature, peaking around 600 °C. Notably, lignin produces significantly more tar than cellulose due to its native cross-linked aromatic structure, which serves as a stable precursor for condensation [27]. Methane addition, especially at higher ratios (up to 1 kg CH4 per kg biomass), further elevates equilibrium tar yield. Early tar formation is dominated by devolatilization, generating light aromatics (benzene, toluene) and phenolics [30]. Above 700 °C, continued heating leads to secondary cracking and fusion into polycyclic aromatic hydrocarbons (PAHs)-exemplified by biphenyl (C12H10) and naphthalene (C10H8) formation (Equation (20)) [36]. These heavier tars can eventually be cracked into syngas and solid carbon. Methane may inhibit tar decomposition (driving formation of heavier compounds via methyl radical insertion) [36], which aligns with observed increases in tar yield.
2 C 6 H 6 H 2 C 12 H 10 Biphenyl H 2 C 10 H 8 Naphthalene
Despite methane’s substantial boost to net H2 production (by 40–160% over theoretical methane-only values), the tradeoff is increased tar—a precursor for carbon deposition and reactor fouling. Striking a balance is essential. Thermodynamic analysis identifies a 50% methane blending ratio as optimal: it maximizes H2 yield while limiting carbon formation. This optimum is corroborated by experimental findings (e.g., Korpeh et al. [1]), who reported enhanced combustion properties at the same proportion. Such modeling–experimental agreement underscores a robust synergistic effect at this ratio, achieving both thermodynamic and operational benefits.
Additionally, the process yields significant solid carbon (up to 78.16 mol/kg for lignin) alongside hydrogen-rich syngas. This solid product is biochar—a porous, functionalized carbon material [21,37]. Unlike undesirable amorphous coke, biochar is a valuable co-product for use as adsorbent, catalyst support, or soil amendment [37,38]. Its high yield not only avoids operational issues but also presents opportunities for circular resource utilization, supporting process economics and sustainability.

4.5. Energetic Performance and Feedstock Selection

Analysis of energy recovery efficiency (Eη) provides critical insights for practical process optimization. Cellulose achieves near-complete conversion (Eη = 99.36% at 1000 °C), while lignin, owing to its recalcitrant aromatic structure, achieves significantly lower efficiency (65.62% at the same temperature) [27]. Methane addition further highlights these differences: for cellulose, co-processing increases total energy output but reduces overall system efficiency due to methane’s moderate conversion rate. By contrast, co-pyrolysis with lignin is highly advantageous, simultaneously boosting both total energy and process efficiency by compensating for lignin’s lower inherent conversion.
Furthermore, the modest energy gain (2.1 MJ/kg) associated with a 200 °C temperature increase in pure methane pyrolysis, compared to the required energy input, highlights the economic obstacles of uncatalyzed thermal decomposition—a limitation rooted in thermodynamic equilibrium [39,40].
Collectively, these findings inform the design of industrial co-pyrolysis processes, suggesting the strategic pairing of refractory biomass streams (such as lignin) with methane-rich gas sources to maximize energy recovery and conversion efficiency, thereby enhancing economic viability.

5. Conclusions

This study establishes a comprehensive thermodynamic and mechanistic framework for biomass-methane co-pyrolysis through Gibbs free energy minimization modeling. The key findings reveal that the process is governed by a critical temperature threshold of 700 °C, below which methanation and carbon deposition prevail, and above which cracking and reforming reactions dominate to produce high-purity syngas.
The introduction of methane induces a fundamental shift in reaction pathways toward reduction, significantly enhancing solid carbon and hydrogen yields while suppressing oxidized products (CO/CO2). This synergistic effect is bidirectional: methane-derived reactive intermediates (e.g., ·H and ·CH3) promote the hydrodeoxygenation and stabilization of biomass-derived carbon, while the in situ formed biochar acts as an effective catalyst, boosting methane conversion from 25% to over 53% while maintaining high hydrogen selectivity (~67%).
The distinct molecular structures of biomass components critically influence the outcomes. Lignin’s aromatic network favors carbon retention and tar formation, whereas cellulose’s aliphatic chains lead to higher CO yields. Consequently, the synergistic enhancement in energy efficiency is more pronounced for recalcitrant lignin than for highly convertible cellulose.
Optimization analysis identifies an optimal methane-to-biomass ratio of 50% and a temperature of 1000 °C, which collectively maximize hydrogen yield, limit carbon deposition and tar formation, and yield a tunable H2/CO ratio (1.0–6.0) suitable for downstream applications like Fischer–Tropsch synthesis.
In summary, these insights provide a fundamental thermodynamic foundation for designing efficient co-pyrolysis processes. The work highlights the potential of biomass-methane co-processing as a versatile strategy for the sustainable co-production of high-quality syngas and carbon materials with minimized undesirable byproducts.

Author Contributions

Data curation, H.G.; Formal analysis, H.G. and D.L.; Investigation, H.G.; Methodology, Z.W. and K.K.; Resources, Z.W.; Supervision, D.L.; Visualization, D.L.; Writing—original draft, H.G.; Writing—review and editing, Z.W., K.K. and D.L. All authors have read and agreed to the published version of the manuscript.

Funding

This work was supported by the Shaaxi Provincial Talent Scheme (SXBR9175).

Institutional Review Board Statement

Not applicable.

Data Availability Statement

The original contributions presented in this study are included in the article. Further inquiries can be directed to the corresponding author(s).

Conflicts of Interest

The authors declare no conflicts of interest.

Abbreviations

The following abbreviations are used in this manuscript:
CECellulose
CGECold gas efficiency
GGuaiacyl lignin subunit
Hp-hydroxyphenyl
HDOHydrodeoxygenation
HHVHigher heating value
LHVLower heating value
LGLignin (Used as a label in figures and tables)
MJMegajoule
PAHsPolycyclic aromatic hydrocarbons
SSyringyl lignin subunit
WGSRWater–gas shift reaction

References

  1. Korpeh, M.; Lotfollahi, A.; Moghimi, M.; Anvari-Moghaddam, A. Combustion optimization of various biomass types to hydrogen-rich syngas: Two-stage pyrolysis modeling, methane addition effects, and environmental impact assessment. Int. J. Hydrogen Energy 2025, 133, 458–471. [Google Scholar] [CrossRef]
  2. Rathi, N.; Das, T. Exploring biomass pyrolysis for sustainable hydrogen-rich gas production. Biomass Bioenergy 2025, 202, 108162. [Google Scholar] [CrossRef]
  3. Gholami, Z.; Gholami, F.; Šimek, J.; Svobodová, K.; Vakili, M. Hydrogen production for a decarbonized future: A review of production technologies. J. Ind. Eng. Chem. 2025. [Google Scholar] [CrossRef]
  4. Abedinia, O.; Shakibi, H.; Shokri, A.; Sobhani, B.; Sobhani, B.; Yari, M.; Bagheri, M. Optimization of a syngas-fueled SOFC-based multigeneration system: Enhanced performance with biomass and gasification agent selection. Renew. Sustain. Energy Rev. 2024, 199, 114460. [Google Scholar] [CrossRef]
  5. Rabea, K.; Michailos, S.; Hughes, K.J.; Ingham, D.; Pourkashanian, M. A new hydrogen production route through biomass gasification in a two-stage fixed bed reactor within the BECCS concept: A techno-economic and life cycle assessment study. Int. J. Hydrogen Energy 2025, 124, 140–152. [Google Scholar] [CrossRef]
  6. Silva, I.P.; Lima, R.M.A.; Silva, G.F.; Ruzene, D.S.; Silva, D.P. Thermodynamic equilibrium model based on stoichiometric method for biomass gasification: A review of model modifications. Renew. Sustain. Energy Rev. 2019, 114, 109305. [Google Scholar] [CrossRef]
  7. Lalsare, A.; Wang, Y.; Li, Q.; Sivri, A.; Vukmanovich, R.J.; Dumitrescu, C.E.; Hu, J. Hydrogen-rich syngas production through synergistic methane-activated catalytic biomass gasification. ACS Sustain. Chem. Eng. 2019, 7, 16060–16071. [Google Scholar] [CrossRef]
  8. Ren, J.; Cao, J.-P.; Zhao, X.-Y.; Yang, F.-L.; Wei, X.-Y. Recent advances in syngas production from biomass catalytic gasification: A critical review on reactors, catalysts, catalytic mechanisms and mathematical models. Renew. Sustain. Energy Rev. 2019, 116, 109426. [Google Scholar] [CrossRef]
  9. Chen, Y.; He, H.; Li, Y.; Liu, B.; Liu, X. Study on the regulation of Fischer-Tropsch synthesis catalytic performance by mixing oxides with iron-based catalysts. J. Fuel Chem. Technol. 2025, 53, 1212–1222. [Google Scholar] [CrossRef]
  10. Molefe, T.; Jiang, Y.; Magubane, A.; Mguni, L.; Sikeyi, L.; Jiang, C.; Liu, X.; Yao, Y. Hollow carbon spheres as catalyst support for Fischer-Tropsch synthesis: Synthesis techniques, optimization strategies, and future research. Fuel Process. Technol. 2025, 276, 108285. [Google Scholar] [CrossRef]
  11. Jung, S.; Lee, J.; Moon, D.H.; Kim, K.-H.; Kwon, E.E. Upgrading biogas into syngas through dry reforming. Renew. Sustain. Energy Rev. 2021, 143, 110949. [Google Scholar] [CrossRef]
  12. Mishra, R.; Shu, C.-M.; Gollakota, A.R.K.; Pan, S.-Y. Unveiling the potential of pyrolysis-gasification for hydrogen-rich syngas production from biomass and plastic waste. Energy Convers. Manag. 2024, 321, 118997. [Google Scholar] [CrossRef]
  13. Palumbo, A.W.; Sorli, J.C.; Weimer, A.W. High temperature thermochemical processing of biomass and methane for high conversion and selectivity to H2-enriched syngas. Appl. Energy 2015, 157, 13–24. [Google Scholar] [CrossRef]
  14. Soomro, A.; Chen, S.; Ma, S.; Xu, C.; Sun, Z.; Xiang, W. Elucidation of syngas composition from catalytic steam gasification of lignin, cellulose, actual and simulated biomasses. Biomass Bioenergy 2018, 115, 210–222. [Google Scholar] [CrossRef]
  15. Gorensek, M.B.; Shukre, R.; Chen, C.-C. Development of a thermophysical properties model for flowsheet simulation of biomass pyrolysis processes. ACS Sustain. Chem. Eng. 2019, 7, 9017–9027. [Google Scholar] [CrossRef]
  16. Jung, H.S.; Kim, B.G.; Kwon, J.H.; Bae, J.W. Thermocatalytic technologies for syngas production from greenhouse gases and biomass-derived renewable oxygenates. Renew. Sustain. Energy Rev. 2025, 216, 115711. [Google Scholar] [CrossRef]
  17. Du, B.; Zhang, Z.; Grubner, S.; Yurkovich, J.T.; Palsson, B.O.; Zielinski, D.C. Temperature-dependent estimation of gibbs energies using an updated group-contribution method. Biophys. J. 2018, 114, 2691–2702. [Google Scholar] [CrossRef]
  18. Moreno, J.; Cobo, M.; Buendia, F.; Sánchez, N. Enhancing predictive models for steam gasification: A comparative study of stoichiometric, equilibrium, data-driven, and hybrid approaches. Renew. Sustain. Energy Rev. 2025, 210, 115151. [Google Scholar] [CrossRef]
  19. Kaydouh, M.-N.; El Hassan, N. Thermodynamic simulation of the co-gasification of biomass and plastic waste for hydrogen-rich syngas production. Results Eng. 2022, 16, 100771. [Google Scholar] [CrossRef]
  20. Plevan, M.; Geißler, T.; Abánades, A.; Mehravaran, K.; Rathnam, R.K.; Rubbia, C.; Salmieri, D.; Stoppel, L.; Stückrad, S.; Wetzel, T. Thermal cracking of methane in a liquid metal bubble column reactor: Experiments and kinetic analysis. Int. J. Hydrogen Energy 2015, 40, 8020–8033. [Google Scholar] [CrossRef]
  21. Zhang, J.; Li, X.; Chen, H.; Qi, M.; Zhang, G.; Hu, H.; Ma, X. Hydrogen production by catalytic methane decomposition: Carbon materials as catalysts or catalyst supports. Int. J. Hydrogen Energy 2017, 42, 19755–19775. [Google Scholar] [CrossRef]
  22. Ayodele, B.V.; Yazrul Bin Mohd Yassin, M.; Naim, R.; Abdullah, S. Hydrogen production by thermo-catalytic conversion of methane over lanthanum strontium cobalt ferrite (LSCF) and αAl2O3 supported Ni catalysts. J. Energy Inst. 2018, 92, 892–903. [Google Scholar] [CrossRef]
  23. Jyoti; Ashok, C.H.; Srilatha, K.; Patil, N.; Shilpa Chakra, C.H. Hydrogen production from methane decomposition using nano metal oxides. Mater. Today Proc. 2017, 4, 11679–11689. [Google Scholar] [CrossRef]
  24. Abánades, A.; Rathnam, R.K.; Geißler, T.; Heinzel, A.; Mehravaran, K.; Müller, G.; Plevan, M.; Rubbia, C.; Salmieri, D.; Stoppel, L.; et al. Development of methane decarbonisation based on liquid metal technology for CO2-free production of hydrogen. Int. J. Hydrogen. Energy 2016, 41, 8159–8167. [Google Scholar] [CrossRef]
  25. Srilatha, K.; Bhagawan, D.; Shiva Kumar, S.; Himabindu, V. Sustainable fuel production by thermocatalytic decomposition of methane—A review. S. Afr. J. Chem. Eng. 2017, 24, 156–167. [Google Scholar] [CrossRef]
  26. Ding, X.; Yan, L.; Guo, C.; Jia, D.; Guo, N.; Wang, L. Synergistic effects between lignin, cellulose and coal in the co-pyrolysis process of coal and cotton stalk. Molecules 2023, 28, 5708. [Google Scholar] [CrossRef] [PubMed]
  27. Yu, H.; Wu, Z.; Chen, G. Catalytic gasification characteristics of cellulose, hemicellulose and lignin. Renew. Energy 2018, 121, 559–567. [Google Scholar] [CrossRef]
  28. Gogoi, M.; Konwar, K.; Bhuyan, N.; Borah, R.C.; Kalita, A.C.; Nath, H.P.; Saikia, N. Assessments of pyrolysis kinetics and mechanisms of biomass residues using thermogravimetry. Bioresour. Technol. Rep. 2018, 4, 40–49. [Google Scholar] [CrossRef]
  29. Zhao, J.; Xiuwen, W.; Hu, J.; Liu, Q.; Shen, D.; Xiao, R. Thermal degradation of softwood lignin and hardwood lignin by TG-FTIR and Py-GC/MS. Polym. Degrad. Stab. 2014, 108, 133–138. [Google Scholar] [CrossRef]
  30. Buentello-Montoya, D.A.; Duarte-Ruiz, C.A.; Maldonado-Escalante, J.F. Co-gasification of waste PET, PP and biomass for energy recovery: A thermodynamic model to assess the produced syngas quality. Energy 2023, 266, 126510. [Google Scholar] [CrossRef]
  31. Gao, Y.; Wang, M.; Raheem, A.; Wang, F.; Wei, J.; Xu, D.; Song, X.; Bao, W.; Huang, A.; Zhang, S.; et al. Syngas production from biomass gasification: Influences of feedstock properties, reactor type, and reaction parameters. ACS Omega 2023, 8, 31620–31631. [Google Scholar] [CrossRef]
  32. Ellison, C.; Abdelsayed, V.; Smith, M.; Shekhawat, D. Comparative evaluation of microwave and conventional gasification of different coal types: Experimental reaction studies. Fuel 2022, 321, 124055. [Google Scholar] [CrossRef]
  33. Verissimo, G.L.; Leiroz, A.J.K.; Cruz, M.E. Influence of the pyrolysis and heterogeneous char reactions modeling in the simulation of sugarcane bagasse gasification in a bubbling fluidized bed reactor. Fuel 2020, 281, 118750. [Google Scholar] [CrossRef]
  34. Zhang, S.; Wu, M.; Bie, X.; Qian, Z.; Li, Q.; Zhang, Y.; Zhou, H. Deciphering interactions between biomass components during CO2 gasification: Insights from thermogravimetric behavior, gas production, and char reactivity. Fuel 2024, 371, 131974. [Google Scholar] [CrossRef]
  35. Ren, J.; Cao, J.-P.; Yang, F.-L.; Liu, Y.-L.; Tang, W.; Zhao, X.-Y. Understandings of catalyst deactivation and regeneration during biomass tar reforming: A crucial review. ACS Sustain. Chem. Eng. 2021, 9, 17186–17206. [Google Scholar] [CrossRef]
  36. Reizer, E.; Viskolcz, B.; Fiser, B. Formation and growth mechanisms of polycyclic aromatic hydrocarbons: A mini-review. Chemosphere 2022, 291, 132793. [Google Scholar] [CrossRef] [PubMed]
  37. Liu, W.-J.; Jiang, H.; Yu, H.-Q. Development of biochar-based functional materials: Toward a sustainable platform carbon material. Chem. Rev. 2015, 115, 12251–12285. [Google Scholar] [CrossRef]
  38. Yin, Z.; Yang, J.; Feng, Y.; Ma, Z.; Wang, J.; Liu, Q. Thermodynamics analysis of a biomass co-gasification based combined cooling, heating and power system. Renew. Energy 2025, 248, 123195. [Google Scholar] [CrossRef]
  39. Abbas, H.F.; Wan Daud, W.M.A. Hydrogen production by methane decomposition: A review. Int. J. Hydrogen Energy 2010, 35, 1160–1190. [Google Scholar] [CrossRef]
  40. Ashik, U.P.M.; Wan Daud, W.M.A.; Hayashi, J.I. A review on methane transformation to hydrogen and nanocarbon: Relevance of catalyst characteristics and experimental parameters on yield. Renew. Sustain. Energy Rev. 2017, 76, 743–767. [Google Scholar] [CrossRef]
Disclaimer/Publisher’s Note: The statements, opinions and data contained in all publications are solely those of the individual author(s) and contributor(s) and not of MDPI and/or the editor(s). MDPI and/or the editor(s) disclaim responsibility for any injury to people or property resulting from any ideas, methods, instructions or products referred to in the content.

Article Metrics

Citations

Article Access Statistics

Article metric data becomes available approximately 24 hours after publication online.