Article

Determination of Odor Compounds in Lignocellulose-Based Panels Using DHS-GC/MS Combined with Odor Activity Value Analysis

Research Institute of Wood Industry, Chinese Academy of Forestry, Beijing 100091, China
*
Author to whom correspondence should be addressed.
Polymers 2025, 17(17), 2421; https://doi.org/10.3390/polym17172421
Submission received: 29 June 2025 / Revised: 30 August 2025 / Accepted: 3 September 2025 / Published: 6 September 2025
(This article belongs to the Special Issue Eco-Friendly Supramolecular Polymeric Materials, 2nd Edition)

Abstract

Wood, as the oldest natural polymer composite material on Earth, holds significant importance in the era of carbon neutrality and serves as an irreplaceable core material in the furniture and construction industries. As a primary raw material for furniture, wood-based lignocellulosic boards have drawn increasing consumer attention due to their odor characteristics. In order to achieve the determination of odor compounds in lignocellulose-based panels, this study established a method combining dynamic headspace sampling (DHS), gas chromatography–mass spectrometry (GC–MS), and odor activity value (OAV) analysis. To address the wide concentration range of odor compounds in lignocellulose-based panels, a three-level standard curve was established to meet the detection of odor substances in common lignocellulose-based panels. The favorable conditions for each factor were as follows: sheet-shaped samples, TENAX-TA adsorbent, 20 mL headspace vials, and a split ratio of 25:1. The method demonstrated good linearity within the range of 0.002–15 mg/m3, with recovery rates ranging from 94.74% to 103.44%. The method was applied to analyze commercially available particleboard, fiberboard, and plywood. A total of 33 odor components were detected. The results indicated that aldehyde contributed significantly to the odor of particleboard, acids were the main contributors to the odor of fiberboard, and terpenes dominated the odor of plywood. The established method is suitable for the qualitative and quantitative analysis of odor compounds in lignocellulose-based panels and provides reliable technical support for tracing, identifying, and controlling odors in these materials.

1. Introduction

Lignocellulose-based panels serve as primary raw materials in furniture, building materials, and other fields [1]. In recent years, with the enhancement of health awareness, consumers focus not only on harmful substances of lignocellulose-based panels such as formaldehyde, volatile organic compounds (VOCs), and heavy metals, but also on the increasingly prominent issue of odor [2]. At present, the comprehensive evaluation system and related standards for the odor of lignocellulose-based panels have been established [3], but there are still research gaps in the traceability analysis of their characteristic odor components. Identifying key odorants is essential to addressing odor problems in these materials. Researchers have used gas chromatography odor (GC-O) to detect odor components [4,5]. However, olfactory evaluation is inevitably influenced by subjective factors. Since odor perception depends on both concentration and odor threshold [6], in this paper, the main odor components were identified by calculating the odor activity value (OAV) [7], which has been widely used in multiple fields such as wine [8], tea [9], fruits [10], and flavorings [11].
Odors in lignocellulose-based panels mainly originate from volatile organic compounds. The traditional VOC collection method is based on an environmental chamber combined with thermal desorption gas chromatography/mass spectrometry (TD-GC/MS) [12]. This approach enables quantitative detection of VOCs in lignocellulose-based panels under controlled temperature, humidity, and air exchange rate. However, it is limited by high energy consumption and operational cost. Moreover, an air exchange rate of ≥0.5 h−1 may cause the escape of low-concentration compounds, increasing the risk of missing key components with high OAV. In contrast, in the dynamic headspace (DHS) method [13], an inert gas (e.g., nitrogen) is used to continuously purge the sample surface, thereby transferring and enriching the volatile odor compounds onto an adsorbent trap. This pretreatment offers high adsorption efficiency (>92%), excellent recovery of odor fingerprints, and full automation. It significantly reduces the loss of volatile odor components [14,15]. Therefore, this study developed a method based on TD-GC/MS for accurate qualitative and quantitative analysis combined with OAV screening to identify key odor compounds. The approach was applied to three major types of commercial lignocellulose-based panels (particleboard, fiberboard, and plywood) to analyze their characteristic odor components, which provides technical support for the identification of odor sources and production process optimization, thereby contributing to quality improvement in the industry.

2. Materials and Methods

2.1. Instruments and Reagents

The following instruments and reagents were used in this study: gas chromatography–mass spectrometry instrument (Agilent Corporation, Santa Clara, CA, USA, 8890-5977B), MPS-Robotic injector (Gestel, Germany), Tenax-TA tube (Gestel, Mülheim, Germany), electronic analytical balance (JJ500, 0.0001, Changshu Shuangjie G&G Measurement Plant, Changshou, China), widemouth bottle (Shanghai Bingyu Fluid Technology Co., Ltd., Shanghai, China), toluene (purity ≥ 99.8%), methanol (Shanghai Aladdin Company (Shanghai, China)).

2.2. Sample Preparation

The samples of lignocellulose-based panels were collected from the National Center of Inspection and Testing for Wood-based Panels and Wood-Bamboo Products. The main wood raw materials of the fiberboard used in the study of this article were mixed woods composed of hardwood (Cinnamomum camphora (L.) Presl, Populus sp., Pterocarya stenoptera C. DC, Rhaphiolepis sp., Prunus sp., Fagus sp., Ligustrum sp., Firmiana sp., Melia sp., Salix sp., Celtis sp., etc.) and a small amount of softwood (Pinus sp.).The main wood raw material of particleboard is a mixed wood composed of hardwood (Eucalyptus sp., Melia sp., Bombax sp., Machilus sp., Bischofia sp., Saurauia sp., Celtis sp., Aleurites sp., Ficus sp., Bridelia sp.) and a small amount of softwood (Cunninghamiae sp., Pinus sp., etc.). The wood raw material used in plywood was cypress wood. The particleboard, fiberboard, and plywood we tested only used urea formaldehyde resin throughout the entire production process; the resin content of particleboard and fiberboard was about 9% and 10%, respectively; and the glue spread of the plywood was 260 g/m2. The samples were sawn into three states: powder (40 mesh), sheet (8 mm × 5 mm × 1 mm), and block (8 mm × 5 mm × 25 mm).

2.3. Experimental Methods

2.3.1. Methods of Dynamic Headspace

The sample (1.5 g) was placed into a 20 mL headspace vial, which was then hermetically sealed. DHS conditions were as follows: incubation at 60 °C for 30 min with shaking at 500 rpm; a capture volume of 1 L at a flow rate of 80 mL/min; an adsorption temperature of 30 °C for the trap; and a dry purge step with a volume of 30 mL delivered at 30 mL/min, during which the adsorption trap was maintained at 30 °C. For thermal desorption (TD3.5+), the parameters included a heating rate of 200 °C/min to a final temperature of 260 °C, which was held for 5 min, while the transfer line was also maintained at 260 °C. The cold injection system (CIS) was programmed with an initial temperature of −50 °C, followed by a heating rate of 10 °C/s to a final temperature of 260 °C, which was held for 5 min.

2.3.2. Methods of GC-MS

Gas chromatographic separations were performed using a DM-TVOC quartz capillary chromatographic column (50 m × 0.32 mm × 1 μm). The injection port temperature was 250 °C. The gas flow rate was 1.53 mL/min. The temperature program was as follows: initial temperature 50 °C (held for 2 min), increased to 120 °C at 10 °C/min (held for 10 min), then to 160 °C at 5 °C/min (held for 10 min), followed by a ramp to 200 °C at 5 °C/min (held for 10 min), and finally to 250 °C at 5 °C/min (held for 5 min). For mass spectrometric detection, the interface temperature was maintained at 280 °C, the quadrupole at 150 °C, and the EI ion source at 230 °C. Electron impact ionization was performed at 70 eV, and mass spectra were acquired in the range of m/z 45–550.

2.3.3. Data Analysis

Compounds were identified by comparing the mass spectra of peaks (S/N ≥ 10) with the INST database. Those with a similarity index greater than 80 (on a scale of 100) were selected for odor analysis. For the qualitative analysis, the mass spectrum of each unknown compound was first matched with the database, and the compound with the highest similarity was initially assigned. In cases of isomers or ambiguous identifications, elution order was considered—where compounds with lower boiling points typically elute earlier—as reflected by retention times. Characteristic fragment ions were also compared against the literature or database references. If uncertainty remained, confirmation was performed using authentic standard substances. Quantification was carried out using the external standard method. Given the similar properties between odor compounds and general volatile organic compounds, we followed the Chinese National Standard GB/T 29899-2024 [12], employing a toluene-based calibration curve for calculation. The calibration range for toluene was 0.0004–2.4 mg/mL.

2.3.4. Analysis of Odor Substance Characteristics

Through systematic retrieval of cross-platform database resources such as PubMed, national and international standards, Flavornet, and Chemical Book, cross-validation and priority ranking of multi-source data of the target compound were conducted. The odor threshold and sensory characteristic description (olfactory profile) were integrated. The OAV of the substance was calculated according to Formula (1) [7]. Compounds with an OAV greater than 1 are generally considered to be key odorants.
O A V i = C i O T i
In the formula,
OAVi—odor activity value, dimensionless;
Ci—the mass concentration of a certain volatile organic compound, with the unit of mg/m3;
OTi—the olfactory threshold of this volatile organic compound, with the unit of mg/m3.

2.4. Standard Solution Preparation and Volatilization Simulation

2.4.1. Preparation of Mother Liquor

A toluene stock solution with a concentration of 3 mg/mL was prepared by dissolving 15 mg of toluene, weighed using an analytical balance with an accuracy of ±0.01 mg, in methanol within a 5 mL amber volumetric flask, which was then diluted to the mark.

2.4.2. Preparation of Standard Working Solution

The standard working solution was obtained by stepwise dilution with methanol: 2.4, 2, 1, 0.6, 0.4, 0.2, 0.1, 0.04, 0.03, 0.012, 0.004, and 0.0004 mg/mL.

2.4.3. Standardization of Filter Paper Load

Filter paper strips measuring 8 mm × 25 mm were used for the application of standard substances. All procedures were carried out in a climate-controlled chamber maintained at 25 ± 0.5 °C and 50 ± 2% relative humidity. A volume of 5 μL of the standard working solution was accurately delivered using a microsyringe and applied uniformly to the center of each filter paper strip. The prepared strip was immediately sealed in a headspace vial and allowed to equilibrate for 30 s before instrumental analysis. The calibration curve was plotted with the mass concentration of toluene as the abscissa and the peak area as the ordinate.

3. Results and Discussion

3.1. Optimization of Instrument Conditions

3.1.1. Optimization of Sample State

DHS technology enables the volatile and semi-volatile compounds in the sample to dynamically migrate into the headspace vial and be enriched in the adsorption tube through gradient temperature control and inert gas purging. The physical state of the sample will significantly affect the mass transfer efficiency. Therefore, in this paper, the sample states of powder, sheet, and block are discussed based on the size of the headspace vial and the sample dimensions.
As shown in Figure 1, the powder sample exhibited the fewest detection peaks. This result may be attributed to its high specific surface area, which accelerates the escape of volatile components and leads to substantial losses during sample preparation. In contrast, both sheet samples and block demonstrated excellent detection responses. The former achieved more efficient substance release during thermal desorption by virtue of an appropriate geometric shape, while the latter effectively blocked component volatilization through a dense structure. Quantitative analysis indicated that the number of chromatographic peaks of sheet and block samples remained similar (38 ± 2 vs. 35 ± 3), but the total peak area of sheet samples showed a significant difference compared with block samples ( 1.6 × 10 8   v s .   0.8 × 10 8 ), and its response intensity reached 1.9 times that of the latter. This phenomenon may be related to the unique surface volume ratio advantage of the sheet-like morphology. That is, under the same mass conditions, the sheet-like structure can not only maintain the integrity of the composition through planar extension, but also form gradient heat conduction through the unilateral heating mode, thereby achieving more complete compound release during the thermal desorption process. Based on the dual optimization of the retention efficiency and release efficacy of volatile components, the sheet form was selected as the optimal sample configuration for this study.

3.1.2. Optimization of Headspace Vial Volume

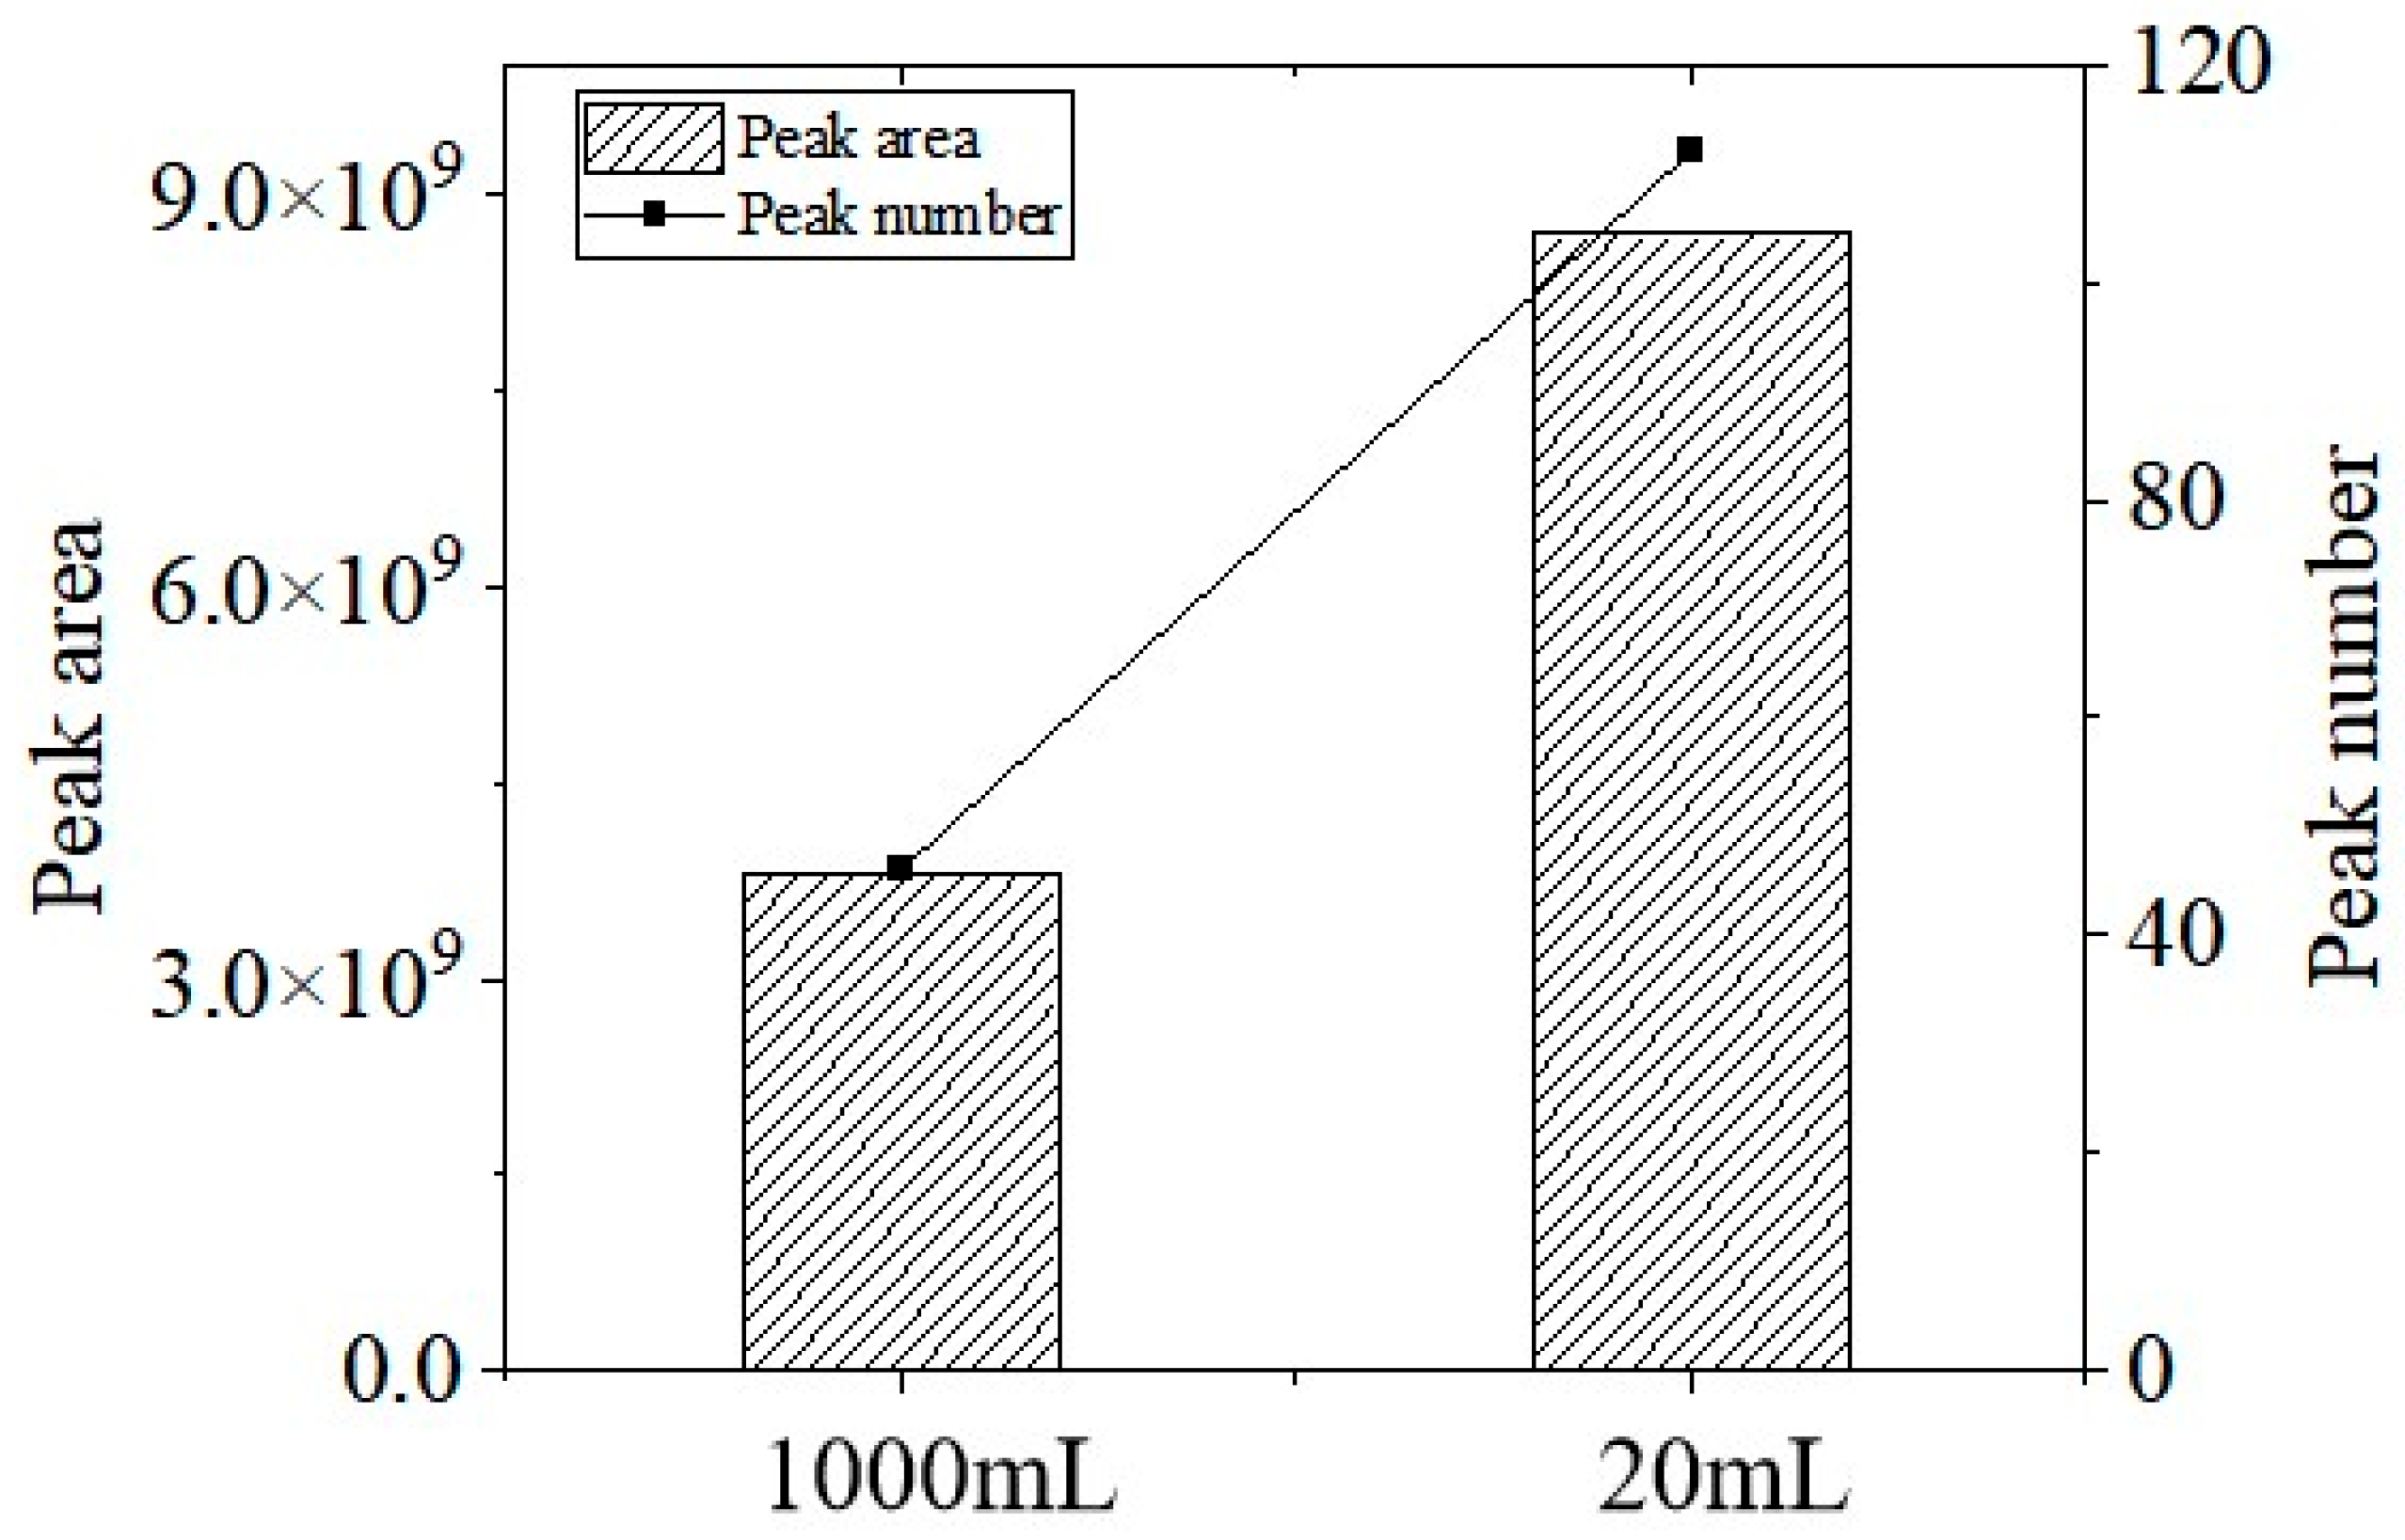
As shown in Figure 2, a comparative screening experiment was conducted using 1 L large-volume headspace vials and 20 mL small-volume headspace vials. The results demonstrate a marked improvement in performance with the smaller vials: the total chromatographic peak area increased approximately three-fold, while the number of detected peaks rose by roughly two-fold compared to the large-volume vials. This enhancement can be attributed to more efficient air circulation and displacement within the smaller vial volume when a consistent purge flow rate of 100 mL/min is used. The improved fluid dynamics promote more thorough gas–solid mass transfer of volatile compounds, leading to higher recovery rates and better detection sensitivity. Based on these findings, a 20 mL headspace vial was used for analysis in this study.

3.1.3. Selection of Packing for Adsorption Tubes

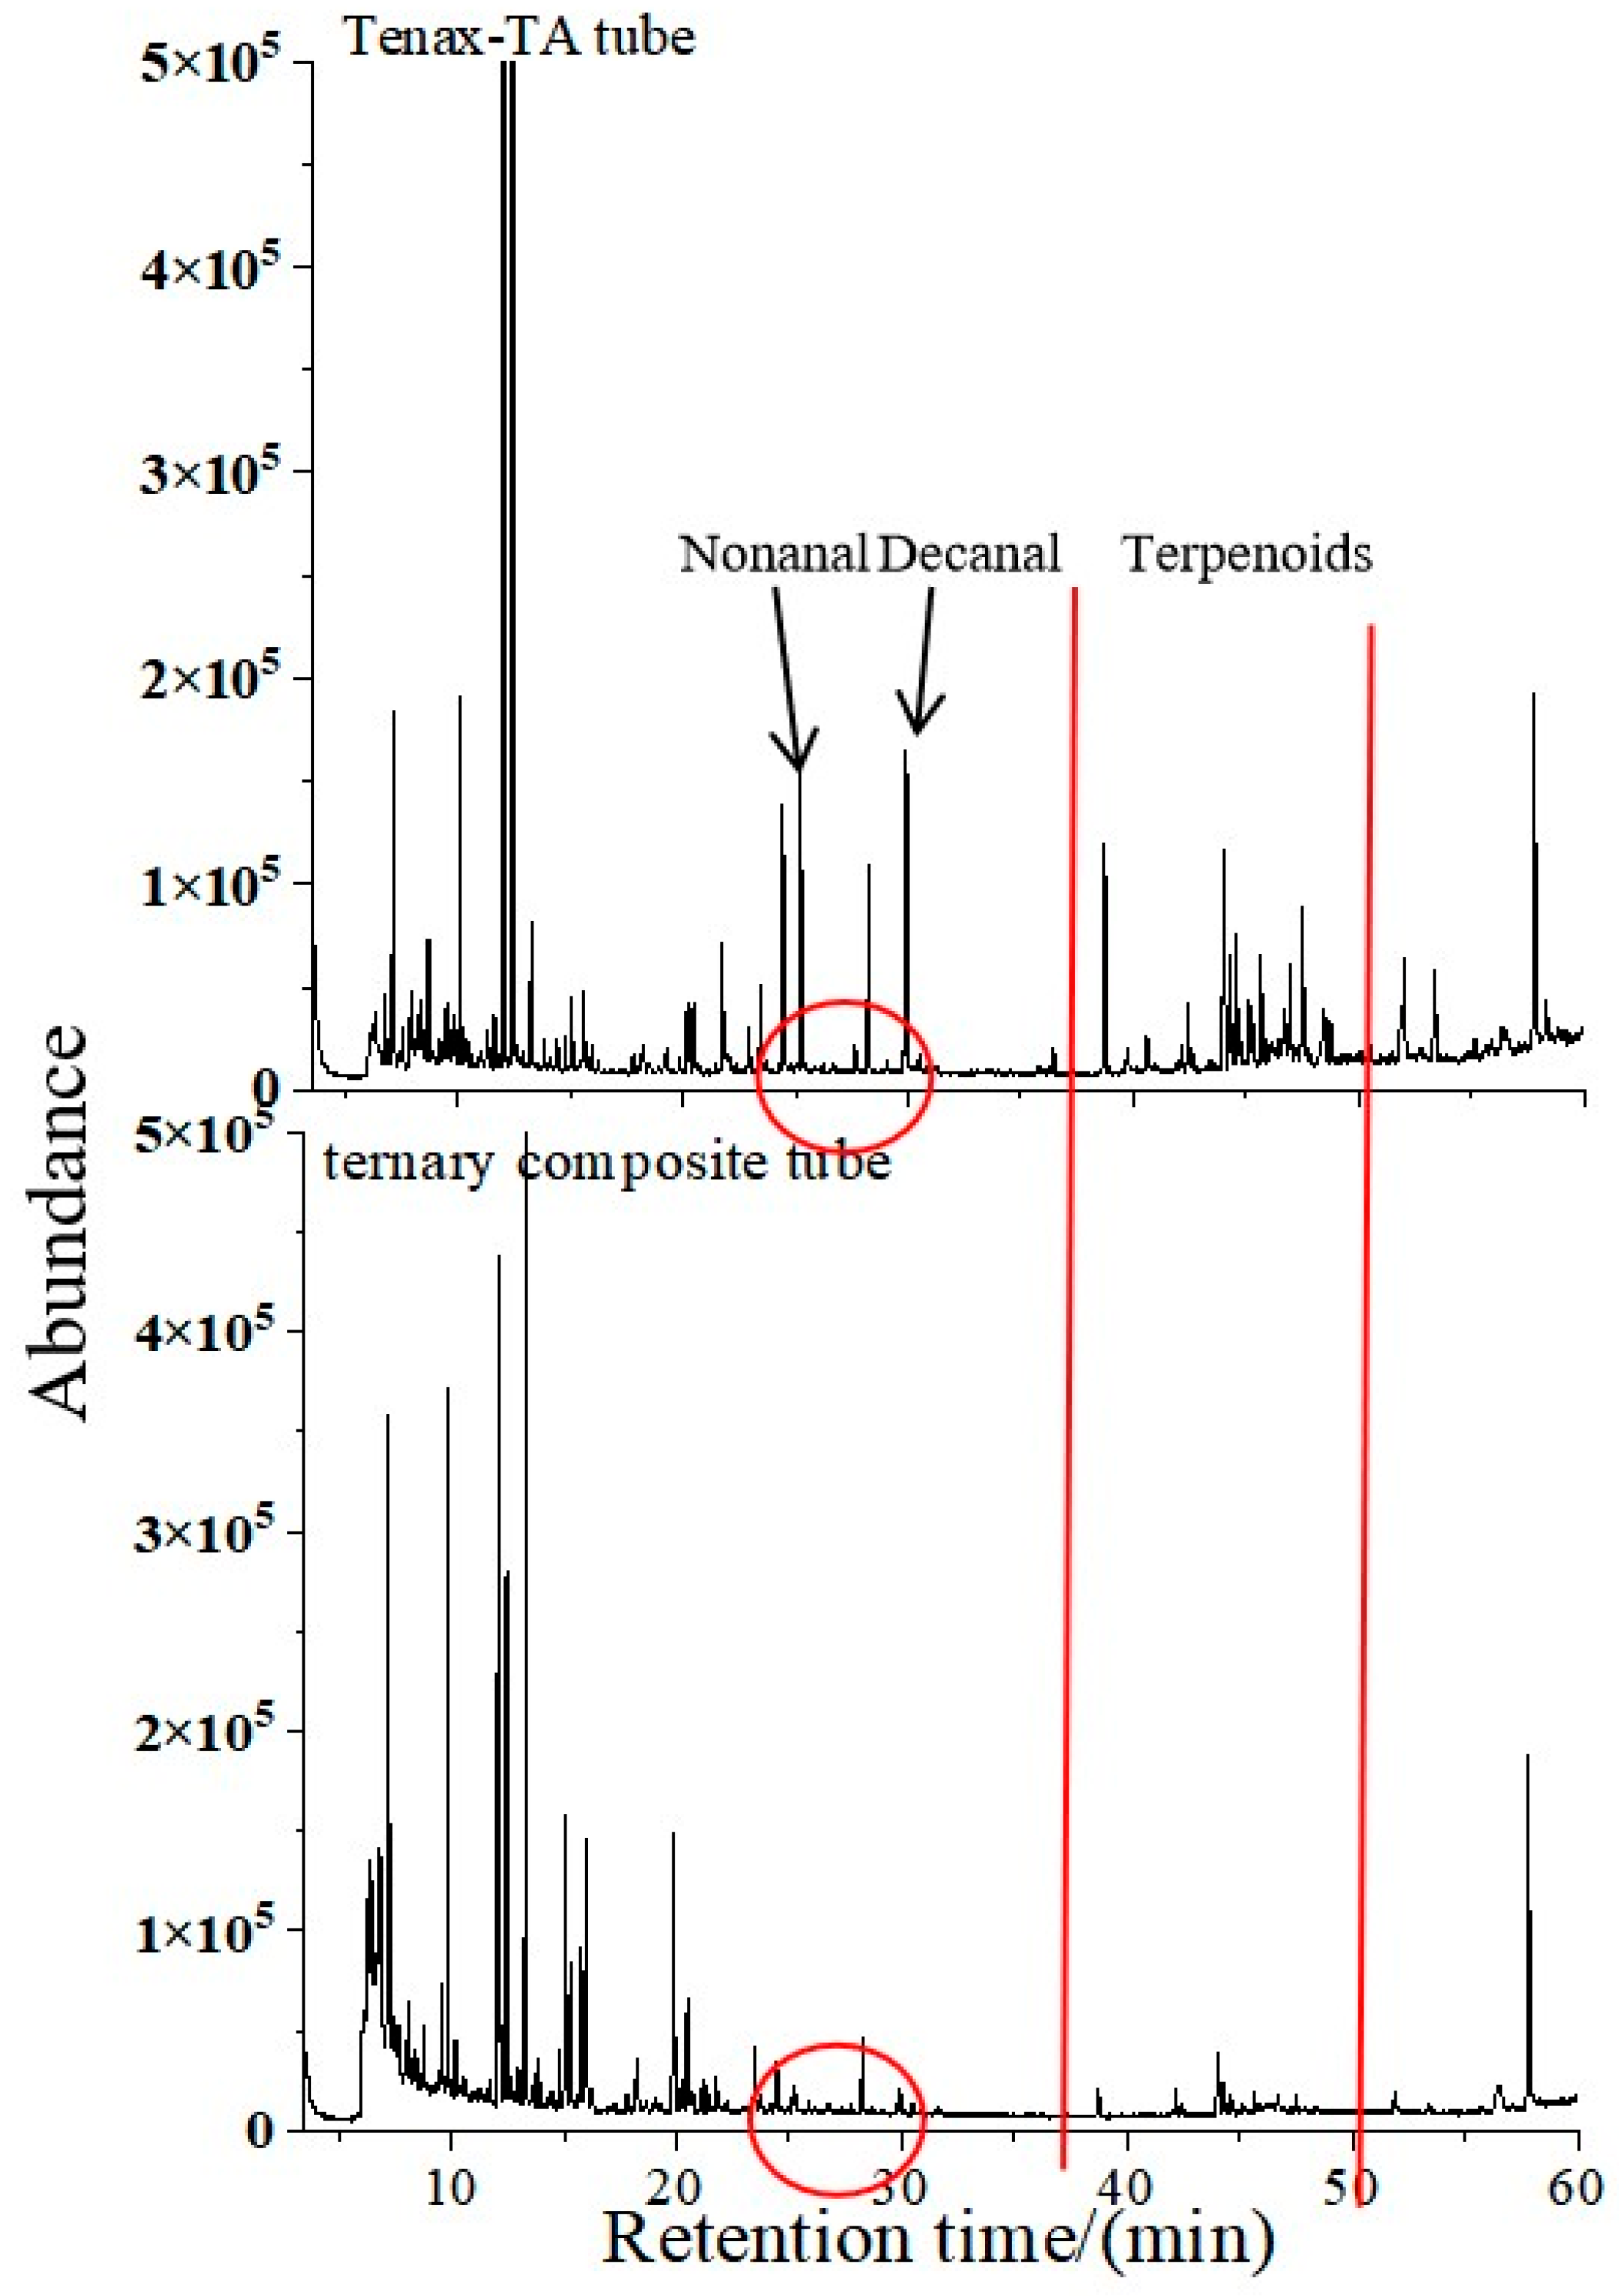
As shown in Figure 3, there was a significant difference in adsorption selectivity between the Tenax-TA single-packed tube and the ternary composite tube (Tenax-GR/microporous carbon/Carboxen1000). Overall, the Tenax-TA tube demonstrated superior adsorption performance compared to the composite tube. In the low-temperature desorption stage (retention time: 5–25 min), the adsorption capacity of the two adsorption tubes for VOCs was comparable. This might be attributed to the synergistic trapping effect formed by the microporous structure (pore size 0.8–1.2 nm) of the Carboxen1000 in the composite tube and the gradient pore size distribution (1–50 nm) of the medium and microporous carbon. However, the composite tube exhibited noticeably diminished performance during the high-temperature desorption stage. For instance, between 25 and 30 min, compounds such as nonanal and decanal were detected in the Tenax-TA tube but were absent in the composite tube. Furthermore, in the retention interval of 38–50 min, where terpenoids (e.g., α-pinene and β-pinene) were the major detected compounds, the adsorption efficiency of the composite tube decreased sharply, falling below the detection limit. Therefore, the Tenax-TA tube was selected as the primary adsorbent in this study. The combined tube can be used as a supplementary adsorption device for C5–C12 compounds, and the full-component analysis of VOCs can be achieved through the dual-tube combination strategy.

3.1.4. Optimization of the Temperature Rise Procedure of the Column Oven

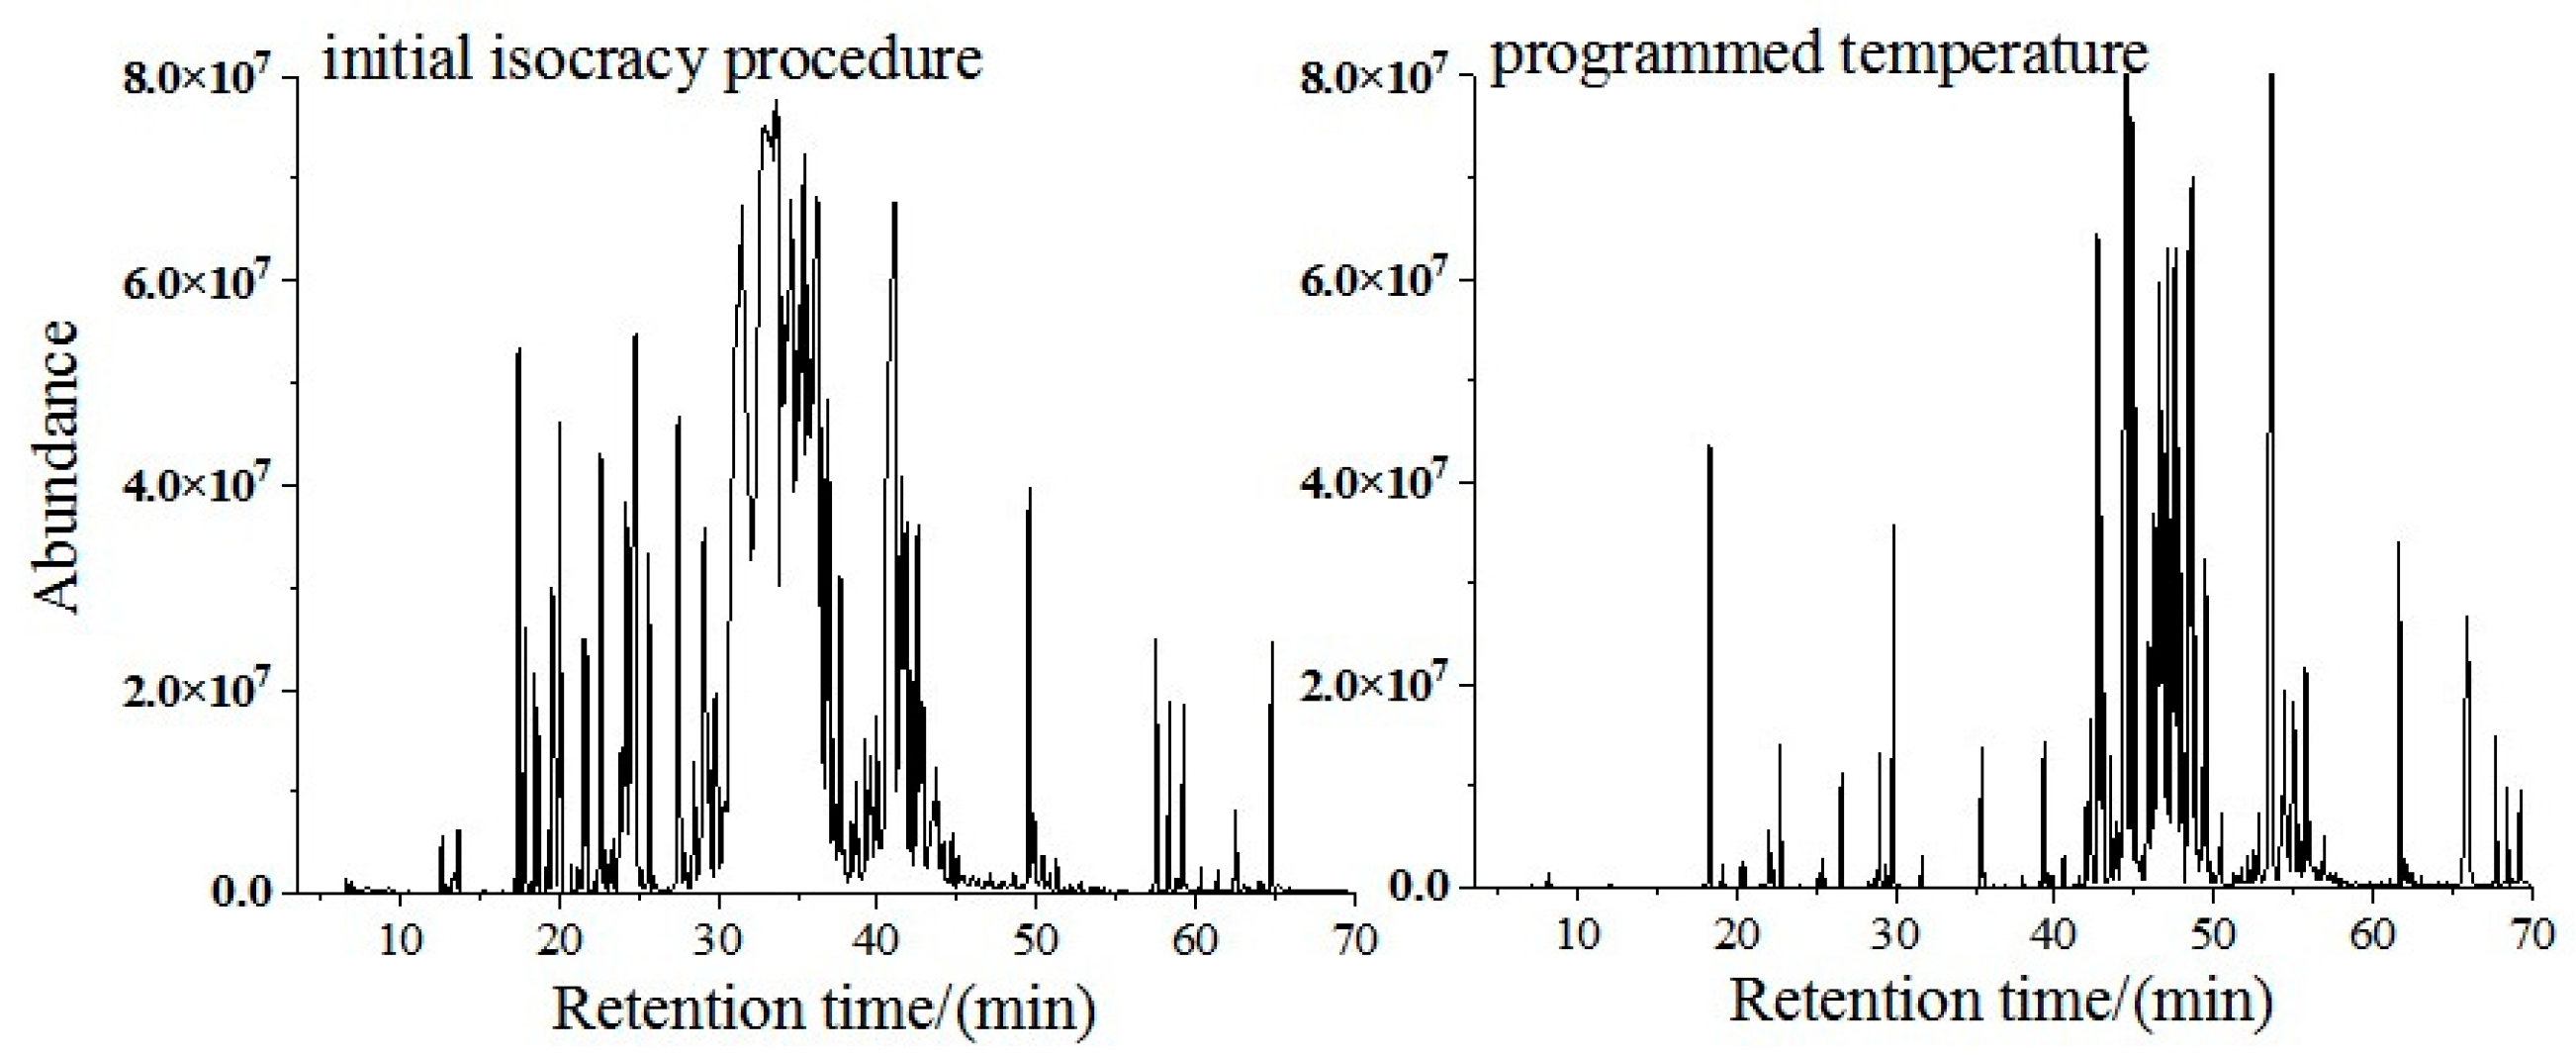
The optimization of the column oven temperature program is shown in Figure 4. The initial isocratic procedure (maintained at 50 °C for 5 min and increased from 10 °C/min to 250 °C) resulted in severe co-elution of C14–C16 volatile components during 30–45 min. Critical compounds such as longibrene, β-caryophyllene, cedar alcohol, and cedarene exhibited resolutions ≤0.75, which is significantly below the required minimum of 1.5 for adequate separation. A four-step temperature gradient was therefore optimized as follows: ① 50 °C (2 min) →② 10 °C/min to 120 °C (10 min) → ③ 5 °C/min to 160 °C (10 min) → ④ 5 °C/min to 200 °C (10 min) → ⑤ 5 °C/min to 250 °C (5 min). This optimized program markedly improved chromatographic performance: the total number of detected peaks increased from 72 ± 5 to 135 ± 8, and the signal-to-noise ratio of key compounds improved by a factor of 4.3.

3.1.5. Optimization of the Split Ratio

As demonstrated by the split ratio optimization experiment (Figure 5), a distinct nonlinear relationship was observed between injection volume adjustment and chromatographic outcomes. When the split ratio increased from splitless to 50:1, quantitative analysis (Figure 6) revealed that the split ratio of 25:1 achieved the optimal balance in multiple indicators. At this ratio, the total peak area reached the highest, increasing by approximately 1.1 times compared to the splitless. Further increasing the split ratio resulted in a sharp decline in both the total peak area and the number of detectable peaks. Moreover, the resolution of key compounds such as α-cedarene increased from 1.43 to 1.52 (R ≥ 1.5). This improvement can likely be attributed to the relatively high column loading capacity and favorable distribution coefficient achieved under the 25:1 split ratio.

3.2. Methodological Validation

3.2.1. Linear Range and Detection Limit

The construction results of the standard curves are shown in Figure 7. Curve 1 was obtained by a conventional continuous regression model, while curve 2 corresponds to a traditional polynomial model. As illustrated, both models exhibited unsatisfactory fitting performance, with correlation coefficients of R2 = 0.838 and R2 = 0.994, respectively, failing to meet experimental requirements.
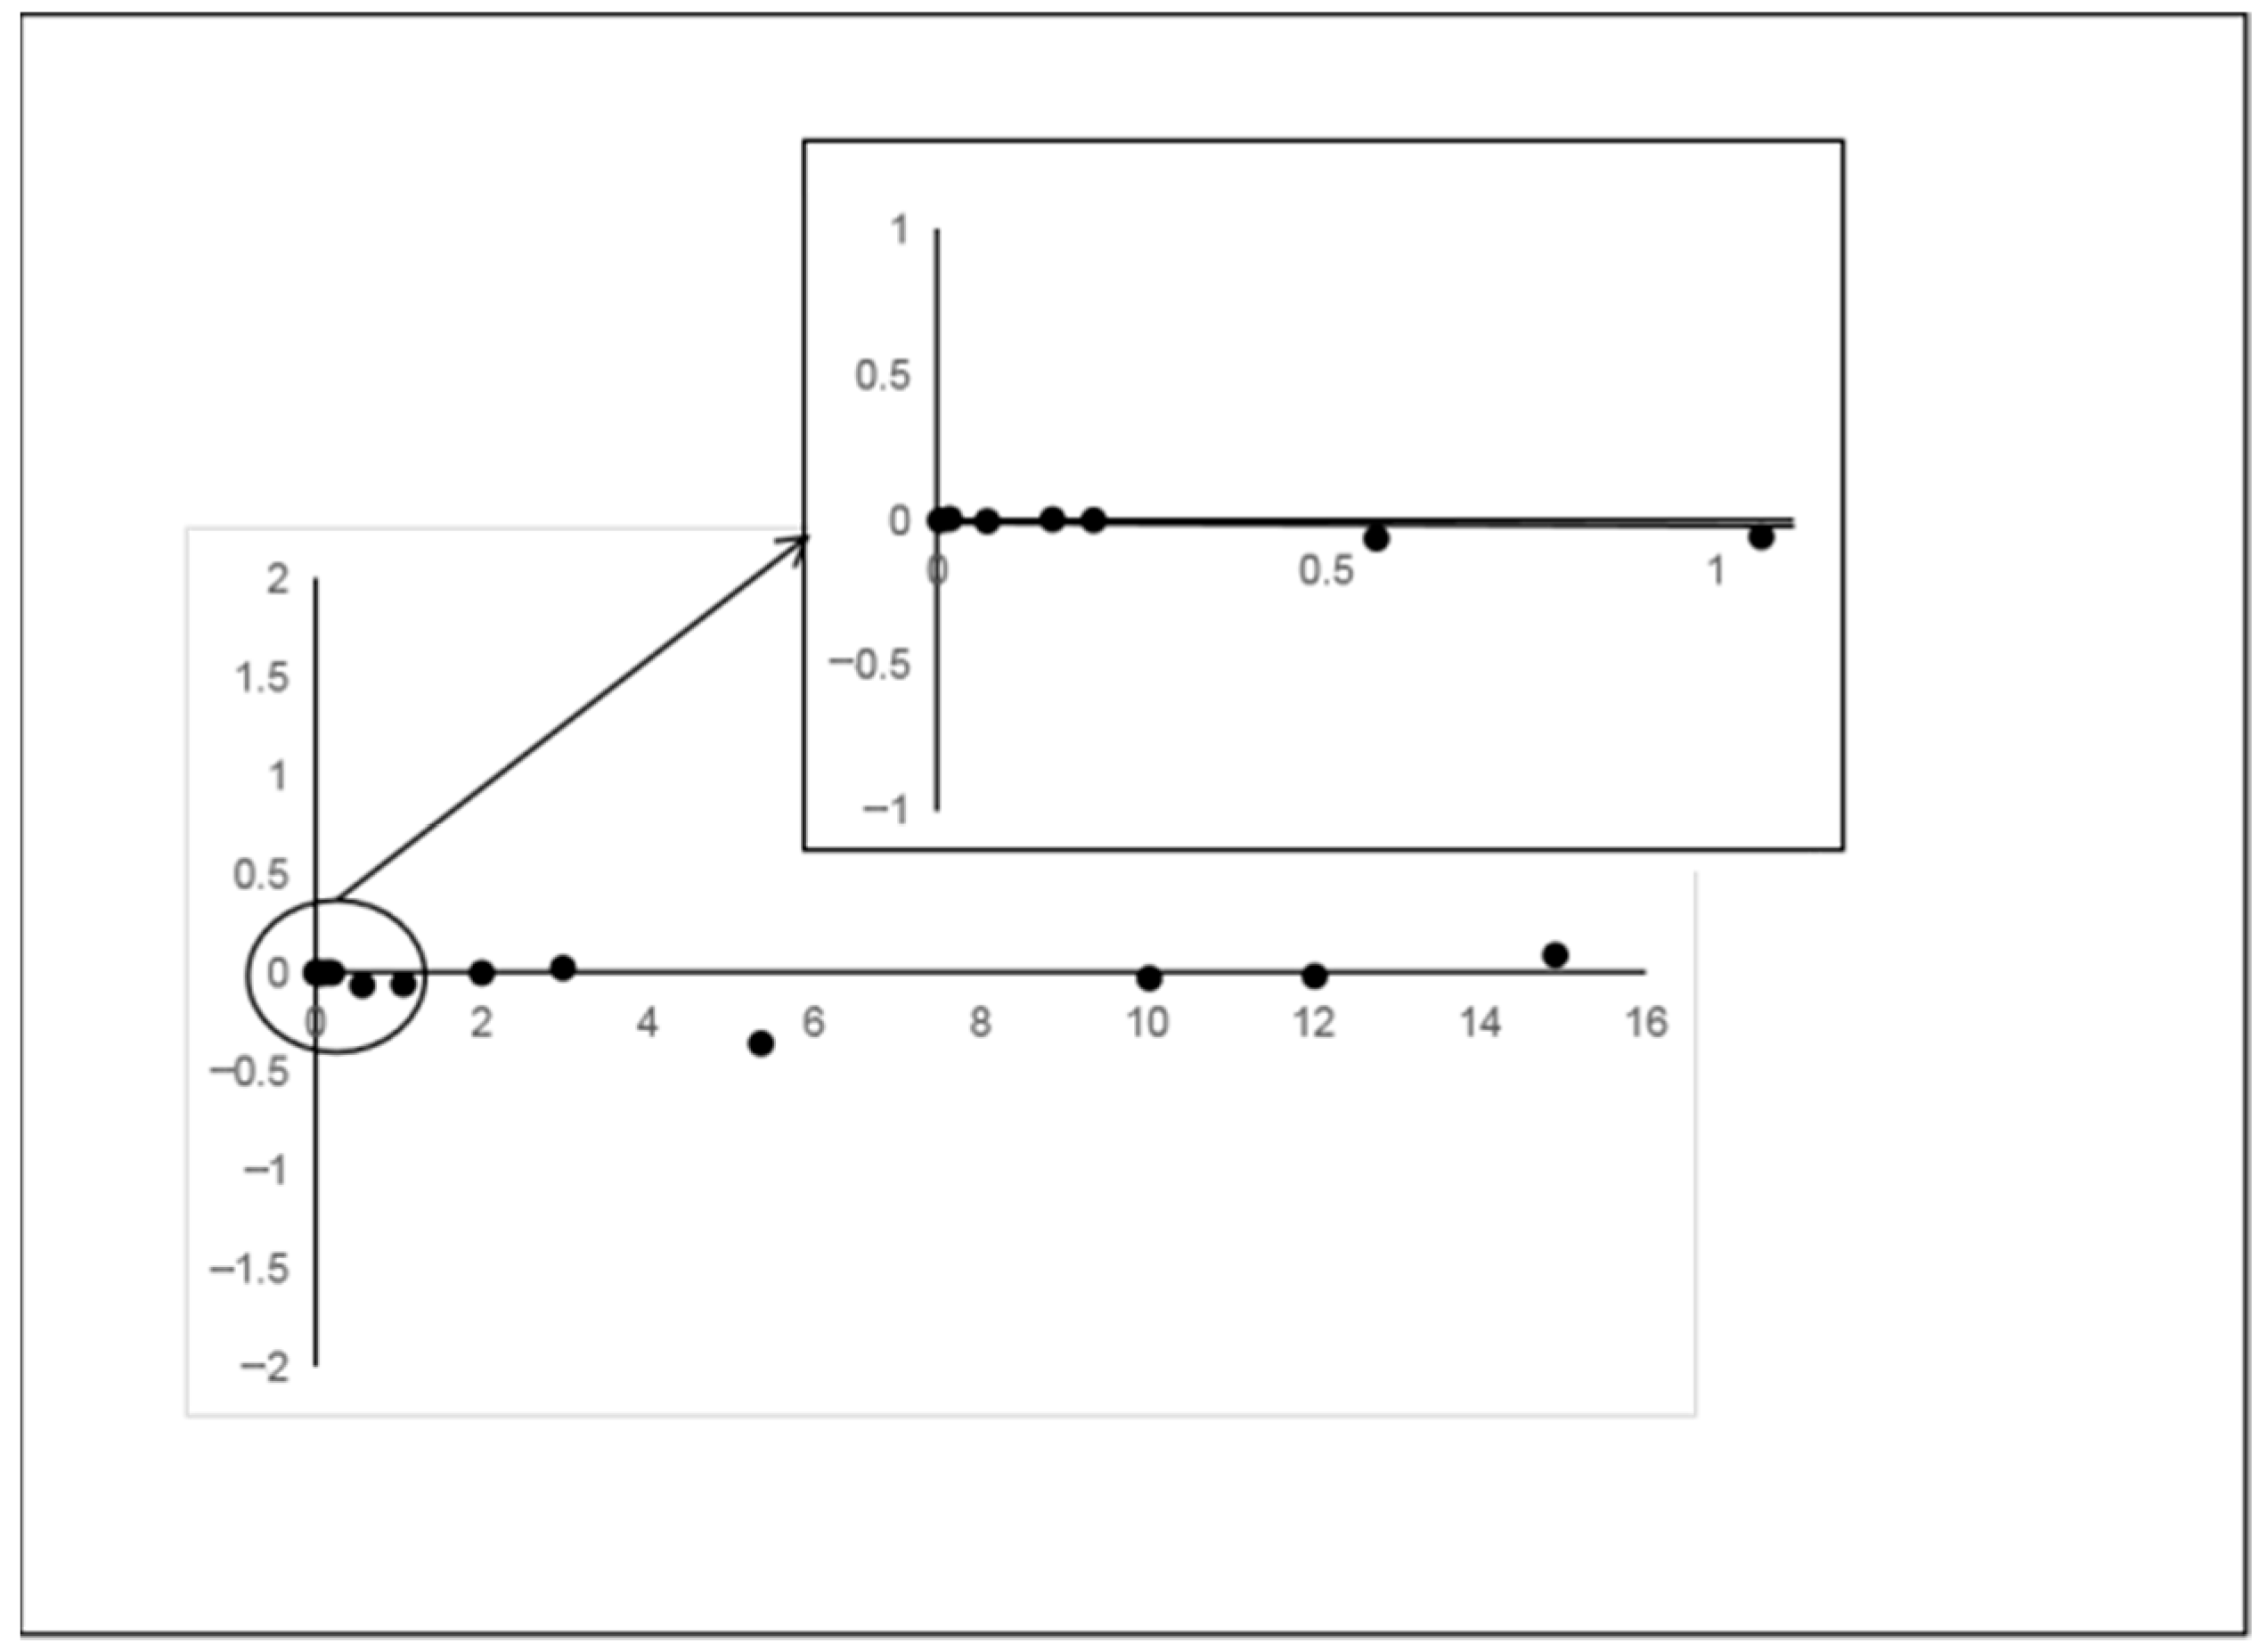
The underlying causes may be attributed primarily to two factors: First, the capillary permeation effect of the filter paper fibers leads to a certain deviation between the droplet diffusion area and the theoretical value. Second, temperature fluctuations cause uneven evaporation rates. For this purpose, a concentration-dependent piecewise linear regression model (Table 1) was introduced. The detection range was divided into three kinetic domains: low-concentration domain (0.002–0.2 mg/m3), medium-concentration range (0.2–3 mg/m3), and high-concentration domain (3–15 mg/m3). Residual analysis (Figure 8) showed that the residuals were randomly distributed up and down within ±0.3 around the X-axis, indicating a good fit [16].

3.2.2. Recovery Rate and Precision of Spiked Products

The results of the spiked recovery experiment carried out in the lignocellulose-based panel matrix (with a spiked amount of 2 mg/m3, n = 5) are shown in Table 1. Method validation demonstrated a recovery range of 94.74–103.44%, with a relative standard deviation of 3.2%, confirming that the optimized method exhibits good accuracy and precision.

3.3. Sample Determination

The odor compounds in three types of commercially available lignocellulose-based panels (particleboard, fiberboard, and plywood) were determined by dynamic headspace gas chromatography–mass spectrometry (DHS-GC/MS) combined with OAV analysis. The results are shown in Table 2. A total of 33 characteristic odor compounds were identified, mainly including aldehydes (11 kinds), acids (4 kinds), terpenoids (9 kinds), monoaromatic series (3 kinds), ketones (2 kinds), alcohol (1 kind), ester (1 kind), halohydrocarbon (1 kind), and ether (1 kind). Aldehydes were the most diverse group. Their odors were grassy and food source (such as peach, apple, and oils) odors, with the exception of isobutyraldehyde, which presented a pungent odor. Among acids, from acetic acid to butyric acid, the odor transitioned from sharp and irritating to mild as the carbon chain lengthened; benzoic acid even emitted a faintly fragrant scent. Terpenoids mainly had a woody or floral smell, while monoaromatic compounds contributed aromatic qualities. Alkanes and alcohols had the odor of chloroform or ether. Eerolidyl acetate had a fresh woody aroma. Acetone had a pungent and irritating smell, while 1-hydroxy-2-Propanone had a caramel odor.
A total of 15 odor compounds were identified in the particleboard. Key odor compounds included hexanal (OAV = 322.869), nonanal (OAV = 271.419), acetic acid (OAV = 125.786), 3-methyl-butyraldehyde (OAV = 92.122), heptaldehyde (OAV = 40.762), valeraldehyde (OAV = 20.954), isobutyraldehyde (OAV = 10.573), and benzaldehyde (OAV = 3.085). Aldehydes constituted the highest proportion at 60% (total OAV = 762.4) and were the primary contributors to the odor profile of particleboard. This result was consistent with the research results of Liu [2] and Tian [17]. The main reasons were as follows: First, both the wood chips and adhesives used in particleboard production release aldehydes [18]. Second, aldehyde compounds exhibit a relatively low odor threshold.
A total of nine odor compounds were identified in the fiberboard. Key odor compounds included butyric acid (OAV = 9.326), acetic acid (OAV = 8.069), heptanal (OAV = 3.867), and hexanal (OAV = 2.798). Acids accounted for approximately 50% of the total odor contribution (total OAV = 22.1), identifying them as the main odor sources in fiberboard. This was consistent with what Wang reported [19].
Thirteen odor compounds were identified in plywood, with terpenoids being the most dominant group, comprising 61.5% of the key odorants. Major terpenoids included α-bisabolol (OAV = 105.638), longifolene (OAV = 45.135), α-cedrene (OAV = 36.973), cedrol (OAV = 24.593), beta-acorenol (OAV = 3.497), cis-thujopsene (OAV = 2.573), and alpha-terpineol (OAV = 1.150). Other notable compounds were hexanal (OAV = 40.079), nonanal (OAV = 30.813), and 1-methoxy-2-propanol (OAV = 4.899). The total OAV reached 219.6. Terpenoids contributed the most to the overall odor of plywood. Meanwhile, both the diversity and concentration of terpenoids in plywood were markedly higher than those in particleboard (1 type) and fiberboard (0 types). Terpenoids mainly originate from wood itself. Therefore, the type of wood substrate is the core factor influencing the types and contents of terpenoids in lignocellulose-based panels. The volatile components of camphor wood and pine wood are generally greater than those of poplar and fast-growing eucalyptus [20]. Thus, the content of terpenoids in lignocellulose-based panels made of camphor wood and pine wood is relatively high. Furthermore, plywood is manufactured using rotary-cut or sliced veneers [21], which better preserve the natural anatomical structures of wood, such as resin canals, compared to shredded fibers or particles. This structural integrity helps retain more extractives, including terpenoids. Additionally, the presence of resin channels reduces the loss of these compounds during hot pressing, resulting in higher terpenoid retention in plywood.
Additionally, 2-methylbutyraldehyde has been reported as the material basis for the generation of “aroma” during malt roasting [22]. It is also a fragrance, insect repellent, and organic synthesis intermediate [23]. Currently, the odor threshold of furfural has only been documented in water, at 282 ug/L [24]. Although the threshold is relatively high, during the manufacturing process of lignocellulose-based panels, especially fiberboards, under high-temperature hot pressing, the hemicellulose or free sugars in the wood are hydrolyzed and converted into furfural [25]. Benzoic acid and 1, 3-dichloro-2-propanol may originate from adhesives, and widdrol and (-)-camphene may originate from wood. Therefore, the odor thresholds of these compounds in the air deserve further determination to obtain a more accurate odor evaluation.
Table 2. Concentration and odor activity values of odor compounds in lignocellulose-based panels.
CompoundsRetention Time (min)Characteristic Fragment Ions (m/z)OdorOdor Threshold
mg/m3
ParticleboardFiberboardPlywood
Concentration
mg/m3
OAVConcentration
mg/m3
OAVConcentration
mg/m3
OAV
Aldehydesisobutyraldehyde8.9572, 57, 73, 55A pungent odor *0.0010 *0.011 10.573 ----
methacrolein9.2170, 69, 71Wild hyacinth scent *0.0244 * 0.018 0.721 ----
isovaleraldehyde11.1258, 57, 71Ethereal, chocolate, and peach flavors *0.0004 *0.032 92.122 ----
2-methylbutyraldehyde11.3857, 58, 43, 86Moldy smell, fermented baking smell *-0.015 -----
pentanal12.0958, 57, 71, 86Grassy [26]0.0014 [27]0.029 20.954 ----
hexanal14.8456, 57, 72Stimulating grassy scent and apple aroma [26]0.0011 [26] 0.355322.869 0.003 2.798 0.044 40.079
furfural17.4496, 95, 67Sweet woody almond-flavored toasted bread mixed with aroma [24]---0.006 --
heptanal18.2670, 55, 57fruity aroma [26]0.0008 [26] 0.03340.762 0.003 3.867 --
benzaldehyde20.9777, 106, 105Bitter almond flavor [26]0.0260 [26] 0.080 3.085 ----
nonanal30.3857, 56, 55, 70Strong oily and sweet orange aroma [26]0.0020 [26] 0.543271.419 --0.062 30.813
Acidsacetic acid5.9345, 60Strong, pungent, vinegar-like odor *0.0147 * 1.854 125.786 0.119 8.069 --
propanoic acid10.2474, 45, 73The taste of spicy acidic cheese vinegar *0.0173 *--0.015 0.880 --
butanoic acid15.6060, 73, 45Yogurt and cheese flavor *0.0007*--0.006 9.326 --
benzoic acid31.29105, 122, 77Light fragrance *---0.003 --
Terpenoidsalpha-terpineol29.8559, 93, 122, 136Lilac aroma [26]0.3855 [26]----0.443 1.150
longifolene44.08161, 94, 91, 107Wood fragrance and iris-like aroma [26]0.0024 [26]----0.108 45.135
α-cedrene44.31119, 93, 105Sweet and gentle cypress characteristic aroma [27]0.0113 [26]----0.418 36.973
cis-thujopsene45.02119, 123, 105, 121A faint woody fragrance [26]0.0630 [26] ----0.162 2.573
widdrol53.12151, 95, 69Odorous [28]-----0.474 -
cedrol53.4495, 150, 151Weak wood fragrance with some ointment fragrance [26]0.5126 [26]----12.607 24.593
β-acorenol54.62119, 121, 161Woody [26]0.0144 [26]----0.050 3.497
α-bisabolol56.8769, 109, 119Woody [26]0.0013 [26]----0.137 105.638
(-)-camphene43.6193, 121, 79Fir terpene flavor *-0.053 -----
Monoaromatic seriesbenzene11.6078, 77, 519Aromatic odor [26]8.6130 [26] 0.010 0.001 ----
toluene14.3691, 92, 65Special fragrant aroma [26]1.2408 [26] 0.037 0.030 ----
p-xylene17.6991, 106, 105Stimulating aromatic scent [26]0.2517 [26] 0.026 0.103 ----
Alcohol1,3-dichloro-2-Propanol15.2179, 81, 49Ether odor *-----0.160
Esternerolidyl acetate45.7069, 93, 107Fresh, sweet, citrus and orchid wood fragrance * 0.058 -----
Ketones1-hydroxy-2-propanone7.8474, 45Caramel aroma *---0.007 ---
acetone7.1658, 59, 57Spicy and stimulating [18]99.76 [29]----0.447 0.005
Halohydrocarbon1,2-dichloro-ethane7.6862, 64, 49, 63Chloroform-like odor---0.004
Ether1-methoxy-2-propanol9.8745, 47, 75Sweet ether-like odor *0.012 [25]----0.060 5.000
Note: * indicates that the data is sourced from the Chemical Book website. - indicates that no result was found or the result cannot be calculated.

4. Conclusions

An optimized analytical method was established for odor substances in lignocellulose-based panels characterized by dynamic headspace extraction, gas chromatography–tandem mass spectrometry analysis, and odor activity value (OAV) characterization. The method demonstrated a wide linear range of 0.002–15 mg/m3, a detection limit of 0.0005 mg/m3, spiked recovery rates between 94.74 and 103.44%, and an RSD value of 3.2%. These results indicate high sensitivity, good reproducibility, and a broad linear response, confirming the reliability of the method for detecting characteristic odor compounds in commercial particleboard, fiberboard, and plywood.
A total of 33 compounds were identified, including aldehydes, acids, terpenoids, monoaromatic series, ketones, alcohol, ester, halohydrocarbon, and ether. Among them, aldehydes were found to be the major odor contributors in particleboard, acids in fiberboard, and terpenoids in plywood. The method established in this study enables accurate quantification of odor compounds in lignocellulose-based panels and facilitates the identification of key odorants, providing technical support for the odor traceability and treatment of lignocellulose-based panels.

Author Contributions

L.T. and B.L. contributed to the conception and design of the study; Q.C., L.Z., and X.L. performed the experiment; X.Z. and Y.F. performed data analyses; and L.T. and B.L. wrote the manuscript. All authors have read and agreed to the published version of the manuscript.

Funding

This research was funded by the Fundamental Research Funds of the Chinese Academy of Forestry (Grant No. CAFYBB2022ZC002) and the National Key Research and Development Program (Grant No. 2022YFD2200704).

Acknowledgments

The authors would like to express appreciation to the National Center of Inspection and Testing for Wood-based Panels and Wood-Bamboo Products for providing instruments and samples.

Conflicts of Interest

The authors declare no conflicts of interest.

References

  1. He, Z.K.; Zhang, Y.P.; Wei, W.J. Formaldehyde and VOC emissions at different manufacturing stages of wood-based panels. Build. Environ. 2012, 47, 197–204. [Google Scholar] [CrossRef]
  2. Liu, Y.; Zhu, X.D.; Qin, X.; Wang, W.C.; Hu, Y.B.; Yuan, D.L. Identification and characterization of odorous volatile organic compounds emitted from wood-based panels. Environ. Monit. Assess. 2020, 192, 348. [Google Scholar] [CrossRef]
  3. GB/T 44689-2024; Classification and Evaluation Methods for Odour from Wood-Based Panels and Their Products. Standards Press of China: Beijing, China, 2024.
  4. Schreiner, L.; Bauer, P.; Buettner, A. Resolving the smell of wood—Identification of odour-active compounds in Scots pine (Pinus sylvestris L.). Sci. Rep. 2018, 8, 8294. [Google Scholar] [CrossRef]
  5. Wang, Q.F.; Shen, J.; Shen, X.W.; Du, J.H. Volatile Organic Compounds and Odor Emissions from Alkyd Resin Enamel-coated Particleboard. BioResources 2018, 13, 6837–6849. [Google Scholar] [CrossRef]
  6. Qian, M.C.; Wang, Y.Y. Seasonal Variation of Volatile Composition and Odor Activity Value of ‘Marion’(Rubus spp. hyb) and’Thornless Evergreen’(R. laciniatus L.) Blackberries. J. Food Sci. 2010, 70, C13–C20. [Google Scholar] [CrossRef]
  7. Vilanova, M.; Campo, E.; Escudero, A.; Grana, M.; Masa, A.; Cacho, J. Volatile composition and sensory properties of Vitis vinifera red cultivars from north west Spain: Correlation between sensory and instrumental analysis. Anal. Chim. Acta 2012, 720, 104–111. [Google Scholar] [CrossRef] [PubMed]
  8. Jiang, B.; Xi, Z.M.; Luo, M.J.; Zhang, Z.W. Comparison on aroma compounds in Cabernet Sauvignon and Merlot wines from four wine grape-growing regions in China. Food Res. Int. 2013, 51, 482–489. [Google Scholar] [CrossRef]
  9. Zhu, J.C.; Cao, X.Y.; Niu, Y.W.; Xiao, Z.B. Investigation of Lactone Chiral Enantiomers and Their Contribution to the Aroma of Longjing Tea by Odor Activity Value and S-Curve. J. Agric. Food Chem. 2023, 71, 6691–6698. [Google Scholar] [CrossRef]
  10. Rodríguez, A.; Peris, J.E.; Redondo, A.; Shimada, T.; Costell, E.; Carbonell, I.; Rojas, C.; Pena, L. Impact of d -limonene synthase up- or down-regulation on sweet orange fruit and juice odor perception. Food Chem. 2017, 217, 139–150. [Google Scholar] [CrossRef]
  11. Szudera-Kończal, K.; Myszka, K.; Kubiak, P.; Drabińska, N.; Majcher, M.A. The Combined Effect of Lactic Acid Bacteria and Galactomyces geotrichum Fermentation on the Aroma Composition of Sour Whey. Molecules 2023, 28, 4308. [Google Scholar] [CrossRef]
  12. GB/T 29899-2024; Determination of the Emission of Volatile Organic Compounds from Wood-Based Panels and Furnishing Products—Small Chamber Method. Standards Press of China: Beijing, China, 2024.
  13. Radovic, B.S.; Careri, M.; Mangia, A.; Musci, M.; Anklam, E. Contribution of dynamic headspace GC–MS analysis of aroma compounds to authenticity testing of honey. Food Chem. 2001, 72, 511–520. [Google Scholar] [CrossRef]
  14. Soria, A.C.; Garcia-sarrio, M.J.; Sanz, M.L. Volatile sampling by headspace techniques. TrAC Trends Anal. Chem. 2015, 71, 85–99. [Google Scholar] [CrossRef]
  15. Morales, M.T.; Aparicio, R.; Rios, J.J. Dynamic headspace gas chromatographic method for determining volatiles in virgin olive oil. J. Chromatogr. A 1994, 668, 455–462. [Google Scholar] [CrossRef]
  16. Na, J.J.; Liu, C.B.; Ran, J.G. Study on the preparation of chloride ion standard curve using segmented multiple regression method. Sichuan Chem. Ind. 2005, 8, 31–33+37. [Google Scholar]
  17. Tian, J. A study on Emission Characteristics and Odor Evaluation of Volatile Organic Compounds from Typical Wood-Based Panels in Customized Furniture. Master’s Thesis, South China University of Technology, Guangzhou, China, 2023. [Google Scholar]
  18. Shen, J. Research on VOCs Release from Particleboar; Science Press: Beijing, China, 2013; pp. 1–228. [Google Scholar]
  19. Wang, D.W. Control of Very Volatile Organic Compounds Emission from Decorative Medium Fiber Board and Research on Odor Analysis. Ph.D. Thesis, Northeast Forestry University, Harbin, China, 2023. [Google Scholar] [CrossRef]
  20. Qi, L.H.; Zou, X.W.; Lv, B.; Fu, Y.J.; Tang, L.N.; Chen, Q.; Liu, B.; Li, B.T. VOCs Composition and Odor Characteristics of Main Plantation Wood in China. Sci. Silvae Sin. 2023, 11, 103–117. [Google Scholar]
  21. Lv, S.Y.; Zhang, L.F.; Li, S.M.; Jiang, P.; Peng, L.M. Research Progress in Functional Plywood. China Wood-Based Panels 2021, 28, 1–6. [Google Scholar]
  22. Jiang, X.F.; Xie, H.; Lu, T.L.; Feng, F.; Chen, H.; Xv, J.G.; He, C.; Mao, C.Q. Study on material basis of odor changes in stir-frying process of Hordei Fructus Germinatus based on Heracles Neo ultra-fast gas phase electronic nose technology. Chin. Tradit. Herb. Drugs 2022, 1, 41–50. [Google Scholar]
  23. Shu, M.S.; Dan, M.; Ji, X.H.; Wang, Y.; Zhang, Q.; Zhou, F.Y.; Ding, D.; Hang, W. Detection of 2-methylpropanal,2-methyl butanal and 3-methyl butanal in workplace air by portable gas chromatography-mass spectrometry. China Occup. Med. 2019, 3, 367–370. [Google Scholar]
  24. Huang, C.L. Analysis of Aroma Characteristics of Dianhong Gongfu Tea Based on Molecular Sensory Science. Master’s Thesis, Yunnan Agricultural University, Kunming, China, 2024. [Google Scholar]
  25. Su, Q.; Lu, X.Y.; Shi, X.Q.; Nie, H.J.; Zhang, P.; Wang, Y.P. Research progress of glue-free fiberboard based on straw. Acta Mater. Compos. Sin. 2024, 4, 1750–1763. [Google Scholar] [CrossRef]
  26. LY/T 3413-2024; Determination of Odour Compounds in Wood-Based Panels and Finishing Products—Gas Chromatography-Mass Spectrometry-Olfactometry Method. Standards Press of China: Beijing, China, 2024.
  27. Kwon, H.J.; Hong, Y.K.; Park, C.; Choi, Y.H.; Yun, H.J.; Lee, E.W.; Kim, B.W. Widdrol induces cell cycle arrest, associated with MCM down-regulation, in human colon adenocarcinoma cells. Cancer Lett. 2010, 290, 96–103. [Google Scholar] [CrossRef] [PubMed]
  28. Zhang, P.Q.; Du, X.M.; Li, Q.; Yu, X.H. Comprehensive Evaluation on the Olfaction Quality of Trademark Paper Base on Volatile Organic Compounds. Pap. Pap. Mak. 2015, 34, 4. [Google Scholar] [CrossRef]
  29. Li, W.F.; Li, C.J.; Cao, Y.; Zhai, Z.X.; Yan, F.Y.; Shang, X.B. Odor Pollution Conditions and Typical Gaseous Pollutants in Urban Ambient Air in Tianjin City. Res. Environ. Sci. 2014, 27, 8. [Google Scholar] [CrossRef]
Figure 1. The peak area and number of peaks of powder, sheet, and block samples.
Polymers 17 02421 g001
Figure 2. Total ion flow diagram affected by headspace bottle volume.
Polymers 17 02421 g002
Figure 3. Comparison of total ion flow diagrams between two adsorption tubes.
Polymers 17 02421 g003
Figure 4. Total ion flow diagram compared by temperature-programmed method.
Polymers 17 02421 g004
Figure 5. Total ion flow diagram influenced by shunt ratio.
Polymers 17 02421 g005
Figure 6. Relationship diagram of shunt ratio, peak area, and peak number.
Polymers 17 02421 g006
Figure 7. Fitting of toluene standard curves (1 is the curve fit by a traditional continuous regression model, 2 is the curve fit by a traditional polynomial model, 3 is the piecewise linear regression model).
Polymers 17 02421 g007
Figure 8. Residual plot of segmented calibration curve.
Polymers 17 02421 g008
Table 1. Recovery rate of labeled plywood samples.
No.Original (mg/m3)Added (mg/m3)Detected (mg/m3)Recovery (%)RSD (%)
10.432.00 2.32 94.7 3.2
20.442.00 2.50 103.2
30.452.00 2.51 103.0
40.432.00 2.50 103.4
50.432.00 2.46 101.6
Disclaimer/Publisher’s Note: The statements, opinions and data contained in all publications are solely those of the individual author(s) and contributor(s) and not of MDPI and/or the editor(s). MDPI and/or the editor(s) disclaim responsibility for any injury to people or property resulting from any ideas, methods, instructions or products referred to in the content.