
Nonlinear Response of a Polycarbonate in Post-Yield Cyclic Tests


Abstract
1. Introduction
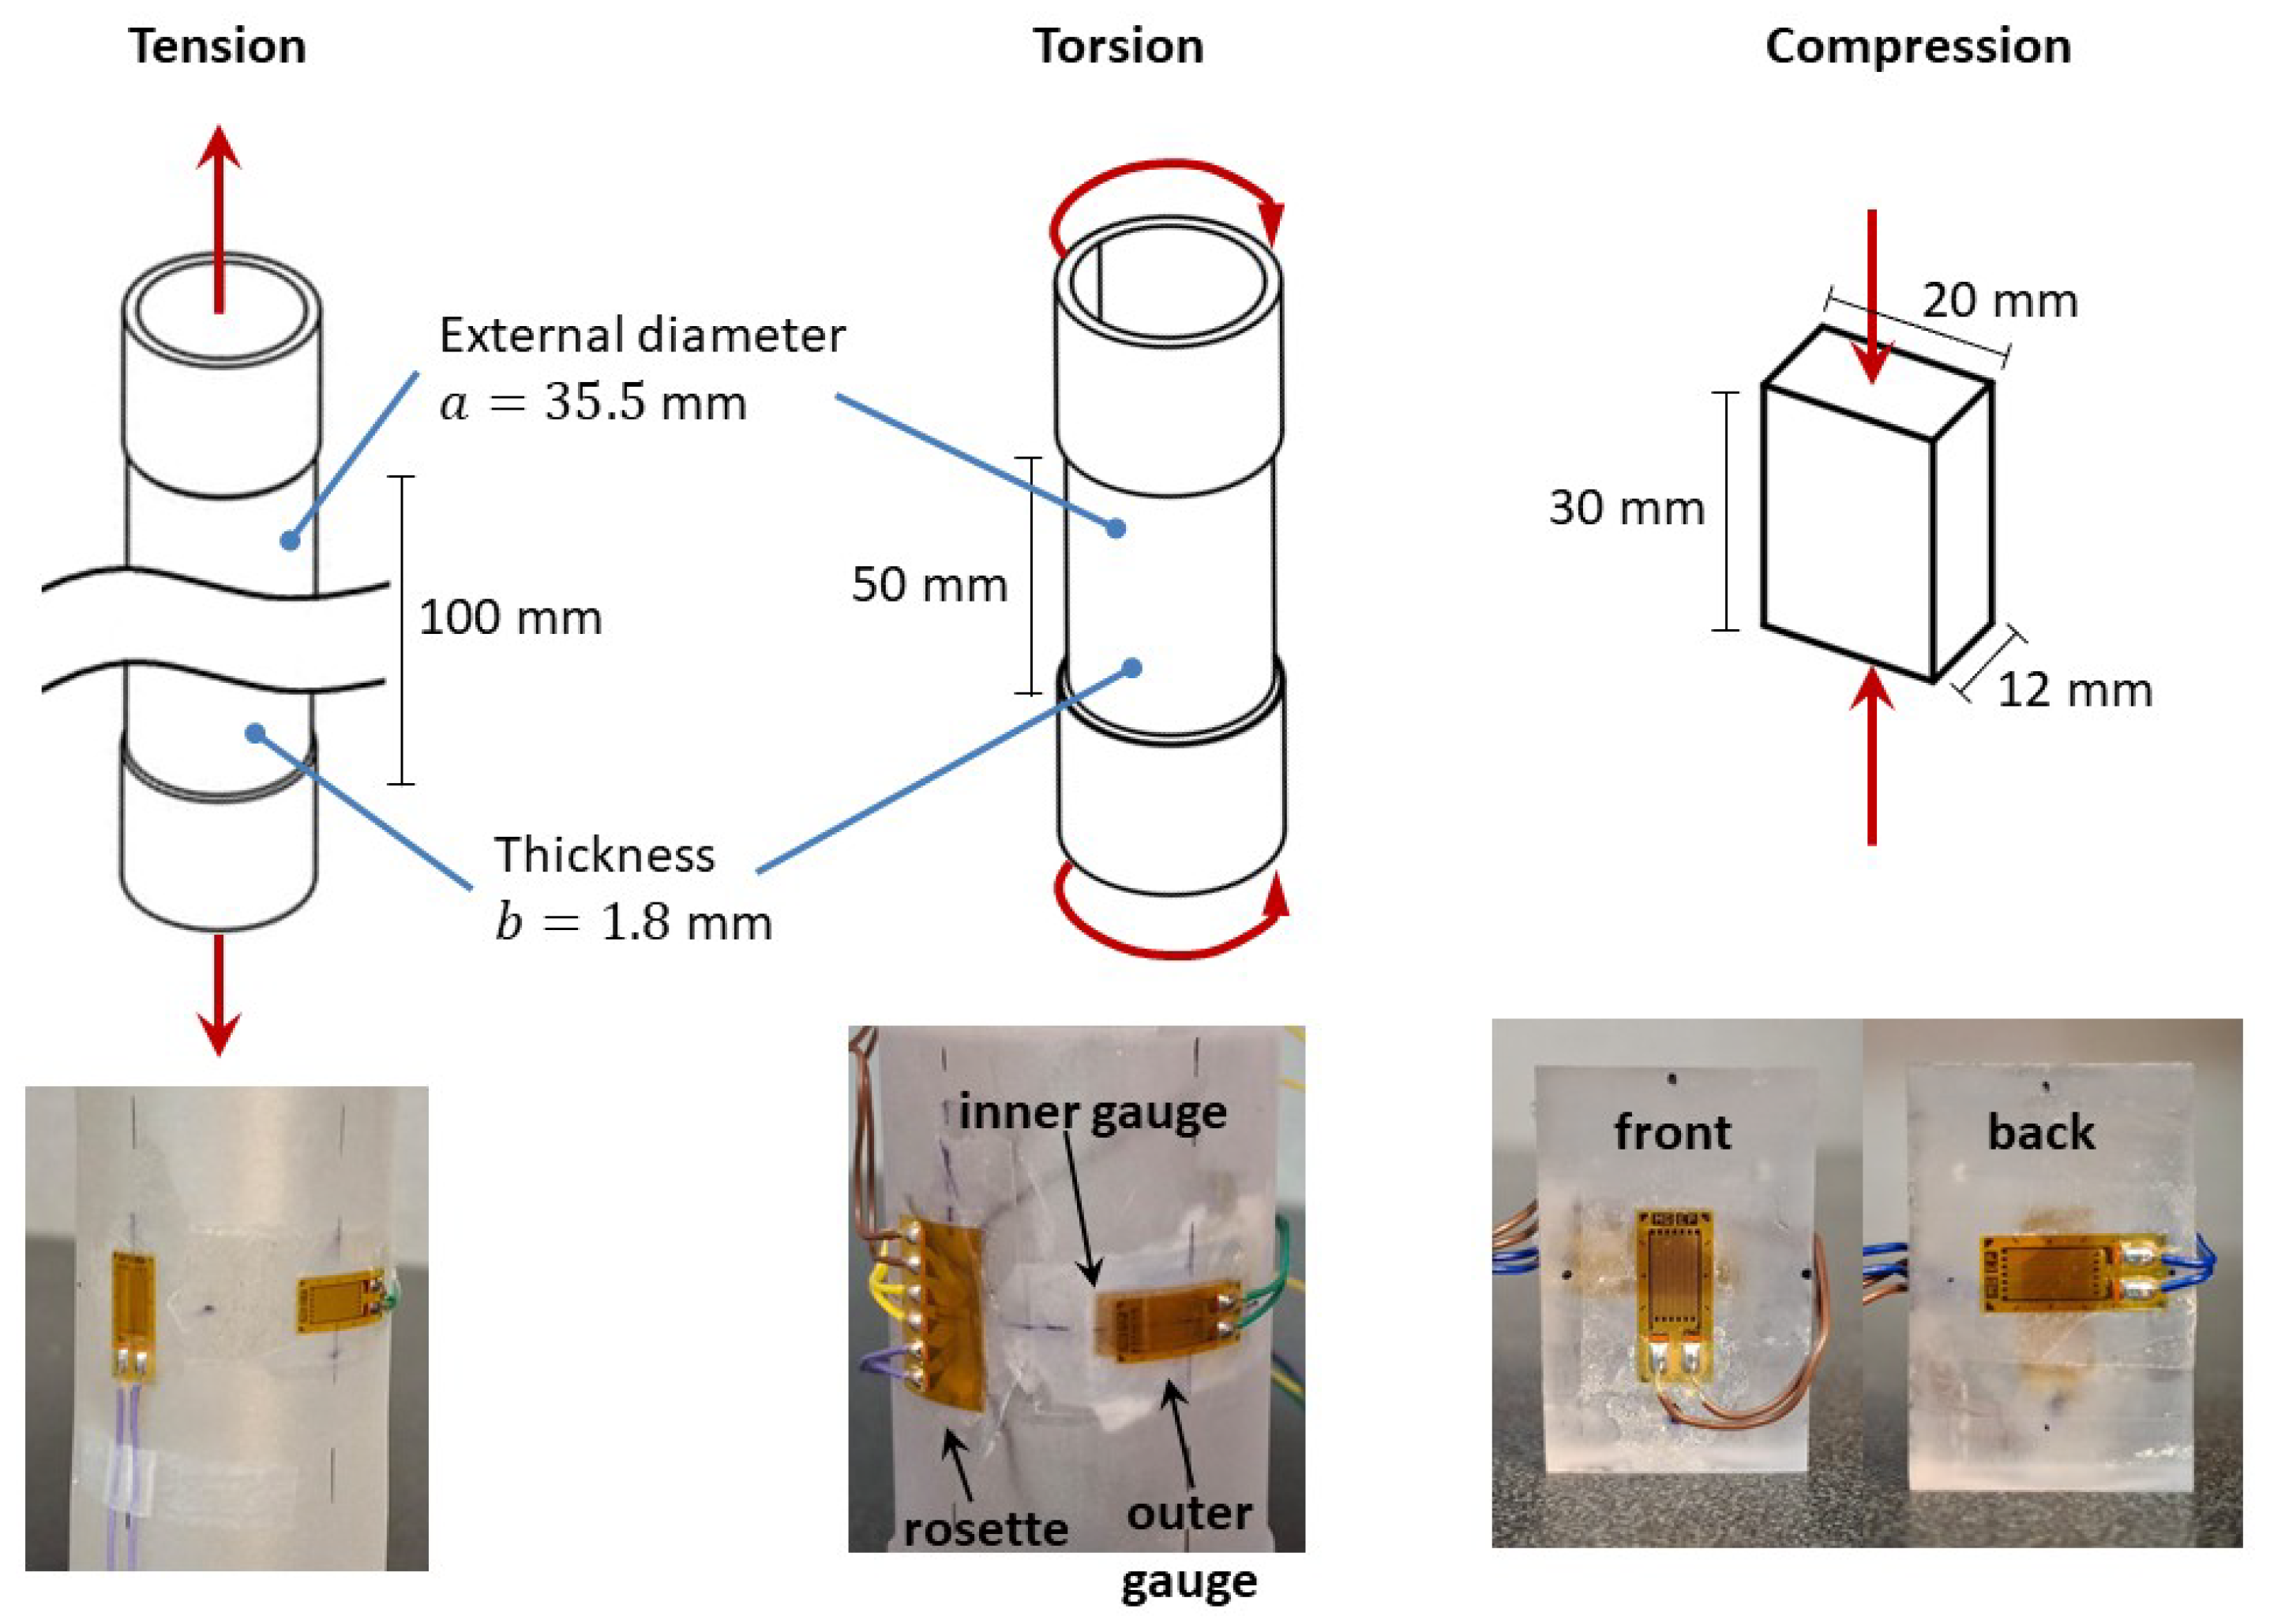
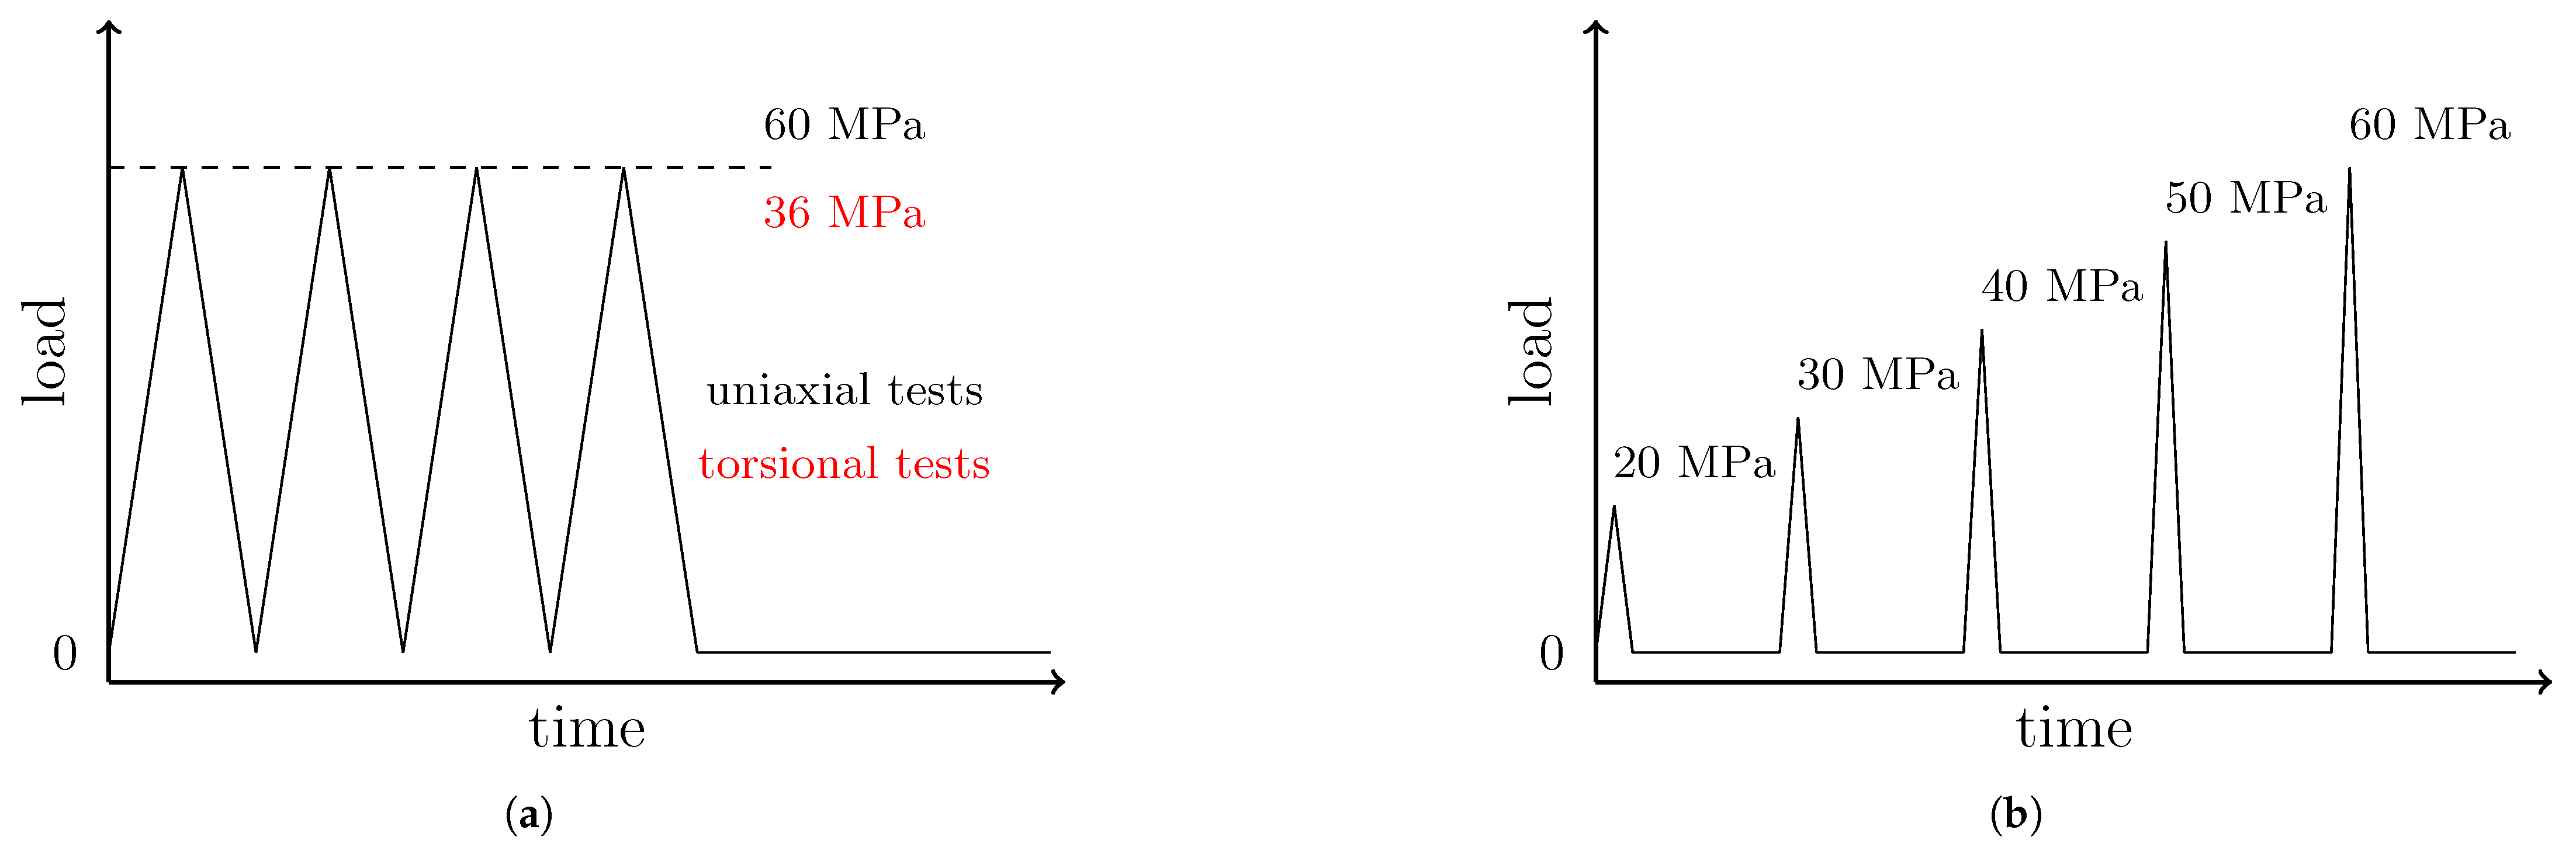
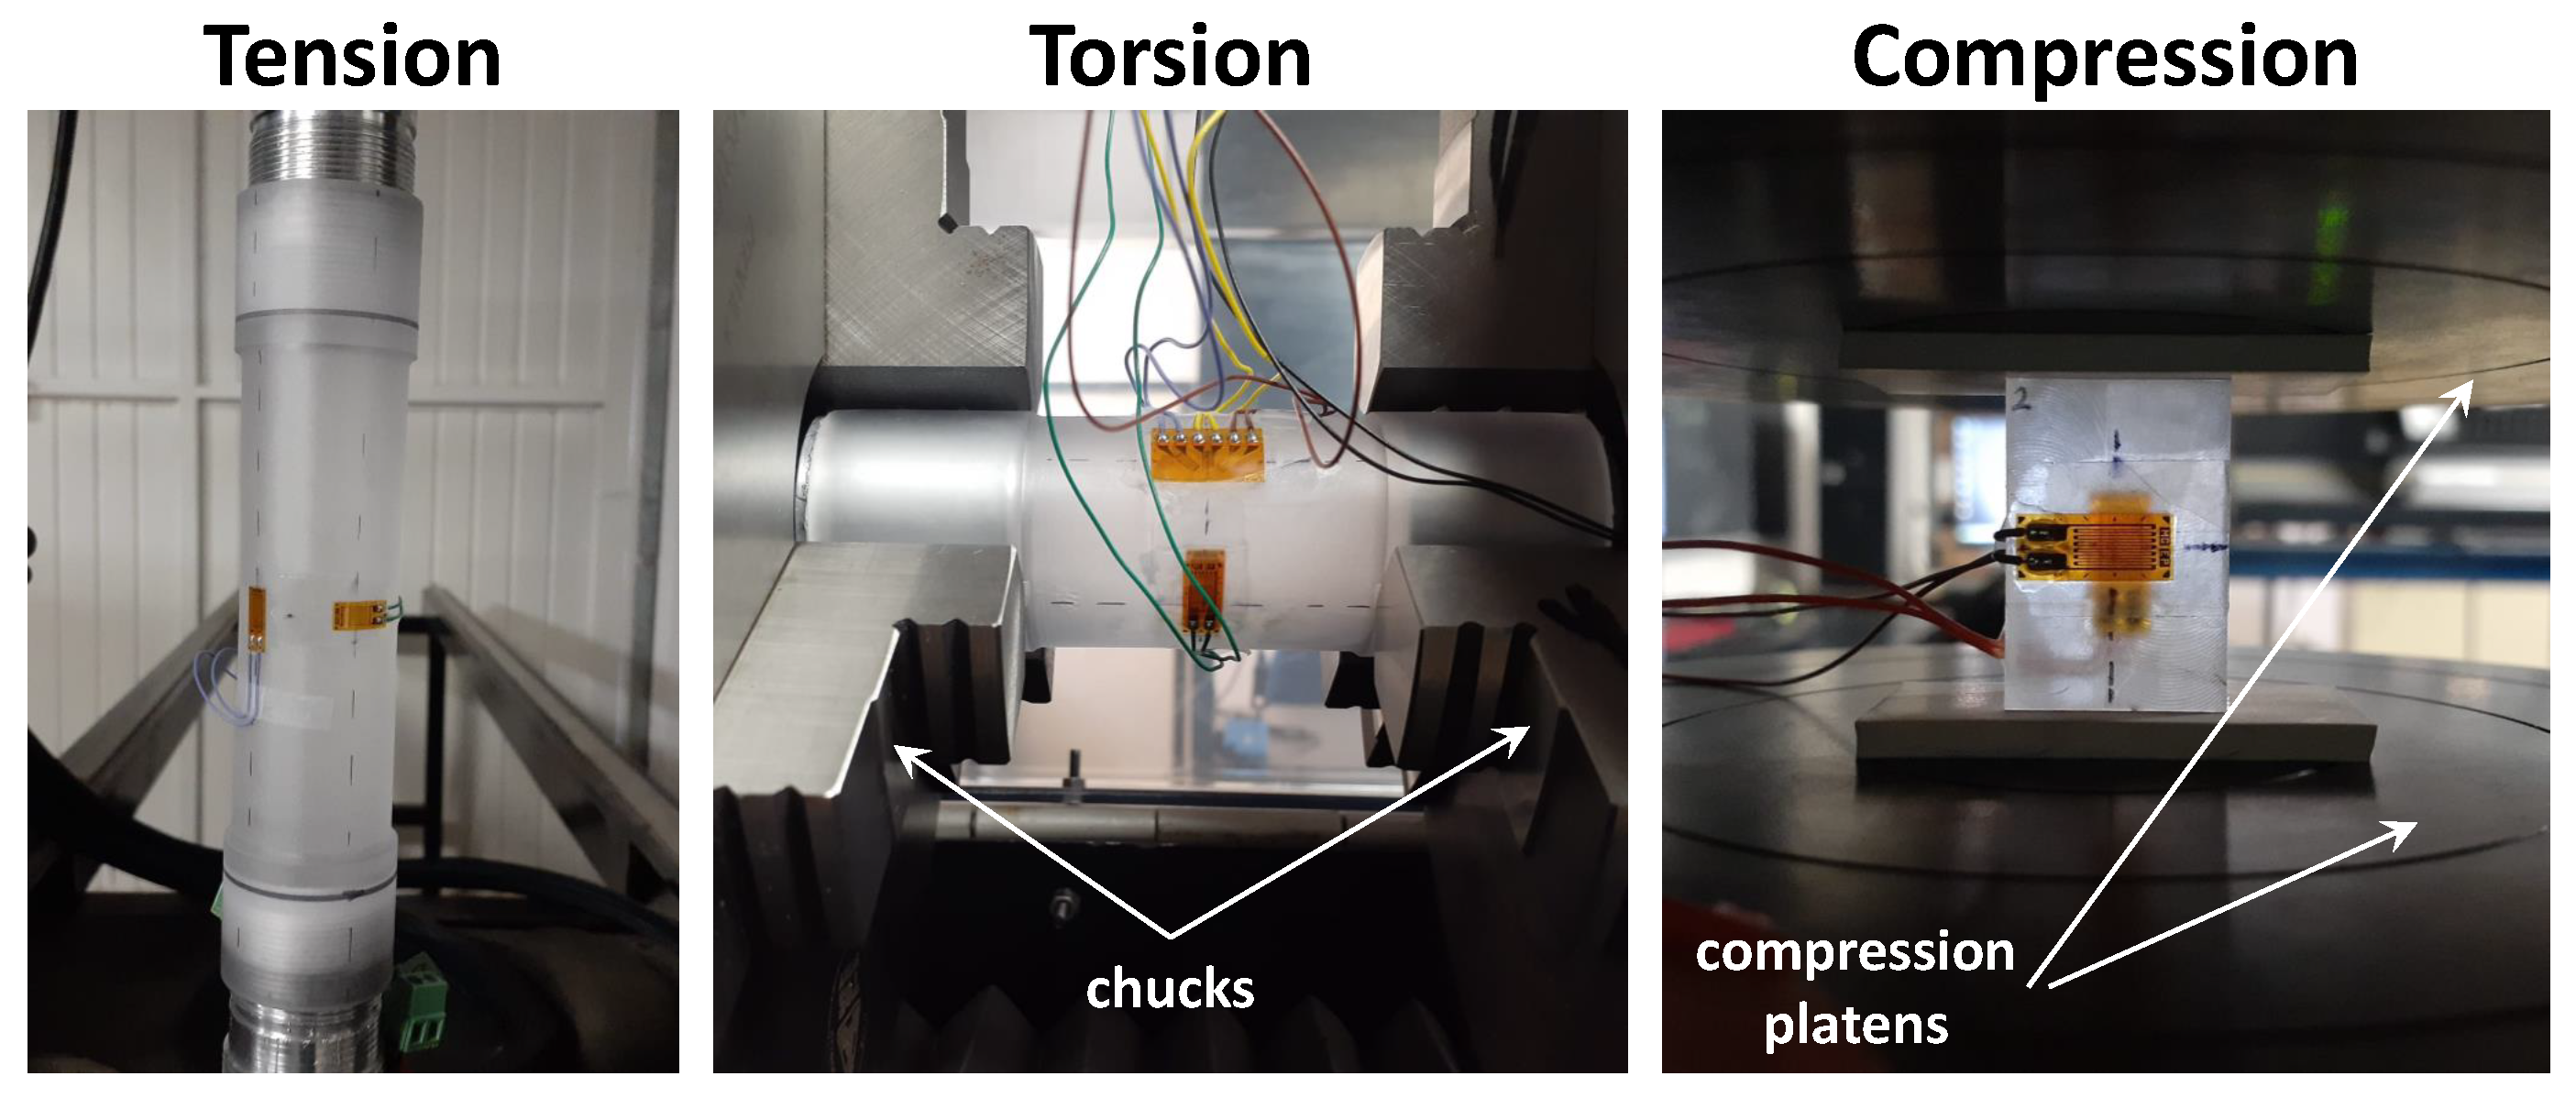
2. Materials and Methods
3. Results
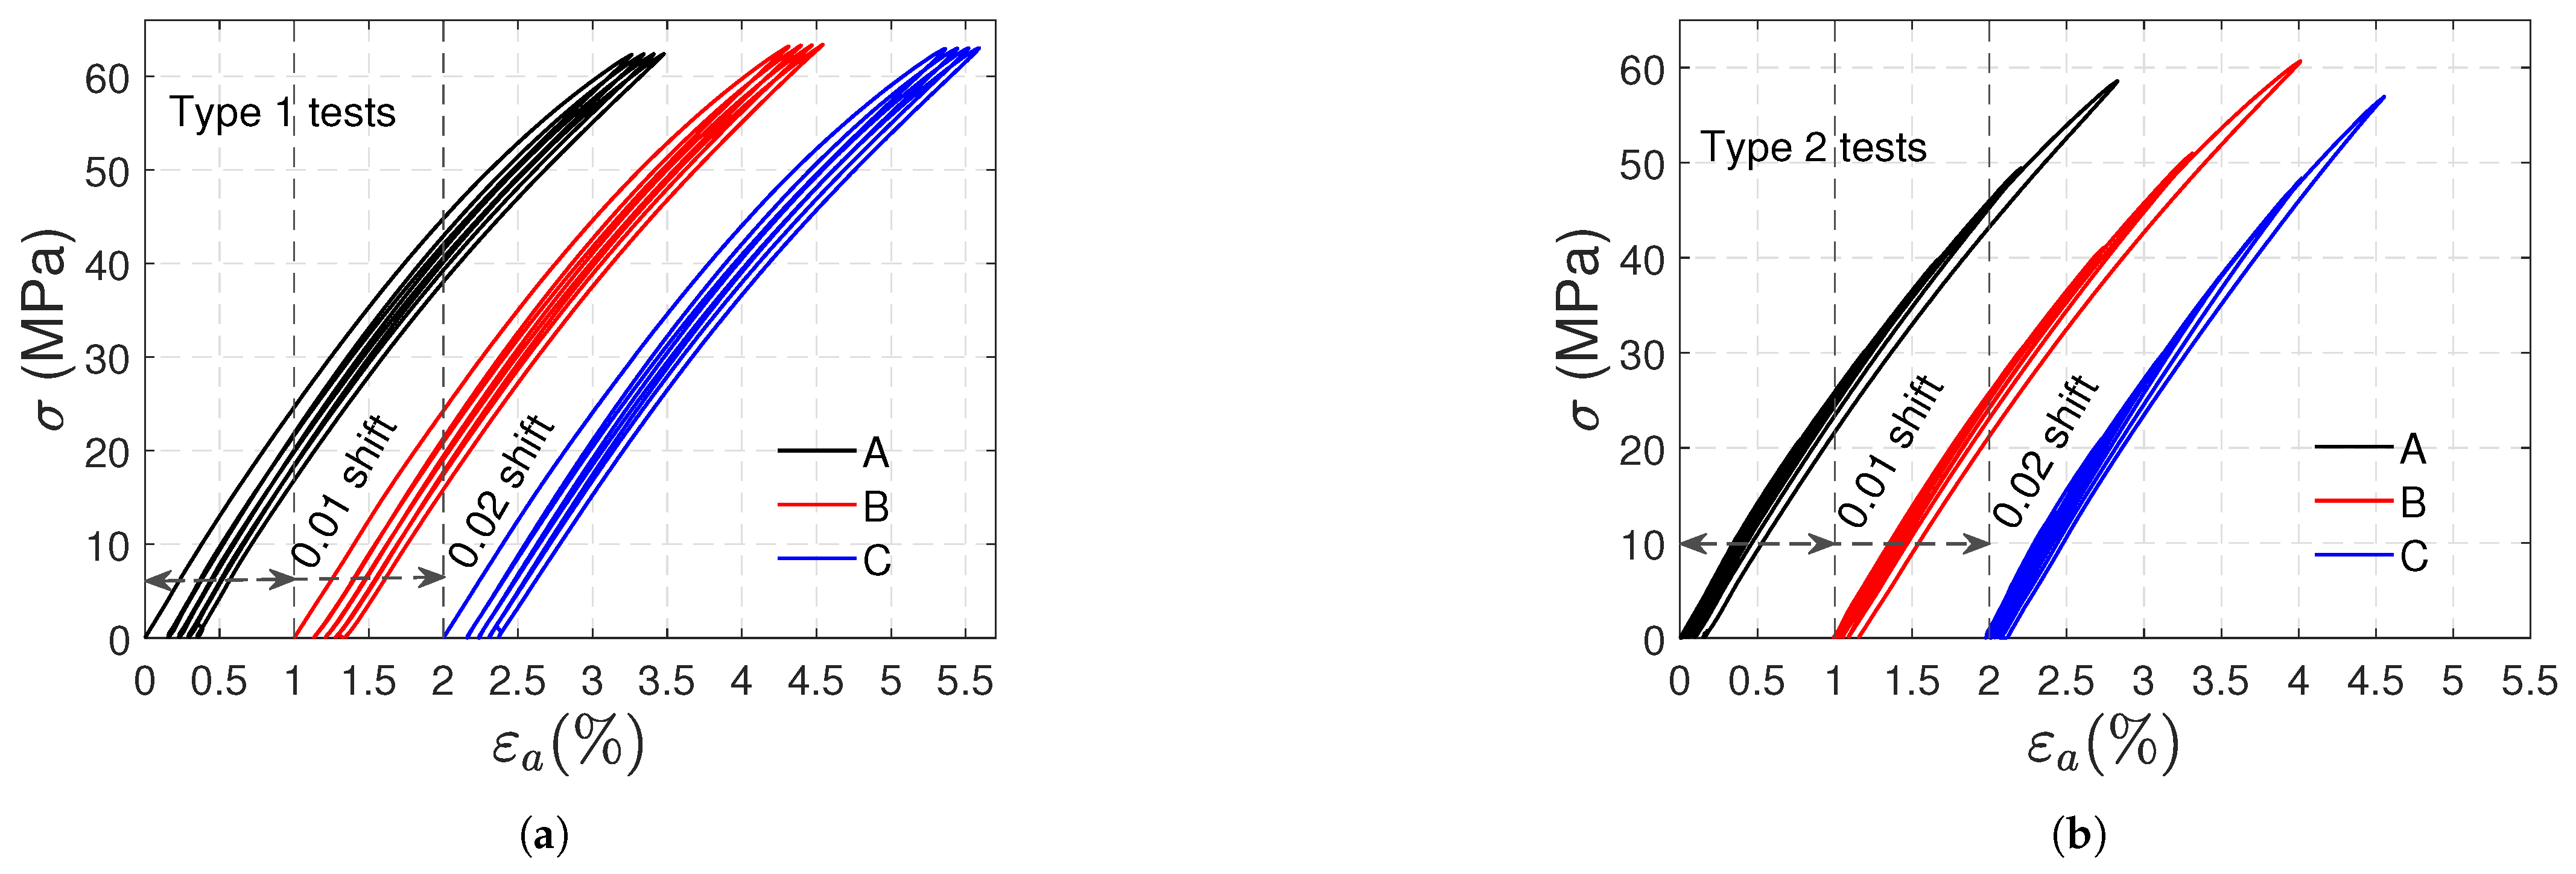
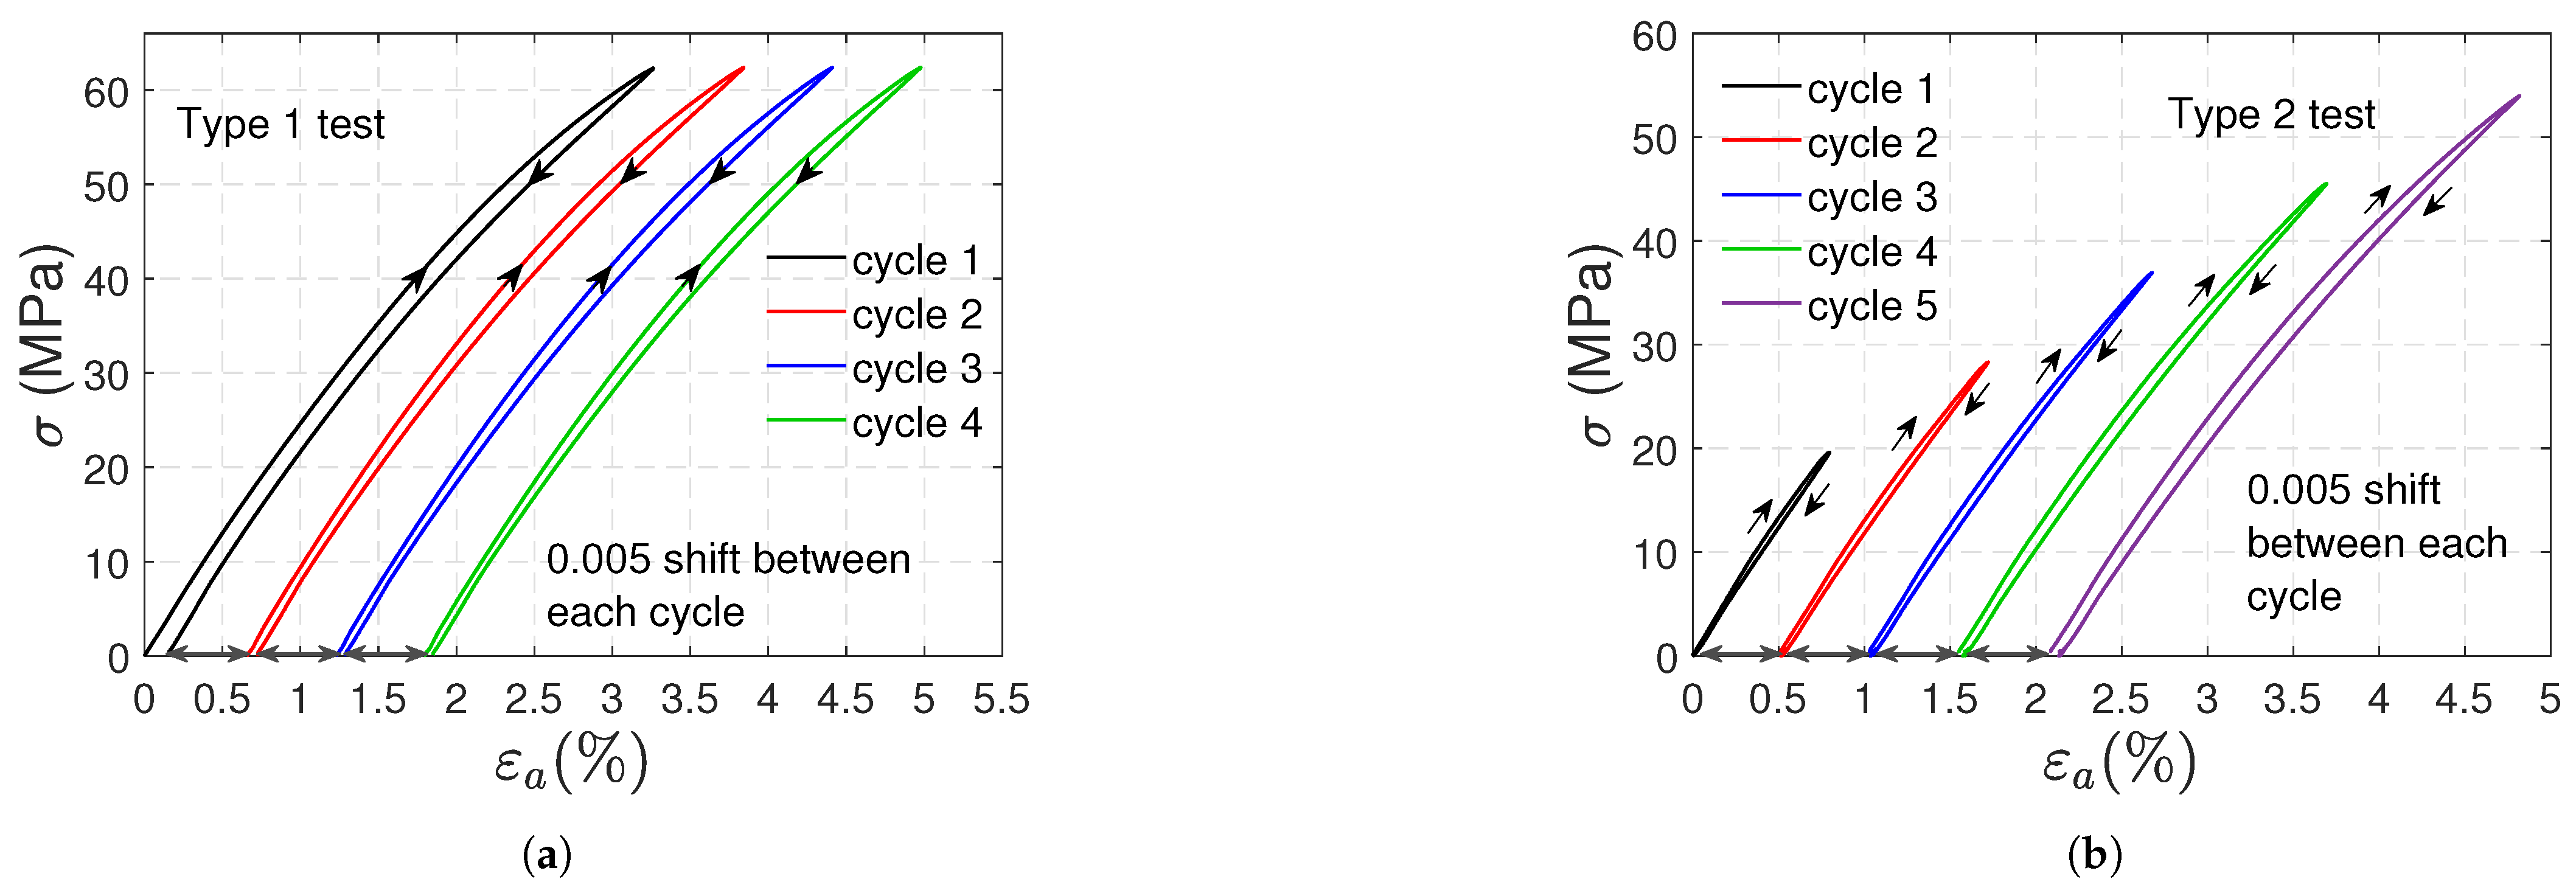
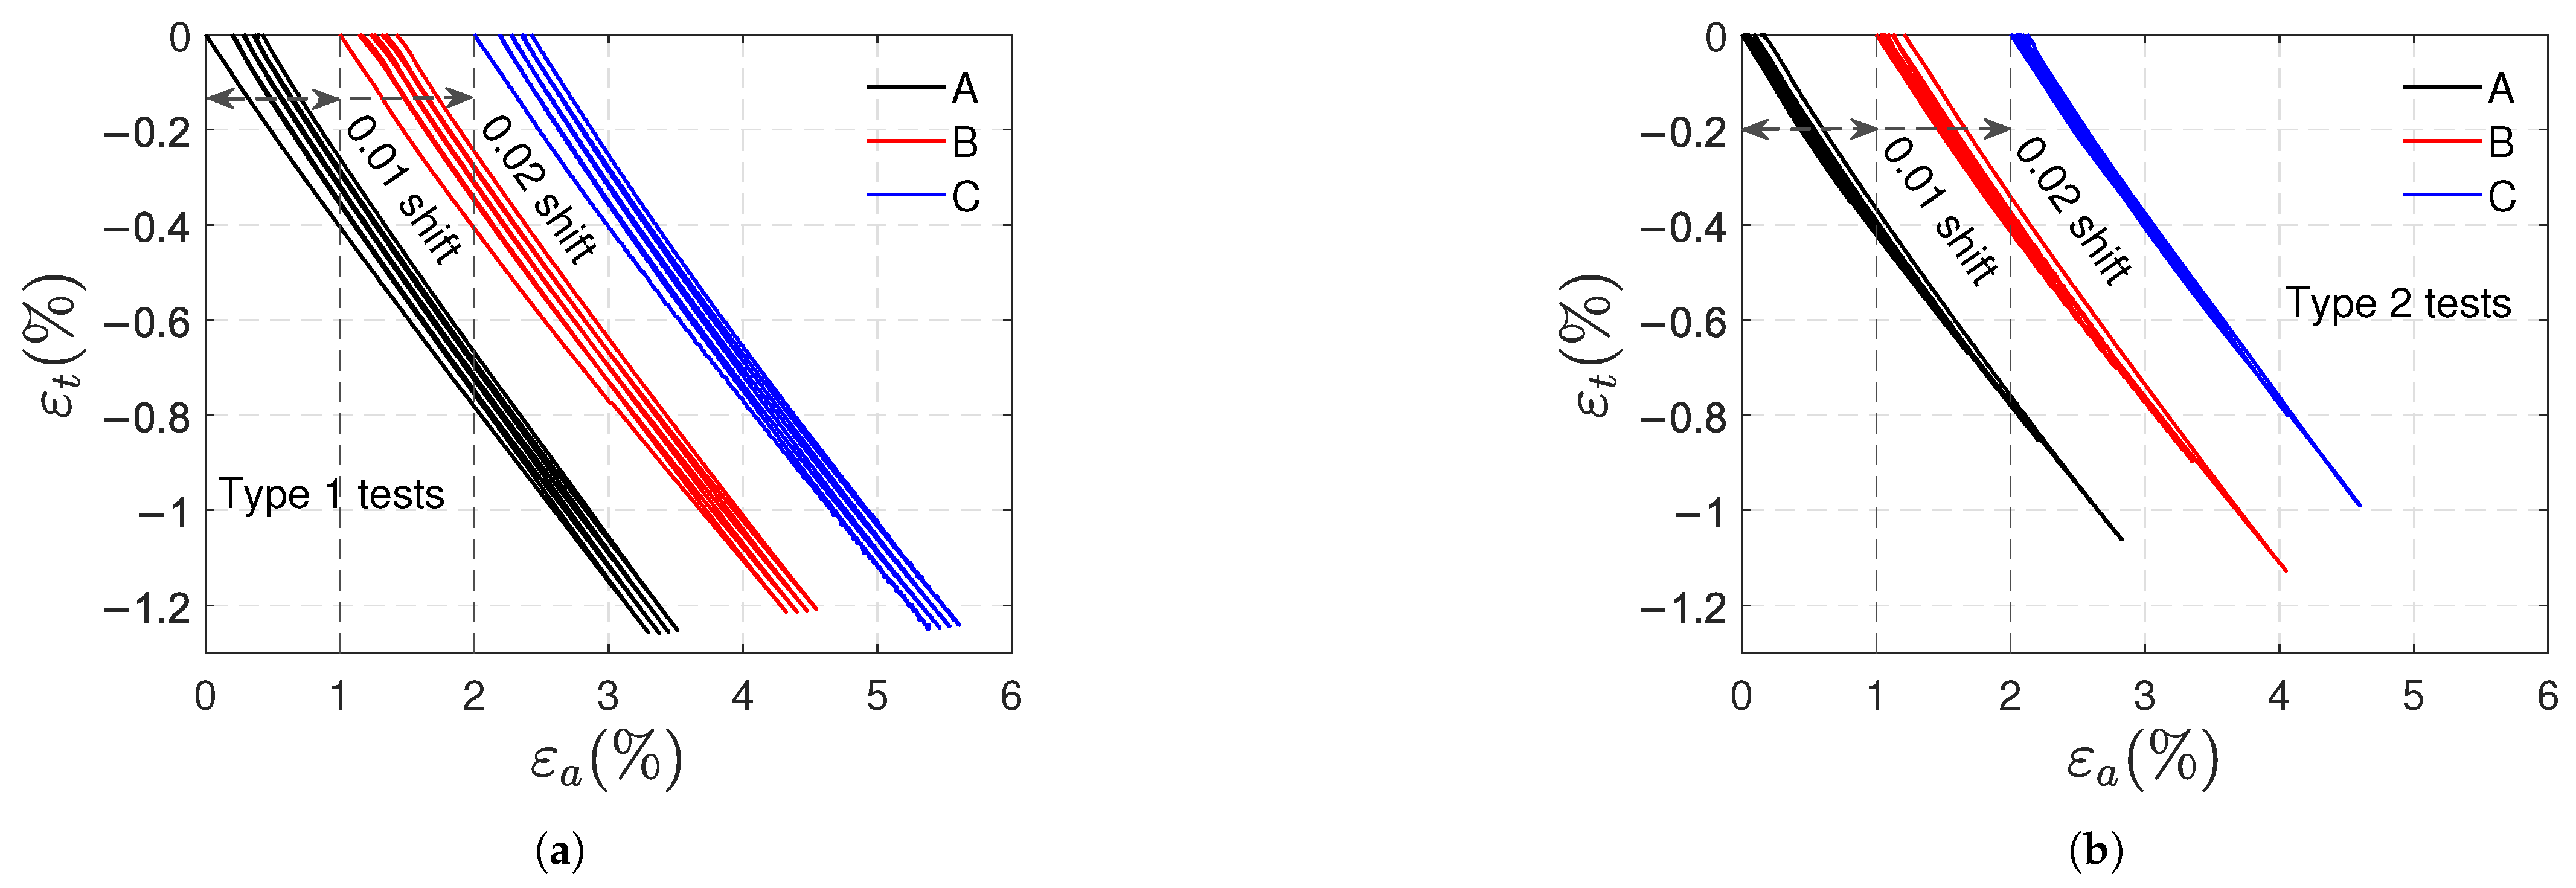
3.1. Tensile Tests
- The transverse strains reached at the end of the loading stages are the same. Increasing axial and volumetric strains remain after each cycle, and permanent strains appear at the end of the test.
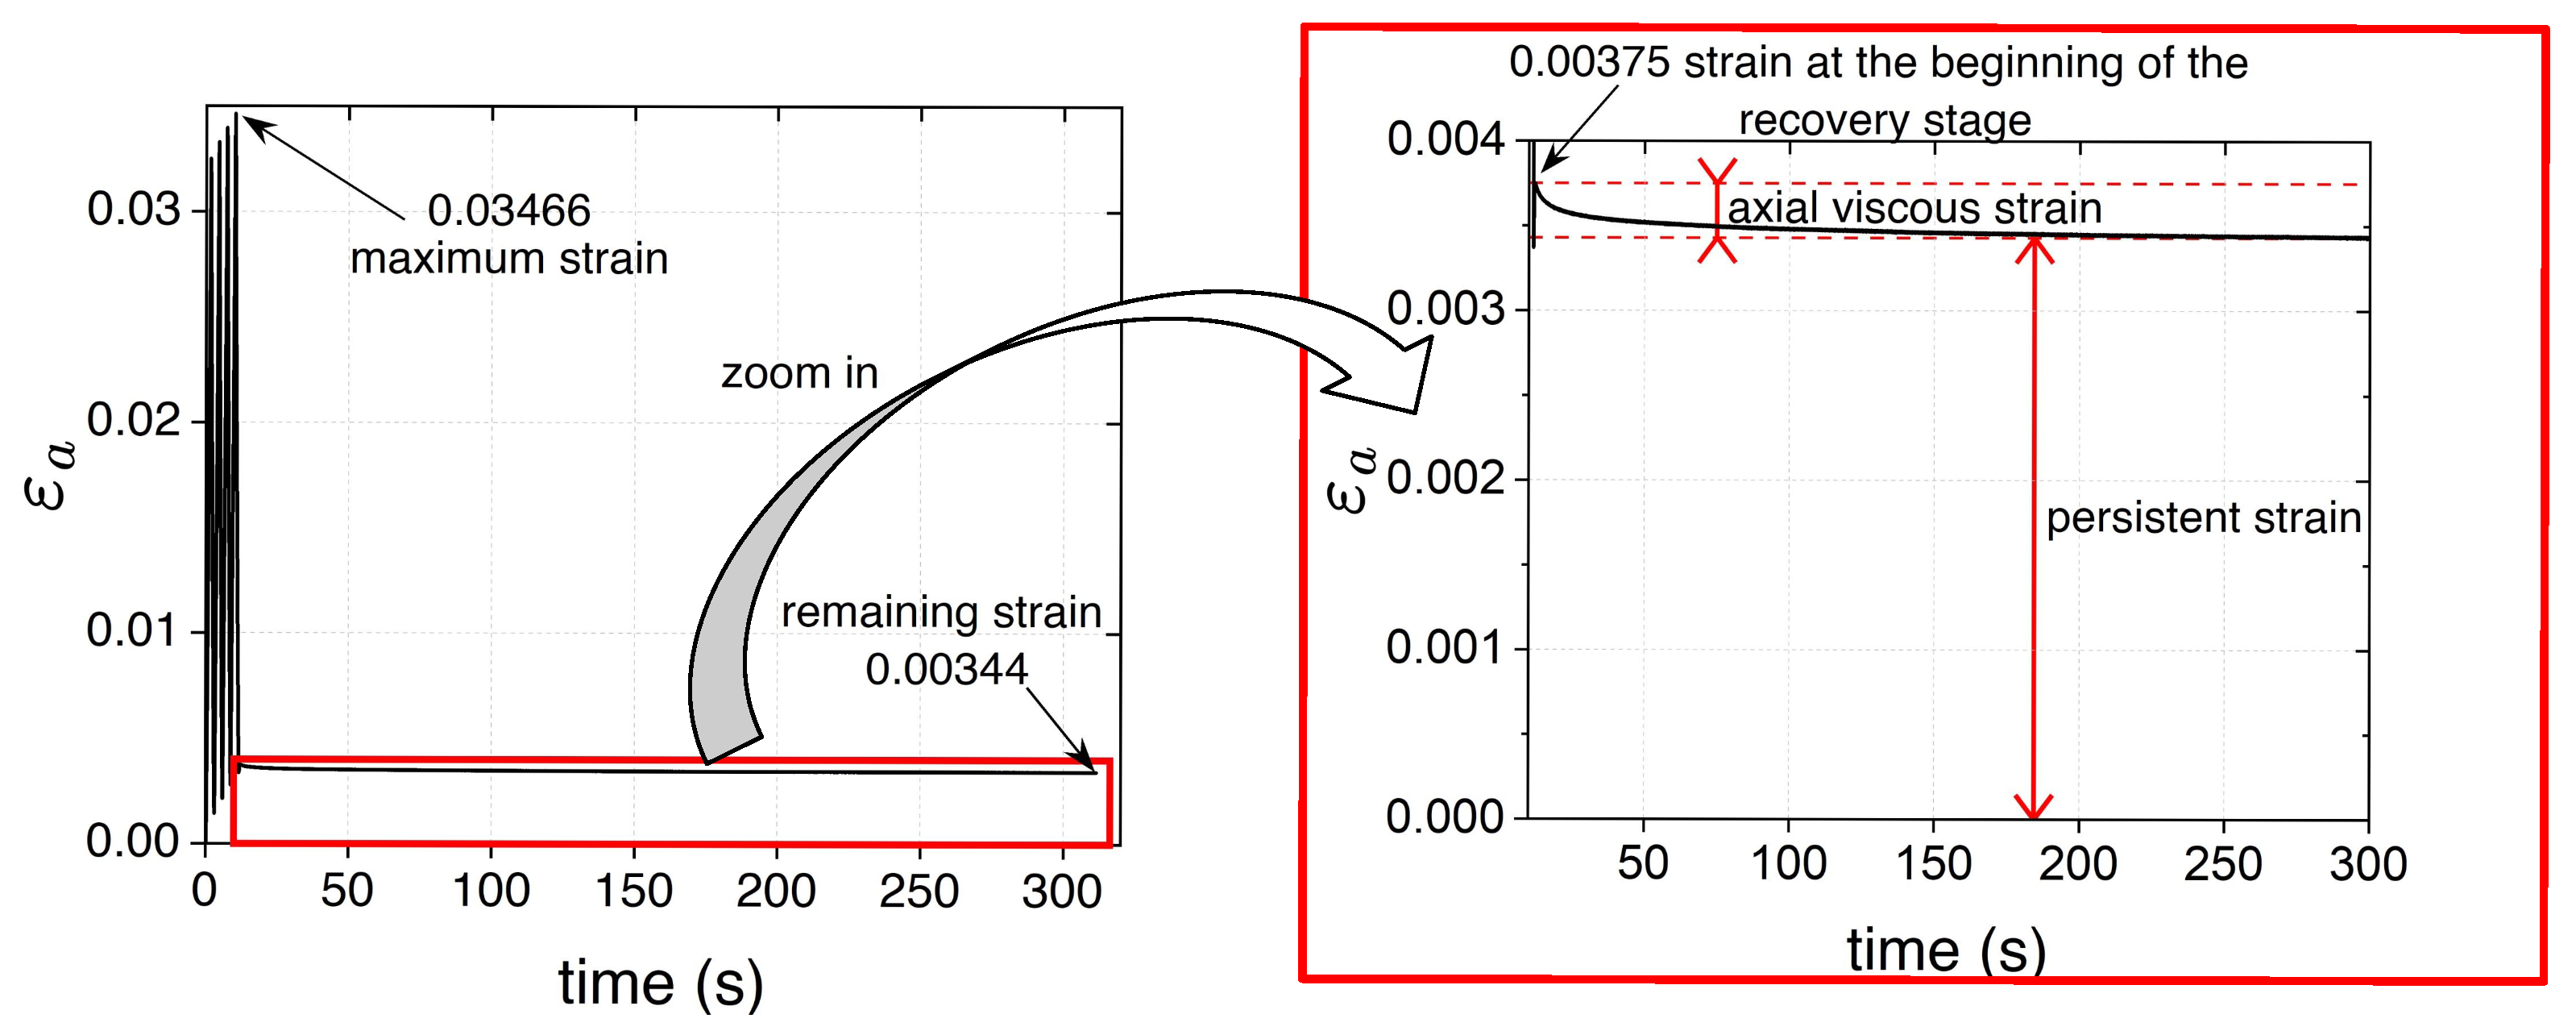
- The remaining and strains at the end of the test are on average and ; they correspond approximately to 9.4% and 31% of the maximum axial and volumetric strains reached during the test, respectively.
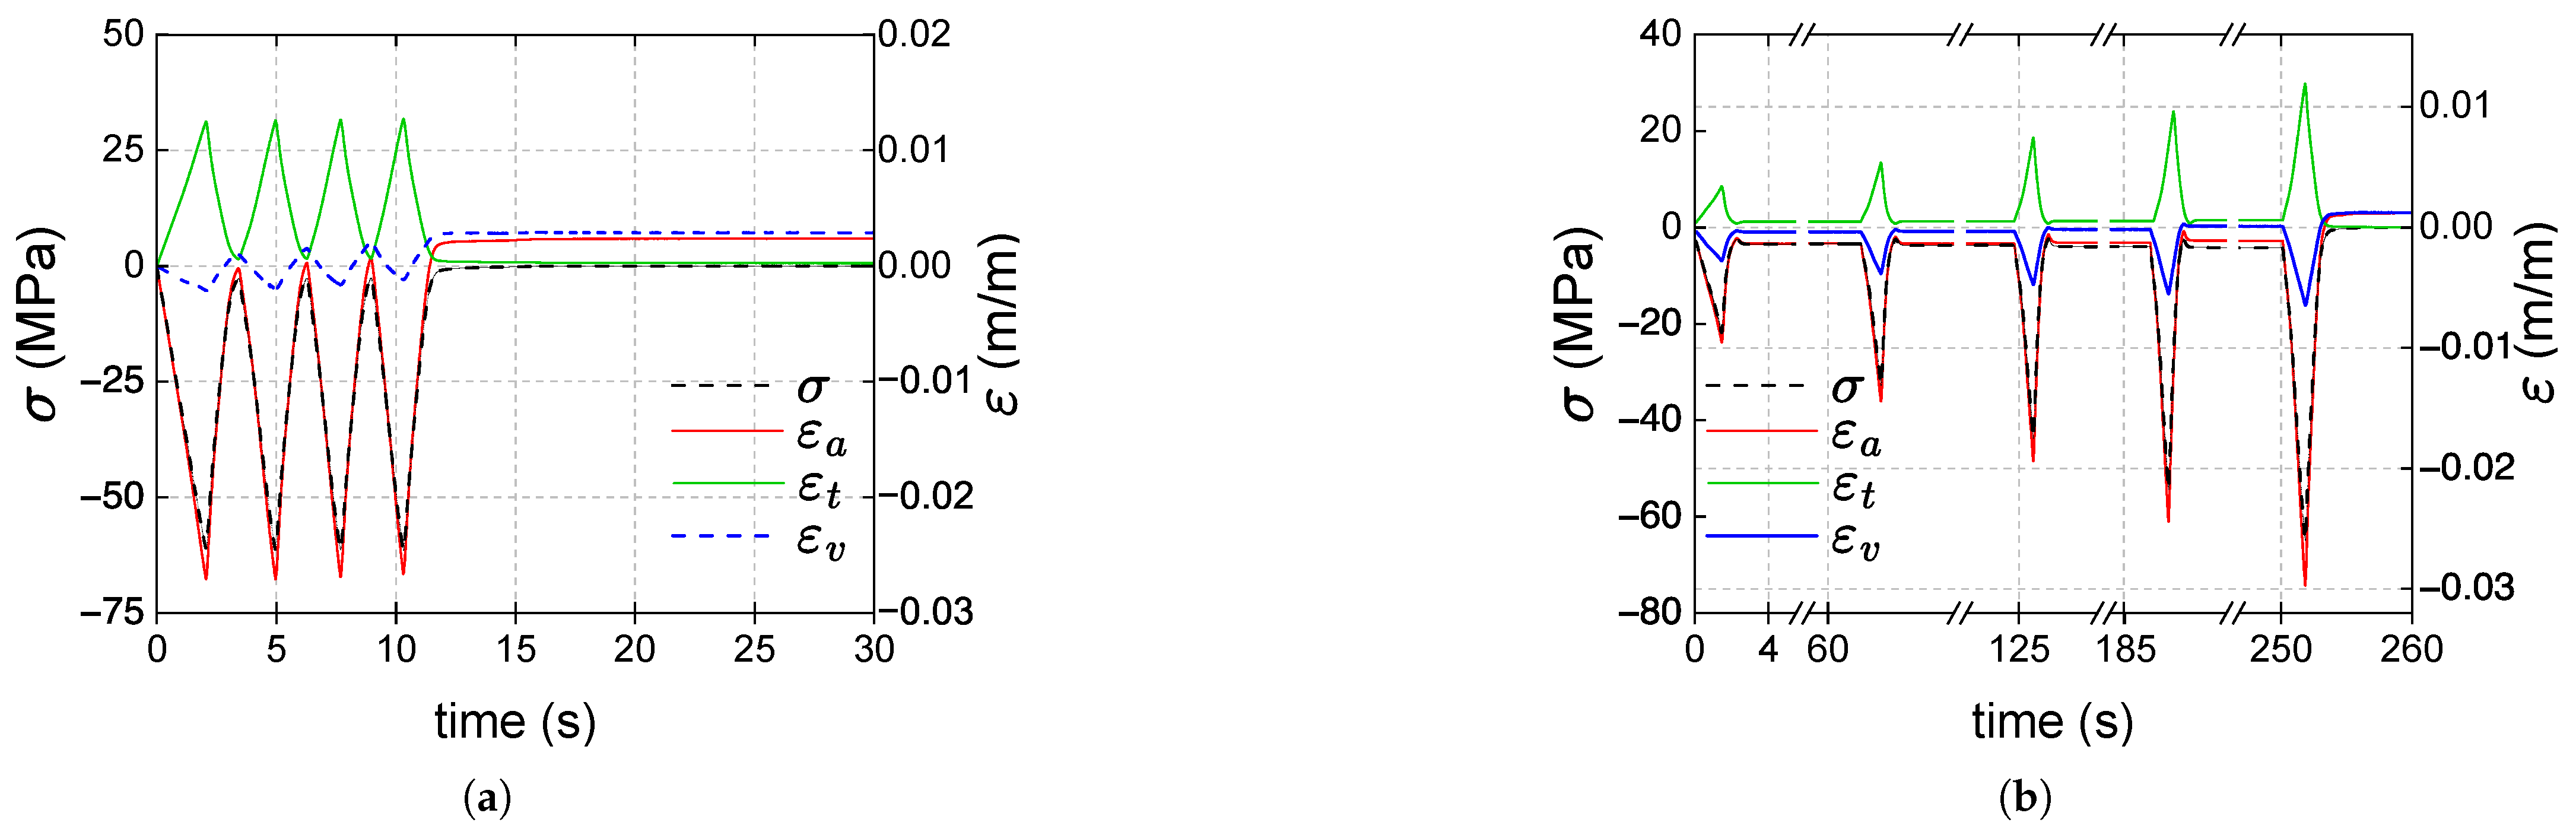
- a minimal viscous effect appears during the recovery stage: as shown in Figure 8, the axial strain at the beginning of the recovery stage is slightly higher than the persistent strain recorded at the end of the test, resembling a creep recovery-like evolution. The difference between the strains (axial viscous strain) is less than 1% of the maximum strain reached during the type 1 test.
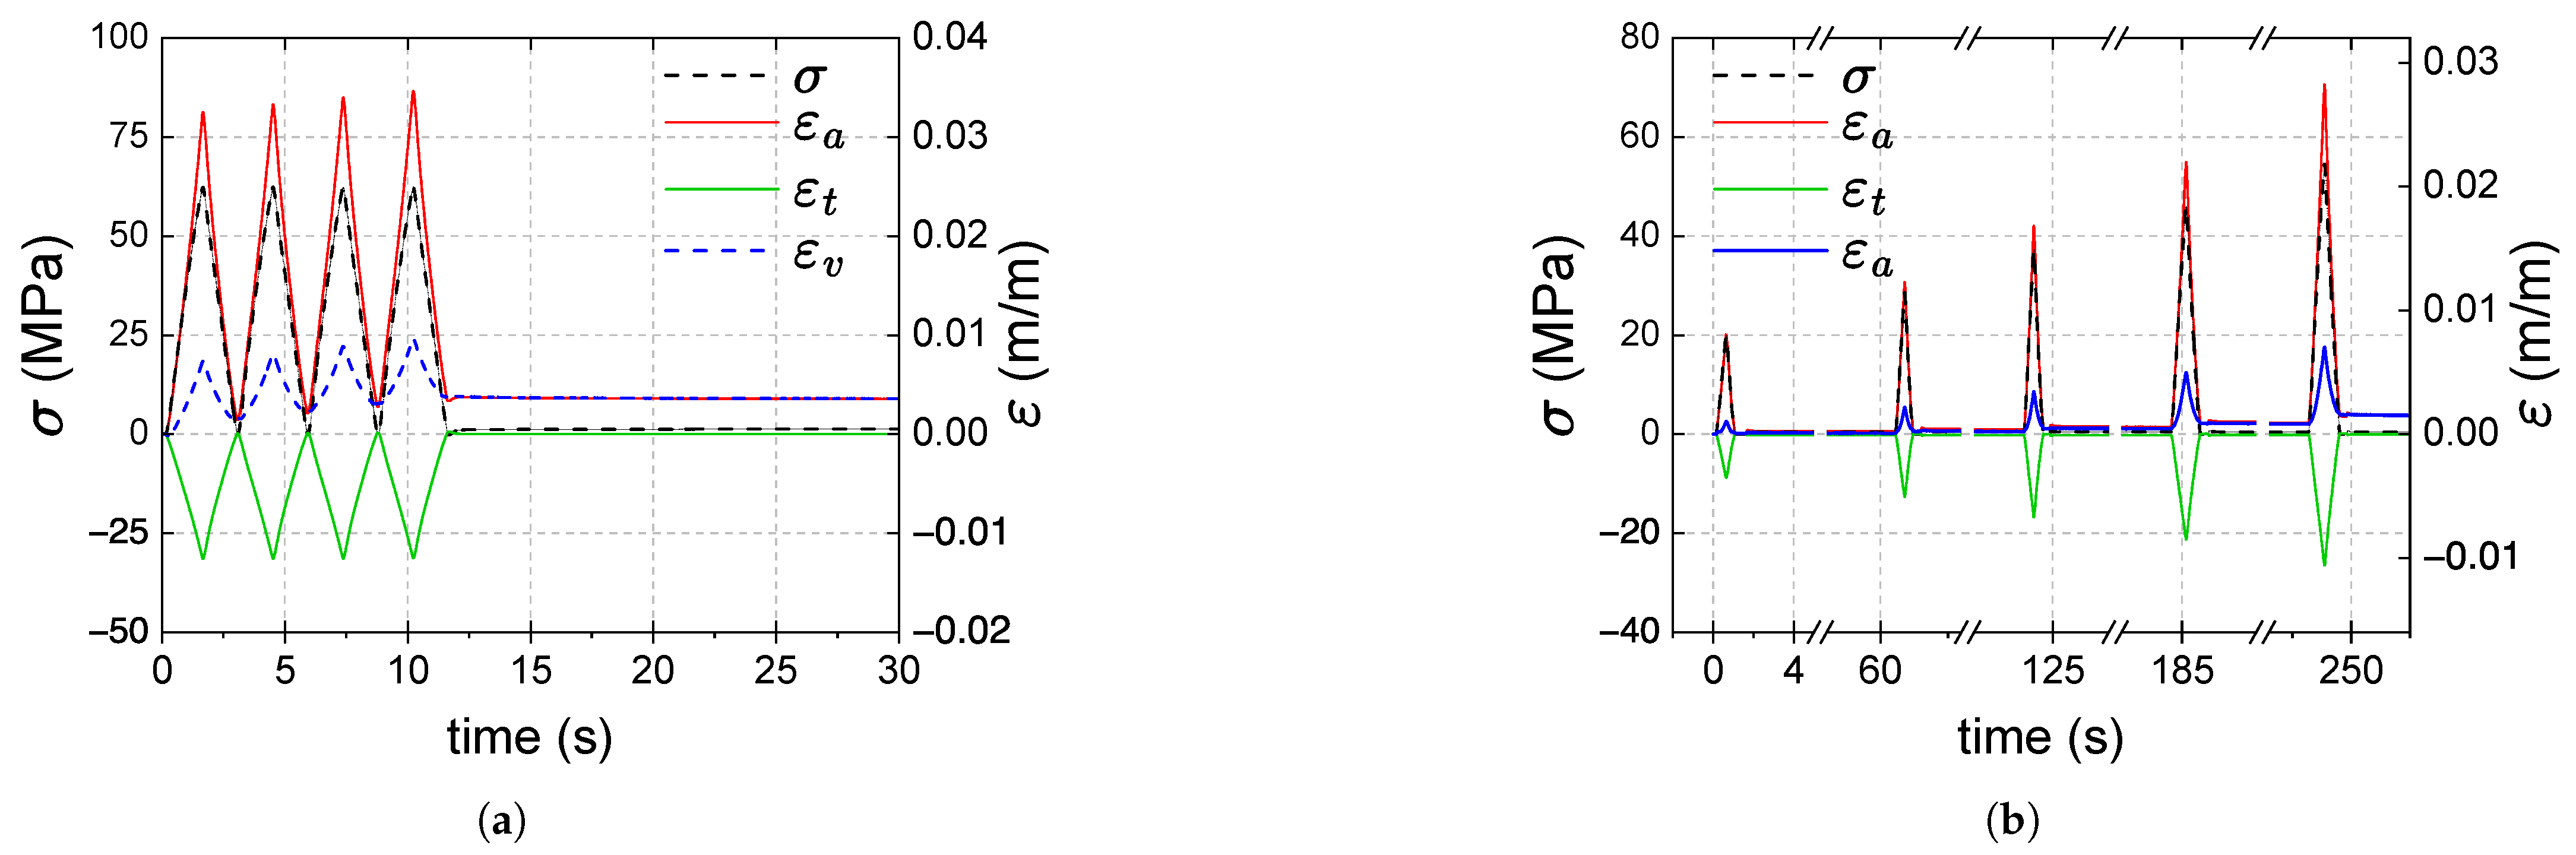
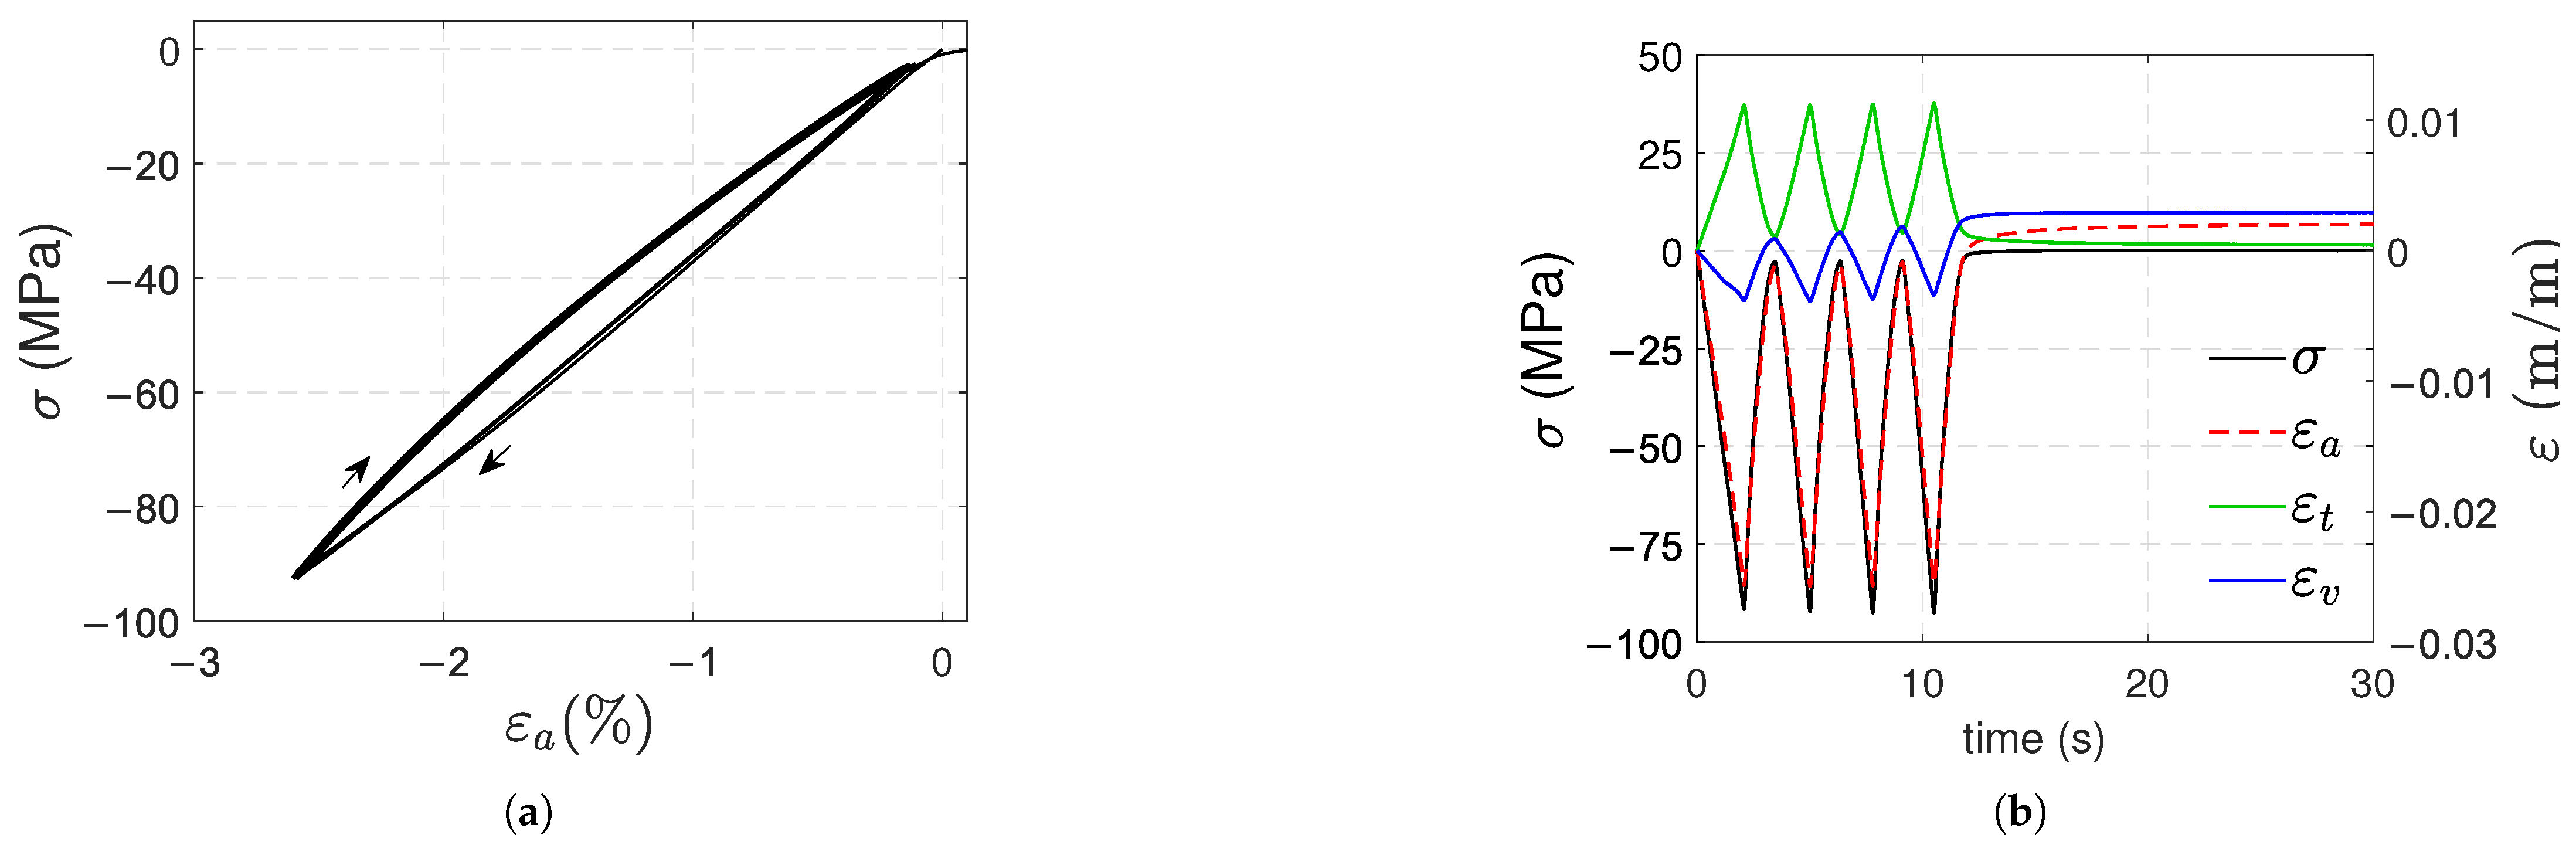
- In type 2 tests, viscous effects are also minimal, and residual axial and volumetric deformations are observed during the recovery stages; the remaining and strains increase progressively depending on the previously reached load level, and at the end of the test they stabilize at almost the same value .
3.2. Compression Tests
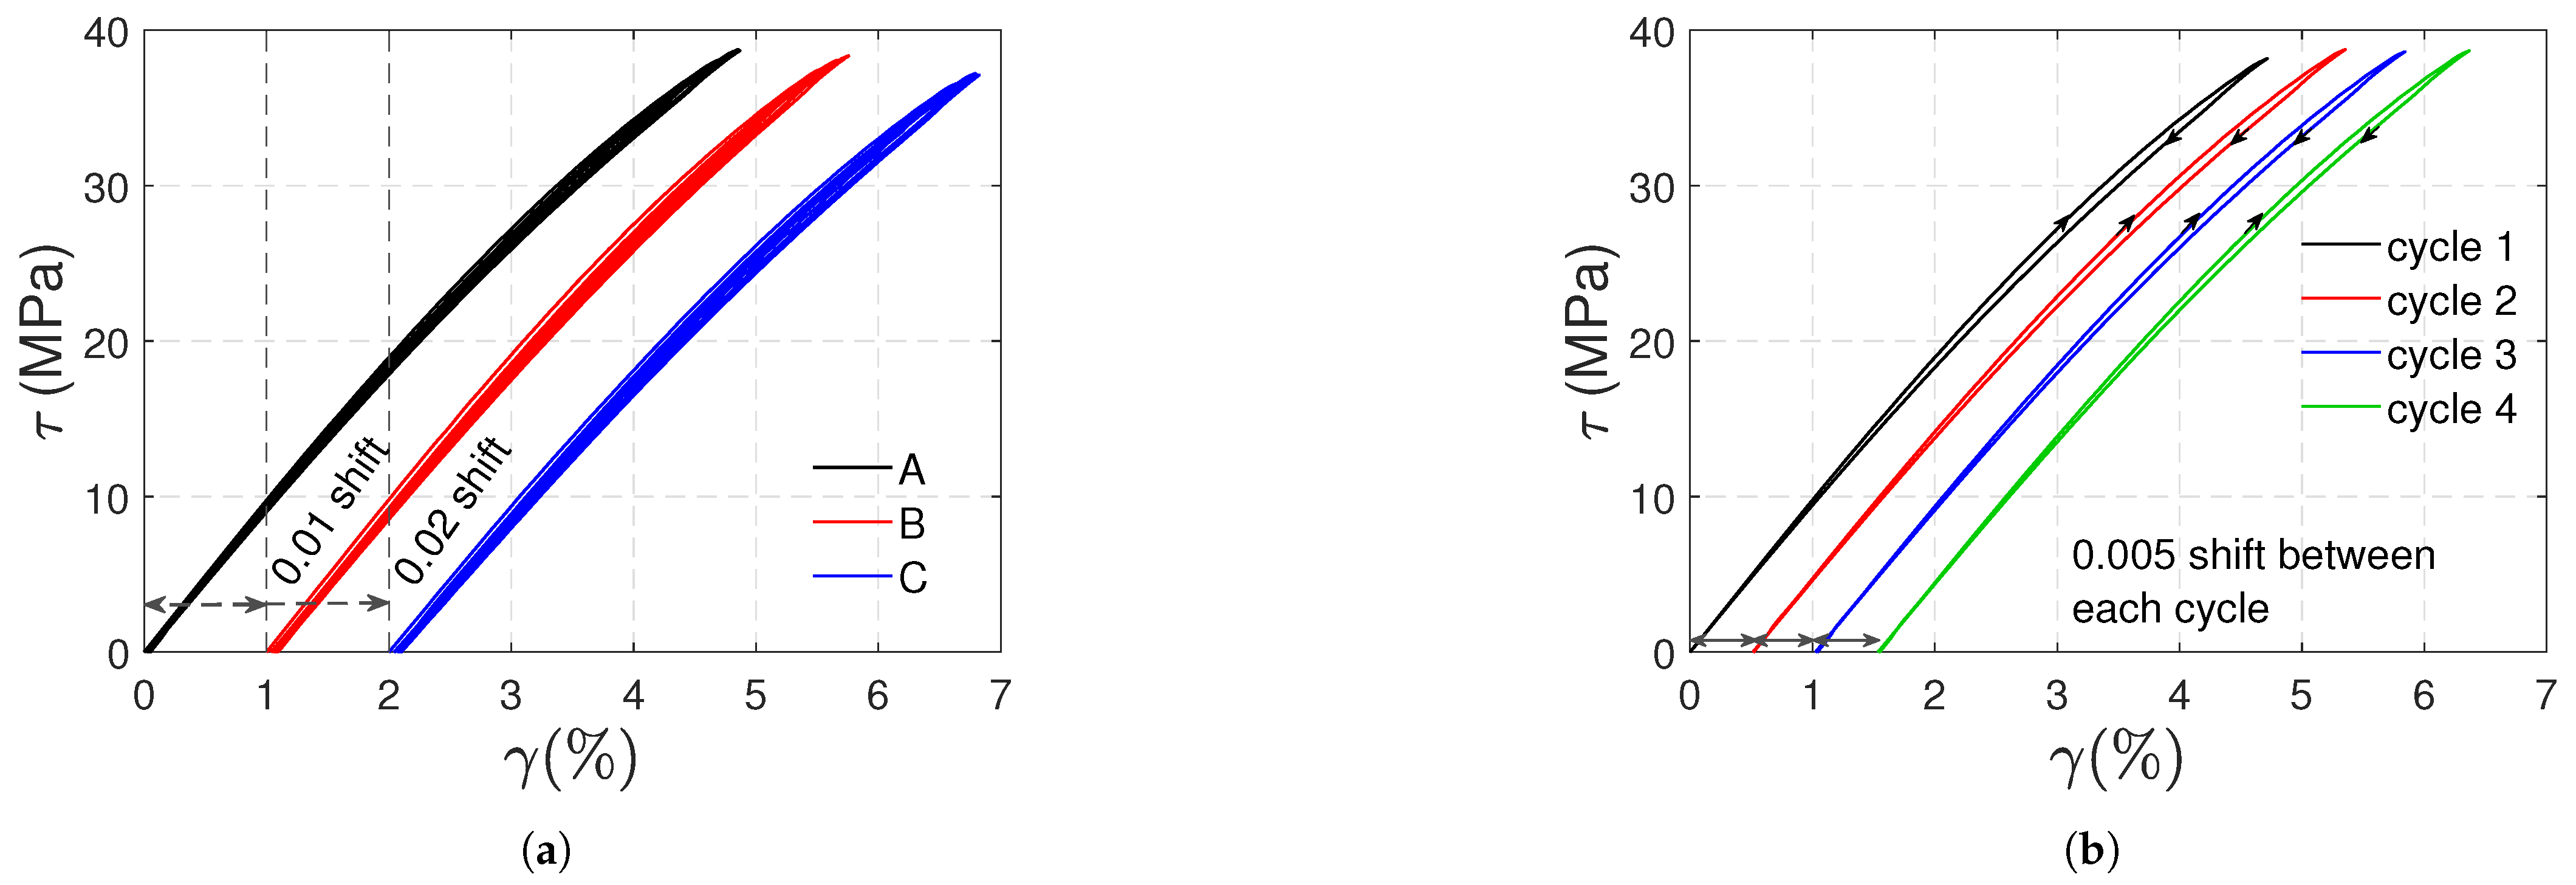
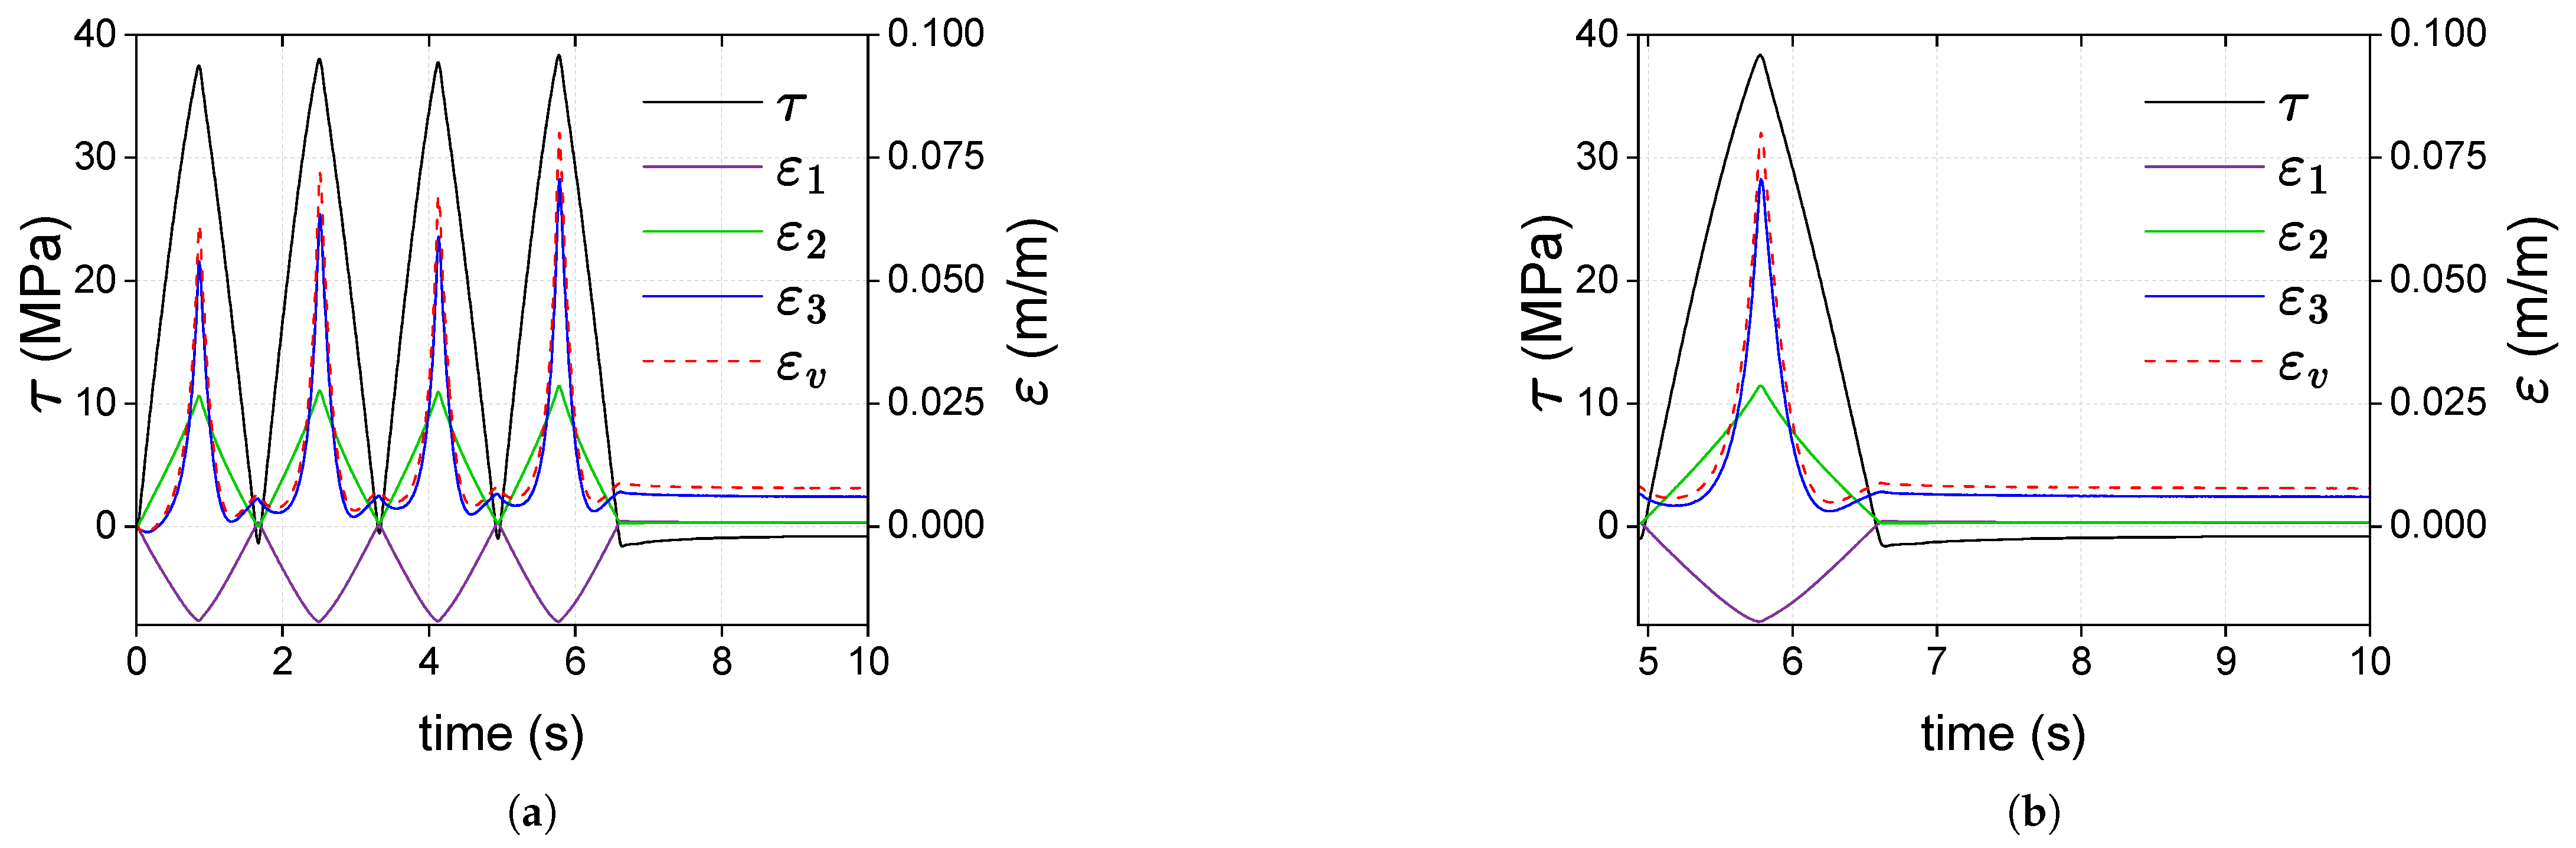
3.3. Torsional Tests
4. Discussion
4.1. Plasticity and Nonlinear Elastic Behavior
4.2. Isotropy and Asymmetric Material Behavior
4.3. Rejuvenation
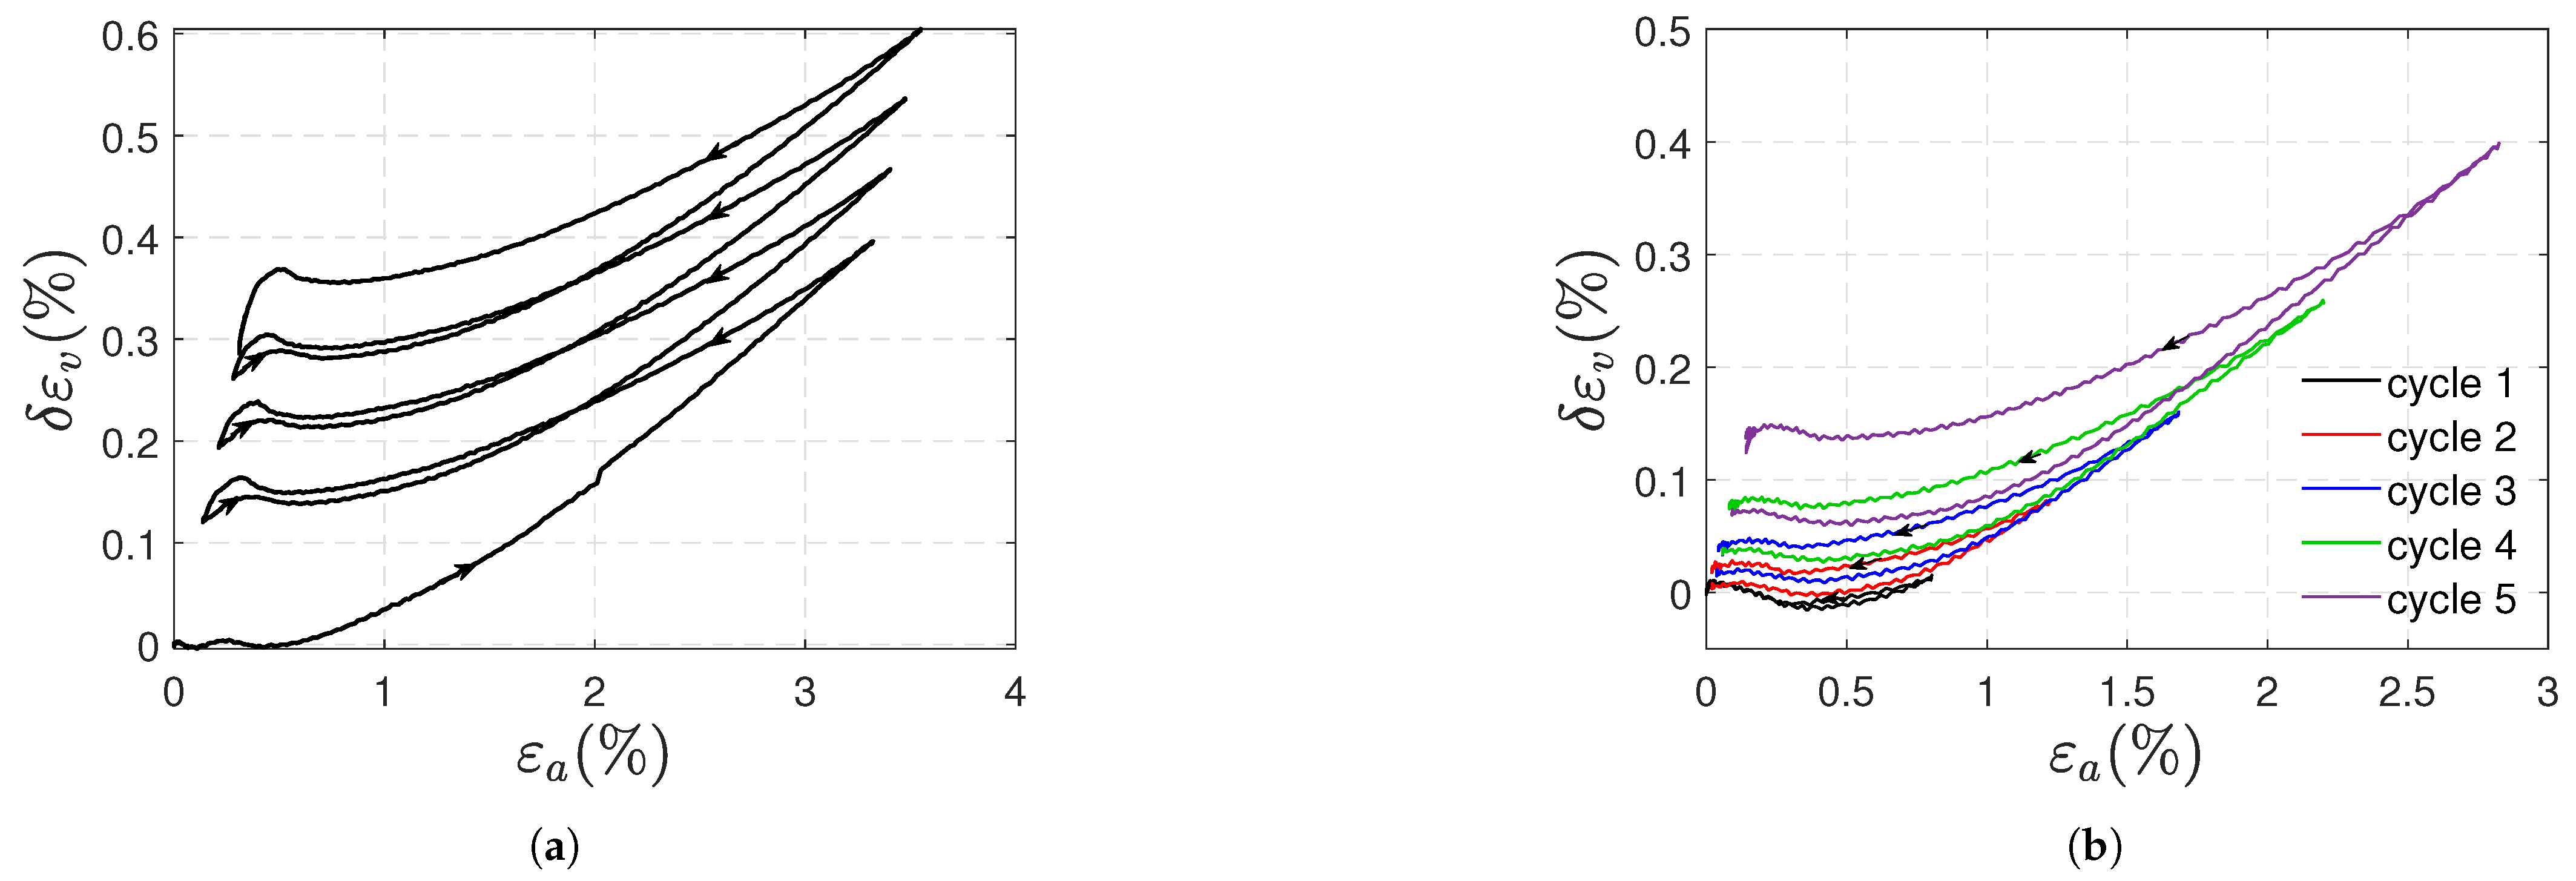
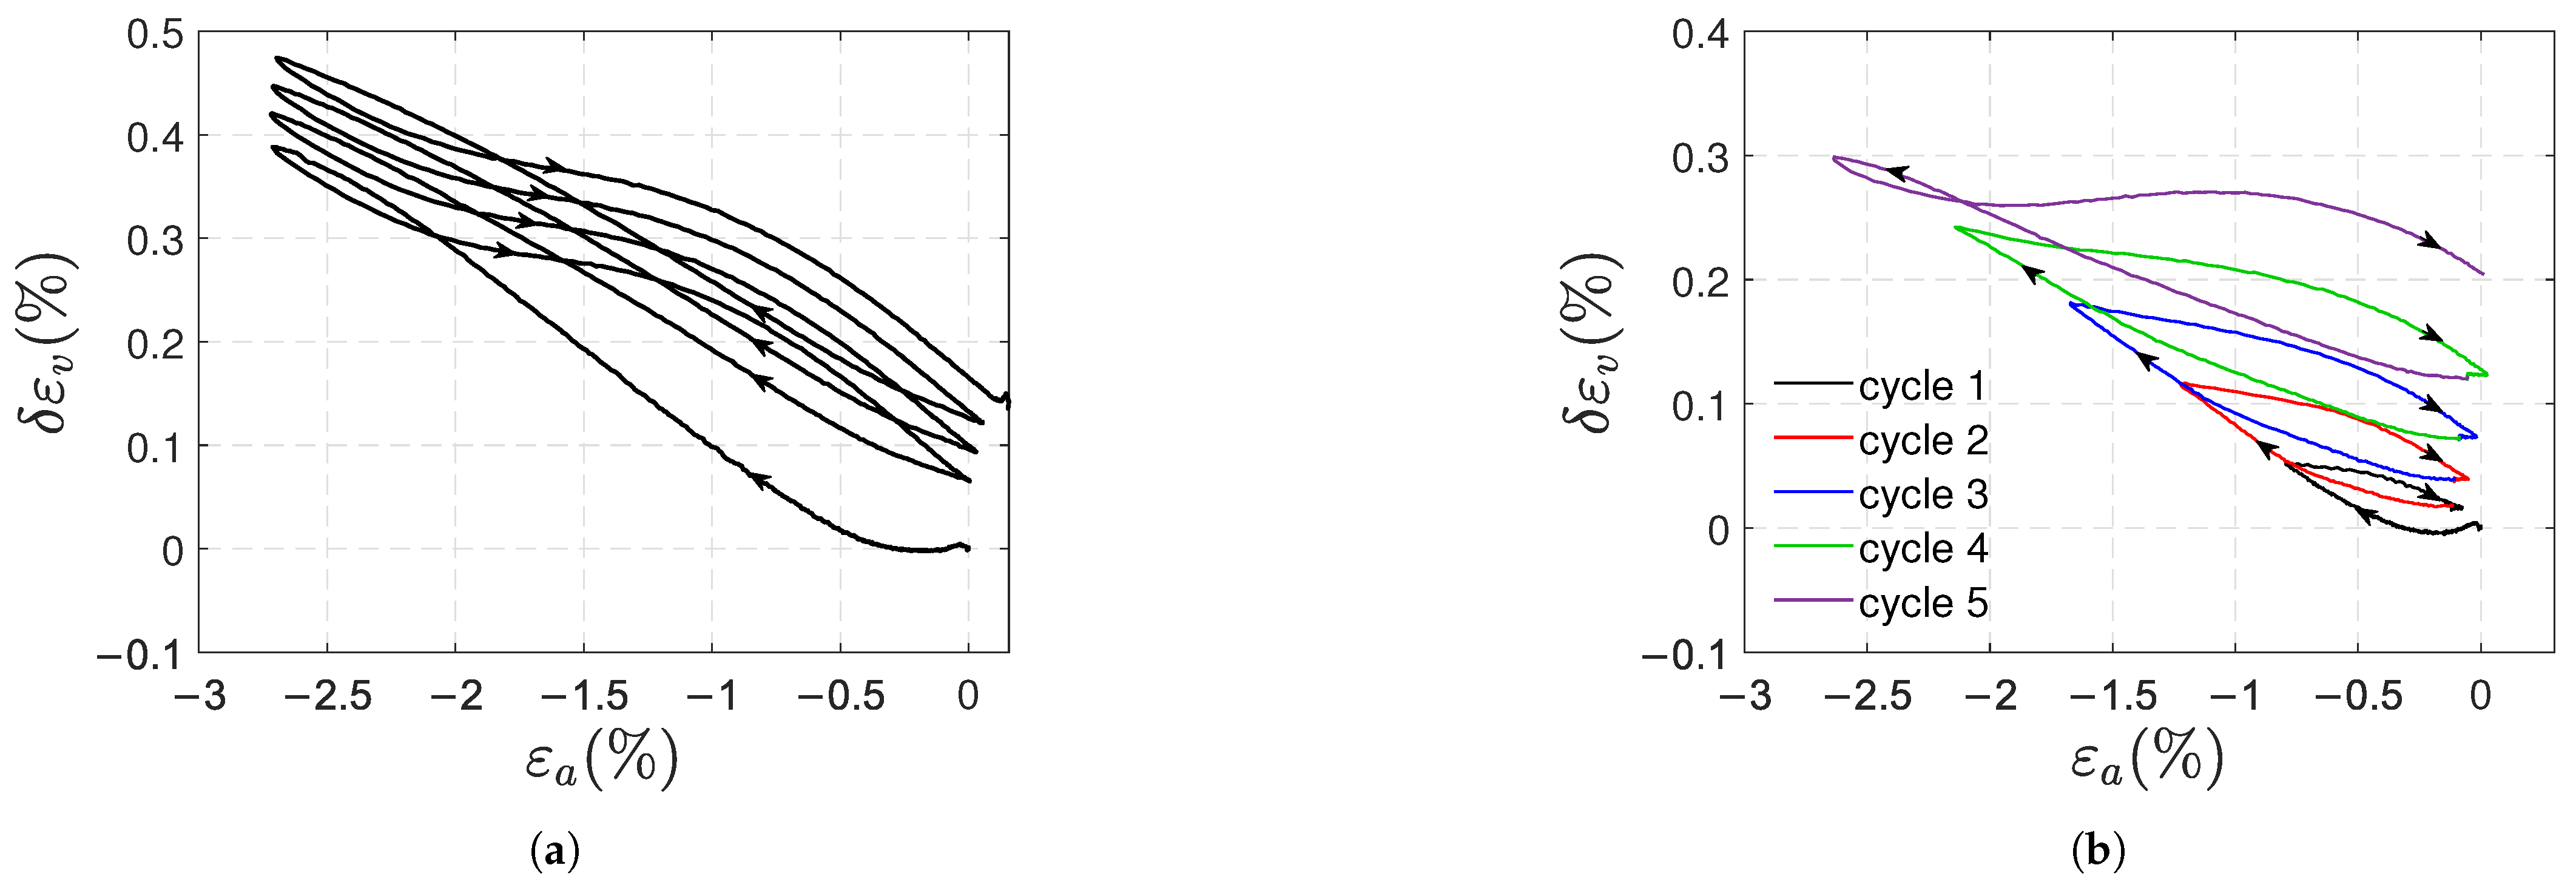
4.4. Reasons for the Volumetric Strain Increase in Each Test
4.5. Are the Findings a Product of Experimental Flaws?
- The critical buckling loads (in compression and torsion) are at least 1.8 times greater than the applied loads. Experimentally, in one of the compression tests, two axial strain gauges were placed—one on the front and one on the back of the specimen—and it was verified that there were no signs of bending, as both gauges measured virtually the same axial strain.
- The strain gauges accurately captured strain in cyclic tests. To confirm this, uniaxial cyclic tests were performed on steel specimens under loads that produced plastic strains of magnitudes similar to those presented here. The stress–strain curves did not exhibit ratcheting and showed that the unloading and subsequent reloading paths overlapped with no hysteresis (this is an expected result in steels subjected to small plastic deformations). Additionally, it was verified that the measured elastic modulus matched the typical value for steel.
4.6. Does Plastic Expansion in Compressive Tests Happen Only in Polycarbonate Specimens?
5. Conclusions
- A nonlinear behavior was exhibited; it was caused by nonlinear elasticity and plasticity.
- Tensile and compressive tests revealed asymmetry in the material behavior in both pre-yield and post-yield states. Young’s moduli and Poisson’s ratios obtained in compression were slightly lower than those measured in tension.
- In tension, positive plastic axial and volumetric strains appeared, of course. Negative plastic transverse strains were obtained, but their magnitude was much lower than the plastic axial strain. The stress–strain curves exhibited ratcheting.
- In compression, positive plastic axial and volumetric strains also appeared; this was unexpected. Positive plastic transverse strains were measured, and their magnitude was once again marginal as compared to the plastic axial strain.
- In torsional tests with tubular specimens, a positive plastic volumetric strain also appeared. It was mainly due to the plastic strain across the thickness of the specimens.
- A deviatoric stress state does, in fact, provoke positive plastic volumetric strains.
- The concept of ”mechanical rejuvenation” is questionable in the tests performed herein; the volume increments in the post-yield stage were not uniform in all directions.
- Nonlinear elasticity was also revealed.
Author Contributions
Funding
Institutional Review Board Statement
Data Availability Statement
Acknowledgments
Conflicts of Interest
Abbreviations
| PC | polycarbonate |
| Tg | glass transition temperature |
| Mw | weight average molecular weight |
| PMMA | poly methyl methacrylate |
References
- Song, P.; Trivedi, A.R.; Siviour, C.R. Mechanical response of four polycarbonates at a wide range of strain rates and temperatures. Polym. Test. 2023, 121, 107986. [Google Scholar] [CrossRef]
- Krausz, T.; Popa, C.F.; Topircean, C.D.; Rusu, L.; Marsavina, L. Temperature and thermal aging effects on the mechanical response of polycarbonate materials. Procedia Struct. Integr. 2024, 56, 71–77. [Google Scholar] [CrossRef]
- Song, P.; Chapman, D.; Graham, A.; Trivedi, A.; Siviour, C.R. Thermomechanical coupling during large strain deformation of polycarbonate: Experimental study. J. Mech. Phys. Solids 2025, 196, 105976. [Google Scholar] [CrossRef]
- Cao, K.; Wang, Y.; Wang, Y. Experimental investigation and modeling of the tension behavior of polycarbonate with temperature effects from low to high strain rates. Int. J. Solids Struct. 2014, 51, 2539–2548. [Google Scholar] [CrossRef]
- Xi, C.; Kang, G.; Lu, F.; Zhang, J.; Jiang, H. An experimental study on uniaxial ratcheting of polycarbonate polymers with different molecular weights. Mater. Des. 2015, 67, 644–648. [Google Scholar] [CrossRef]
- Redjala, S.; Azem, S.; Ait Hocine, N. The effect of the thermal aging on polycarbonate. Mater. Today Proc. 2021, 47, 3073–3076. [Google Scholar] [CrossRef]
- Meijer, H.E.; Govaert, L.E. Mechanical performance of polymer systems: The relation between structure and properties. Prog. Polym. Sci. 2005, 30, 915–938. [Google Scholar] [CrossRef]
- Choudalakis, G.; Gotsis, A. Free volume and mass transport in polymer nanocomposites. Curr. Opin. Colloid Interface Sci. 2012, 17, 132–140. [Google Scholar] [CrossRef]
- White, R.P.; Lipson, J.E. Polymer free volume and its connection to the glass transition. Macromolecules 2016, 49, 3987–4007. [Google Scholar] [CrossRef]
- Merrick, M.M.; Sujanani, R.; Freeman, B.D. Glassy polymers: Historical findings, membrane applications, and unresolved questions regarding physical aging. Polymer 2020, 211, 123176. [Google Scholar] [CrossRef]
- Struik, L.C.E. Physical Aging in Amorphous Polymers and Other Materials; Elsevier: Amsterdam, The Netherlands, 1978; Volume 106. [Google Scholar]
- Buckley, C.; Dooling, P.; Harding, J.; Ruiz, C. Deformation of thermosetting resins at impact rates of strain. Part 2: Constitutive model with rejuvenation. J. Mech. Phys. Solids 2004, 52, 2355–2377. [Google Scholar] [CrossRef]
- McKenna, G.B.; Simon, S.L. 50th anniversary perspective: Challenges in the dynamics and kinetics of glass-forming polymers. Macromolecules 2017, 50, 6333–6361. [Google Scholar] [CrossRef]
- Ohara, A.; Kodama, H. Correlation between enthalpy relaxation and mechanical response on physical aging of polycarbonate in relation to the effect of molecular weight on ductile-brittle transition. Polymer 2019, 181, 121720. [Google Scholar] [CrossRef]
- Hutchinson, J.; Smith, S.; Horne, B.; Gourlay, G. Physical aging of polycarbonate: Enthalpy relaxation, creep response, and yielding behavior. Macromolecules 1999, 32, 5046–5061. [Google Scholar] [CrossRef]
- Voyiadjis, G.Z.; Samadi-Dooki, A. Constitutive modeling of large inelastic deformation of amorphous polymers: Free volume and shear transformation zone dynamics. J. Appl. Phys. 2016, 119, 225104. [Google Scholar] [CrossRef]
- Hosseinabadi, H.G.; Bagheri, R.; Gigl, T.; Hugenschmidt, C.; Raps, D.; Altstädt, V. Interrelation between mechanical response, strain field, and local free volume evolution in glassy polymers: Seeking the atomistic origin of post-yield softening. eXPRESS Polym. Lett. 2018, 12, 2–12. [Google Scholar] [CrossRef]
- Xie, L.; Gidley, D.W.; Hristov, H.A.; Yee, A.F. Evolution of nanometer voids in polycarbonate under mechanical stress and thermal expansion using positron spectroscopy. J. Polym. Sci. Part B Polym. Phys. 1995, 33, 77–84. [Google Scholar] [CrossRef]
- Chen, K.; Schweizer, K.S. Theory of aging, rejuvenation, and the nonequilibrium steady state in deformed polymer glasses. Phys. Rev. E 2010, 82, 041804. [Google Scholar] [CrossRef]
- Lee, H.N.; Ediger, M. Mechanical rejuvenation in poly (methyl methacrylate) glasses? Molecular mobility after deformation. Macromolecules 2010, 43, 5863–5873. [Google Scholar] [CrossRef]
- Whitney, W.; Andrews, R. Yielding of glassy polymers: Volume effects. J. Polym. Sci. Part C Polym. Symp. 1967, 16, 2981–2990. [Google Scholar] [CrossRef]
- Kitagawa, M.; Yoneyama, T. Plastic dilatation due to compression in polymer solids. J. Polym. Sci. Part C Polym. Lett. 1988, 26, 207–212. [Google Scholar] [CrossRef]
- Delin, M.; Rychwalski, R.W.; Kubát, M.J.; Kubát, J. Volume changes during stress relaxation in polyethylene. Rheol. Acta 1995, 34, 182–195. [Google Scholar] [CrossRef]
- Drozdov, A.D. Stress-induced densification of glassy polymers in the subyield region. J. Appl. Polym. Sci. 1999, 74, 1705–1718. [Google Scholar] [CrossRef]
- Filanova, Y.; Hauptmann, J.; Längler, F.; Naumenko, K. Inelastic behavior of polyoxymethylene for wide strain rate and temperature ranges: Constitutive modeling and identification. Materials 2021, 14, 3667. [Google Scholar] [CrossRef]
- Capaldi, F.M.; Boyce, M.C.; Rutledge, G.C. Molecular response of a glassy polymer to active deformation. Polymer 2004, 45, 1391–1399. [Google Scholar] [CrossRef]
- Liu, J.; Zheng, Y.; Zhao, Z.; Yuan, M.; Tsige, M.; Wang, S.Q. Investigating nature of stresses in extension and compression of glassy polymers via stress relaxation. Polymer 2020, 202, 122517. [Google Scholar] [CrossRef]
- Drozdov, A.; Gupta, R. Non-linear viscoelasticity and viscoplasticity of isotactic polypropylene. Int. J. Eng. Sci. 2003, 41, 2335–2361. [Google Scholar] [CrossRef]
- Mulliken, A.D.; Boyce, M.C. Mechanics of the rate-dependent elastic–plastic deformation of glassy polymers from low to high strain rates. Int. J. Solids Struct. 2006, 43, 1331–1356. [Google Scholar] [CrossRef]
- Ol’khovik, O.Y. A volumetric study of damage to polymers. Polym. Sci. USSR 1980, 22, 674–681. [Google Scholar] [CrossRef]
- Lin, P.; Cheng, S.; Wang, S.Q. Strain hardening during uniaxial compression of polymer glasses. ACS Macro Lett. 2014, 3, 784–787. [Google Scholar] [CrossRef]
- Hiermaier, S.; Huberth, F. Volume dilatation in a polycarbonate blend at varying strain rates. Eur. Phys. J. Spec. Top. 2012, 206, 173–181. [Google Scholar] [CrossRef]
- Nikaeen, P.; Samadi-Dooki, A.; Voyiadjis, G.Z.; Zhang, P.; Chirdon, W.M.; Khattab, A. Effect of plastic deformation on the nanomechanical properties of glassy polymers: An experimental study. Mech. Mater. 2021, 159, 103900. [Google Scholar] [CrossRef]
- Matsubara, S.; Terada, K.; Maeda, R.; Kobayashi, T.; Murata, M.; Sumiyama, T.; Furuichi, K.; Nonomura, C. Viscoelastic-viscoplastic combined constitutive model for glassy amorphous polymers under loading/unloading/no-load states. Eng. Comput. 2020, 37, 1703–1735. [Google Scholar] [CrossRef]
- Rey Calderón, A.A.; Díaz Díaz, A. New aspects in the mechanical behavior of a polycarbonate found by an experimental study. Adv. Mater. Sci. Eng. 2018, 2018, 1540919. [Google Scholar] [CrossRef]
- Quinson, R.; Perez, J.; Rink, M.; Pavan, A. Components of non-elastic deformation in amorphous glassy polymers. J. Mater. Sci. 1996, 31, 4387–4394. [Google Scholar] [CrossRef]
- Barbagallo, R.; Mirone, G.; Landi, L.; Bua, G. Tensile behavior of polycarbonate: Key aspects for accurate constitutive modelling and simulation. Appl. Eng. Sci. 2024, 18, 100183. [Google Scholar] [CrossRef]
- Siviour, C.R.; Jordan, J.L. High strain rate mechanics of polymers: A review. J. Dyn. Behav. Mater. 2016, 2, 15–32. [Google Scholar] [CrossRef]
- Struik, L. On the rejuvenation of physically aged polymers by mechanical deformation. Polymer 1997, 38, 4053–4057. [Google Scholar] [CrossRef]
- McKenna, G.B. Mechanical rejuvenation in polymer glasses: Fact or fallacy? J. Phys. Condens. Matter 2003, 15, S737. [Google Scholar] [CrossRef]
- Lai, D.; Yakimets, I.; Guigon, M. A non-linear viscoelastic model developed for semi-crystalline polymer deformed at small strains with loading and unloading paths. Mater. Sci. Eng. A 2005, 405, 266–271. [Google Scholar] [CrossRef]
- Mulliken, A.D. Low to High Strain Rate Deformation of Amorphous Polymers: Experiments and Modeling. Ph.D. Thesis, Massachusetts Institute of Technology, Cambridge, MA, USA, 2004. [Google Scholar]
- Naqui, S.; Robinson, I. Tensile dilatometric studies of deformation in polymeric materials and their composites. J. Mater. Sci. 1993, 28, 1421–1429. [Google Scholar] [CrossRef]
Disclaimer/Publisher’s Note: The statements, opinions and data contained in all publications are solely those of the individual author(s) and contributor(s) and not of MDPI and/or the editor(s). MDPI and/or the editor(s) disclaim responsibility for any injury to people or property resulting from any ideas, methods, instructions or products referred to in the content. |
© 2025 by the authors. Licensee MDPI, Basel, Switzerland. This article is an open access article distributed under the terms and conditions of the Creative Commons Attribution (CC BY) license (https://creativecommons.org/licenses/by/4.0/).
Share and Cite
Trejo Carrillo, D.; Díaz Díaz, A. Nonlinear Response of a Polycarbonate in Post-Yield Cyclic Tests. Polymers 2025, 17, 1535. https://doi.org/10.3390/polym17111535
Trejo Carrillo D, Díaz Díaz A. Nonlinear Response of a Polycarbonate in Post-Yield Cyclic Tests. Polymers. 2025; 17(11):1535. https://doi.org/10.3390/polym17111535
Chicago/Turabian StyleTrejo Carrillo, David, and Alberto Díaz Díaz. 2025. "Nonlinear Response of a Polycarbonate in Post-Yield Cyclic Tests" Polymers 17, no. 11: 1535. https://doi.org/10.3390/polym17111535
APA StyleTrejo Carrillo, D., & Díaz Díaz, A. (2025). Nonlinear Response of a Polycarbonate in Post-Yield Cyclic Tests. Polymers, 17(11), 1535. https://doi.org/10.3390/polym17111535