Abstract
The effect of particle size and oxidation degree of new carbon microfillers, based on coal pitch (CP) and petroleum pitch (PET) cokes, on the structure as well as thermal, mechanical, and electrical properties of the composites based on ultrahigh molecular weight polyethylene (UHMWPE) was investigated. The composites studied have a segregated structure of filler particle distribution in the UHMWPE matrix. It was found that composite with smaller CP grain fraction has the highest Young’s modulus and electrical conductivity compared to the other composites studied, which can be the result of a large contribution of flake-shaped particles. Additionally, conductivity of this composite turned out to be similar to composites with well-known carbon nanofillers, such as graphene, carbon black, and CNTs. Additionally, the relationship between electrical conductivity and Young’s modulus values of composites studied was revealed, which indicates that electrical conductivity is very sensitive to the structure of the filler phase in the polymer matrix. In general, it was established that the properties, especially the electrical conductivity, of the composites studied strongly depends on the size, shape, and oxidative treatment of CP and PET filler particles, and that the CP coke of appropriately small particle sizes and flake shape has significant potential as a conductive filler for polymer composites.
1. Introduction
Technological progress is stimulated by the development of new types of structural materials, the improvement and expansion of the properties of existing materials, or their application in new areas. Polymer composites are one of the most common types of structural materials, and they have gained popularity due to the beneficial combination of properties of both the polymer matrix and the filler, as well as the improvement of the properties of the polymer part due to the reinforcing effect of the filler. Many options for selecting the polymer matrices of composites and various types of fillers, differing not only in physical nature but also in geometric parameters, and various methods for producing composites make it possible to obtain polymer composites with a wide range of electrical, thermal, and mechanical characteristics, which, in turn, allows satisfying the most diverse requirements in the areas where they can be applied.
Among many different types of fillers, the carbon ones are worthy of special notice because they can have a positive impact on the physical and chemical properties of polymer composites [1,2,3]. Over the last few decades, polymer–carbon composites have gained wide popularity in scientific and industrial societies. As a result, the methods for their production were continuously improved [4,5,6,7,8], and the scope of their application expanded [9,10,11,12,13].
Commonly used carbon fillers are carbon fibers, carbon black, and graphite. It was found that carbon fibers significantly enhance the mechanical strength of composites [10,11] and the carbon black additive improves their thermal properties [8,9], while graphite has a positive impact on the mechanical, thermal, and electrical properties of composites [2,12,14]. Less frequently, the fillers based on fossil coals, both raw coals and processed coal products, were used to reinforce polymer matrices [2,15,16,17,18,19,20,21]. Research conducted in this area has shown a beneficial effect of carbon particles on the crosslinking process [18] and on the mechanical properties of polymer composites, including tensile and flexural strength, elongation at break, and elasticity modulus [15,16,17]. The effect of a coal-based carbon filler, resulting in the improvement of the hydrophobic and electrostatic properties of the composite in comparison to a pure polymer matrix, was also noted [19,21]. In general, it has been shown that the final properties of polymer–carbon composites, including internal structure [20] and geometrical parameters of the filler’s particles [3,22,23], depend on the amount and type of filler used.
In the last few years, interest in carbon micro- and nanofillers like carbon black, carbon nanofibers, and nanotubes [3,12], fullerenes [24], CQD [13], graphenic structures [3,14], or thermally expanded graphite [25], rapidly increased. These fillers improve the mechanical properties of carbon–polymer nanocomposites and, importantly, they may cause polymer composites to become electrically or thermally conductive [3,24]. The great interest in conductive carbon micro- and nanofillers is, among others, due to the fact that when the content of their particles in the polymer matrix is above the critical concentration (φc—percolation threshold), the resulting composite becomes electrically conductive since a conductive network of filler particles is formed in the volume of the polymer [26]. Thus, the transition from an insulator, a polymer matrix, to a conductor, a formed polymer-based composite filled with carbon particles, is realized.
One of the significant factors that affect the value of the composite percolation threshold is the dispersion system of filler particles in a matrix. If the distribution of filler particles in a polymer matrix is random, then the value of the percolation threshold is quite high. For example, for a composite of PMMA with carbon fibers [26], the φc value can be in the concentration range of 20–30 vol.%. For a polyethylene-based composite filled with graphite, φc is 14.7 wt.% [27]. And for carbon black-filled composites, φc is usually more than 7.0 vol.% [28,29]. When the filler particles are distributed in the matrix in an orderly manner, such composites are characterized by much lower φc values [30,31]. Then, for carbon black, the average value of φc is in the range of 1–5 vol.% [32,33,34], while for CNT and graphene, the percolation thresholds are less than 1.0% by volume. Winey et al. [35] showed that a composite based on polystyrene filled with single-walled nanotubes (SWCNTs) has a percolation threshold of 0.045 wt.%, while Lisunova et al. [36], for UHMWPE-based composites containing multi-walled nanotubes (MWCNTs), reported values of φc = 0.04–0.07 vol.%. In other studies [37], the authors found that a composite based on epoxy resin, in which the nanotubes were oriented under the influence of an external electric field, has a value of φc = 0.005 wt.%. Studies of PE-based composites with graphene nanoflakes showed a percolation threshold of φc = 0.21 vol.% [38]. An introduction of carbon fillers into a polymer matrix not only improves the electrical and thermal conductivity of composites [38,39,40] but also affects their mechanical and thermal properties as well as the processing parameters [41,42,43]. In general, there is a tendency that with increasing concentration of carbon filler in the composite, its modulus of elasticity, as well as the tensile and bending strength increase, and the elongation at break decreases [15,16,44].
Despite many advantages of polymer composites with carbon fillers, especially with graphene materials, the range of their applications in the industry is limited due to the high costs of production of these fillers, which significantly increases the final price of the products. One of the possible solutions to this problem is the creation of new types of carbon fillers, e.g., based on coals and their modifications [2]. Previous studies of the authors have shown that this type of filler, e.g., anthracite microfiller, may have similar properties to the well-tested carbon black, CNT, and graphene structures, enough for many applications, whereas the cost of their production is lower [20,38,45].
Although the number of articles devoted to the study of alternative carbon materials that could replace nanotubes or graphene as fillers in polymer composites is constantly growing, this topic still has a lot of development potential. Therefore, the purpose of this work was to investigate the conductive, thermophysical, and mechanical properties of polymer composites based on thermoplastic UHMWPE filled with carbon materials obtained in the process of carbonization of petroleum pitch (PET) and coal pitch (CP). The electrical conductivity of these composites was compared with polymer composites containing well-known carbon micro- and nanofillers, such as carbon black, CNTs, graphene, and anthracite. The influence of the above-mentioned carbon nano- and microfillers on the electrical properties of their composites has been studied and described by the authors earlier [38,45].
2. Experimental
2.1. Materials
The composites for this study were based on ultrahigh molecular weight polyethylene (UHMWPE) Hostalen GUR, type GHR 8110, produced by Hoechst AG (Frankfurt, Germany) in a powdered form. The polymer density is equal to 0.93 g/cm3 and the melting temperature is 137 °C. UHMWPE in the form of powder was sequentially sieved through a laboratory sieve shaker and the fraction with average particle diameters of 100 µm was used.
As fillers for the composites, two different carbon materials were used, i.e., coal pitch coke (CP) and petroleum pitch coke (PET), both obtained in a pyrolysis process, at a temperature of ~ 1200 °C in an inert atmosphere. Two different particle fractions of raw CP and PET cokes were used. Individual grain fractions were prepared by grinding the coke in a ball mill and sieving it through sieves with a mesh size of 200 and 50 µm. In the case of sieving with a mesh size of 200 µm, most particles obtained were below 100 µm in size, while very fine particles of around 2 µm in size predominantly passed through a 50 µm sieve. The designations of composites with fillers of different particle sizes are given in Table 1.

Table 1.
Types and labels of the composites used in this study.
Additionally, both cokes oxidized by the modified Hummers method were also used as fillers. The oxidation procedure was carried out in several stages. Firstly, the coke grains with a size < 50 µm were ground with sodium chloride, mixed with hot distilled water, and sonicated in an ultrasonic bath. Then, the mixture was filtered and washed with hot water to remove the chloride ions. The filtered and dried coke powder was mixed with H2SO4 and H3PO4 and then cooled to 10 °C. Next, KMnO4 was added to the mixture, and after attaining a greenish color, it was slowly heated to 45 °C. The reaction proceeded for 24 h, until the color of the slurry changed from greenish to brown. Then, the slurry was cooled to room temperature and poured onto ice with H2O2 (30%). Such obtained oxidized coke was purified with HCl solution, water, ethanol, and ether, and, next, it was dried at 50 °C. A detailed description of the oxidation procedure was previously provided by Kumanek et al. [46].
All carbon materials used as fillers in this study have layered structures, so they have the potential to be an alternative to graphene fillers.
2.2. Preparation of Composites
Polymer–carbon composites were prepared according to the procedure described previously by Mamunya et al. [45], where a scheme for the formation of a segregated structure was presented. UHMWPE and filler powders in a given ratio were thoroughly mixed in a mortar, whereby the carbon fillers electrostatically covered the surface of polymer particles. Then, the mixture was pressed in a closed steel mold at a temperature of 160 °C and a pressure of 20 MPa. The samples for measurements were in the form of discs with a diameter of 30 mm and a thickness of ~1 mm. Such a method of composite preparation led to the formation of a segregated structure of the fillers, which creates a conductive framework in the polymer matrix.
The composites with PET and CP coke fillers used in this study are listed in Table 1.
For the analysis of thermo-mechanical properties, crystallinity degree, and Young’s modulus, composites with 10 vol.% of fillers were used. In the case of electrical conductivity, composites with several different contents of fillers in the range of 0.0 to 10.0 vol.% were used to determine the percolation threshold.
2.3. Methods for Filler Investigation
Elemental analysis of initial PET and CP cokes was performed using a Carlo Erba 1106 CHN analyzer (Marlton, NJ, USA) and oxygen content was determined by the difference. The physical and chemical structure of CP and PET fillers were studied by microscopic (SEM-EDS), spectroscopic (Raman, FTIR), and X-ray diffraction (XRD) methods. Morphological studies of coke particles were performed by scanning electron microscopy using a FEI Quanta 250 FEG SEM (Thermo Scientific, Waltham, MA, USA) equipped with a secondary electron detector in a high vacuum mode with an acceleration voltage of 15 kV. The SEM coupled with an energy dispersive X-ray spectrometer (EDAX GENESIS XM 2i, EDAX, Berwyn, PA, USA) was used to determine the content of basic elements (C, O) in the samples investigated. The structural order of the carbon skeleton of PET and CP samples was characterized by Raman spectroscopy and X-ray diffraction. Raman spectra were recorded using a Witec Alpha M300C spectrometer (Oxford Instruments, High Wycombe, UK) with a Nd-YAG laser beam operated with an excitation wavelength of 532 nm and a laser power of 50 mW. For each sample, approximately 7–10 points were analyzed to obtain an insight into the sample’s structural homogeneity. The ratios of the areas of the D and G bands (D/G), estimating the order of the carbon sheets in the cokes’ structures, were determined using Witec Project 4.1 software (Oxford Instruments, High Wycombe, UK). XRD analysis was performed using a diffractometer D8 Advance (Bruker AXS, Karlsruhe, Germany) with CuKα radiation and a LYNXEYE XE-T detector (Bruker AXS, Karlsruhe, Germany). Diffraction patterns in the range of 10–90° 2θ were obtained for all samples. The mean interlayer spacing, d002, was evaluated from the position of the (002) peak by applying Bragg’s equation. The mean crystallite sizes, Lc and La, were calculated from the (002) and (110) peaks, respectively, using the Scherrer formula. The chemical structure of carbon fillers was determined by FTIR spectroscopy. IR spectra of KBr pellets with coke samples were recorded using an FTIR ATR Nicolet 6700 (Thermo Scientific, Waltham, MA, USA) spectrometer in transmission mode with a resolution of 2 cm−1 with 20 scans in the range from 4000 to 400 cm−1. The KBr pellets were covered by diluted ethanol solution with coke material and heated to remove the solvent.
2.4. Methods for the Studies of Composite Morphology
To study the morphology of the composites, 10–20 μm thick sections were prepared with a microtome. The observation of the microstructure of the composites was carried out with a Primo Star optical microscope (Carl Zeiss, Weimar, Germany). Additionally, to show the dispersion and adhesion of filler particles to the polymer matrix, raw fractures of the composites obtained by breaking them in liquid nitrogen were studied by SEM Quanta 250 FEG (Thermo Scientific, Waltham, MA, USA) in low vacuum mode and 10 kV acceleration voltage, using a low-voltage high-contrast backscattered electron detector (Thermo Scientific, Waltham, MA, USA).
2.5. Thermomechanical Analysis
Thermomechanical studies were carried out using a TMA Q400 EM thermomechanical analyzer (TA Instruments, New Castle, DE, USA) in penetration mode with a 0.5 MPa load on the sample in the temperature range of 20–180 °C (the value of penetration of the probe into the sample is denoted as deformation in the text). Composite samples measuring 7 mm × 7 mm and being 1 mm thick, cut from the disks obtained after pressing (see Section 2.2), were used for TMA studies. The samples were placed on a quartz stand and pressed on top by a quartz probe having a tip diameter of 1.2 mm.
The Young’s modulus E (MPa) was determined in the mechanical tests using the compression mode of the TMA device by increasing the load with a velocity 0.10 N/min on the sample (stress) and recording the deformation (strain) at a temperature of 20 °C. The E value was calculated from the slope of the linear stress/strain ratio. The scattering of E values when measuring 5 identical composite samples was within 3%.
2.6. DSC Studies
The melting and crystallization behavior of UHMWPE and its composites with PET and CP fillers was studied using a differential scanning calorimeter (TA Instruments DSC Q2000) under a nitrogen atmosphere. Samples were heated from room temperature to 200 °C at a rate of 20 °C/min. After melting, the samples were held in the DSC chamber for 5 min before being cooled to room temperature at a rate of 20 °C/min. From these data, the crystallization temperature (Tc) and the crystallization enthalpy (ΔHc) were determined. After completing the first complex melt–crystallization thermograms, samples were heated in the second cycle from 20 °C to 200 °C. The melting temperature (Tm) and the melting enthalpy (ΔHm) were determined in accordance with the ISO 11357-3 standard [47].
The degree of crystallinity (Xc (%)) of pure UHMWPE and its composites was calculated using Equation (1):
where ΔHm (J/g) is the experimental melting enthalpy value of the sample obtained in the second heating DSC cycle, ϕ is the mass fraction of the filler, and is the melting enthalpy of 100% crystalline UHMWPE (theoretical value of 293 J/g) [48].
2.7. Measurement of Conductivity
The conductivity of the composites was studied by the two-electrode method on direct current (DC). The sample resistance was measured with an E16-13A teraohmmeter (Radiotechnika, Riga, Latvia) at a voltage of 100 V on the electrodes. A composite sample of 30 mm in diameter was placed between two steel electrodes coated with gold on the surface that is in contact with the sample. The measuring electrode had a diameter of 25 mm. The volume conductivity of the material was calculated by the following formula:
where R is the resistance of the sample, l is its thickness, and S is the area of the electrode. The conductivity values were averaged from measurements of three samples for each composite. The scatter of resistance measurements from the measurements of three samples was within 10%.
3. Results
3.1. Characteristics of Carbon Fillers
Elemental analysis (Table 2) as well as XRD (Table 3, Figure 1) and FTIR (Table 4) results showed chemical and structural similarity of both CP and PET cokes. However, the FTIR analysis revealed that the CP coke’s chemical structure is more aromatic which corresponds to its higher true density. On the other hand, some aliphatic groups are presented in PET coke, in contrast to CP coke.

Table 2.
Chemical composition and true density of initial PET and CP cokes.

Table 3.
Structural parameters (nm) of carbon fillers.
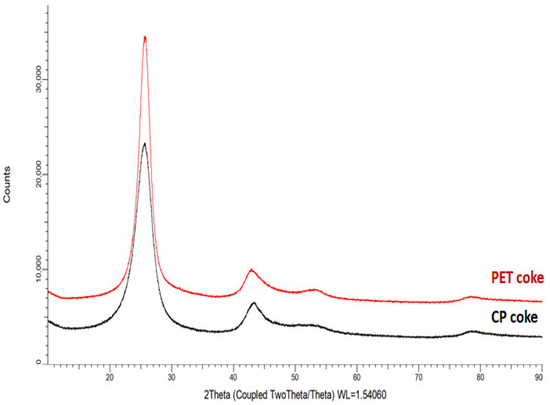
Figure 1.
XRD patterns of carbon fillers.

Table 4.
The results of FTIR analysis of carbon fillers [49,50,51,52,53,54,55].
SEM observation of coke particle morphology showed that CP coke has more distinct layered microstructure compared to PET coke (Figure 2).
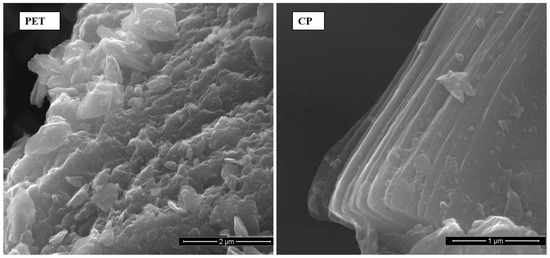
Figure 2.
SEM images of raw carbon materials, PET and CP cokes, used as composite fillers.
It was also found that during grinding the PET coke was broken down into rather irregular solid crumbs, while the CP coke grains disintegrated mainly along carbon planes giving flake-shaped particles (Figure 3). It can also be seen that the particle size of PET is on average 2 μm whereas flake-shaped CP particles are approximately the same size, but are interconnected. Perhaps this explains the better mechanical and electrical properties of the CP-1 composite (see Section 3.2.4 and Section 3.2.5).
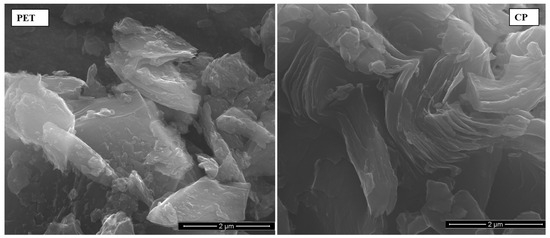
Figure 3.
SEM images of raw, deeply ground PET and CP coke grains.
Raman spectroscopic analyses confirmed the previous findings obtained by other methods. In Raman spectra of both fillers, evident bands typical for carbon materials were observed (Figure 4). The G bands occurring at 1584 cm−1 and 1586 cm−1 for the PET and CP cokes, respectively, were attributed to the E2g of polyaromatic C-C structures and the D bands at 1355 cm−1 (PET) and 1349 cm−1 (CP) associated with disordered, sp3-hybridized carbon, were attributed to in-plane defects in graphene sheets or occurrence of heteroatoms [56]. These results showed the similarity of the structural order of PET and CP samples with the domination of less ordered structures in both cokes. However, the D-band to G-band area ratio (AD/AG) of 2.140 and 2.061 for PET and CP cokes, respectively, indicates a slightly better order in the CP structure. This is also confirmed by the presence of a sharp and narrow 2D band at ~2450 cm−1 in the spectrum of CP coke, suggesting the occurrence of graphene structures with a high degree of structural order [57,58]. This band is not visible in the spectrum of the PET sample.
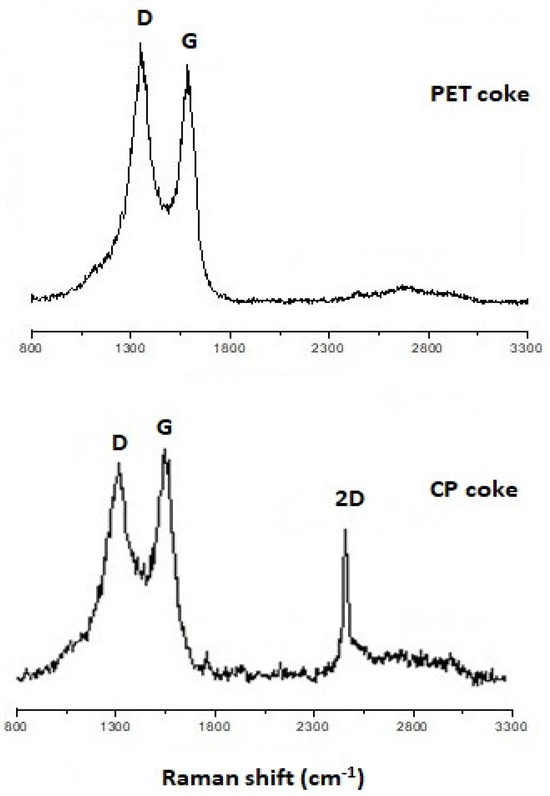
Figure 4.
Raman spectra of PET and CP cokes.
The results of SEM-EDS analyses of both grain fractions of CP and PET cokes, as well as of these cokes oxidized by the Hummers method are presented in Table 5. As expected, for both CP and PET coke the oxygen content is higher in the finer grain fraction. In the case of oxidized cokes, it is seen that the oxidation process was much stronger in CP coke compared to PET coke, which is manifested in more than twice the oxygen content in it. This is probably due to the flake shape of the fine CP particles, which have a larger surface area than irregular PET crumbs and are therefore more oxidizable. It is also clearly visible that the C/O ratio for the CP-Hum sample is much lower than for the other coke samples, which significantly influenced the properties of the composites with this filler.

Table 5.
SEM-EDS results of crushed raw and oxidized PET and CP cokes.
3.2. Characteristics of Composites
3.2.1. Structure of Composites
In the process of pressing, the polymer granules are melted and joined together, forming a continuous polymer matrix. In this case, the filler particles remain localized at the boundary between the polymer granules and form a framework in the polymer matrix. Thus, a segregated structure of the polymer composite is developed. The local filler concentration in the framework wall is much higher than the average concentration calculated for the entire sample volume, which determines the electrical properties of the composite [38,59].
Figure 5 shows the optical microscopic images of the structure of the CP-1 composite with different filler concentrations: below the percolation threshold (a), at the percolation threshold (b), and well above the percolation threshold (c). It is seen from the photos that the polymer granules are surrounded by a framework formed from the filler particles and the thickness of the framework increases with increasing filler concentration.

Figure 5.
Optical microscopic images of the structure of the UHMWPE-based CP-1 composite with different filler concentrations: (a) 0.5 vol.%; (b) 1.7 vol.%; (c) 5.0 vol.%. Particle size distribution based on optical microscopy analysis: size (μm)/fraction (%)—50/6, 60/7, 80/12, 90/10, 100/17, 120/6, 140/7, 160/3, 170/2.
SEM analyses of composite fracture morphology showed a large particle size distribution of both PET-2 and CP-2 fillers and also revealed the dispersion and adhesion of filler particles to the polymer matrix, good in the case of raw coke grains (Figure 6a,b) and worse in the case of oxidized coke particles (Figure 6c,d). Apparently, as a consequence, the composite CP-Hum has the worst mechanical and electrical characteristics (see Section 3.2.4 and Section 3.2.5). In UHMWPE–carbon filler composites there are no chemical interactions due to the absence of reactive groups, so only physical interactions exist. The influence of different physical interactions on the properties of composites is described in the reviews [60,61].
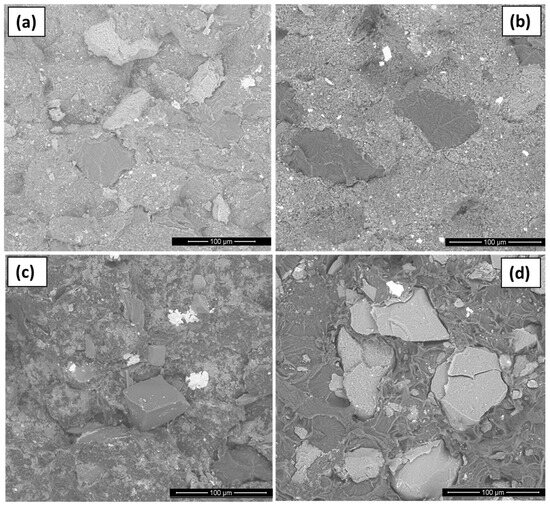
Figure 6.
SEM images of fragments of the composites PET-2 (a) and CP-2 (b) with raw coke grains as well as PET-Hum (c) and CP-Hum (d) with oxidized coke particles.
3.2.2. DSC Study of Composites
The effect of the introduction of PET or CP coke grains on the crystallization and melting behavior of UHMWPE in composites was studied using non-isothermal DSC measurements. Figure 7 and Figure 8 show the results of DSC studies, namely the peaks corresponding to the crystallization (Figure 7) and melting (Figure 8) for the composites with 10 vol.% coke fillers.
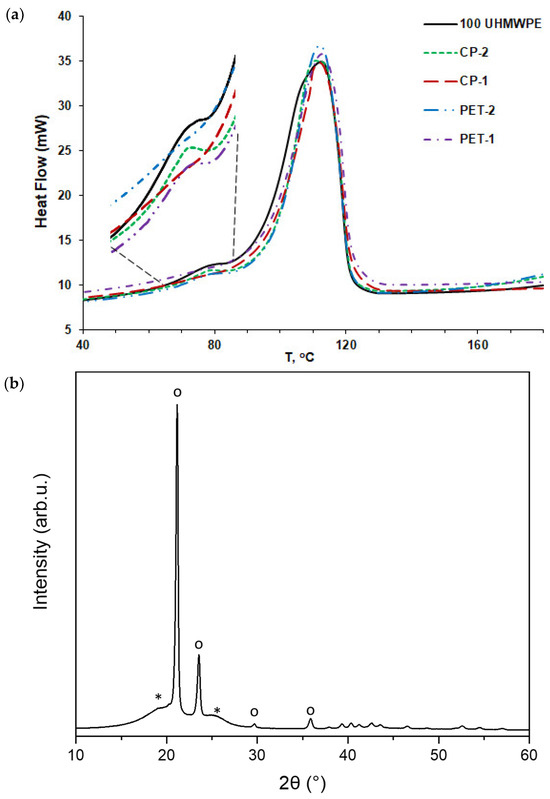
Figure 7.
(a) Crystallization peaks of pure UHMEPE and UHMWPE-based composites filled with various grain fractions of PET and CP cokes. The insert shows the behavior of the crystallization curves in the low temperature range of 60–90 °C; (b) XRD pattern typical for the composites with coke particles < 200 µm; o—orthorhombic phase of polyethylene, *—monoclinic phase of polyethylene.
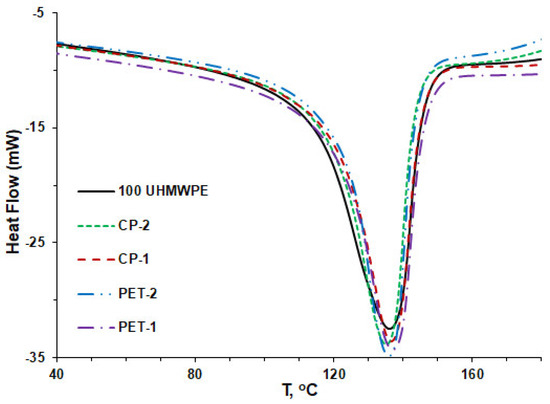
Figure 8.
Melting peaks of pure UHMWPE and UHMWPE-based composites filled with various grain fractions of PET and CP cokes (second run).
Figure 7a shows the crystallization peaks for pure UHMWPE and for the composites PET-1, PET-2, and CP-1, CP-2. As one can see, the intensity and the temperature of the peaks differ a little depending on the grain fraction of the coke filler in the composite. The curves of pure UHMWPE and the composites CP-2 and PET-2 (with bigger coke particles) have additional low-intensity crystallization peaks at a temperature of about 75 °C. According to the XRD data typically obtained for the composites studied (Figure 7b), this fine peak might correspond to the crystallization of a minor amount of a monoclinic phase of the polymer. This effect is not observed in the composites PET-1 and CP-1 with small filler particle size, most likely due to the restricted effect of smaller coke particles on the crystallization of UHMWPE at lower temperatures, which hinders crystallization of the monoclinic phase.
Figure 8 shows the DSC thermograms of the composites containing various grain fractions of PET and CP cokes in the melting region. As can be seen, the courses of the curves for individual composites are just a little different, the melting point for all composites is 137 ± 1 °C, which is close to the values presented for UHMWPE composites filled with MWCNT [62] and a UHMWPE–boron nitride system [63]. However, the calculation of the crystallinity degree (α) from the curves shows that the difference in this parameter is about 5% between the composites with coke fillers of bigger particle size and smaller particle size. As one can see in Figure 9, the values of the crystallinity degree of the composites PET-1 and CP-1 are similar to pure UHMWPE and lie in the range of 45.2–46.4%. Similar values of the degree of crystallinity for pure UHMWPE were found by Khalil et al. [64], α = 43.1%, as well as in refs. [65,66], α = 40%. In the composites PET-2 and CP-2, containing fillers with bigger particle sizes, the degree of crystallinity of the polymer matrix is higher and varies from 49.5 to 50.1%.
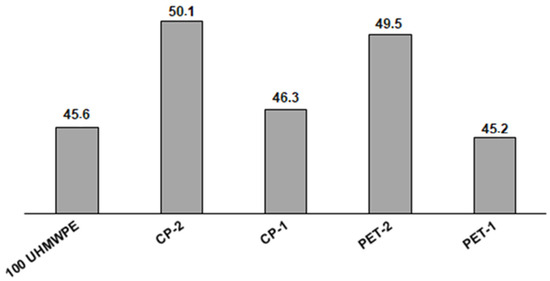
Figure 9.
Values of the degree of crystallinity (Xc) for the pure UHMWPE and UHMWPE–coke filler composites.
This phenomenon can be explained by the greater share of finer filler particles in the composites CP-1 and PET-1. The greater content of smaller particles contributes to a tighter coverage of the surface of polyethylene grains and, consequently, to a slightly lower intensity of the melting process and lowering of the degree of crystallinity.
3.2.3. Thermomechanical Studies of Composites
Figure 10 presents the results of thermomechanical analyses of composites with 10 vol.% of PET and CP cokes. The TMA curves show the values of the relative deformation of the samples depending on the temperature at a constant load of 0.5 MPa. The relative deformation ε was calculated as
where L0 is the initial sample thickness and L is the current sample thickness.
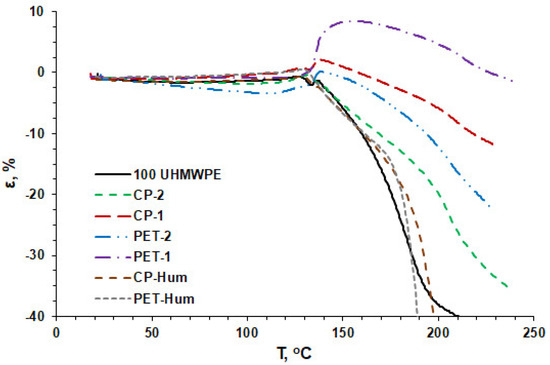
Figure 10.
Relative deformation of composites with increasing temperature of the samples.
In Figure 10, it is generally seen that when the temperature exceeds 125 °C, the deformation of the samples slightly increases, and sharply decreases just after that, which indicates a transition to the melting region of the composites (T > Tm). In this case, the deformation is due to the decreasing thickness of the samples, which leads to their negative values. However, for the composite PET-1, an increasing thickness of the sample is observed and the maximum strain reaches ~10% at a temperature of 150–160 °C.
The behavior of the composite PET-1 is completely different. Starting from a temperature of 130 °C, an increase in the thickness of the sample is observed and the maximum strain, ~10%, is reached at a temperature of 150–160 °C. Such a feature of this composite can be explained by the appearance of outgassing when approaching the temperature of the premelting region, which increases the volume of the composite first in a softened state and, further, in a melted state.
The curves for CP-Hum and PET-Hum composites are similar to each other and are characterized by a rapid increase in deformation with temperature, which is similar to pure UHMWPE. Presumably, this is the result of poorer adhesion and, consequently, a weak reinforcing effect of oxidized PET and CP coke particles.
3.2.4. Mechanical Analyses of Composites
For the studied composites, the stress/strain dependences were investigated in the stress range of 0–0.6 MPa using the compression mode, which is shown in Figure 11. These curves are similar to those obtained in previous studies for UHMWPE with different carbon fillers [67,68]. As can be seen from the figure, in this stress interval, these dependencies are almost linear and were used to determine the values of Young’s modulus from the slope of the straight lines.
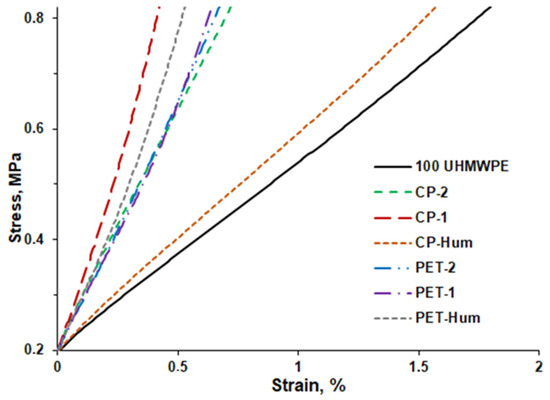
Figure 11.
Stress/strain curves for the pure UHMWPE and UHMWPE–coke filler composites.
The calculated values of the Young’s modulus for the composites are shown in Figure 12a. As can be seen, the lowest value of Young’s modulus is observed for pure UHMWPE (E = 33.7 MPa), while the highest value is for the composite CP-1 (E = 131.0 MPa). Very different values of the Young’s modulus of pure UHMWPE and its composites can be found in the literature, which may depend on sample processing and test methods (tensile or pressure) [69,70,71,72], as well as for other composite materials with different polymer matrices [24].
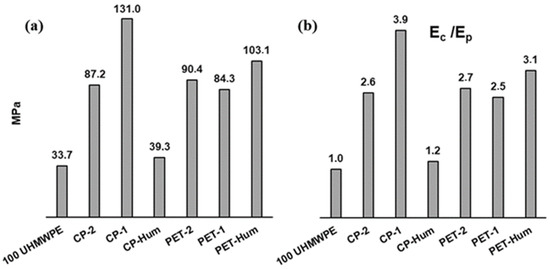
Figure 12.
Young’s moduli of pure UHMWPE and its composites with coke fillers (a) and normalized Young’s moduli (b).
There is a great variety of Young’s moduli of the composites relative to the modulus of the polymer matrix, Ec/Ep (Figure 12b). As can be seen, the composite with CP-1 demonstrates the greatest increase in the modulus (almost four times), whereas the smallest increase in modulus is observed for the composite with CP-Hum (1.17 time). The increase in the Young’s modulus values of the remaining composites related to pure UHMWPE is similar and within the range of 2.50–3.10.
The increase in Young’s modulus values after introducing the filler into the polymer matrix is the effect of the formation of a regular segregated structure of the filler when it is localized in the intergranular region of the polymer during the formation of the composite by hot compaction. The more rigid the filler framework that is formed, the higher the Young’s modulus value of the composite. The rigidity of the framework depends on the strength of the contacts between the particles of the filler, as well as on the possible interaction of the filler particles with the polymer matrix. The strength of interactions between the small flake-shaped particles of CP-1 seems to be the highest among the used CP and PET coke fillers, which results in a significantly higher Young’s modulus of the CP-1 composite compared to the other composites. The possible influence of the morphology and size of carbon fillers on the mechanical properties of polymer composites is discussed in ref. [22].
3.2.5. Electrical Conductivity of Composites
Figure 13 shows electrical conductivity values for composites containing the coke-based PET and CP fillers and the conventional carbon microfiller (anthracite) and nanofillers (graphene, MWCNT, CB). The concentration of fillers in all cases was 10 vol.%. The highest value of electrical conductivity among the composites with coke fillers was achieved for the CP-1 composite with the small coke particle size. The value of electrical conductivity for this composite is close to the value of conductivity of composites with graphene, MWCNT, and CB and is two decimal orders higher than that of composites with anthracite.
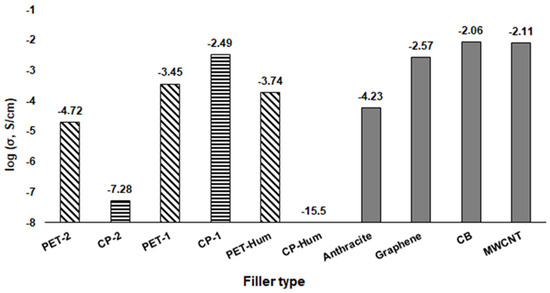
Figure 13.
Electrical conductivity of composites based on UHMWPE filled with coke fillers of various grain fractions and with conventional carbon nanofillers. The conductivity values for composites with anthracite and graphene are taken from ref. [38], and with MWCNT from ref. [73].
The electrical conductivity of composites with PET coke filler is higher than that with CP filler in the case of bigger particle sizes (PET-2 and CP-2) and lower in the case of smaller particle sizes (PET-1 and CP-1). For both coke fillers, electrical conductivity of composites increases with decreasing dimensions of filler particles. However, for the composite CP-1, the increase in the conductivity value is much more significant (the difference between composites with PET-1 and CP-1 reaches 3.5 decimal orders). This may be due to the fact that the fine, flake-shaped particles of CP coke contain a number of well-ordered carbon planes similar to graphene structures, which was revealed by the SEM (Figure 2 and Figure 3) and Raman spectroscopy (Figure 4), and are characterized by better conductivity than the more isometric crumbs of PET. Due to this, the CP-1 particles exhibit interconnectivity (Figure 3), which contributes to increased conductivity.
The electrical conductivity of composites with coke fillers oxidized by the Hummer method is completely different depending on the type of coke. For the composite with PET-Hum coke, its electrical conductivity is close to the composite with the raw PET coke of a smaller particle size, whereas the composite with CP-Hum coke is completely non-conductive. This difference is probably the result of different degrees of these fillers’ oxidation, which is significantly greater in the case of the CP-Hum filler. From previous studies, it is known that the oxidation of graphene planes reduces their electrical conductivity. The most important is the C:O ratio in graphene oxide. When it is 2:1 or lower the GO becomes nonconductive [3,59,74]. Considering the SEM-EDS results listed in Table 5, one can see that in the CP-Hum sample, the C:O ratio is <2:1; therefore, this filler is not conductive, resulting in a lack of its composite conductivity. In addition, Figure 6d shows poor adhesive contact of the CP-Hum coke particles with the polymer matrix, which also contributes to a decrease in the conductivity of the composite with CP-Hum. In general, carbon fillers prepared by the carbonization of various materials can exhibit high conductivity depending on the initial product and the size and shape of the resulting carbon particles. For example, composites based on poly(3-hydroxybutyrate-co-3-hydroxyvalerate) filled with biocarbons, which were prepared from wood dust and cellulose fibers, had a conductivity value of 0.7 S/cm [75].
Table 6 presents the electrical conductivity of composites of different polymer matrices and carbon fillers reported in the literature to compare them with UHMWPE–PET and UHMWPE–CP composites.

Table 6.
Electrical conductivity of various polymer–carbon composites—data from the literature.
Figure 14 shows the concentration dependence of the conductivity of the composite CP-1, as well as previously studied composites with anthracite microfiller, and graphene, MWCNT, or carbon black fillers [38,73].
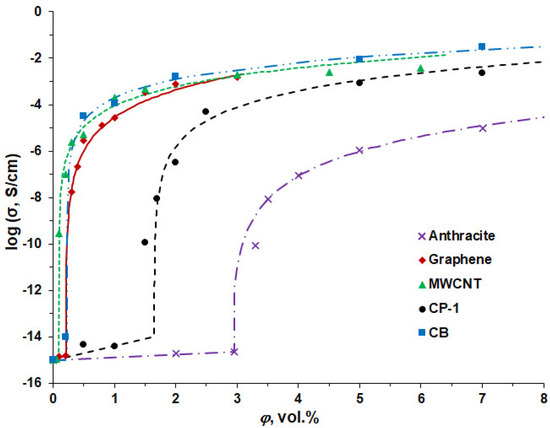
Figure 14.
Concentration dependence of the electrical conductivity of composites with different types of carbon fillers. Points are experimental values, and solid lines are calculated by the percolation equation (in the region φ > φc). Percolation curves for anthracite, graphene, and MWCNT fillers are taken from our previous studies [38,73].
To describe the relationship between the filler concentrations and the electrical conductivity of the composites, the percolation equation was used [77], which enabled us to obtain the values of the percolation parameters φc, t, σm given in Table 7:
where σm is the parameter of conductivity related to the filler phase; φ is the concentration of the filler in the composite; φc is the value of the percolation threshold; and t is the critical index.

Table 7.
Percolation parameters of electrical conductivity of the composites with the CP-1 filler and conventional carbon micro- and nanofillers [38,45,73].
For the composite CP-1, the percolation threshold value φc is 1.6 vol.%, which is almost half than for the composite with an anthracite microfiller (2.9 vol.%) but is much higher than for the other conventional carbon fillers. This can be explained by the dimensional factor, since graphene, MWCNT, and CB are nanofillers, for which the percolation threshold is always lower than for microfillers [78,79]. It was shown in [80] that a PP–graphene composite with a segregated filler structure has a percolation threshold value of 0.04 vol.%. At the same time, Zhao et al. [76] found that UHMWPE composites with the segregated filler structure of reduced graphene oxide, natural graphite, and carbon nanofibers have the percolation threshold values in the range of 1–6 phr.
The theoretical value of a critical exponent for systems with a statistical, random distribution of the conductive inclusions in nonconductive media is t = 2. Higher t values for the studied composites are due to the nonstatistical, ordered filler distribution in the polymer matrix in segregated systems. For the composite CP-1, the parameter σm, which, with some approximation, can be considered as the value of the filler conductivity, has a value an order of magnitude higher than the conductivity of anthracite and approximately equal to the conductivity of MWCNT, but an order of magnitude lower than graphene.
Good contact between filler particles affects both the elastic properties of a composite and its electrical conductivity. Thus, a correlation between the Young’s modulus and the conductivity of the composites can be expected. The relationship between the Young’s modulus and the electrical conductivity (on a logarithmic scale) of the samples studied is shown in Figure 15.
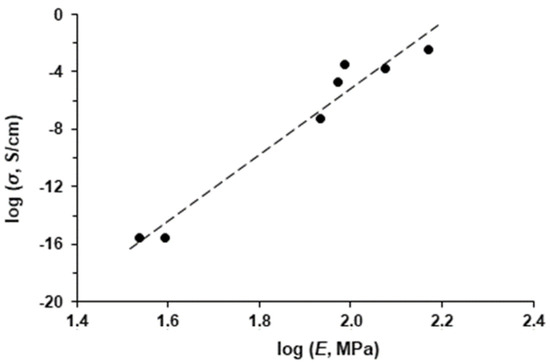
Figure 15.
Correlation between Young’s modulus (E) and electrical conductivity (σ) of UHMWPE–coke filler composites.
As can be seen, there is a linear relationship between log E and log σ. From the slope of this, it follows that the change in the Young’s modulus by 1.4 times corresponds to the change in the electrical conductivity by four orders of magnitude. From this, it can be concluded that the electrical conductivity of a composite is very sensitive to the structure of the conductive phase formed by the filler particles in the polymer matrix.
4. Discussion and Conclusions
The composites based on ultrahigh molecular weight polyethylene (UHMWPE) containing microfillers based on coal pitch (CP) and petroleum pitch (PET) cokes of different particle sizes were studied in terms of their structure as well as thermal, mechanical, and electrical properties. It was found that the structure and properties of the composites studied strongly depend on the type, size, shape, and treatment of the filler particles.
Two types of the composites contained filler particles of two different sizes, about 2 μm (CP-1, PET-1) and about 100 μm (CP-2, PET-2). CP-1 and PET-1 particles obtained by grinding of bigger grains, gain new properties, a layered microstructure becomes apparent in them and they acquire a flake-shaped form, especially the CP coke, which provides higher electrical conductivity compared to the composites, having larger particles of fillers (CP-2, PET-2).
Using microscopic (SEM-EDS), spectroscopic (Raman, FTIR), and X-ray diffraction (XRD) methods, the characteristics of carbon fillers were studied. Here, the chemical and structural similarity of both CP and PET cokes was indicated. On the other hand, the FTIR analysis revealed that the CP coke’s chemical structure is more aromatic, which corresponds to its higher true density, and some aliphatic groups are present in the PET coke in contrast to CP coke. The Raman spectroscopy analysis showed the similarity in the structural order of PET and CP samples with a predominance of a less ordered structure in both cokes, whereby a slightly better ordering of the CP structure was indicated. The 2D band in the spectrum of the CP coke suggests the occurrence of layered graphene structures with a high degree of structural order, whereas this band is not visible in the spectrum of the PET sample. The SEM analysis revealed that during grinding, the PET coke was broken down into rather irregular solid crumbs, while the CP coke grains disintegrated mainly along carbon planes giving flake-shaped particles with an average size of 2 μm, which are interconnected.
The fine, flake-shaped particles of the CP-1 coke contain a number of well-ordered carbon planes similar to graphene structures and are characterized by better conductivity than the more isometric crumbs of PET-1. As a result, the CP-1 particles exhibit interconnectivity, which contributes to increased conductivity. The conductivity of the CP-1 composite is the highest among the composites studied (3.2 × 10⁻³ S/cm) and is at the level of composites with known carbon nanofillers: graphene (2.7 × 10⁻³ S/cm), carbon black (8.7 × 10⁻³ S/cm), and CNT (7.7 × 10⁻³ S/cm). The other composites have lower conductivity in the range of 5.2 × 10⁻⁸–3.5 × 10⁻⁴ S/cm.
The studied composites demonstrate the percolation character of conductivity. Calculation of the percolation parameters according to the percolation equation shows that the percolation threshold φc of the CP-1 composite is 1.6 vol.%, which is almost half than for the composite with an anthracite microfiller (2.9 vol.%) but much higher than that for the other conventional carbon nanofillers. The parameter σm of the percolation equation, which is related to the conductivity of the filler, has a value an order of magnitude higher than the conductivity of anthracite and approximately equal to the conductivity of MWCNT, but an order of magnitude lower than that of graphene.
Mechanical measurements using the TMA method provided stress-strain relationships, from which the Young’s modulus could be calculated. The highest value of the Young’s modulus E was found for the composite CP-1, which is due to a more rigid filler framework in the polymer matrix. The Young’s moduli correlate with the conductivity values σ of the composites. The linear relationship between log E and log σ shows that the change in Young’s modulus by 1.4 times corresponds to the change in electrical conductivity by four orders of magnitude. This is evidence for the electrical conductivity of a composite being very sensitive to the structure of the conductive phase formed by the filler particles in the polymer matrix.
The comparison of mechanical and electrical properties of the composites with different size and shape of particles of the PET and CP coke fillers indicates their relationship, whereby the flake shape of the CP coke particles seems to have a greater impact on the values of electrical conductivity and Young’s modulus of the composites than the size of the filler particles themselves.
In general, the results of this study showed the significant potential of coal pitch coke (CP) of appropriately small particle size and flake shape as a conductive filler for polymer composites. Composites with this filler have properties similar to composites with carbon nanofillers such as graphene, carbon black, and MWCNT.
Author Contributions
Conceptualization, Y.M., S.P. and U.S.; Methodology, Y.M., S.P., A.H. and A.P.; Software, A.M., P.S.W. and A.P.; Validation, U.S.; Formal analysis, A.M., M.G. and U.S.; Investigation, Y.M., A.M., M.G., U.S., K.O., P.S.W., A.H., A.K. and A.P.; Data curation, K.O. and A.K.; Writing—original draft, S.P.; Writing—review and editing, Y.M., M.G., S.P. and U.S.; Visualization, A.M., M.G., K.O., P.S.W., A.H., A.K. and A.P.; Supervision, Y.M. All authors have read and agreed to the published version of the manuscript.
Funding
This research received no external funding.
Institutional Review Board Statement
Not applicable.
Data Availability Statement
Data are contained within the article.
Acknowledgments
This work was realized in the frame of the Joint Polish–Ukrainian Research Laboratory on Advanced Polymers and Composites (ADPOLCOM) and Polish–Ukrainian (PAS-NASU) joint project “Development of modern polymer nanocomposites with various graphene-like carbon nanofillers”.
Conflicts of Interest
The authors declare no conflicts of interest.
References
- Stabik, J.; Rojek, M.; Suchoń, Ł.; Mrowiec, K. Carbon materials as fillers for polymer matrix composites. Arch. Mater. Sci. Eng. 2012, 53, 29–37. [Google Scholar]
- Eterigho-Ikelegbe, O.; Kelvin, O.Y.; Bada, S. Coal as a Filler in Polymer Composites: A Review. Resour. Conserv. Recycl. 2021, 174, 105756. [Google Scholar] [CrossRef]
- Szeluga, U.; Pusz, S.; Kumanek, B.; Olszowska, K.; Kobyliukh, A.; Trzebicka, B. Effect of graphene filler structure on electrical, thermal, mechanical, and fire-retardant properties of epoxy-graphene nanocomposites—A review. Crit. Rev. Solid State Mater. Sci. 2021, 46, 152–187. [Google Scholar] [CrossRef]
- Sajid, S.; Shaha, A.; Nasir, H. Exfoliation of graphene and its application as filler in reinforced polymer nanocomposites. Nano Hybrids Compos. 2016, 11, 7–21. [Google Scholar] [CrossRef]
- Harito, C.; Bavykin, D.; Yuliarto, B.; Dipojono, H.; Walsh, F. Polymer nanocomposites having a high filler content: Synthesis, structures, properties, and applications. Nanoscale 2019, 11, 4653–4682. [Google Scholar] [CrossRef] [PubMed]
- Srivastava, V.K.; Jain, P.K.; Kumar, P.; Pegoretti, A.; Bowenet, C.R. Smart manufacturing process of carbon-based low-dimensional structures and fiber-reinforced polymer composites for engineering applications. J. Mater. Eng. Perform. 2020, 29, 4162–4186. [Google Scholar] [CrossRef]
- Voznyakovskii, A.P.; Neverovskaya, A.Y.; Otvalko, J.A.; Gorelova, E.V.; Zabelina, A.N.; Lebedev, S.V. Facile synthesis of 2D carbon structures as a filler for polymer composites. Nanosyst. Phys. Chem. Math. 2018, 9, 125–128. [Google Scholar] [CrossRef]
- Giunta, G.; Chiricotto, M.; Jackson, I.; Karimi-Varzaneh, H.; Carbone, P. Multiscale modelling of heterogeneous fillers in polymer composites: The case of polyisoprene and carbon black. J. Phys. Condens. Matter 2021, 33, 194003–194012. [Google Scholar] [CrossRef] [PubMed]
- Chen, R.; Yu, R.; Pei, X.; Wang, W.; Li, D.; Xu, Z.; Luo, S.; Tangd, Y.; Deng, H. Interface design of carbon filler/polymer composites for electromagnetic interference shielding. New J. Chem. 2021, 45, 8370–8385. [Google Scholar] [CrossRef]
- Kwon, Y.J.; Park, J.B.; Jeon, Y.P.; Hong, J.Y.; Park, H.S.; Lee, J.U. A review of polymer composites based on carbon fillers for thermal management applications: Design, preparation, and properties. Polymers 2021, 13, 1312. [Google Scholar] [CrossRef]
- Li, B.; Zhang, J.; Wei, J.; Zhang, Q. Preparation and sealing performance of a new coal dust polymer composite sealing material. Adv. Mater. Sci. Eng. 2018, 2018, 8480913. [Google Scholar] [CrossRef]
- Virpe, K.; Deshpande, A.; Kulkarni, A. A review on tribological behavior of polymer composite impregnated with carbon fillers. AIP Conf. Proc. 2020, 2311, 070030-1–070030-7. [Google Scholar] [CrossRef]
- Latif, Z.; Shahid, K.; Anwer, H.; Shahid, R.; Ali, M.; Lee, K.H.; Alshareef, M. Carbon quantum dots (CQDs)-modified polymers: A review of non-optical application. Nanoscale 2024, 16, 2265–2288. [Google Scholar] [CrossRef]
- Rahaman, M.; Aldalbahi, A.; Nayak, L.; Giri, R. Electrical conductivity of polymer–carbon composites: Effects of different factors. In Carbon-Containing Polymer Composites Springer Series on Polymer and Composite Materials; Springer: Singapore, 2019; pp. 159–210. [Google Scholar] [CrossRef]
- Al-Majali, Y.A.; Chirume, C.T.; Marcum, E.P.; Daramola, D.A.; Kappagantula, K.S.; Trembly, J.P. Coal-filler-based thermoplastic composites as construction materials: A new sustainable end-use application. ACS Sustain. Chem. Eng. 2019, 7, 16870–16878. [Google Scholar] [CrossRef]
- Phillips, L.N.; Kappagantula, K.S.; Trembly, J.P. Mechanical performance of thermoplastic composites using bituminous coal as filler: Study of a potentially sustainable end-use application for Appalachian coal. Polym. Compos. 2017, 40, 591–599. [Google Scholar] [CrossRef]
- Stabik, J.; Chomiak, M. Influence of casting velocity on surface resistivity of epoxy-hard coal graded composites. Archiv. Mater. Sci. Eng. 2011, 47, 48–56. [Google Scholar]
- Kurzeja, L.; Szeluga, U.; Galy, J.; Sautereau, H.; Issartel, N. Effect of coal on the rheological and mechanical properties of epoxy matrix. Macromol. Symp. 2001, 194, 169–174. [Google Scholar] [CrossRef]
- Polok-Rubiniec, M.; Wlodarczyk-Fligier, A.; Chmielnicki, B. The properties of a polypropylene matrix composite with anthracite filler. Arch. Metall. Mater. 2021, 66, 305–311. [Google Scholar] [CrossRef]
- Pusz, S.; Szeluga, U.; Nagel, B.; Czajkowska, S.; Galina, H.; Strzezik, J. The influence of structural order of anthracite fillers on the curing behavior, morphology, and dynamic mechanical thermal properties of epoxy composites. Polym. Compos. 2014, 36, 336–347. [Google Scholar] [CrossRef]
- Polok-Rubiniec, M.; Wlodarczyk-Fligier, A. Polypropylene matrix composite with charcoal filler. J. Achiev. Mater. Manufact. Eng. 2020, 103, 60–66. [Google Scholar] [CrossRef]
- Lu, C.-T.; Weerasinghe, A.; Maroudas, D.; Ramasubramaniam, A. A Comparison of the elastic properties of graphene- and fullerene-reinforced polymer composites: The role of filler morphology and size. Sci. Rep. 2016, 6, 31735–31744. [Google Scholar] [CrossRef]
- Shmalko, V.; Karchakova, V.; Zelenskyi, O.; Cheshko, F. Determining the Filler Activity in the Sintering of Pitch Composites. In Fillers-Synthesis, Characterization and Industrial Application; Intech Open: London, UK, 2019. [Google Scholar] [CrossRef]
- Latif, Z.; Ali, M.; Lee, E.-J.; Zubair, Z.; Lee, K.H. Thermal and Mechanical Properties of Nano-Carbon-Reinforced Polymeric Nanocomposites: A Review. J. Compos. Sci. 2023, 7, 441. [Google Scholar] [CrossRef]
- Yasmin, A.; Luo, J.-J.; Daniel, I.M. Processing of expanded graphite reinforced polymer nanocomposites. Compos. Sci. Technol. 2006, 66, 1179–1186. [Google Scholar] [CrossRef]
- Qu, M.; Nilsson, F.; Schubert, D.W. Effect of filler orientation on the electrical conductivity of carbon fiber/PMMA composites. Fibers 2018, 6, 3. [Google Scholar] [CrossRef]
- Alshammari, B.A.; Al-Mubaddel, F.S.; Karim, M.R.; Hossain, M.; Al-Mutairi, A.S.; Wilkinson, A.N. Addition of graphite filler to enhance electrical, morphological, thermal, and mechanical properties in poly (ethylene terephthalate): Experimental characterization and material modeling. Polymers 2019, 11, 1411. [Google Scholar] [CrossRef]
- Kasgoz, A.; Akın, D.; Ayten, A.İ.; Durmus, A. Effect of different types of carbon fillers on mechanical and rheological properties of cyclic olefin copolymer (COC) composites. Compos. Part B Eng. 2014, 66, 126–135. [Google Scholar] [CrossRef]
- Toghchi, M.J.; Campagne, C.; Cayla, A.; Bruniaux, P.; Loghin, C.; Cristian, I.; Burgnies, L.; Chen, Y. Electrical conductivity enhancement of hybrid PA6,6 composite containing multiwall carbon nanotube and carbon black for shielding effectiveness application in textiles. Synth. Met. 2019, 251, 75–84. [Google Scholar] [CrossRef]
- Kunz, K.; Krause, B.; Kretzschmar, B.; Juhasz, L.; Kobsch, O.; Jenschke, W.; Ullrich, M.; Pötschke, P. Direction dependent electrical conductivity of polymer/carbon filler composites. Polymers 2019, 11, 591. [Google Scholar] [CrossRef]
- Perets, Y.; Aleksandrovych, L.; Melnychenko, M.; Lazarenko, M.O.; Vovchenko, L.; Matzui, L. The electrical properties of hybrid composites based on multiwall carbon nanotubes with graphite nanoplatelets. Nanoscale Res. Lett. 2017, 12, 406–416. [Google Scholar] [CrossRef]
- Sun, Y.; Bao, H.-D.; Guo, Z.-X.; Yu, J. Modelling of the electrical percolation of mixed carbon fillers in polymer-based composites. Macromolecules 2009, 42, 459–463. [Google Scholar] [CrossRef]
- Merzouki, A.; Haddaoui, N. Electrical conductivity modeling of polypropylene composites filled with carbon black and acetylene black. Int. Sch. Res. Not. 2012, 2012, 493065. [Google Scholar] [CrossRef]
- Choi, H.J.; Kim, M.S.; Ahn, D.; Yeo, S.Y.; Lee, S. Electrical percolation threshold of carbon black in a polymer matrix and its application to antistatic fibre. Sci. Rep. 2019, 9, 6338–6350. [Google Scholar] [CrossRef] [PubMed]
- Winey, K.; Kashiwagi, T.; Mu, M. Improving electrical conductivity and thermal properties of polymers by the addition of carbon nanotubes as fillers. MRS Bull. 2007, 32, 348–353. [Google Scholar] [CrossRef]
- Lisunova, M.O.; Mamunya, Y.P.; Lebovka, N.I.; Melezhyk, A.V. Percolation behaviour of ultrahigh molecular weight polyethylene/multi-walled carbon nanotubes composites. Eur. Polym. J. 2007, 43, 949–958. [Google Scholar] [CrossRef]
- Khan, S.U.; Pothnis, J.R.; Kim, J.-K. Effects of carbon nanotube alignment on electrical and mechanical properties of epoxy nanocomposites. Compos. Part A Appl. Sci. Manuf. 2013, 49, 26–34. [Google Scholar] [CrossRef]
- Maruzhenko, O.; Mamunya, Y.; Boiteux, G.; Pusz, S.; Szeluga, U.; Pruvost, S. Improving the thermal and electrical properties of polymer composites by ordered distribution of carbon micro- and nanofillers. Int. J. Heat Mass Transf. 2019, 138, 75–84. [Google Scholar] [CrossRef]
- Ohayon-Lavi, A.; Buzaglo, M.; Ligati, S.; Peretz-Damari, S.; Shachar, G.; Pinsk, N.; Riskin, M.; Schatzberg, Y.; Genish, I.; Regev, O. Compression-enhanced thermal conductivity of carbon loaded polymer composites. Carbon 2020, 163, 333–340. [Google Scholar] [CrossRef]
- Mohammad, H.; Stepashkin, A.; Tcherdyntsev, V. Effect of graphite filler type on the thermal conductivity and mechanical behavior of polysulfone-based composites. Polymers 2022, 14, 399. [Google Scholar] [CrossRef]
- Abdul Khalil, H.P.S.; Noriman, N.Z.; Ahmad, M.N.; Ratnam, M.M.; Nik Fuaad, N.A. Polyester composites filled carbon black and activated carbon from bamboo (gigantochloa scortechinii): Physical and mechanical properties. J. Reinf. Plast. Compos. 2007, 26, 305–320. [Google Scholar] [CrossRef]
- Lee, J.H.; Jang, Y.K.; Hong, C.E.; Kim, N.H.; Li, P.; Lee, H.K. Effect of carbon fillers on properties of polymer composite bipolar plates of fuel cells. J. Power Sources 2009, 193, 523–529. [Google Scholar] [CrossRef]
- Silva, C.R.; Lago, R.M.; Velosob, H.S.; Patricio, P.S. Use of Amphiphilic composites based on clay/carbon nanofibers as fillers in UHMWPE. J. Braz. Chem. Soc. 2018, 29, 278–284. [Google Scholar] [CrossRef]
- Aguele, F.O.; Madufor, C.I.; Adekunle, K.F. Comparative study of physical properties of polymer composites reinforced with uncarbonised and carbonised coir. Open J. Polym. Chem. 2014, 4, 73–82. [Google Scholar] [CrossRef][Green Version]
- Mamunya, Y.; Matzui, L.; Vovchenko, L.; Maruzhenko, O.; Oliynyk, V.; Pusz, S.; Kumanek, B.; Szeluga, U. Influence of conductive nano- and microfiller distribution on electrical conductivity and EMI shielding properties of polymer/carbon composites. Compos. Sci. Technol. 2019, 170, 51–59. [Google Scholar] [CrossRef]
- Kumanek, B.; Szeluga, U.; Pusz, S.; Borowski, A.F.; Wrobel, P.S.; Bachmatiuk, A.; Kubacki, J.; Musioł, M.; Maruzhenko, O.; Trzebicka, B. Multi-layered graphenic structures as the effect of chemical modification of thermally treated anthracite. Fuller. Nanotub. Carbon Nanostructures 2018, 26, 405–416. [Google Scholar] [CrossRef]
- ISO 11357-3; Determination of Temperature and Enthalpy of Melting and Crystallization. International Organization for Standarization: Geneva, Switzerland, 2018.
- Hosseinnezhad, R.; Vozniak, I.; Romano, D.; Rastogi, S.; Regnier, G.; Piorkowska, E.; Galeski, A. Formation of UHMWPE Nanofibers during Solid-State Deformation. Nanomaterials 2022, 12, 3825. [Google Scholar] [CrossRef]
- Wang, J.; He, Y.; Yang, Y.; Xie, W.; Ling, X. Research on quantifying the hydrophilicity of leached coals by FTIR spectroscopy. Physicochem. Probl. Min. Process 2017, 53, 227–239. [Google Scholar] [CrossRef]
- Zambrano, N.P.; Duarte, L.J.; Poveda-Jaramillo, J.C.; Picón, H.J.; Martínez, O.F.; Nino-Gómez, M.E. Delayed Coker Coke Characterization: Correlation between Process Conditions, Coke Composition, and Morphology. Energy Fuels 2018, 32, 2722–2732. [Google Scholar] [CrossRef]
- Cui, T.; Fan, W.; Dai, Z.; Guo, Q.; Yu, G.; Wang, F. Variation of the coal chemical structure and determination of the char molecular size at the early stage of rapid pyrolysis. Appl. Energy 2016, 179, 650–659. [Google Scholar] [CrossRef]
- Xia, W.; Yang, J.; Zhao, Y.; Zhu, B.; Wang, Y. Improving floatability of Taixi anthracite coal of mild oxidation by grinding. Physicochem. Probl. Min. Process 2012, 48, 393–401. [Google Scholar] [CrossRef]
- Szeluga, U.; Pusz, S.; Kumanek, B.; Myalski, J.; Hekner, B.; Tsyntsarski, B. Carbon foam based on epoxy/novolac precursor as porous micro-filler of epoxy composites. Compos. Part A Appl. Sci. Manuf. 2018, 105, 28–39. [Google Scholar] [CrossRef]
- Khan, M.; Tiehu, L.; Zhao, T.K.; Ali, Z.; Malik, A.; Khan, A. Effect of multi walled carbon nanotubes and diamond nanoparticles on the structure and properties of carbon foams. Diam. Relat. Mater. 2017, 79, 119–126. [Google Scholar] [CrossRef]
- Yang, S.; Wang, F.; Tang, Q.; Wang, P.; Xu, Z.; Liang, J. Utilization of ultra-light carbon foams for the purification of emulsified oil wastewater and their adsorption kinetics. Chem. Phys. 2019, 516, 139–146. [Google Scholar] [CrossRef]
- Tuinstra, F.; Koenig, J.L. Raman spectrum of graphite. J. Chem. Phys. 1970, 53, 1126–1130. [Google Scholar] [CrossRef]
- Ferrari, A.C. Raman spectroscopy of graphene and graphite: Disorder, electronephonon coupling, doping and nonadiabatic effects. Solid State Commun. 2007, 143, 47–57. [Google Scholar] [CrossRef]
- Potgieter-Vermaak, S.; Maledi, N.; Wagner, N.; Van Heerden, J.H.P. Raman spectroscopy for the analysis of coal: A review. J. Raman Spectrosc. 2011, 42, 123–129. [Google Scholar] [CrossRef]
- Pang, H.; Xu, L.; Yan, D.-X.; Li, Z.-M. Conductive polymer composites with segregated structures. Prog. Polym. Sci. 2014, 39, 1908–1933. [Google Scholar] [CrossRef]
- Zhang, W.; Dehghani-Sanij, A.A.; Blackburn, R.S. Carbon based conductive polymer composites. J. Mater. Sci. 2007, 42, 3408–3418. [Google Scholar] [CrossRef]
- Tripathi, S.N.; Rao, S.G.S.; Mathurb, A.B.; Jasrab, R. Polyolefin/graphene nanocomposites: A review. RSC Adv. 2017, 7, 23615–23632. [Google Scholar] [CrossRef]
- Eun, J.; Kim, D.; Jang, I.; Sung, S.; Kim, M.; Choi, B.; Kang, S.; Kim, M.; Lee, J. A study on mechanical properties and thermal properties of UHMWPE/MWCNT composite fiber with MWCNT content and draw ratio. J. Eng. Fibers Fabr. 2022, 17, 15589250221108484. [Google Scholar] [CrossRef]
- Guo, Y.; Cao, C.; Cheng, H.; Chen, Q.; Huang, B.; Luo, F.; Qian, Q. Thermal performances of UHMWPE/BN composites obtained from different blending methods. Adv. Polym. Technol. 2019, 2019, 8687450. [Google Scholar] [CrossRef]
- Khalil, Y.; Hopkinson, N.; Kowalski, A.; Fairclough, J. Investigating the feasibility of processing activated carbon/uhmwpe polymer composite using laser powder bed fusion. Polymers 2022, 14, 3320. [Google Scholar] [CrossRef]
- Khasraghi, S.; Rezaei, M. Preparation and characterization of UHMWPE/HDPE/MWCNT melt-blended nanocomposites. J. Thermopl. Comp. Mater. 2015, 28, 305–326. [Google Scholar] [CrossRef]
- Rocha, L.; Cordeiro, S.; Ferreira, L.; Ramos, F.; Marques, M. Effect of carbon fillers in ultrahigh molecular weight polyethylene matrix prepared by twin-screw extrusion. Mater. Sci. Appl. 2016, 7, 863–881. [Google Scholar] [CrossRef]
- Vadivel, H.; Al-Maqdasi, Z.; Pupure, L.; Joffe, R.; Kalin, M.; Emami, N. Time-dependent properties of newly developed multiscale UHMWPE composites. Polym. Test. 2022, 105, 107400–107415. [Google Scholar] [CrossRef]
- Bhusari, S.; Sharma, V.; Bose, S.; Basu, B. HDPE/UHMWPE hybrid nanocomposites with surface functionalized graphene oxide towards improved strength and cytocompatibility. J. R. Soc. Interface 2019, 16, 20180273–20180289. [Google Scholar] [CrossRef]
- Mahfuz, H.; Khan, M.; Leventouri, T.; Liarokapis, E. Investigation of MWCNT reinforcement on the strain hardening behavior of ultrahigh molecular weight polyethylene. J. Nanotechnol. 2011, 2011, 637395. [Google Scholar] [CrossRef]
- Salimon, A.; Statnik, E.; Zadorozhnyy, M.; Senatov, F.; Zherebtsov, D.; Safonov, A.; Korsunsky, A. Porous open-cell UHMWPE: Experimental study of structure and mechanical properties. Materials 2019, 12, 2195. [Google Scholar] [CrossRef]
- Grinev, V.; Krasheninnikov, V.; Zabolotnov, A.; Ladygina, T.; Brevnov, P.; Novokshonova, L.; Berlin, A. The Effect of filler type on the mechanical properties of composite materials based on ultra-high-molecular-weight polyethylene. Polym. Sci. Ser. D 2018, 11, 202–208. [Google Scholar] [CrossRef]
- Amini, M.; Ramazani, A.; Kheradmand, A. In-situ polymerization of UHMWPE using bi-supported ziegler-natta catalyst of MoS2 Oxide/MgCl2 (Ethoxide type)/TiCl4/TiBa: Study of thermo-mechanical properties of system. Int. J. New. Chem. 2019, 6, 87–108. [Google Scholar] [CrossRef]
- Vovchenko, L.; Matzui, L.; Oliynyk, V.; Launets, V.; Mamunya, Y.; Maruzhenko, O. Nanocarbon/polyethylene composites with segregated conductive network for electromagnetic interference shielding. Mol. Cryst. Liq. 2018, 672, 186–198. [Google Scholar] [CrossRef]
- Potts, J.R.; Dreyer, D.R.; Bielawski, C.W.; Ruoff, R.S. Graphene-based polymer nanocomposites. Polymer 2011, 52, 5–25. [Google Scholar] [CrossRef]
- Unterweger, C.; Ranzinger, M.; Duchoslav, J.; Piana, F.; Pasti, I.; Zeppetzauer, F.; Breitenbach, S.; Stifter, D.; Fürst, C. Electrically Conductive Biocomposites Based on Poly(3-hydroxybutyrate-co-3-hydroxyvalerate) and Wood-Derived Carbon Fillers. J. Compos. Sci. 2022, 6, 228. [Google Scholar] [CrossRef]
- Zhao, Y.; Jiang, T.; Wang, Y.; Wu, X.; Jiang, P.; Shi, S.; Sun, K.; Tang, B.; Li, W.; Yu, J. Study on preparation and properties of ultrahigh molecular weight polyethylene composites filled with different carbon materials. ACS Omega 2022, 7, 5547–5557. [Google Scholar] [CrossRef] [PubMed]
- Stauffer, D.; Aharony, A. Introduction to Percolation Theory; Taylor and Francis: London, UK, 1992. [Google Scholar]
- Szeluga, U.; Kumanek, B.; Trzebicka, B. Synergy in hybrid polymer/nanocarbon composites. A review. Compos. Part A 2015, 73, 204–231. [Google Scholar] [CrossRef]
- Du, J.; Cheng, H.-M. The fabrication, properties, and uses of graphene/polymer composites. Macromol. Chem. Phys. 2012, 213, 1060–1077. [Google Scholar] [CrossRef]
- Kim, K.H.; Jang, J.-U.; Yoo, G.Y.; Kim, S.H.; Oh, M.J.; Kim, S.Y. Enhanced electrical and thermal conductivities of polymer composites with a segregated network of graphene nanoplatelets. Materials 2023, 16, 5329. [Google Scholar] [CrossRef]
Disclaimer/Publisher’s Note: The statements, opinions and data contained in all publications are solely those of the individual author(s) and contributor(s) and not of MDPI and/or the editor(s). MDPI and/or the editor(s) disclaim responsibility for any injury to people or property resulting from any ideas, methods, instructions or products referred to in the content. |
© 2024 by the authors. Licensee MDPI, Basel, Switzerland. This article is an open access article distributed under the terms and conditions of the Creative Commons Attribution (CC BY) license (https://creativecommons.org/licenses/by/4.0/).