2.2. Dynamic Mechanical Analysis Test
Dynamic mechanical analysis refers to the technique of applying alternating loads on the material to measure the corresponding strain response [
24]. The complex modulus can be expressed as
E* =
E′ +
iE″, where the storage modulus (
E′) and loss modulus (
E″) reflect the rigidity and viscosity of the sample, respectively. The loss factor (tanδ) of the material is represented by
E″/
E′, that is, tanδ =
E″/
E′.
Dynamic frequency scanning and multi-frequency dynamic temperature scanning experiments of PA6 film are carried out on a dynamic thermo-mechanical analyzer (DMA 242 E, NETZSCH, Selb, Germany). The PA6 cast film was cut into test samples of 13.50 × 5.00 × 0.250 (±0.010) mm3, and the test direction was determined to be the MD direction. In order to determine the isoconfigurational test conditions (material in the same aging state), the material was rejuvenated using an annealing process, that is, heating the material above the Tg, maintaining for a period of time, and then cooling to room temperature (25 °C) to reduce the internal residual stress and eliminate the thermal history. Due to the inherent variability in DMA testing and slight differences between samples, data from each set of analyses may exhibit minor fluctuations or variations. Consequently, each set of experiments was repeated more than three times, and a representative set of data was selected for further analysis to ensure the usability and scientific validity of the results.
- (1)
Dynamic frequency scanning test
Dynamic frequency scanning tests were conducted on PA6 film samples using DMA in the frequency range of 0.1 Hz to 100 Hz, and the scanning tests were carried out from low frequency to high frequency. The temperature was controlled by liquid nitrogen, adopting the step-up heating method, with a temperature range of −10 °C to 110 °C and a step increment of 10 °C. Prior to each temperature test, the specimens underwent a 10-min isothermal treatment to ensure thermal equilibrium between the internal and external temperatures of the samples. The variation curves of the storage modulus (E′), loss modulus (E″), and loss factor (tanδ) of PA6 film under different conditions across the frequency sweep range were recorded. Based on the experimental measurement and recording procedure, the dynamic loading strain amplitude in DMA was set to 0.1% to ensure that the material response remained in the linear viscoelastic region. This is because a smaller strain amplitude can ensure better measurement accuracy and reduce the influence of nonlinear effects, thereby making the experimental results more predictable and repeatable. In addition, the pre-strain is 0.4% and the absolute target amplitude is 20 μm to ensure that the sample can maintain a stable state during dynamic loading. The maximum dynamic force (Fdyn) is 2.182 N, which is automatically adjusted by the machine based on the sample size in order to ensure that this value is within a controllable range, thereby preventing overload and potential damage to the test sample.
- (2)
Multi-frequency dynamic temperature scanning test
PA6 film samples were heated from 0 °C to 160 °C at a heating rate of 3 °C/min, and the loading frequencies were 1, 2, 3, 5, 10, 15, 20, 30, and 50 Hz, respectively. The curves of dynamic modulus (E′, E″) and tanδ versus temperature were recorded at different frequencies. Similarly, in order to ensure the rigor and validity of the experiments results, the experimental conditions were kept consistent across different variables. The dynamic loading strain amplitude in DMA was set at 0.1%, with a pre-strain of 0.4%, the absolute target amplitude was 20 μm, and the Fdyn was 2.182 N.
2.3. Time–Temperature Superposition (TTS)
The time–temperature superposition principle is that the effect of temperature on the modulus of the material can be equivalent by changing the loading time of the material. Such materials are often referred to as thermorheologically simple materials [
25], and the relaxation time of the molecular chain has the same temperature dependence. There are typically two common methods for determining the long-term mechanical properties of materials: long-term mechanical testing and accelerated characterization [
26]. Long-term mechanical testing involves directly measuring the mechanical properties of materials under long-term loading and temperature conditions, thereby delivering an accurate assessment of their performance over time. Unfortunately, this method has a long testing cycle, and general experimental equipment and environment are insufficient to meet the requirements. Accelerated characterization involves conducting short-term mechanical tests on materials and constructing long-term mechanical performance master curves based on the time–temperature superposition approach, which facilitates understanding and predicting of the long-term mechanical properties of materials. However, this method still has limitations as it is only applicable to simple materials and without considering the internal damage of materials.
- (1)
Williams–Landel–Ferry (WLF) equation
The free volume theory quantitatively describes molecular free volume changes within polymers. On this basis, the WLF incorporates temperature effects, especially concerning the glass transition, thereby providing a more comprehensive explanation of the rheological behavior and dynamic properties of high-polymer materials under varying temperature conditions. According to the free volume theory, the viscosity (
η) and free volume fraction (
f) of a material should satisfy the Doolittle equation [
27], Equation (1):
where
A,
B are material constants.
According to time–temperature superposition, the mechanical behavior of viscoelastic materials at different time scales will also change with the change of temperature. Furthermore, it is assumed that the free volume fraction of the material has a linear relationship with temperature, and is described as follows:
where,
βT is the thermal expansion coefficient,
Tr is the reference temperature, and
f0 is the free volume fraction of the material under
Tr. The time–temperature superposition horizontal shift factor is denoted as
aT =
η/
η0,
η0 is the viscosity of the material under
Tr,
η is the viscosity of the material under temperature
T, and the horizontal shift factor (log
aT) is expressed as:
According to Equation (2), Equation (3) can be further expressed as:
where
C1 =
B/2.303
f and
C2 =
f0/
βT are material parameters. Equation (4) is the famous WLF equation [
22], which has been widely used in the temperature-related study of viscoelastic mechanical behavior of polymers. Specifically, the WLF equation considers the influence of temperature on polymer chain diffusion and mobility rates through parameters
C1 and
C2, describing the viscoelastic behavior of high polymer materials across different temperatures. Compared to the free volume theory alone, this approach more effectively addresses the predictive needs for material performance in practical engineering applications.
- (2)
Arrhenius law
Almost all temperature-dependent laws of molecular motion obey the Arrhenius law, and the Arrhenius equation is expressed as follows:
where
τ is the physical quantity of the system,
A is a constant,
Ea is the activation energy,
R is the molar volume constant, and
T is the thermodynamic temperature. The time–temperature superposition horizontal shift factor is denoted as
aT =
τ/
τ0. Where
τ0 is the relaxation time of the polymer under
Tr and
τ is the relaxation time under temperature
T, then the horizontal shift factor is expressed as:
Comparing Equation (4) and Equation (6), let the parameters C2 = Tr, C1 = (1/2.303)× Ea/RTr), it can be found that the Arrhenius and WLF are equivalent.
2.4. Thermo-Rheological Properties of PA6 Film
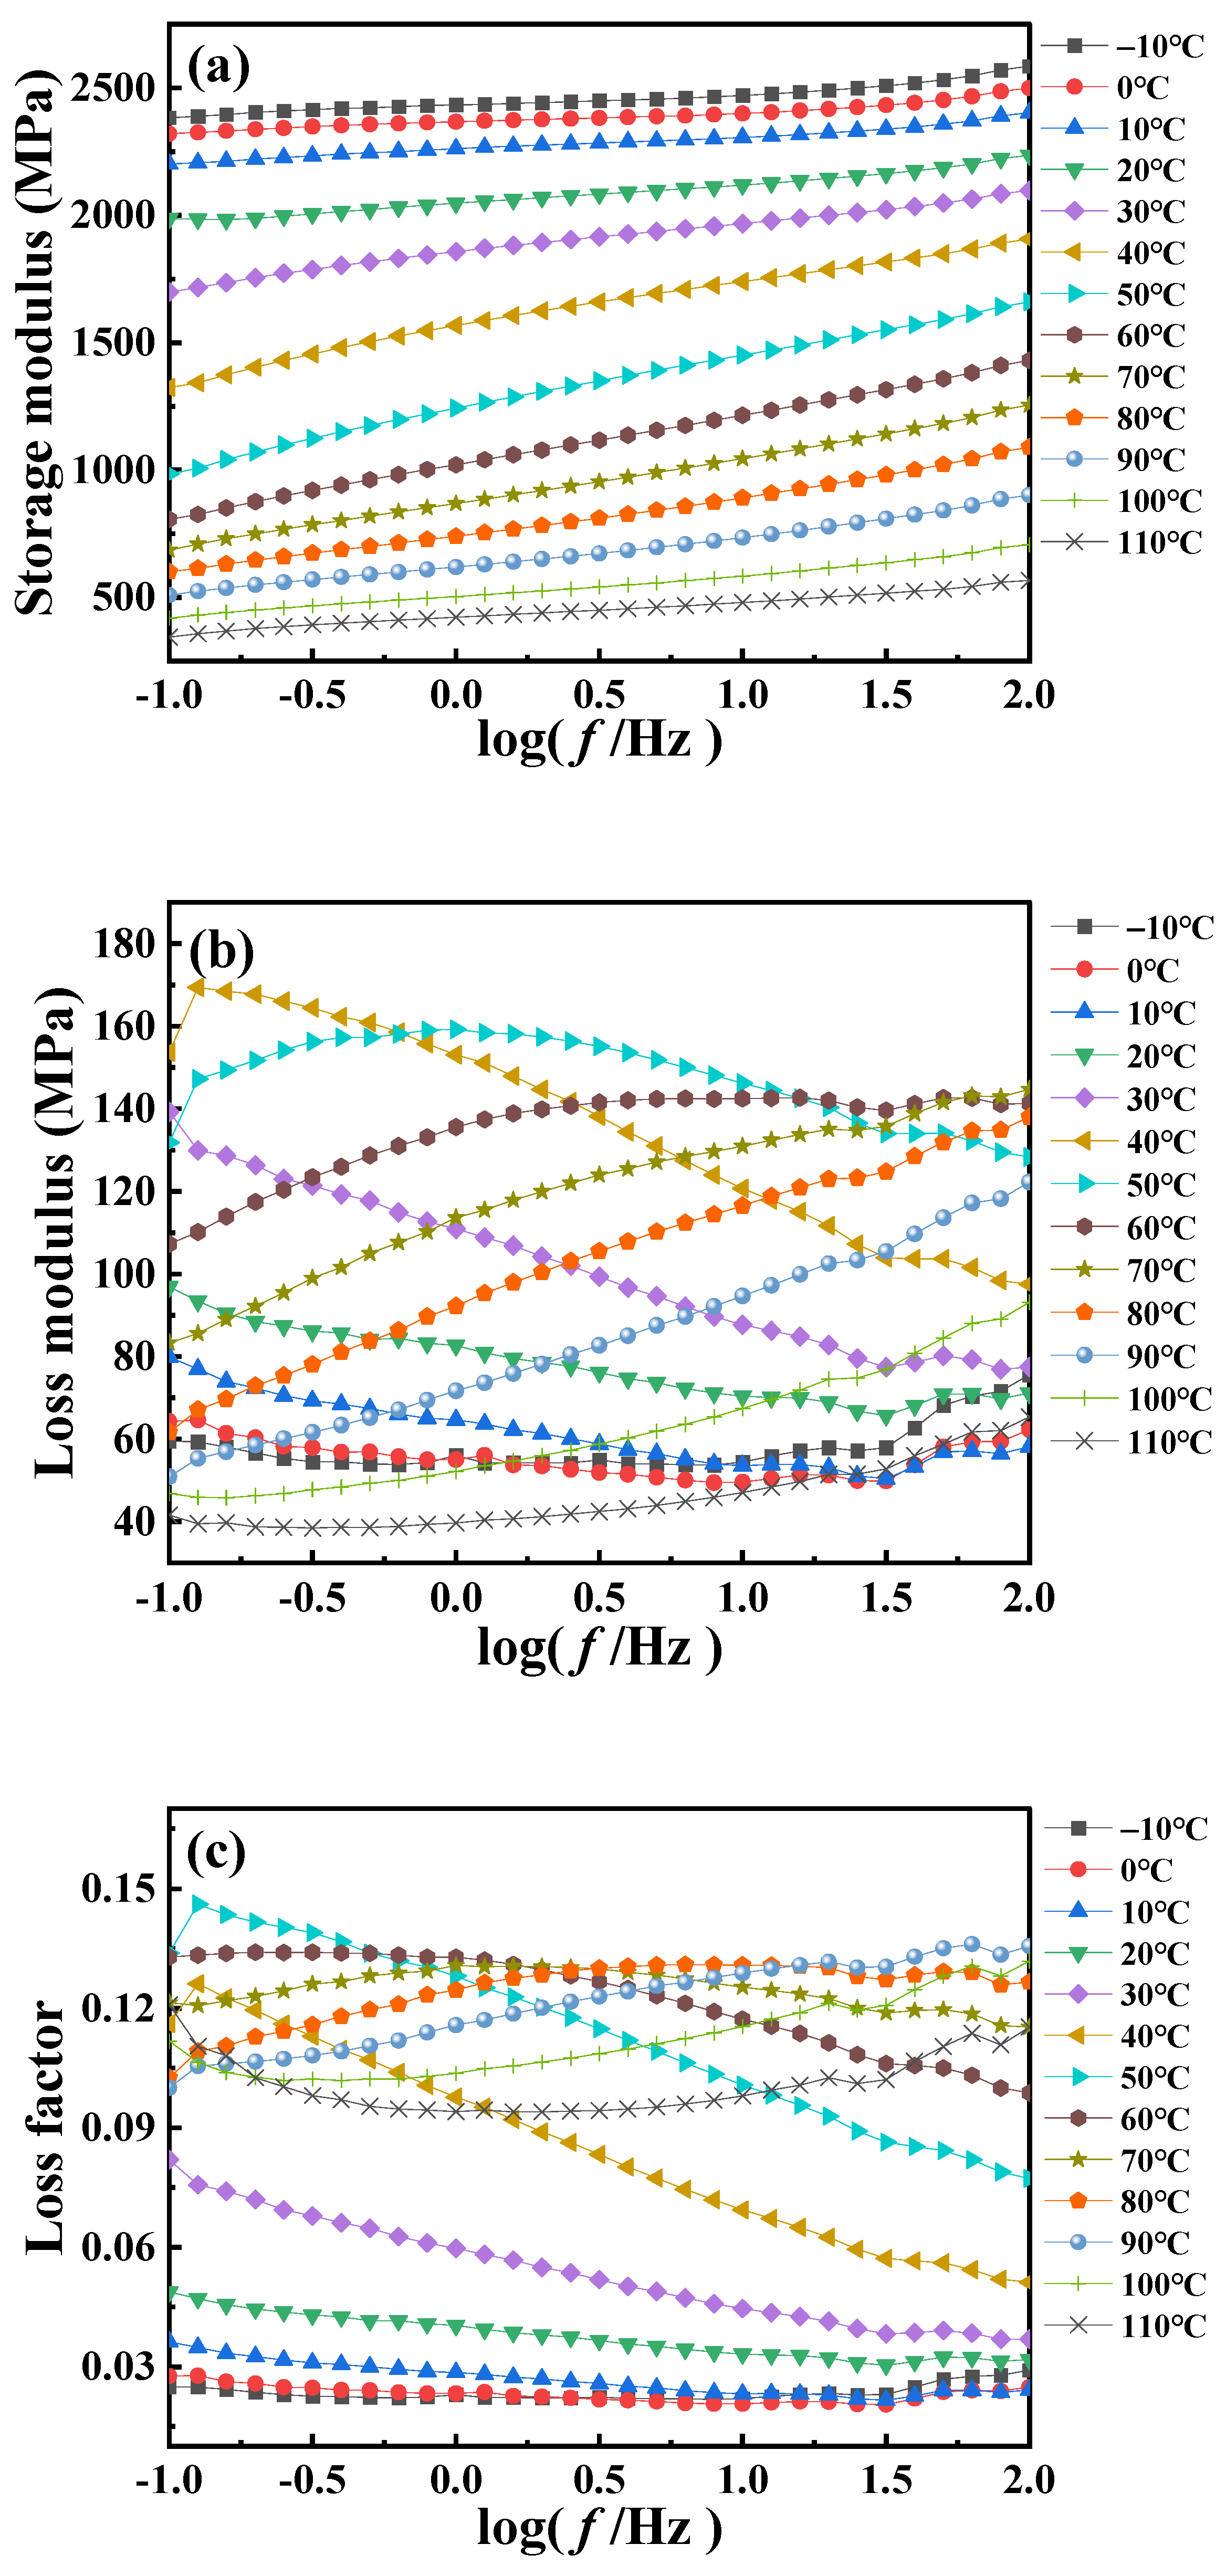
Figure 2 is the dynamic frequency scanning DMA curve of PA6 film at different temperatures. The results show that the dynamic modulus and loss factor of the PA6 film exhibit pronounced dependence on loading frequency and temperature. It is observed from
Figure 2a that the PA6 film remains stable as a whole when the frequency changes, indicating that the response of the material is in the linear viscoelastic range under this experimental condition. However, the amplitude of the
E′ with frequency is relatively obvious at the temperature near the glass transition, while it exhibits a reduced sensitivity to frequency at low temperature or high temperature. This can be explained by the fact that the glass transition process involves large-scale synergistic molecular motions, leading to significant changes in the internal structure of the polymer material and thus significantly affecting the dynamic mechanical properties of the material. In contrast, at low or high temperatures, the motion of the polymer chains is relatively stable, resulting in an insignificant response to frequency. The above conclusion is further supported by
Figure 2b, from which it can be observed that the
E″ is lower at both low and high temperatures and remains relatively constant with increasing frequency. This is because at low temperatures the relatively restricted motion of PA6 molecules results in a lower loss modulus, whereas at high temperatures, although there is an increase in molecular motion, it may also result in a relatively low loss modulus due to the higher energy state. At high frequencies, the interaction between PA6 molecules exhibits not only elastic behavior (energy storage modulus) but also viscous behavior (loss modulus). Near the
Tg, this viscoelastic behavior becomes more pronounced due to the rapid molecular motion, resulting in increased energy dissipation and internal friction.
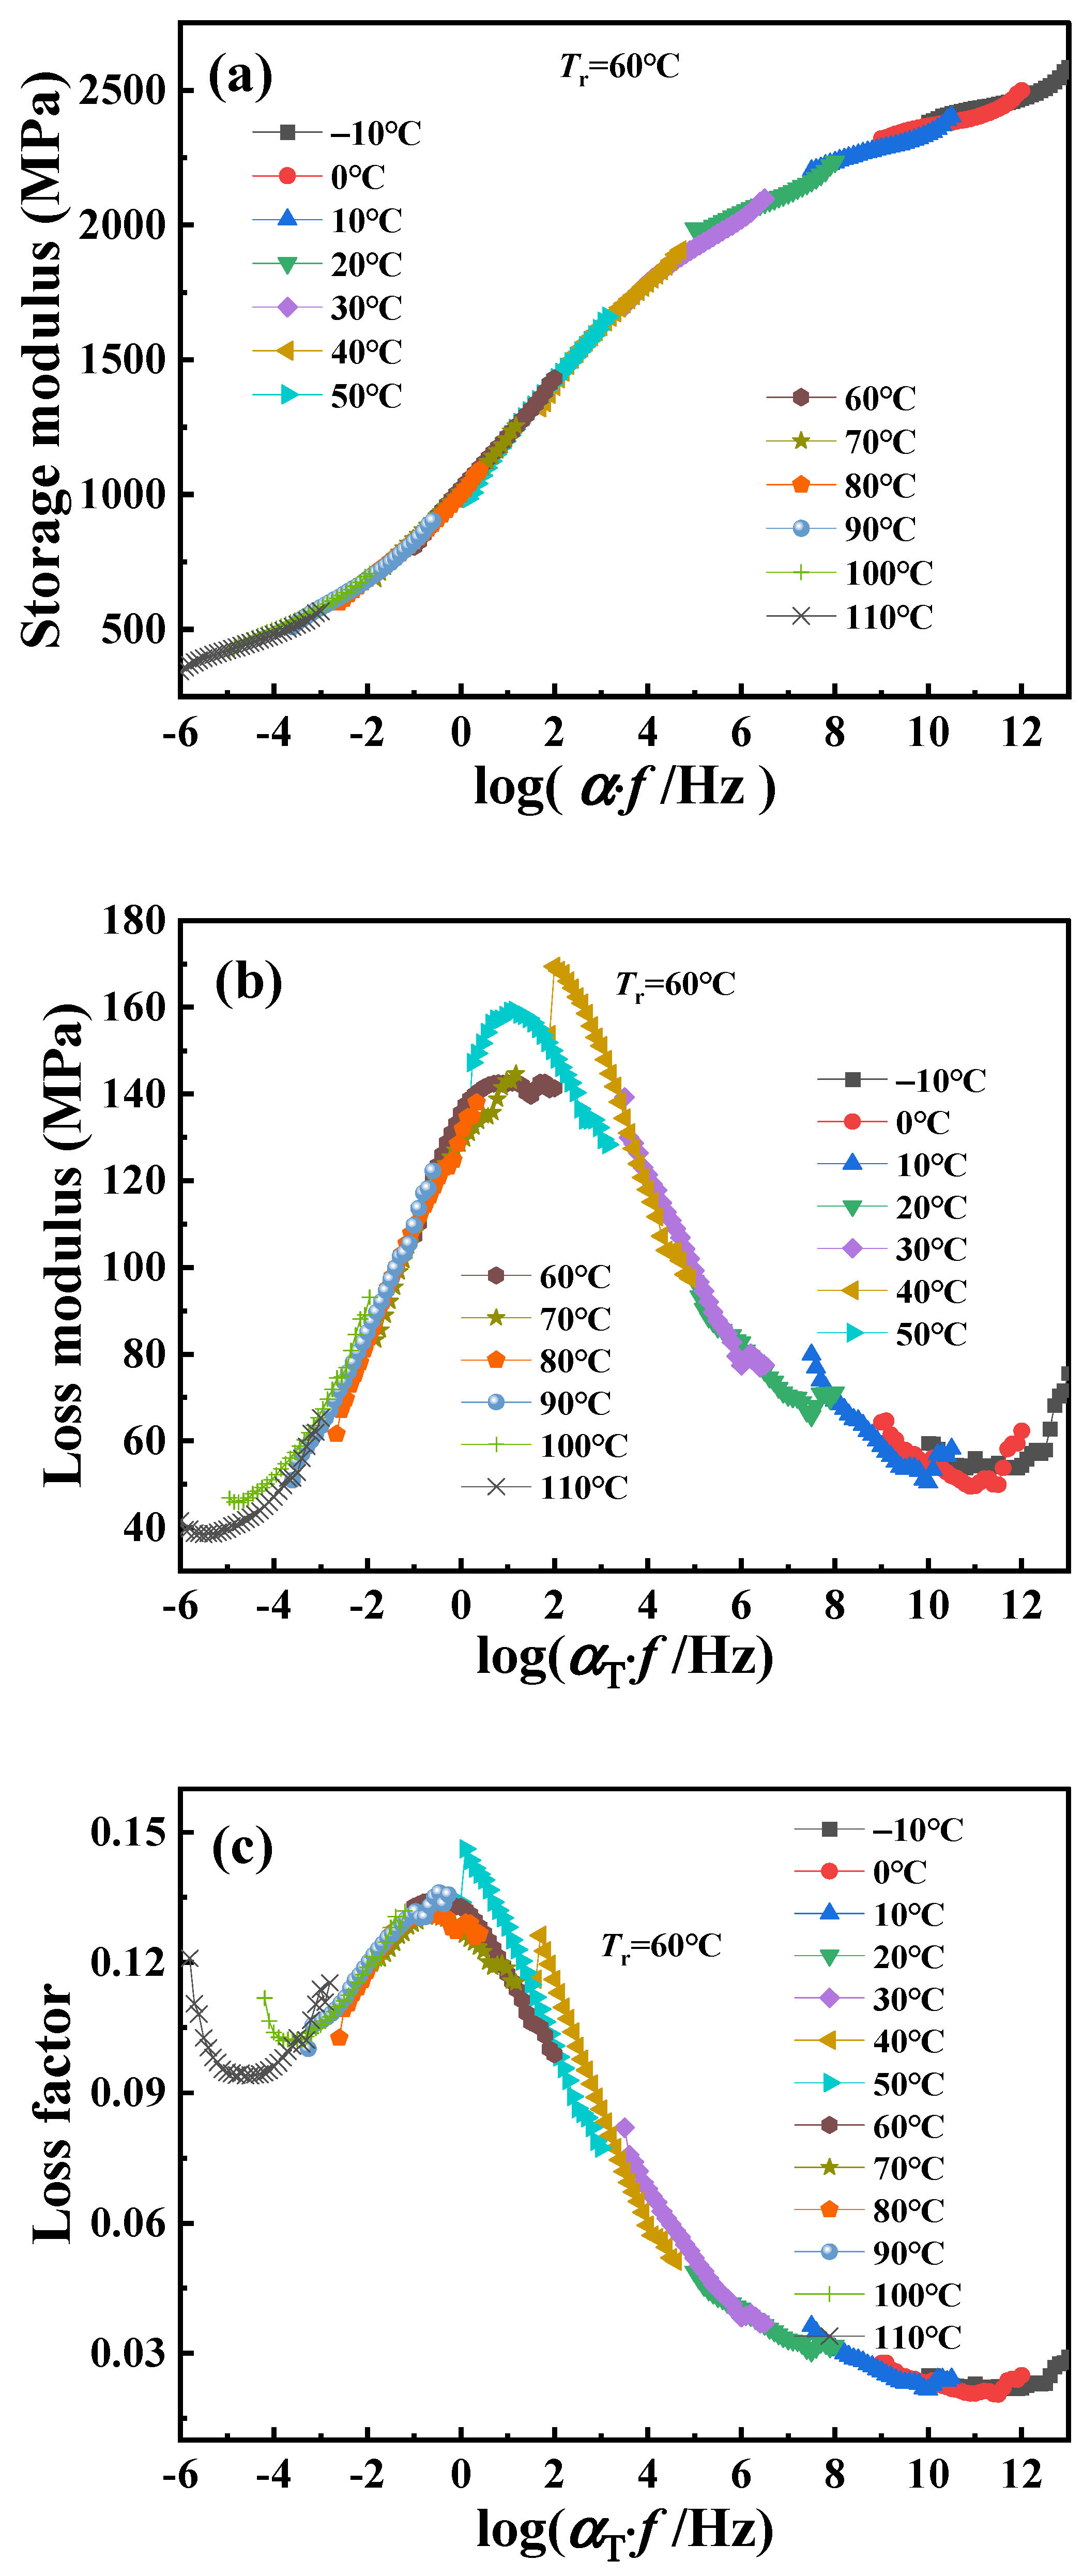
Using time–temperature superposition, the glass transition temperature of PA6 is selected as the reference temperature (
Tr = 60 °C). Each curve at different temperatures in
Figure 2 is shifted horizontally until all curves merge into a smooth master curve, as shown in
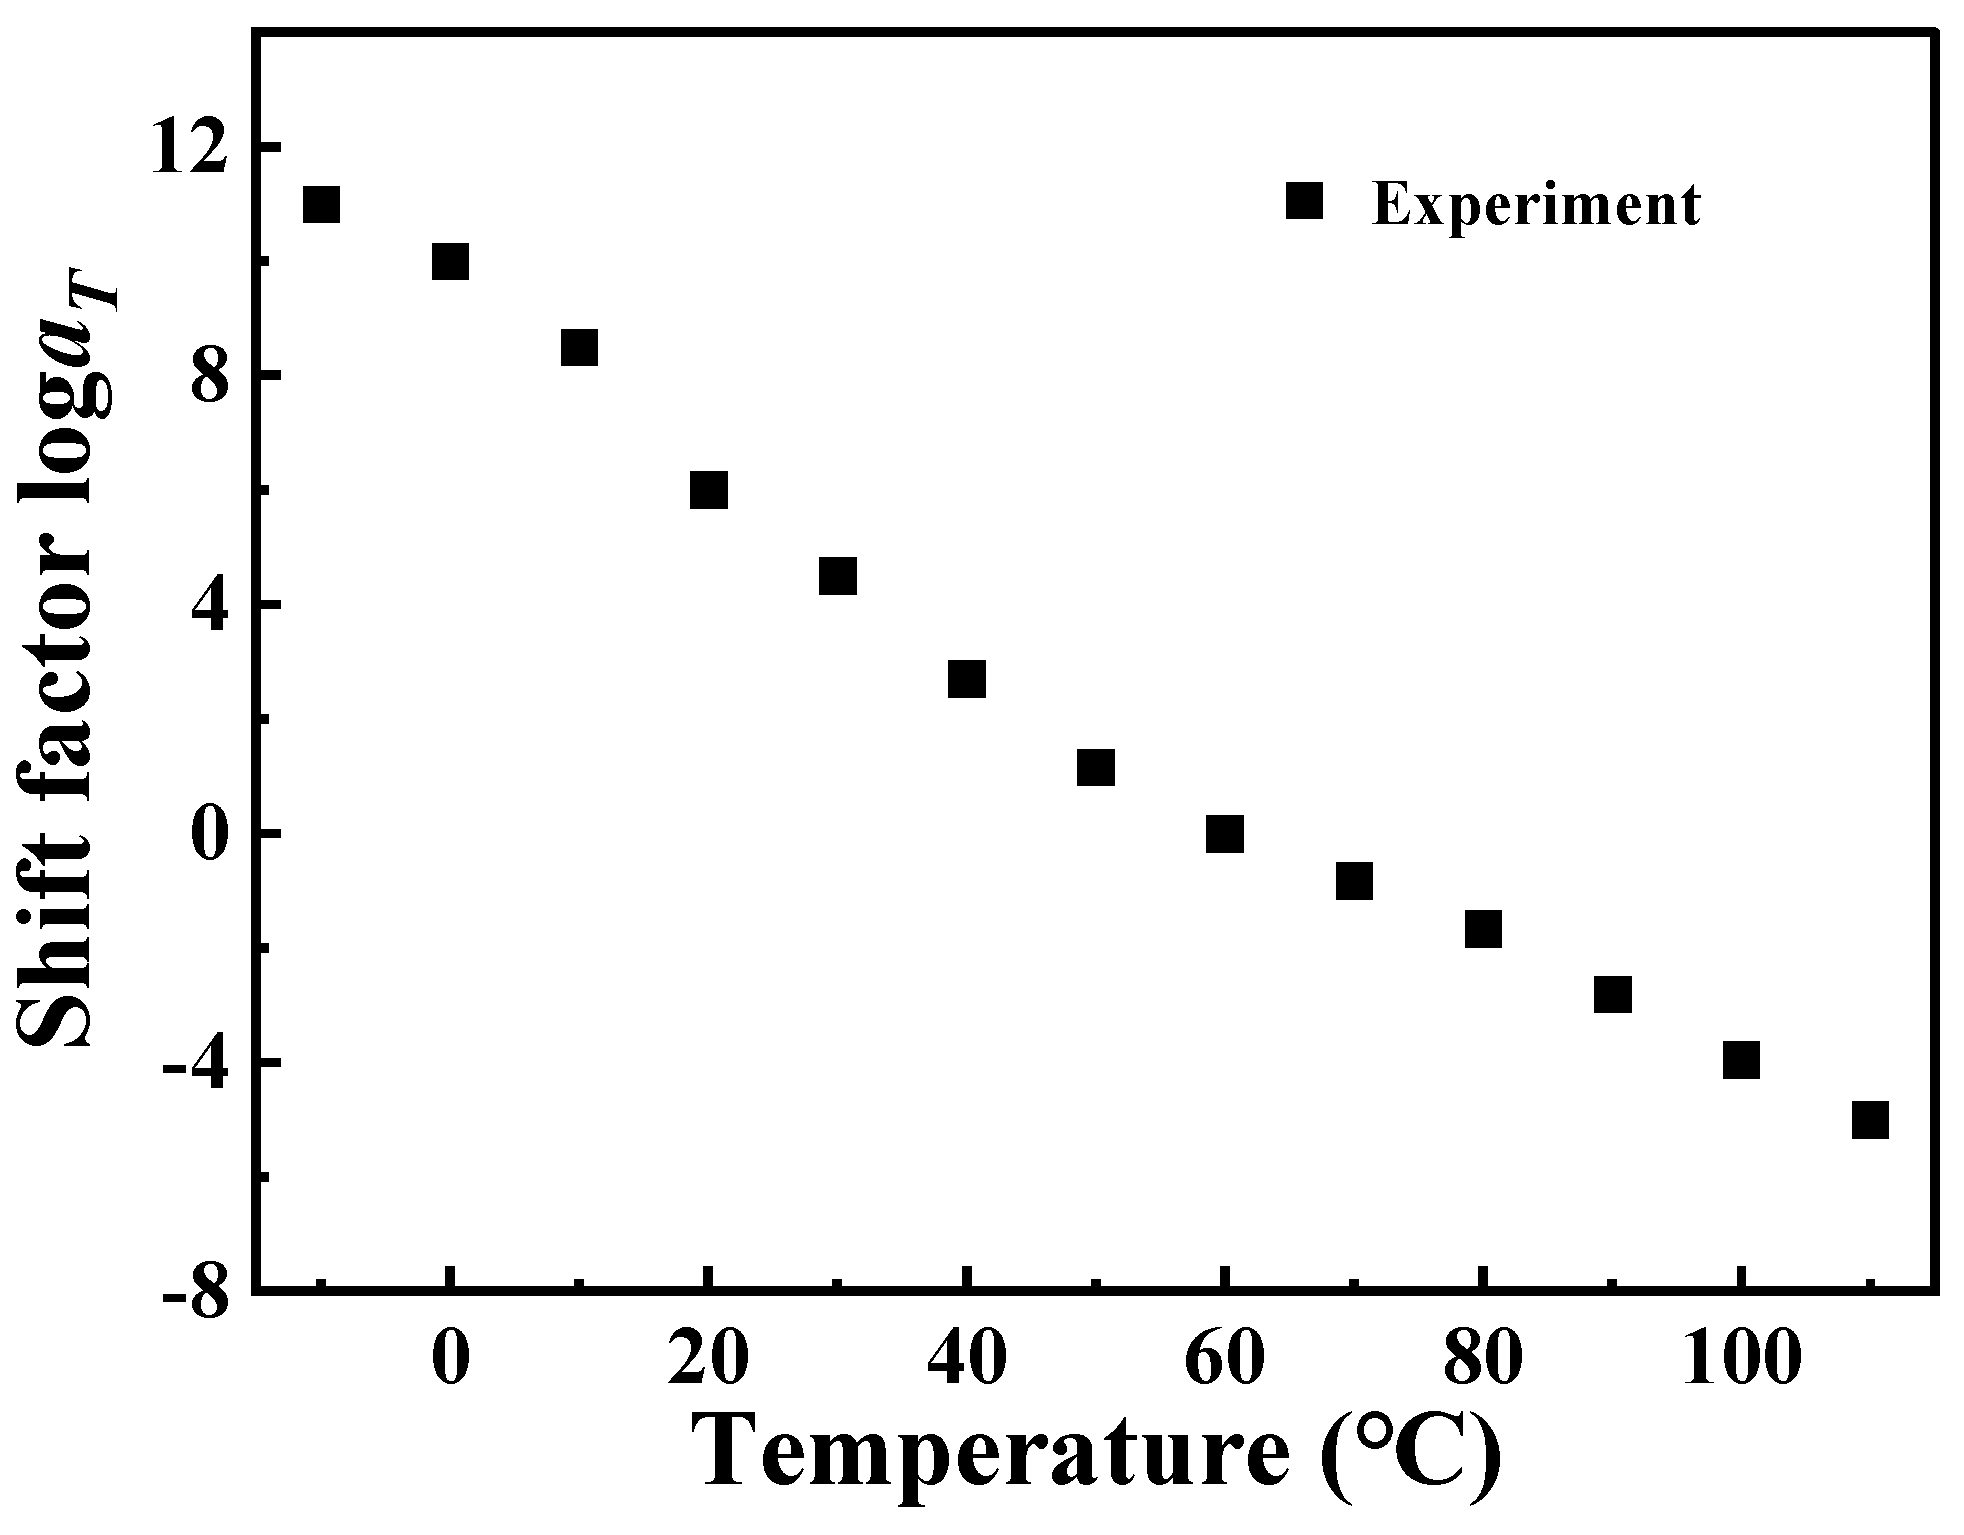
Figure 3. These master curve results reflect the dynamic mechanical behavior of PA6 film in a wide range of frequencies covering about 19 decades. At the same time, it also proved that PA6 film is a thermorheologically simple material. The relationship between horizontal shift factor and temperature is shown in
Figure 4.
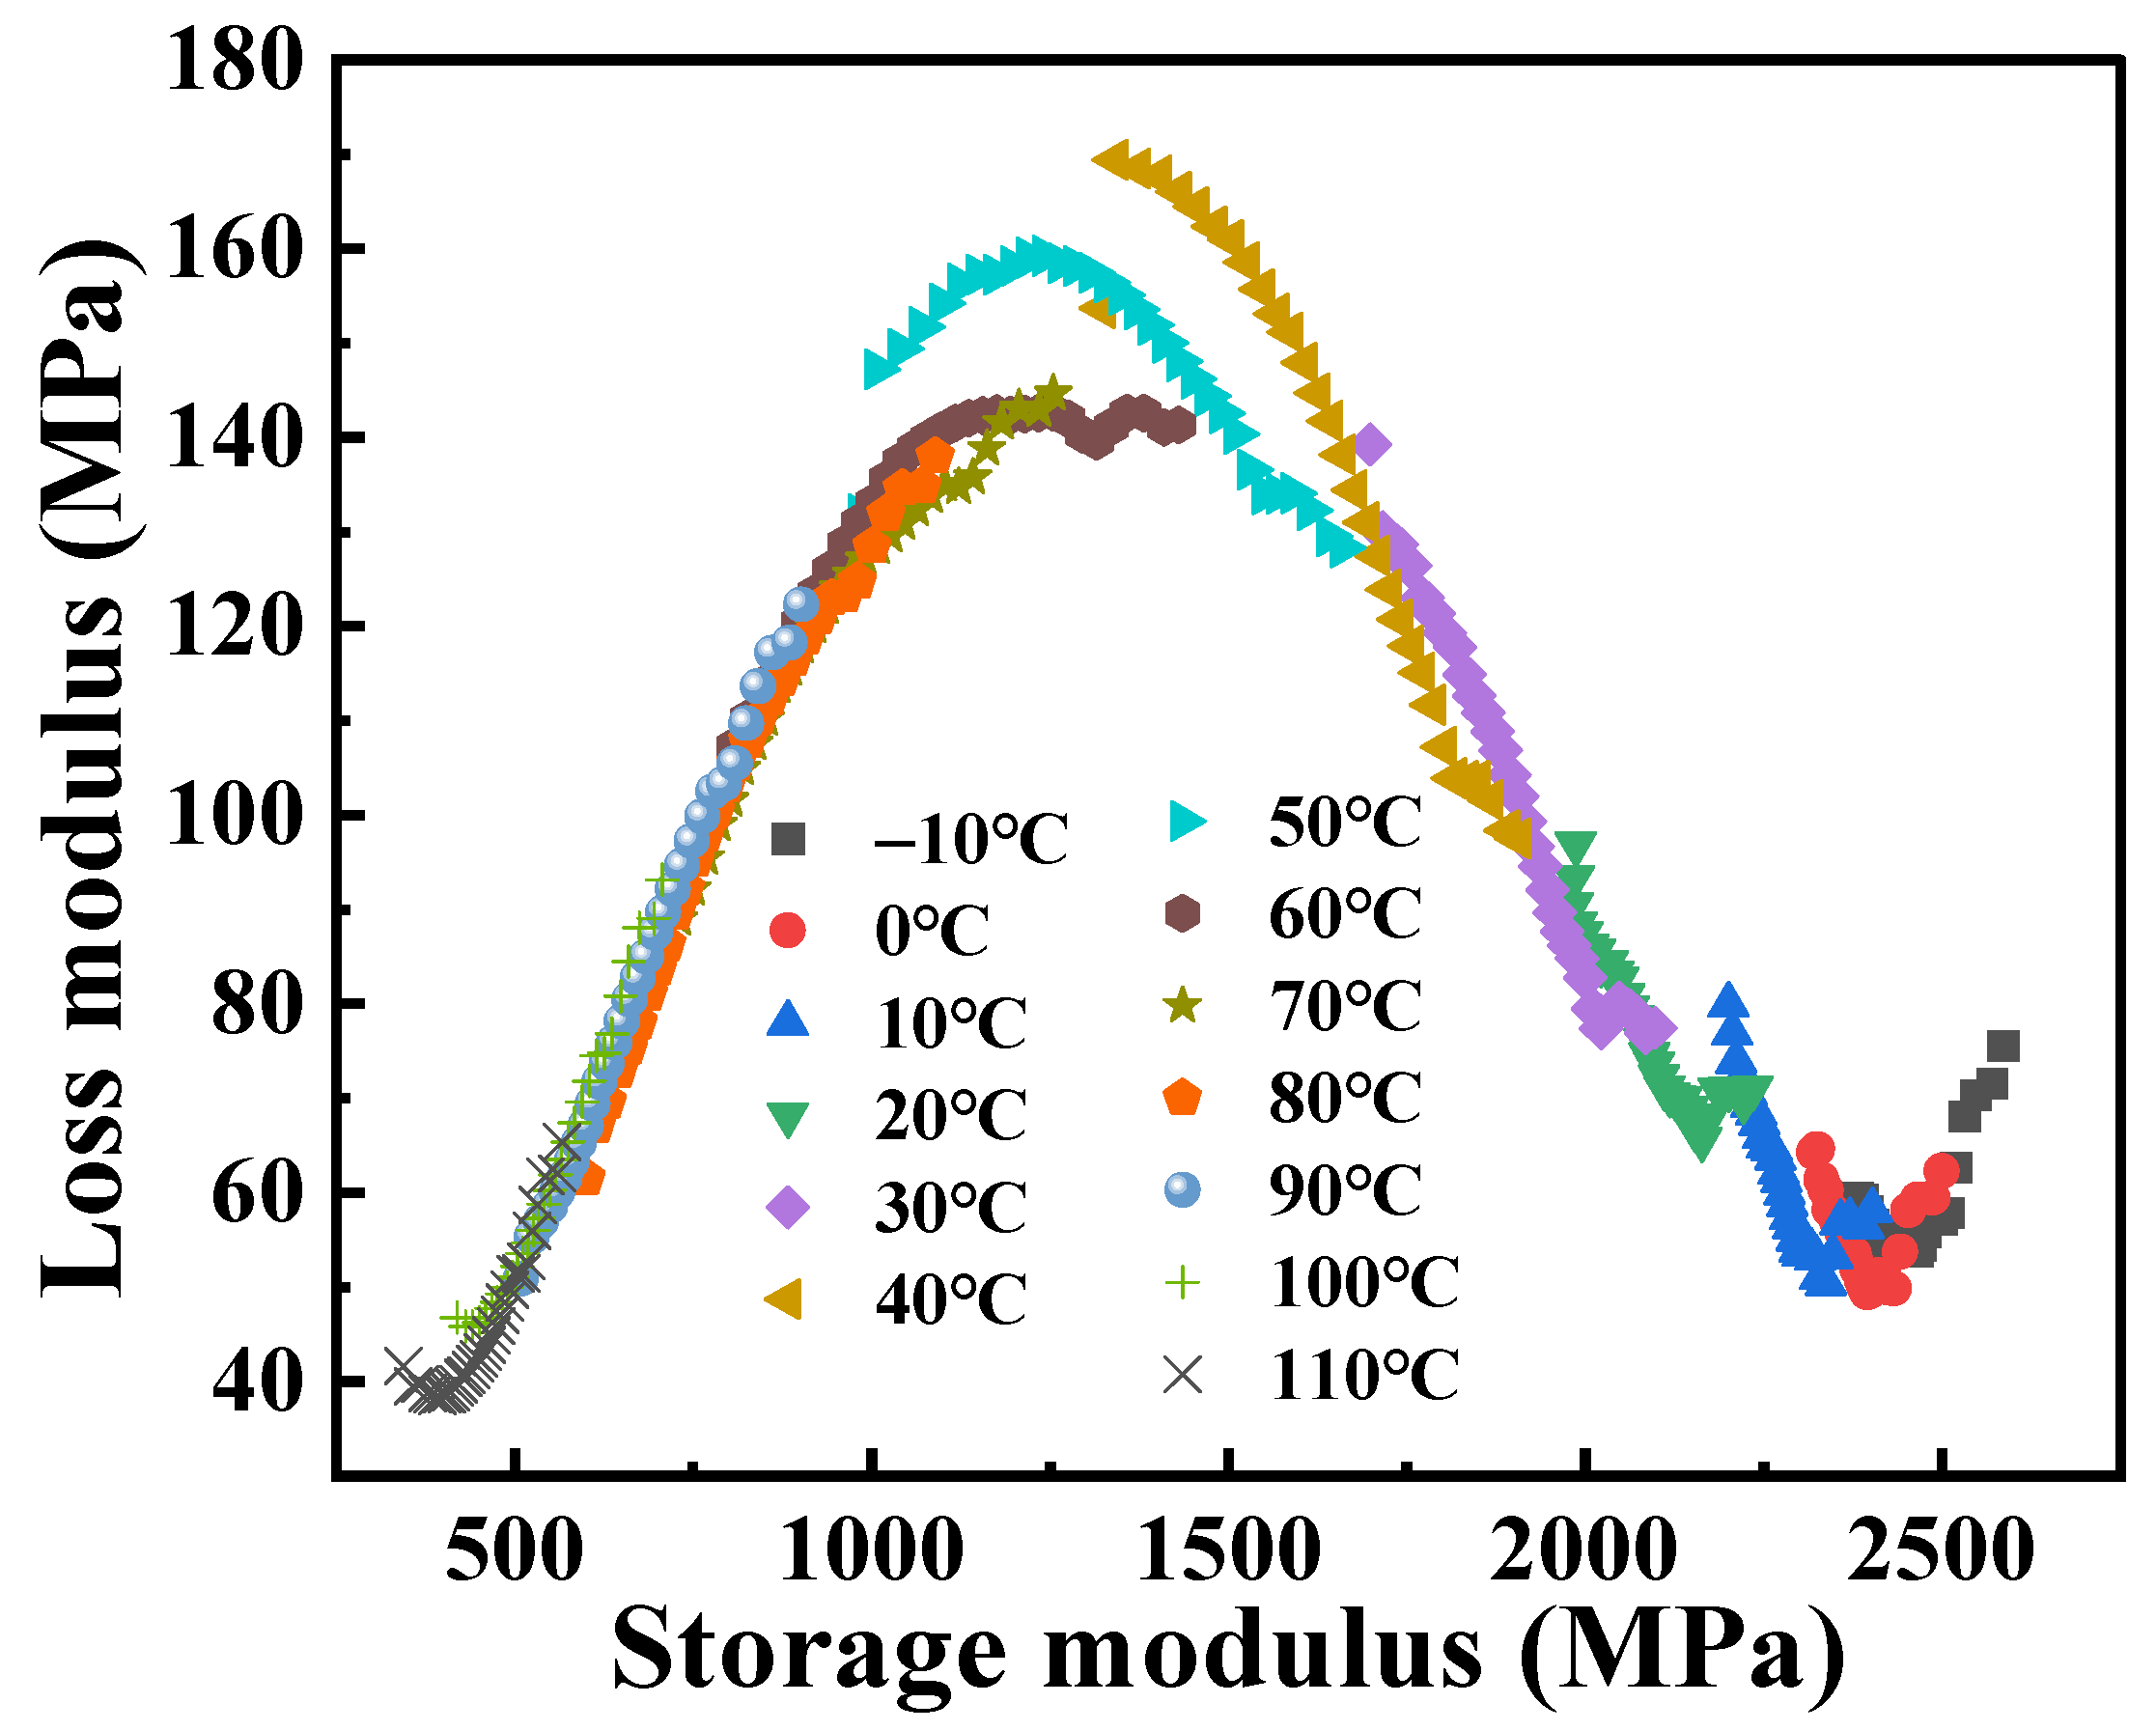
The real part (
E′) and the imaginary part (
E″) of the complex modulus derived from the dynamic frequency scanning results at different temperatures are taken as the
X-axis and the
Y-axis, respectively, and the Cole–Cole diagram of the PA6 film is obtained [
28], as shown in
Figure 5. It can be observed that the Cole–Cole diagram exhibits significant asymmetry, but the curves overlap poorly at low temperatures. This can be explained by the fact that the PA6 molecular structure is rigid at lower temperatures; the dynamic response is inflexible. Additionally, it should be noted that the slope of the Cole–Cole diagram remains essentially constant in the high-temperature zone. This is consistent with the fact that physical aging cannot be observed in this temperature region because polymers are in thermodynamic equilibrium at temperatures well above the
Tg. As the temperature approaches the
Tg, the modes of motion and energy dissipation within the material change, resulting in an increase in the loss modulus, which manifests itself as a smoother curve.
The horizontal shift factor can also be determined by the Arrhenius equation. Firstly,
Tg at different loading frequencies was determined. In the DMA curve, the temperature at which the maximum value of tan
δ occurs corresponds to the
Tg of the polymer, indicating that the energy loss of the material reaches its maximum at this temperature, which is directly related to a significant increase in the mobility of the molecular chains [
29]. The equation for calculating the activation energy of materials according to the Arrhenius law is as follows:
where
f0 is a constant. Taking the logarithm of Equation (7) yields:
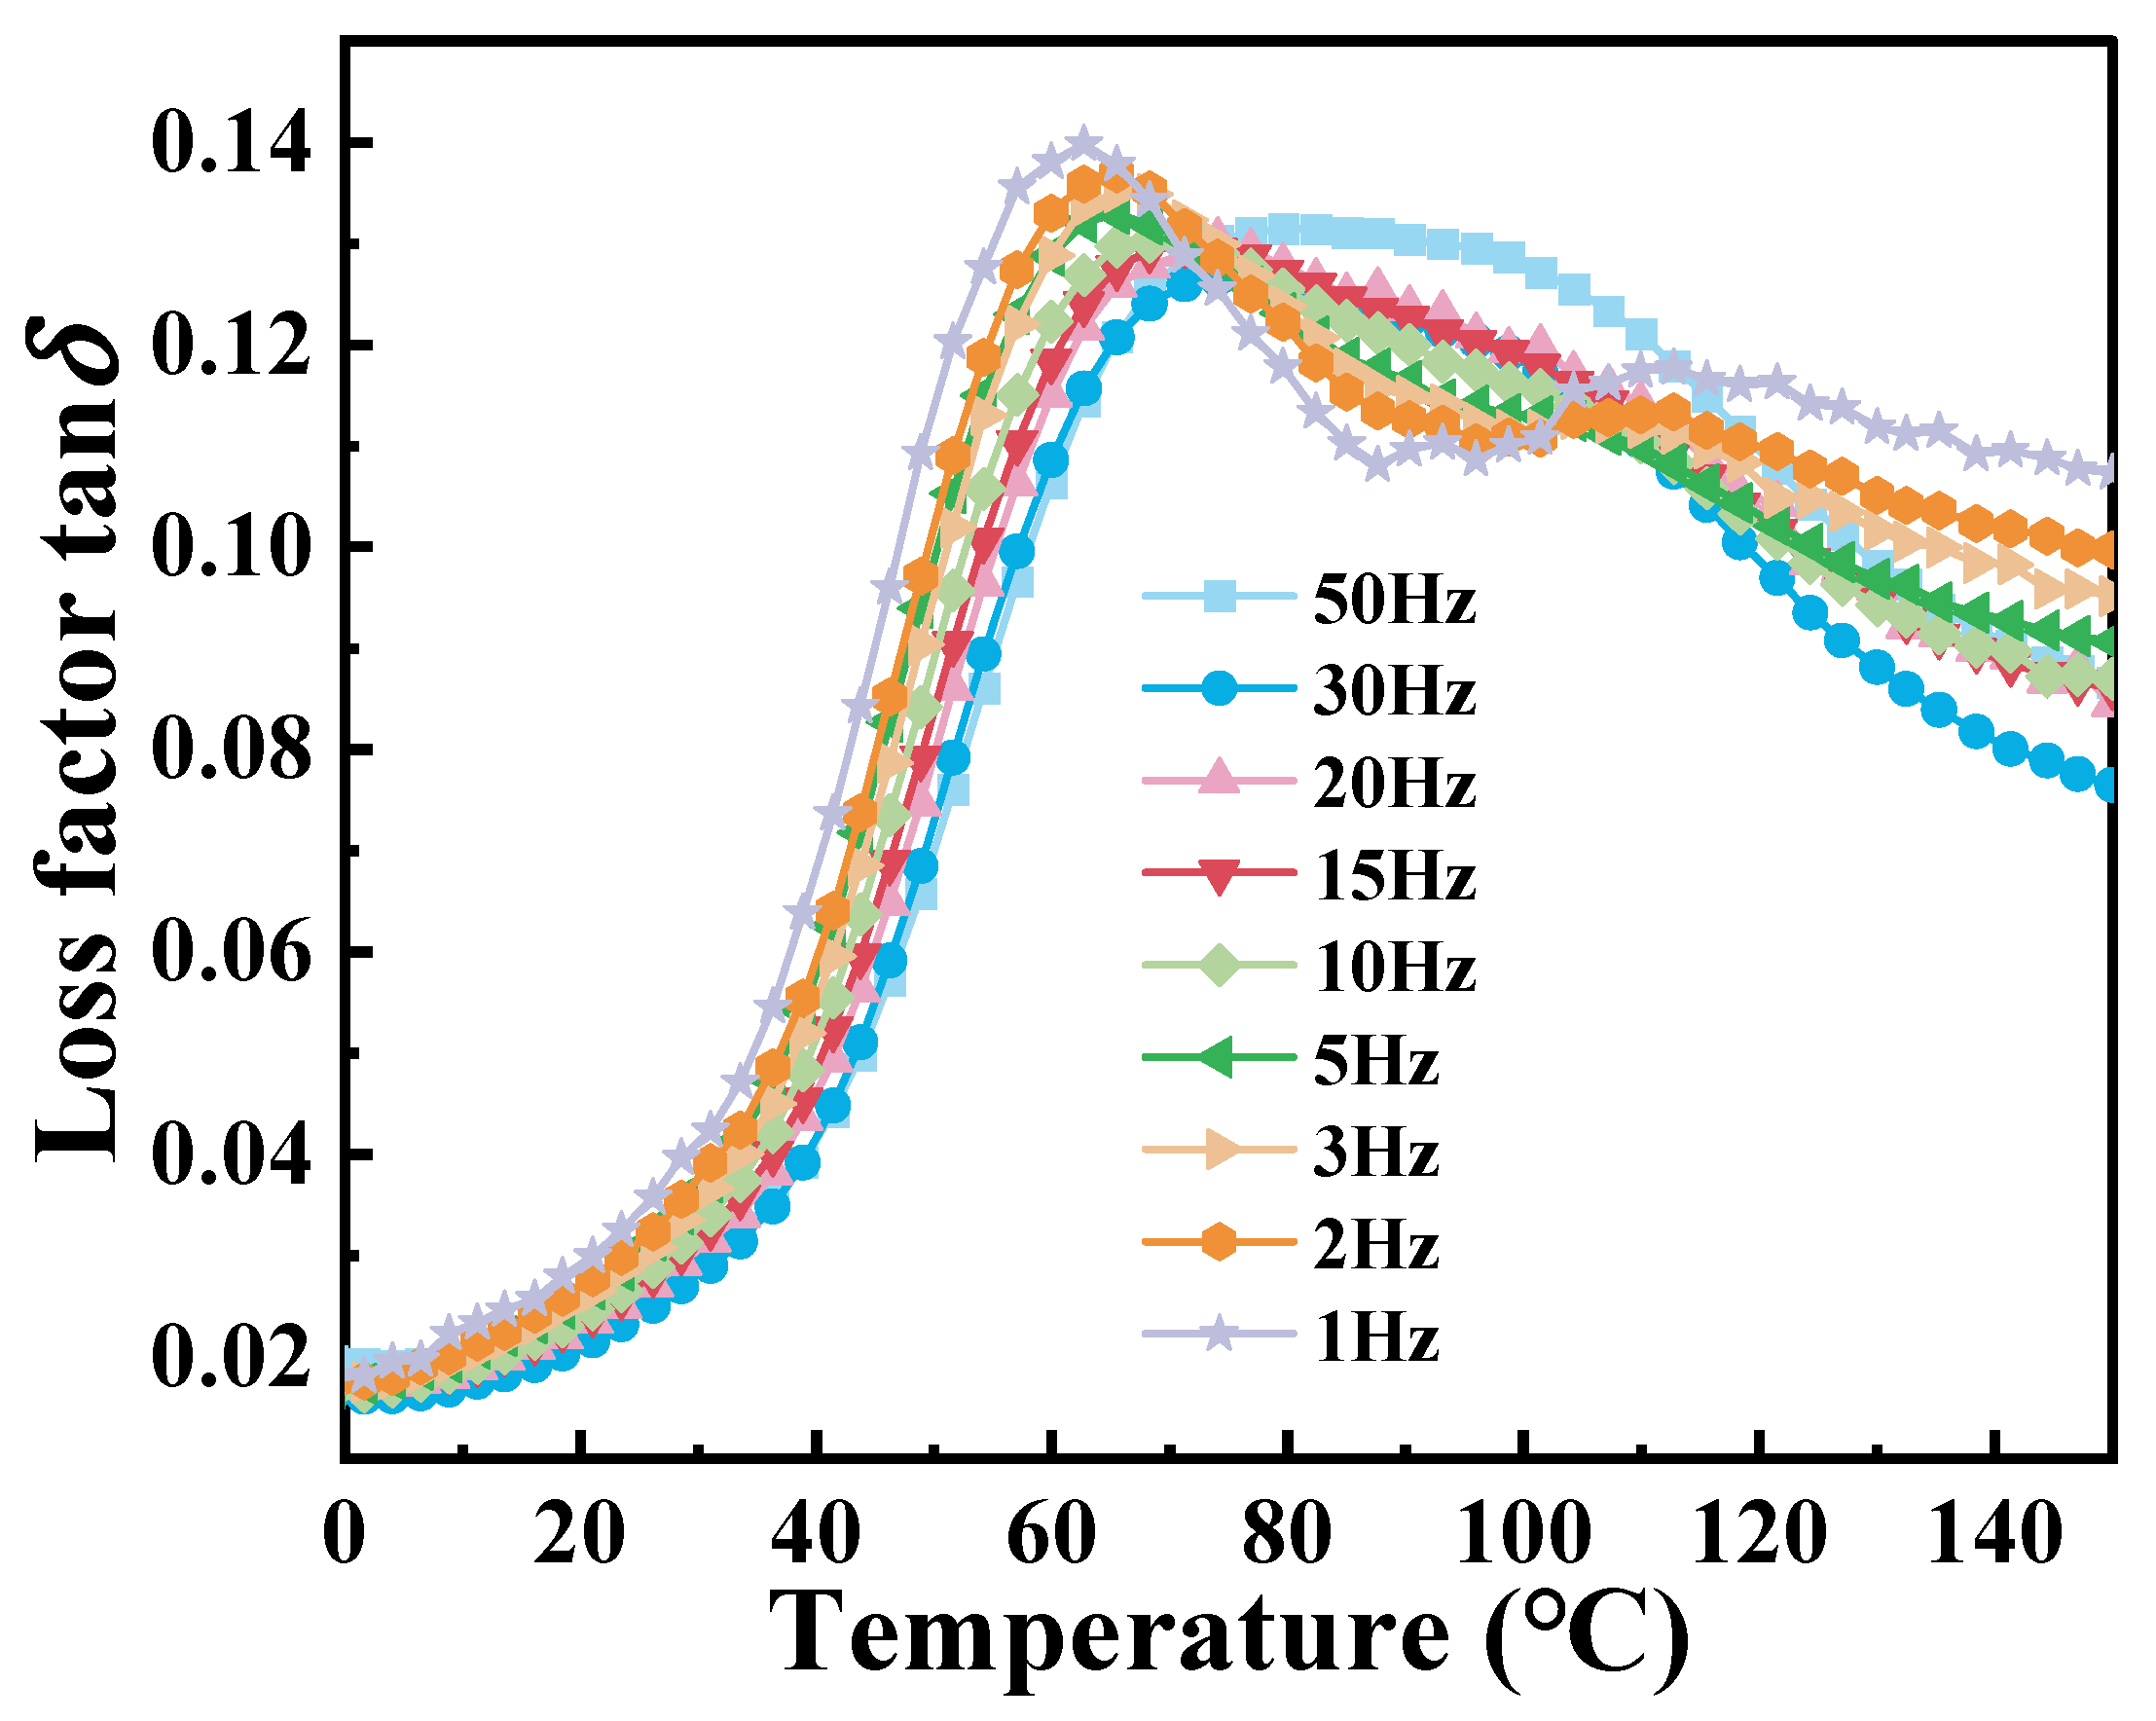
The multi-frequency dynamic temperature-scanning DMA curves of PA6 film at different frequencies are shown in
Figure 6. It can be observed that the peak of tan
δ gradually shifts to the right with the increase in frequency. This shift can be explained as that the movement of the molecular chain of the material is limited at high frequencies, resulting in reduced intermolecular friction, which is accompanied by low energy dissipation. During the transition from low to high frequencies, the tan
δ curve gradually evolves from two distinct peaks to a broader single peak. The reason is that the micro-domain crystallization behavior occurs due to the influence of the thermal history of the material at low frequency. At higher frequencies, molecular chains do not have sufficient time to respond to strain, restricting molecular mobility and causing different modes of motion to merge into a broader peak.
Table 3 presents the corresponding
Tg values at different frequencies.
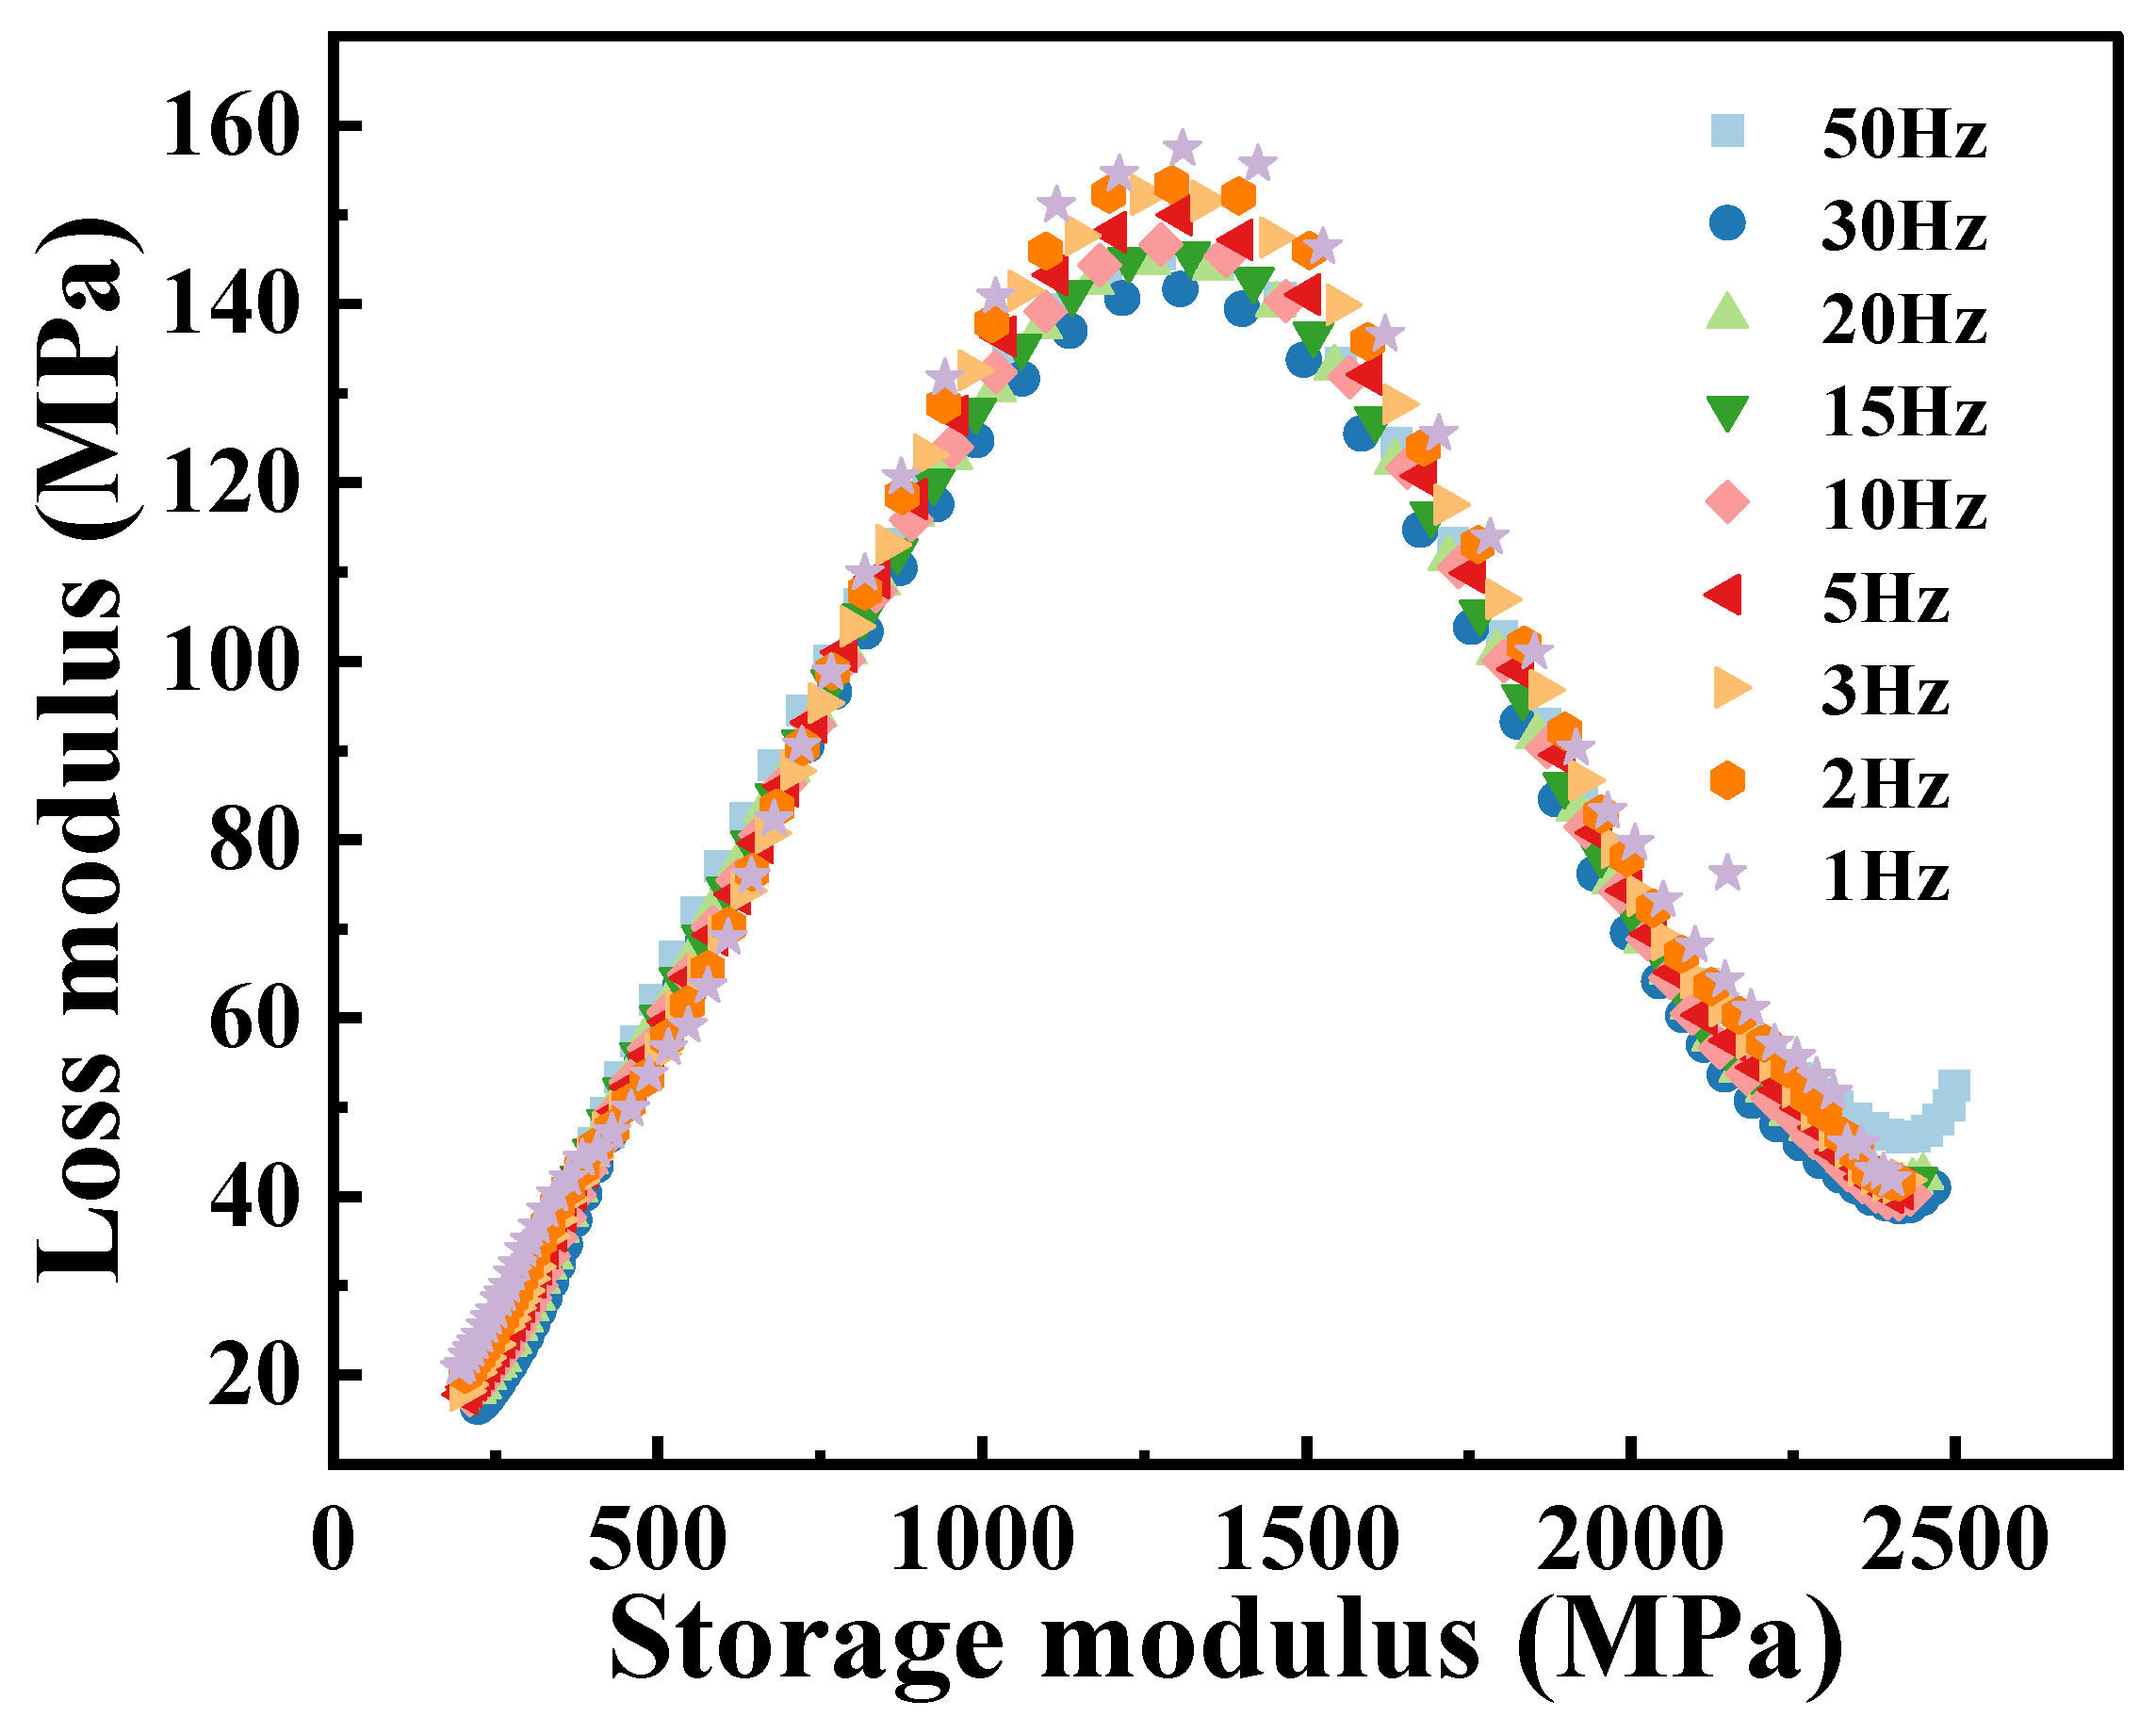
The Cole–Cole diagram of the PA6 film obtained from temperature scanning at different frequencies, as shown in
Figure 7, similar to the shape of the curve exhibited in
Figure 5, and also exhibits classical asymmetric characteristics. In addition, the loss modulus at different frequencies varies relatively around the peak of the Cole–Cole diagram (corresponding to the temperature region of
T = 60 °C in
Figure 5), indicating that the dynamic mechanical response of PA6 films is more sensitive to frequencies near the glass transition temperature. At low frequency conditions (1 Hz), the molecules of the material have more time to perform complex motions in respond to external forces, thereby more effectively converting energy into heat, resulting in a higher loss modulus. On the contrary, at high frequencies (50 Hz), the degree of freedom of the molecular chain is limited, resulting in a smaller loss modulus. In the Cole–Cole diagram, the slopes at both ends of the curve are basically the same, indicating that the dynamic response of the PA6 film in both the low and high temperature regions has little dependence on the frequency. At lower temperatures, PA6 is in the glassy state, with its molecular chains in a “frozen” state, resulting in minimal velocity and amplitude of chain motion. However, due to the existence of
β relaxation, the loss modulus of the material will increase, and the increase effect will be more obvious, especially at high frequencies. During the glass transition process, the dynamic response of the material is more affected by the molecular thermal motion, and the influence of
β relaxation will gradually disappear or weaken. At this time, the movement mode and structural state of the PA6 internal molecular chain are quite different, resulting in obvious dynamic asymmetric characteristics. As the temperature further increases, the PA6 film transforms into the rubber state and its internal structure and molecular chain motion are almost the same, which leads to the consistent response at different frequencies, which is manifested as the coincidence of the Cole–Cole diagram in the high-temperature region.
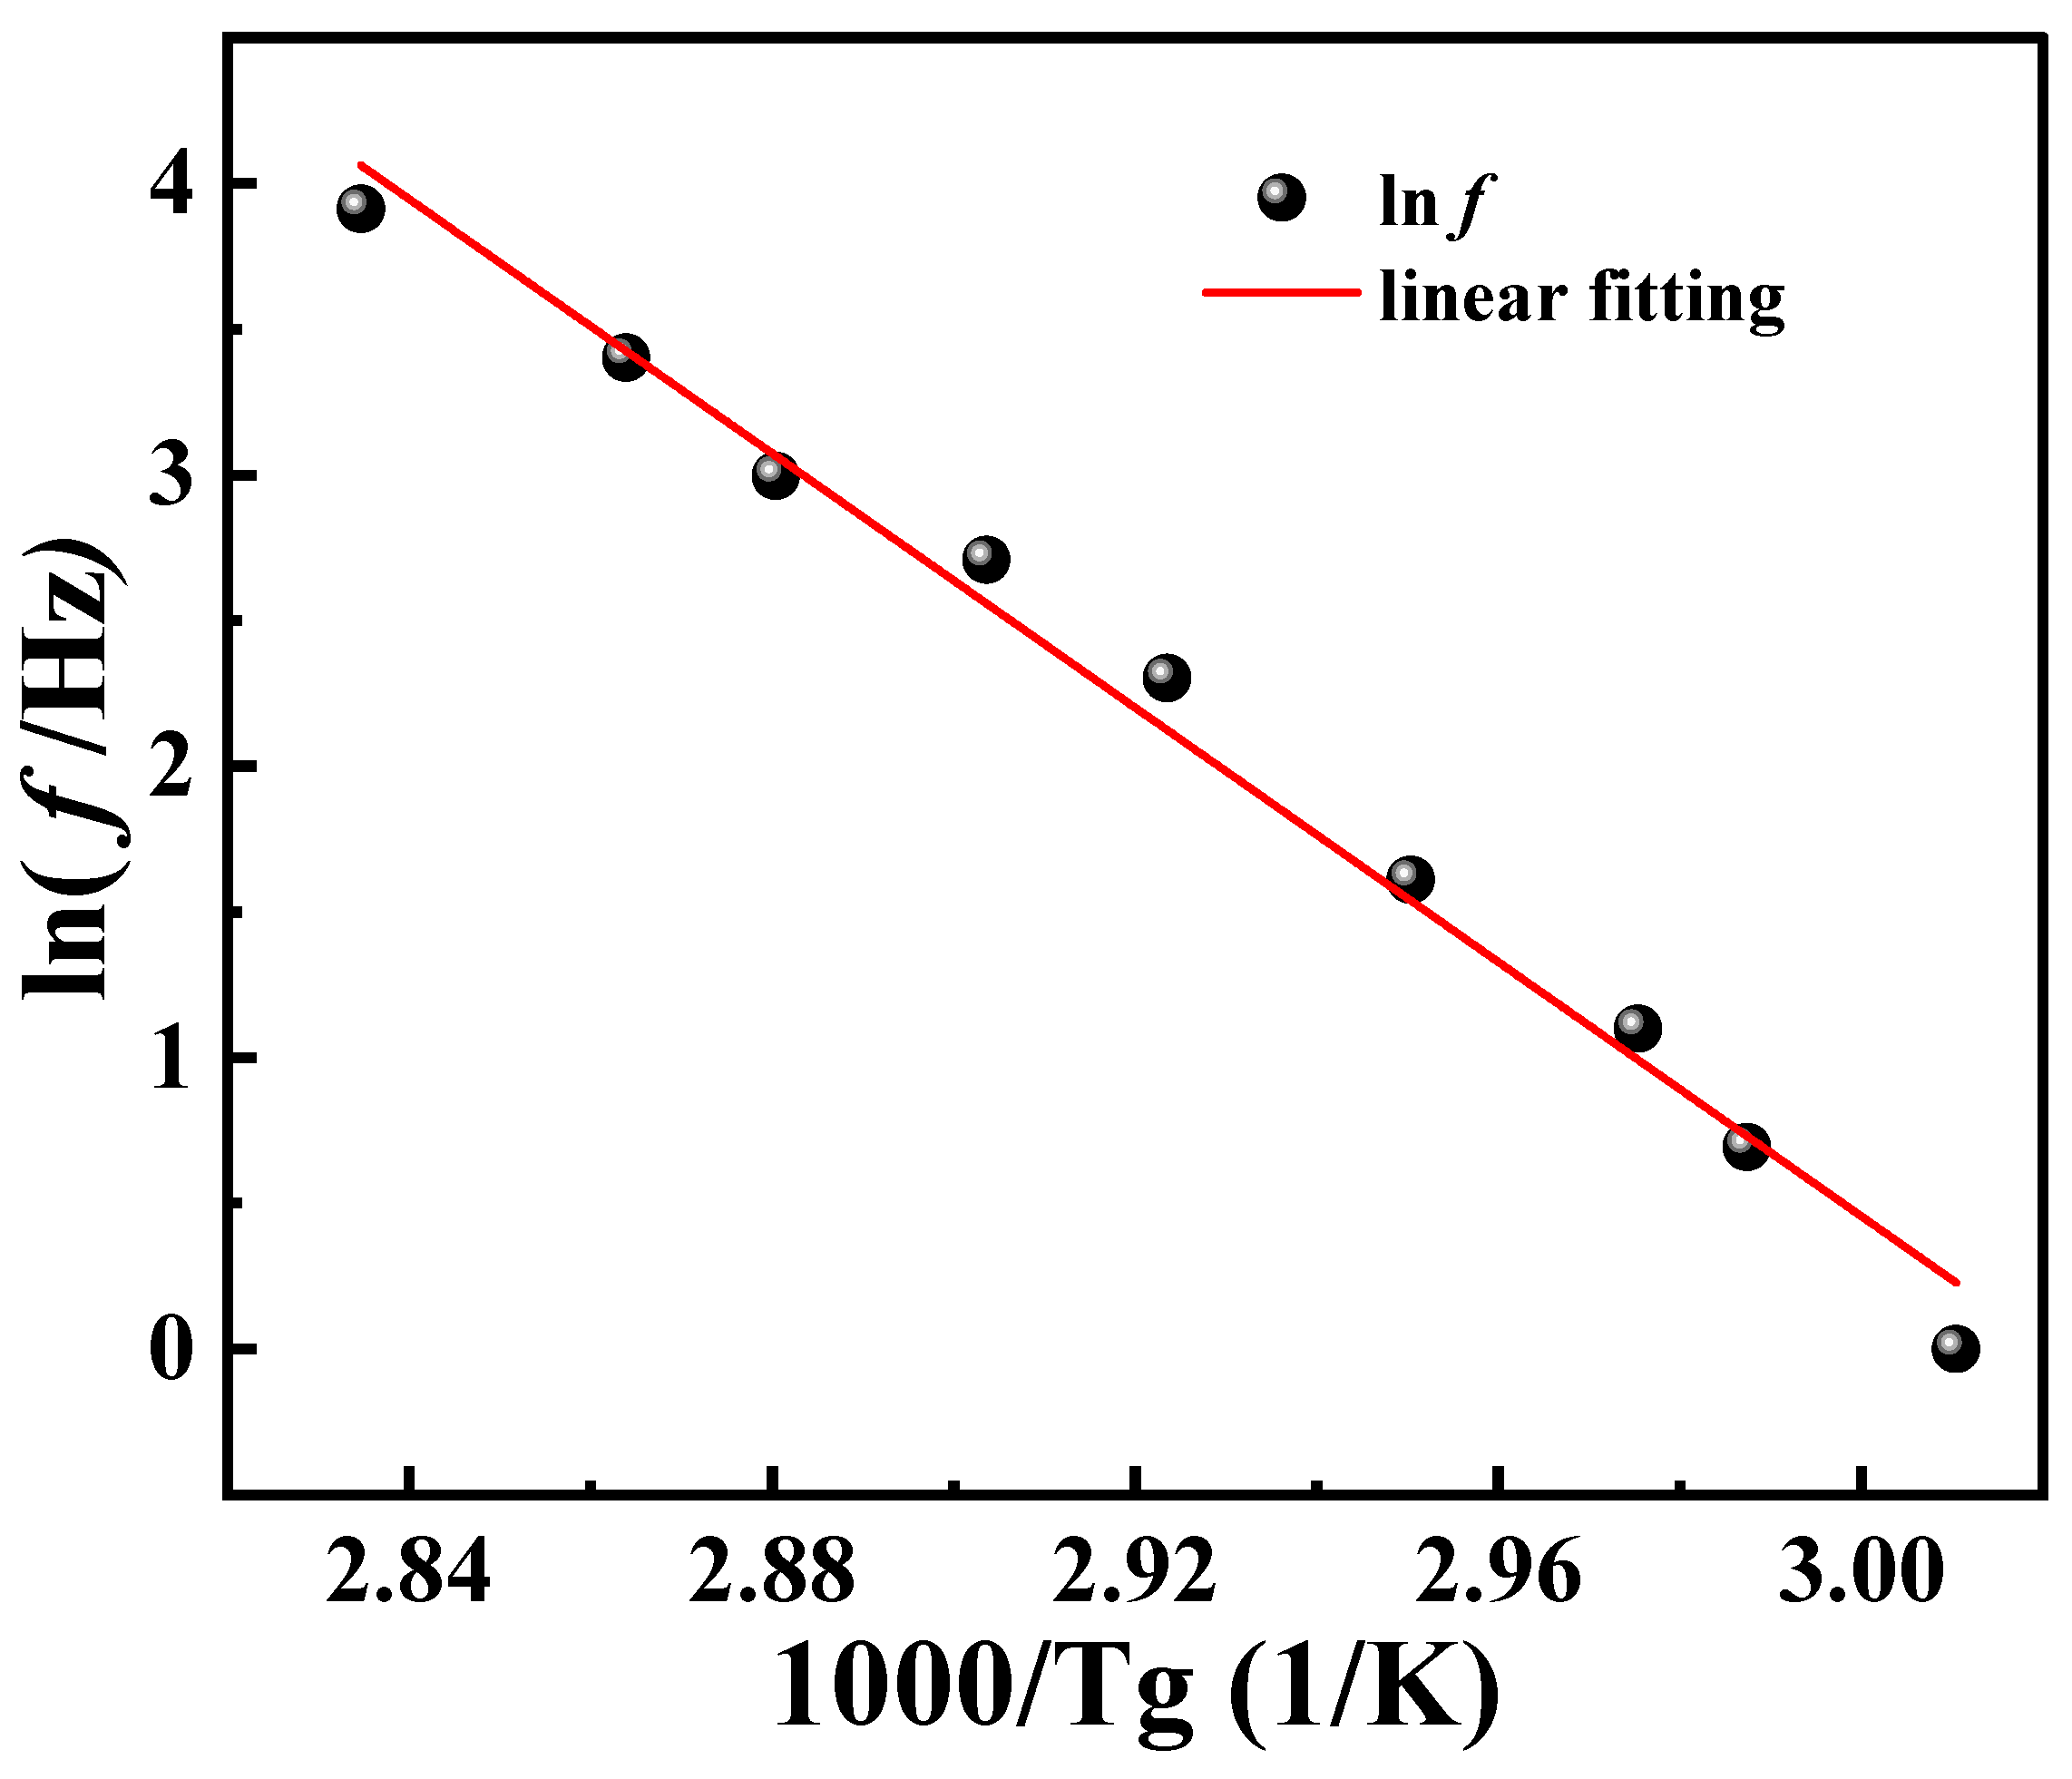
According to Equation (8), the logarithmic frequency is linearly related to the reciprocal of
Tg. A linear fit was performed on the data presented in
Table 2, as shown in
Figure 8. Further, the
Ea of PA6 film is calculated to be 281.462 kJ/mol. Taking
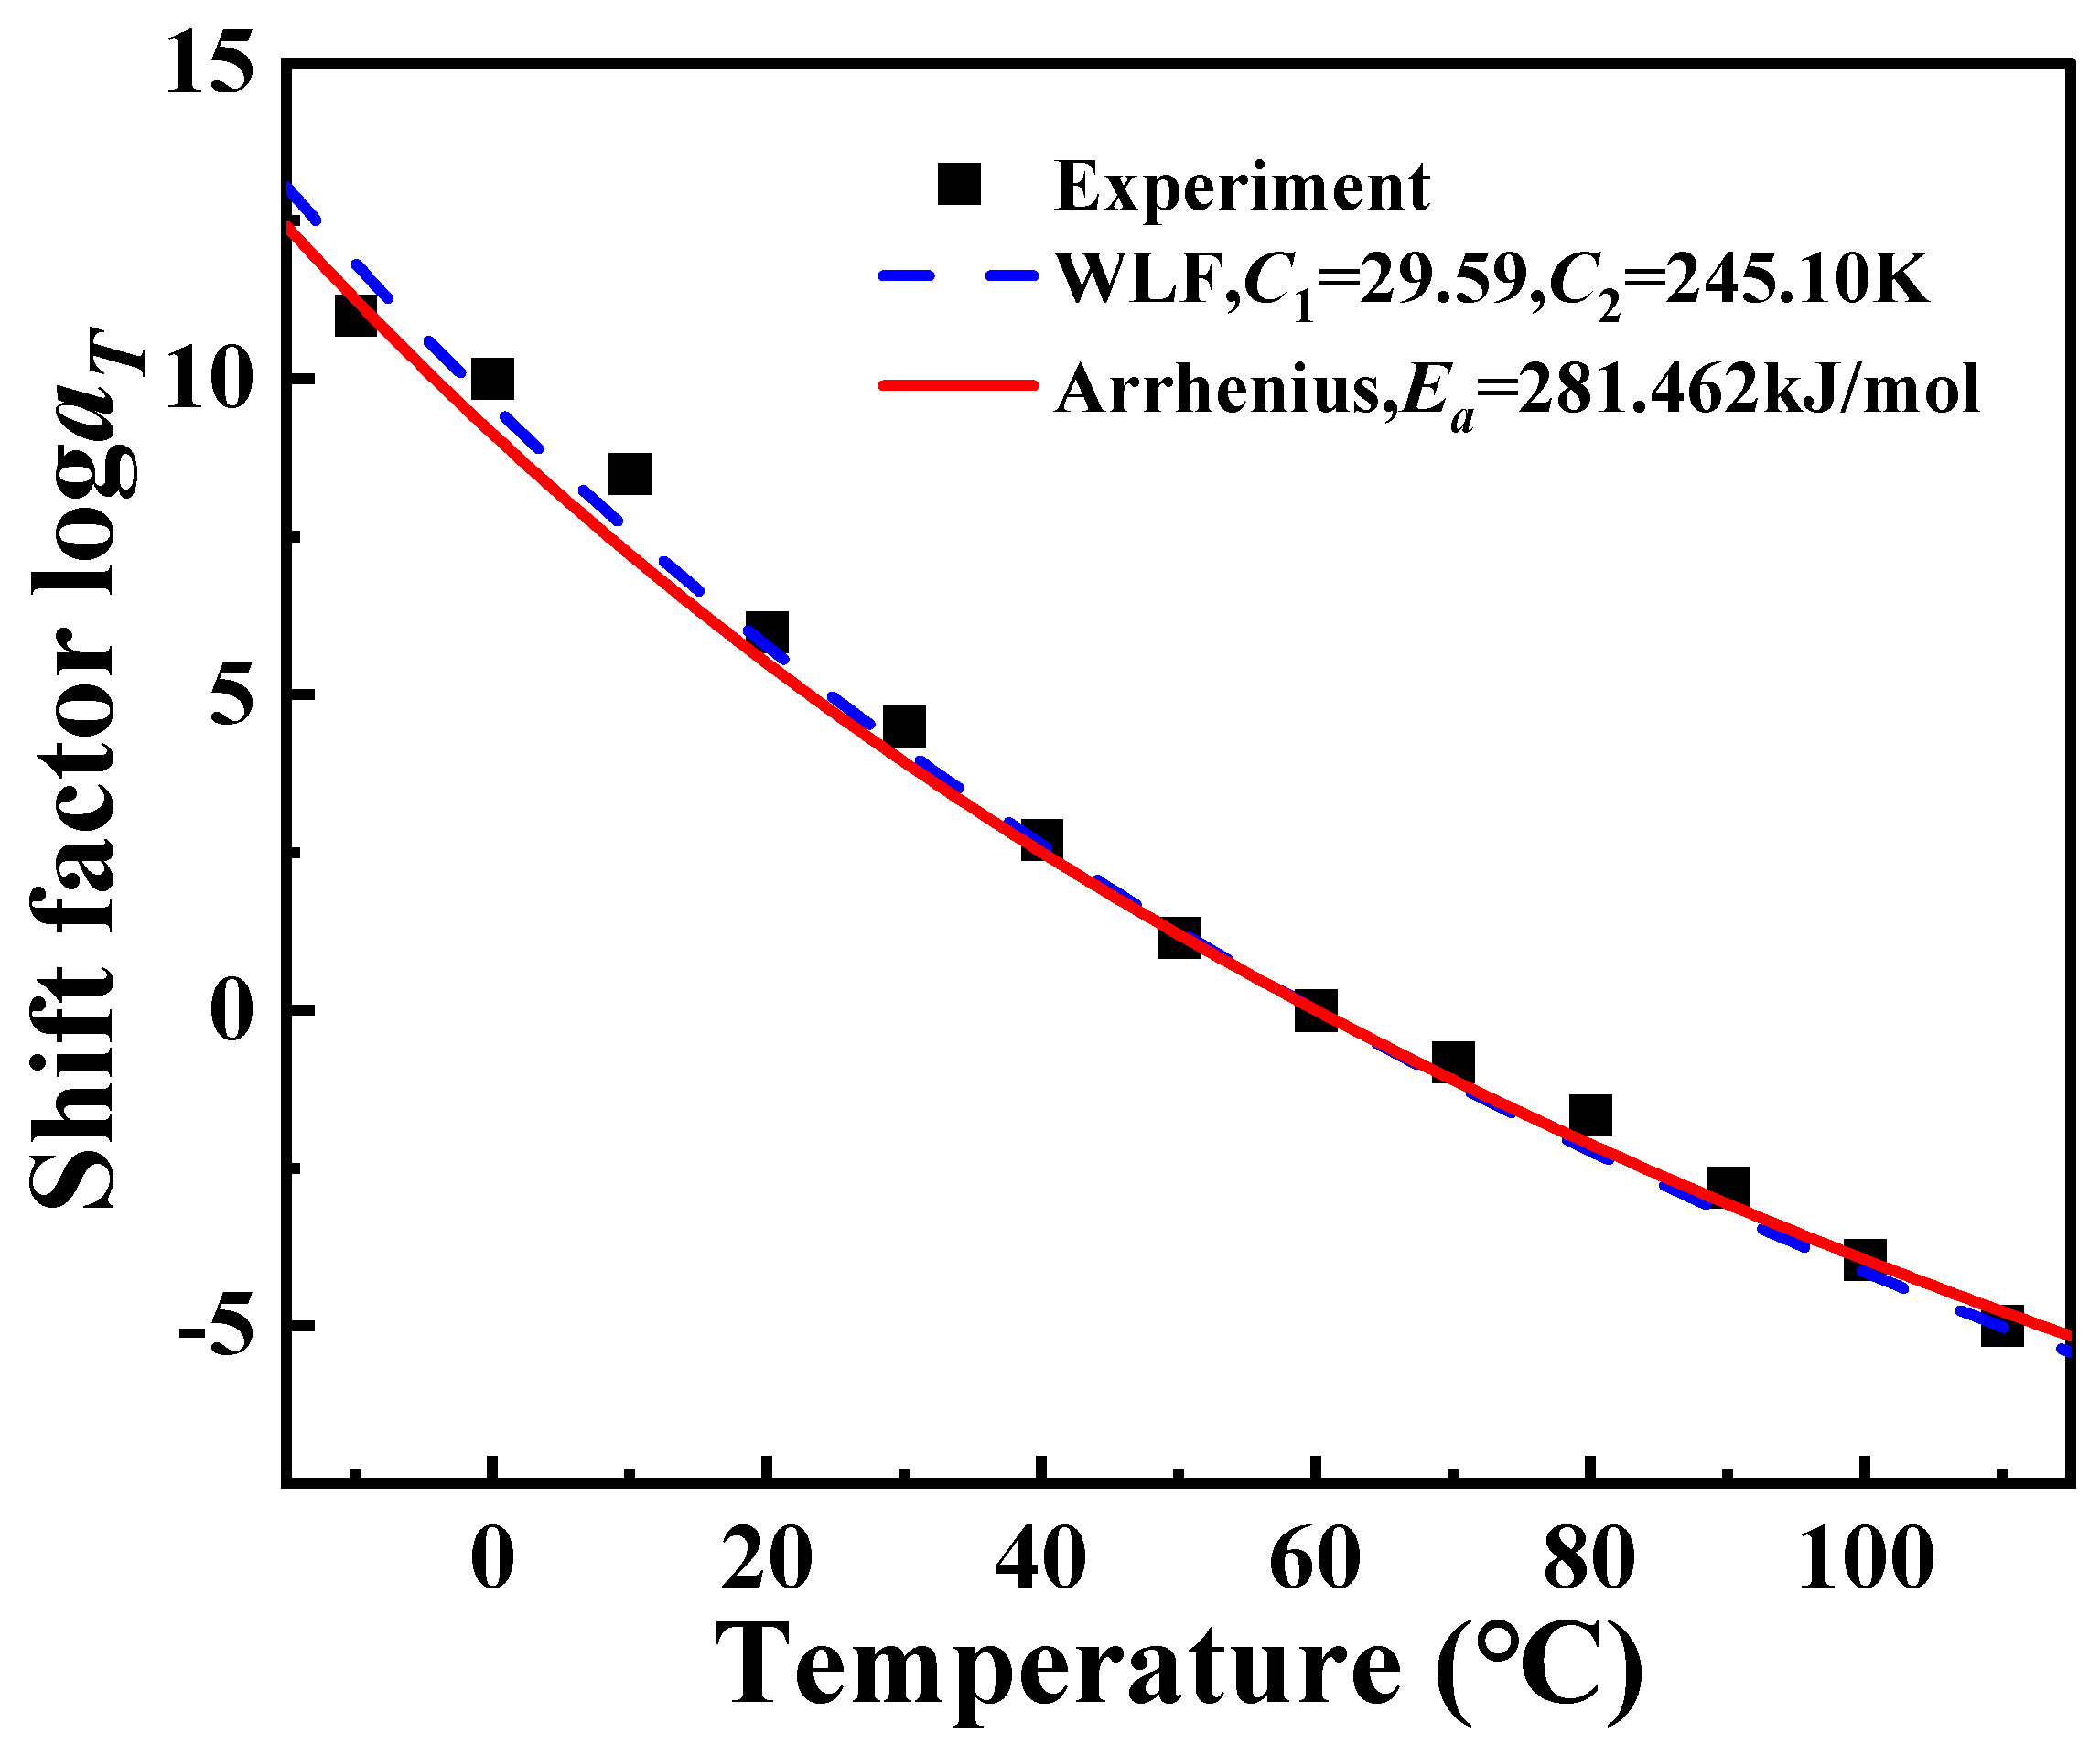
Ea into Equation (6), log
aT can also be calculated. Due to the single-use and non-recyclable nature of DMA test samples combined with the inherent microscopic variations among PA6 film samples,
Tg measured at different frequencies may exhibit variability across tests. Consequently, this variability leads to alterations in the fitted curves, resulting in some degree of error in the calculated values of
Ea. However, these errors remain within an acceptable range and do not significantly impact the overall results. At the same time, the data in
Figure 4 are fitted by Equation (4), and the parameters
C1 = 29.59 K,
C2 = 245.10 K are obtained, as shown in
Figure 9. It can be observed that the log
aT obtained by using Arrhenius, the results of WLF equation fitting, and the results of the horizontal shift factor of the experimental data are all in good agreement among the three, which leads to the conclusion that both Arrhenius and WLF can be used as research methods for the investigation of the rheological behavior of PA6 film.

