
Supercritical Antisolvent Precipitation of Corticosteroids/β-Cyclodextrin Inclusion Complexes


Abstract
:1. Introduction
2. Materials and Methods
2.1. Materials
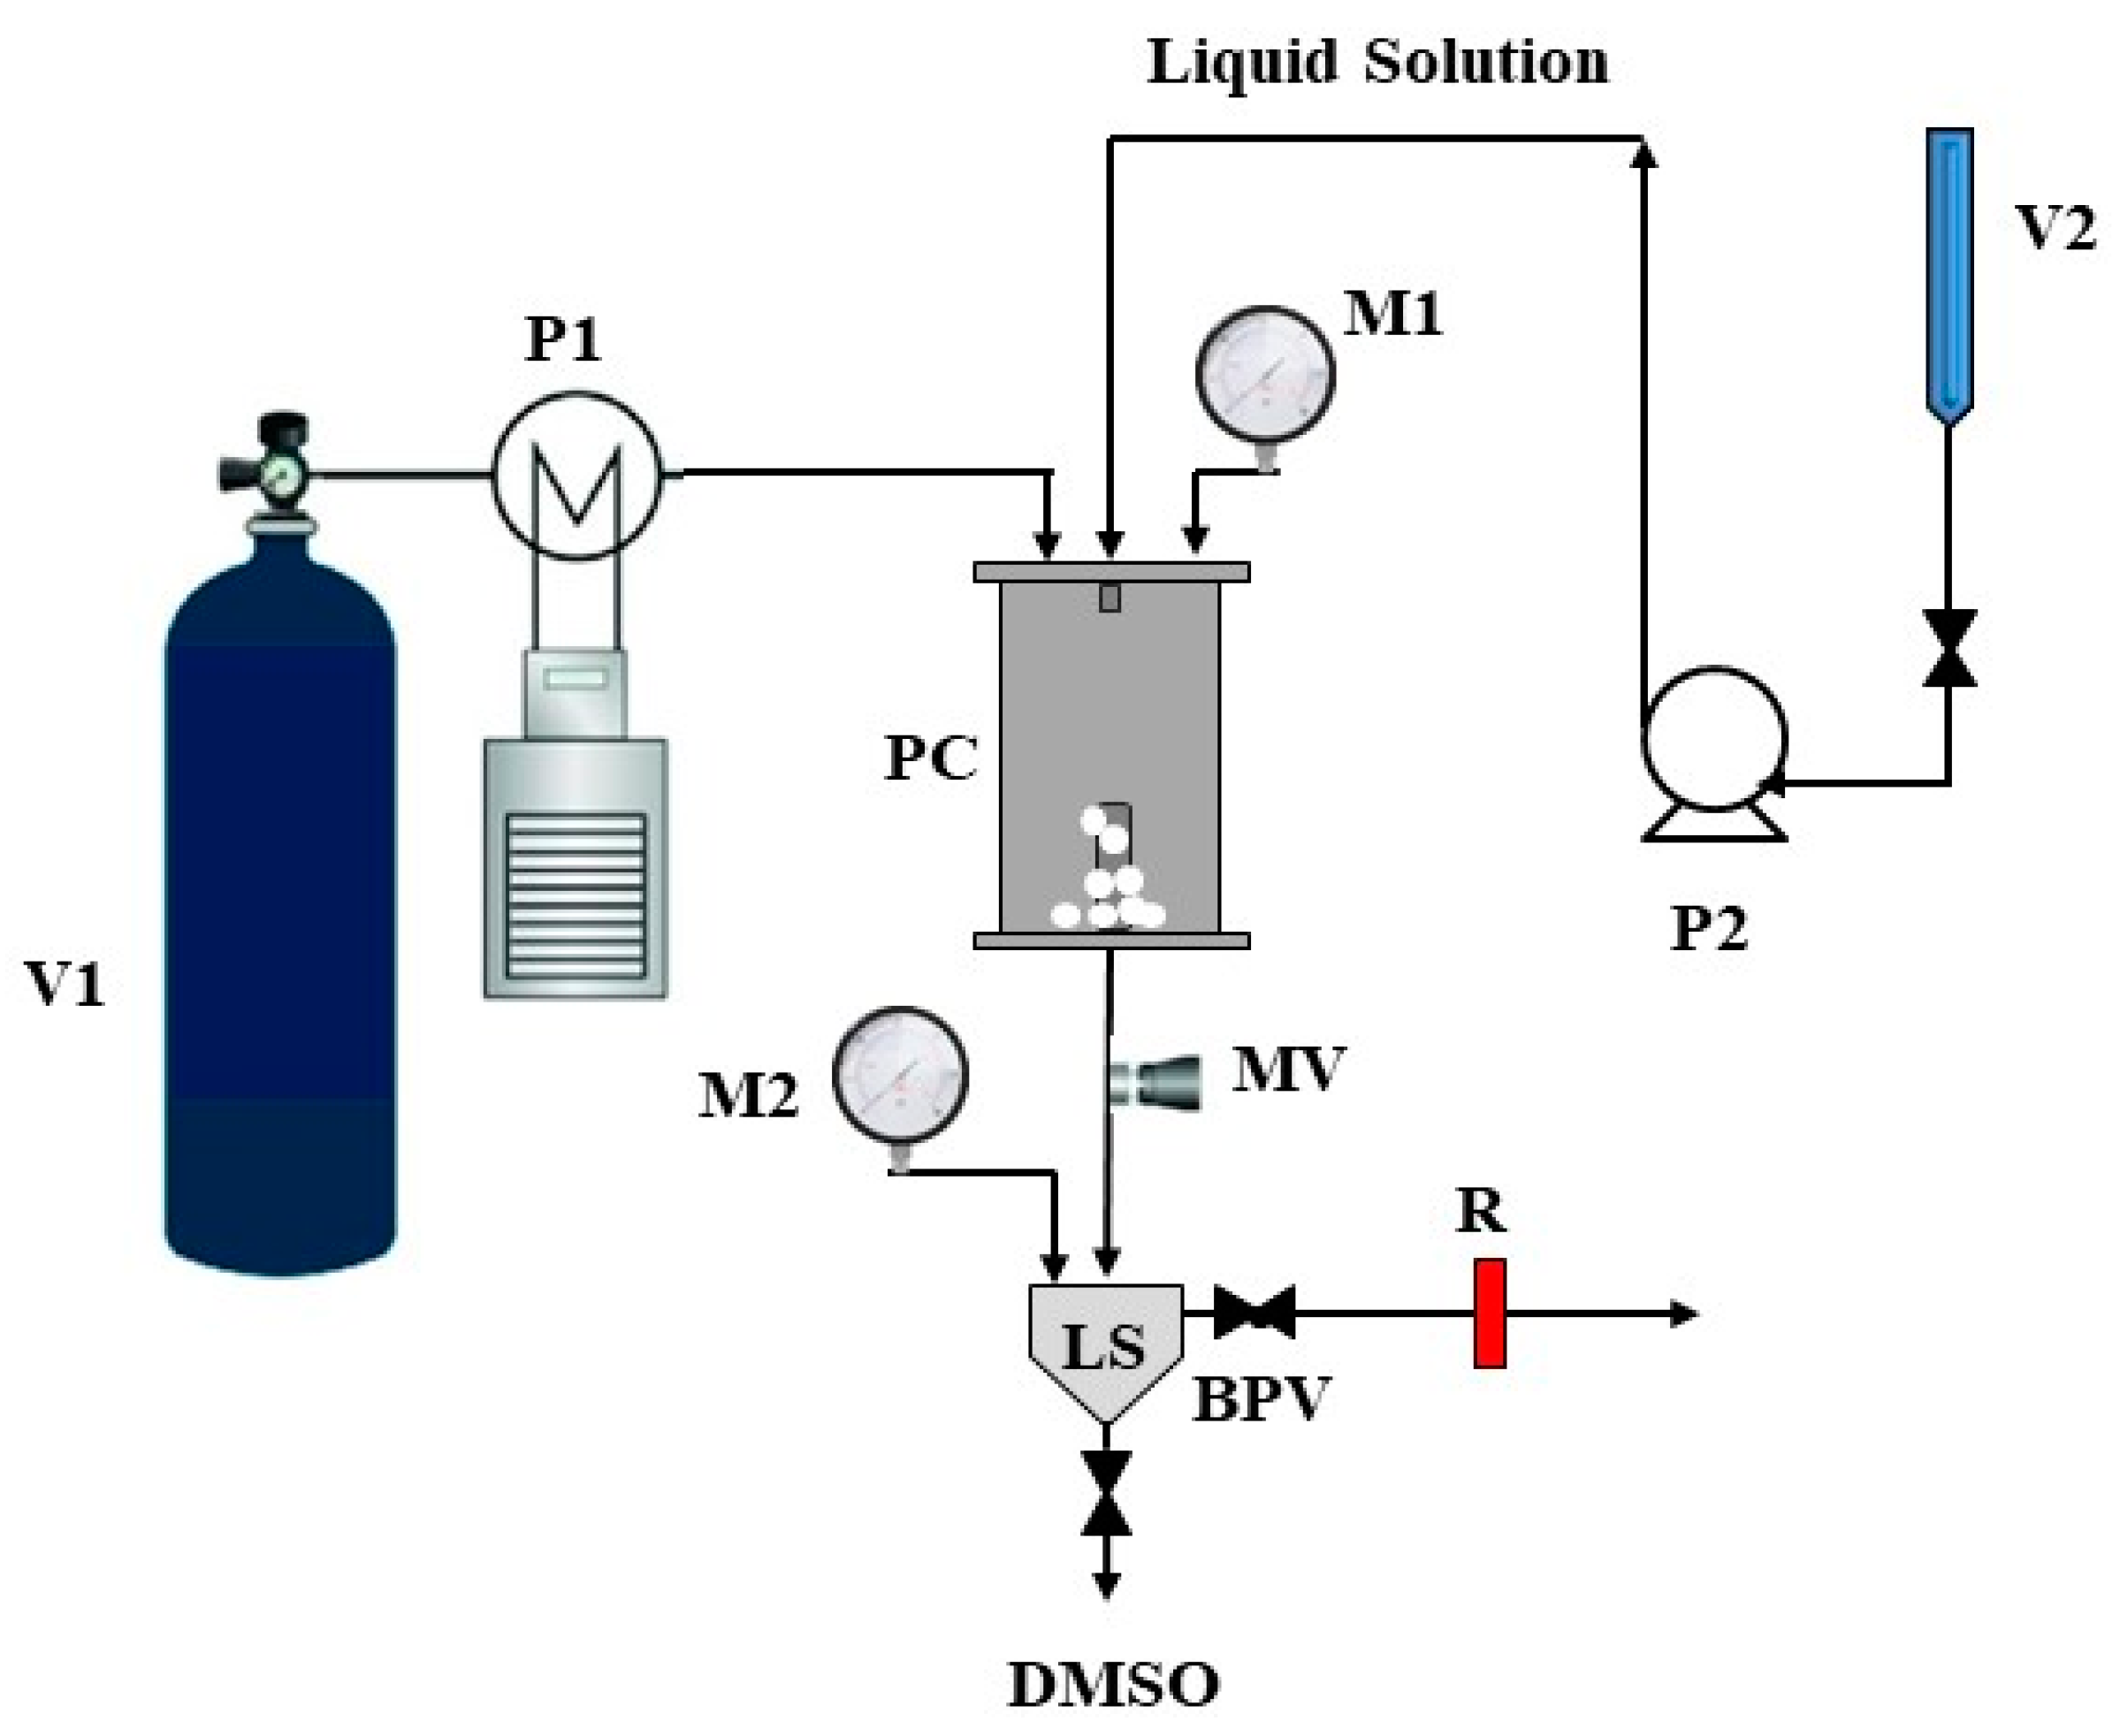
2.2. Supercritical Antisolvent (SAS) Process
2.3. Characterization Techniques
2.3.1. FESEM Characterization and PSD Evaluation
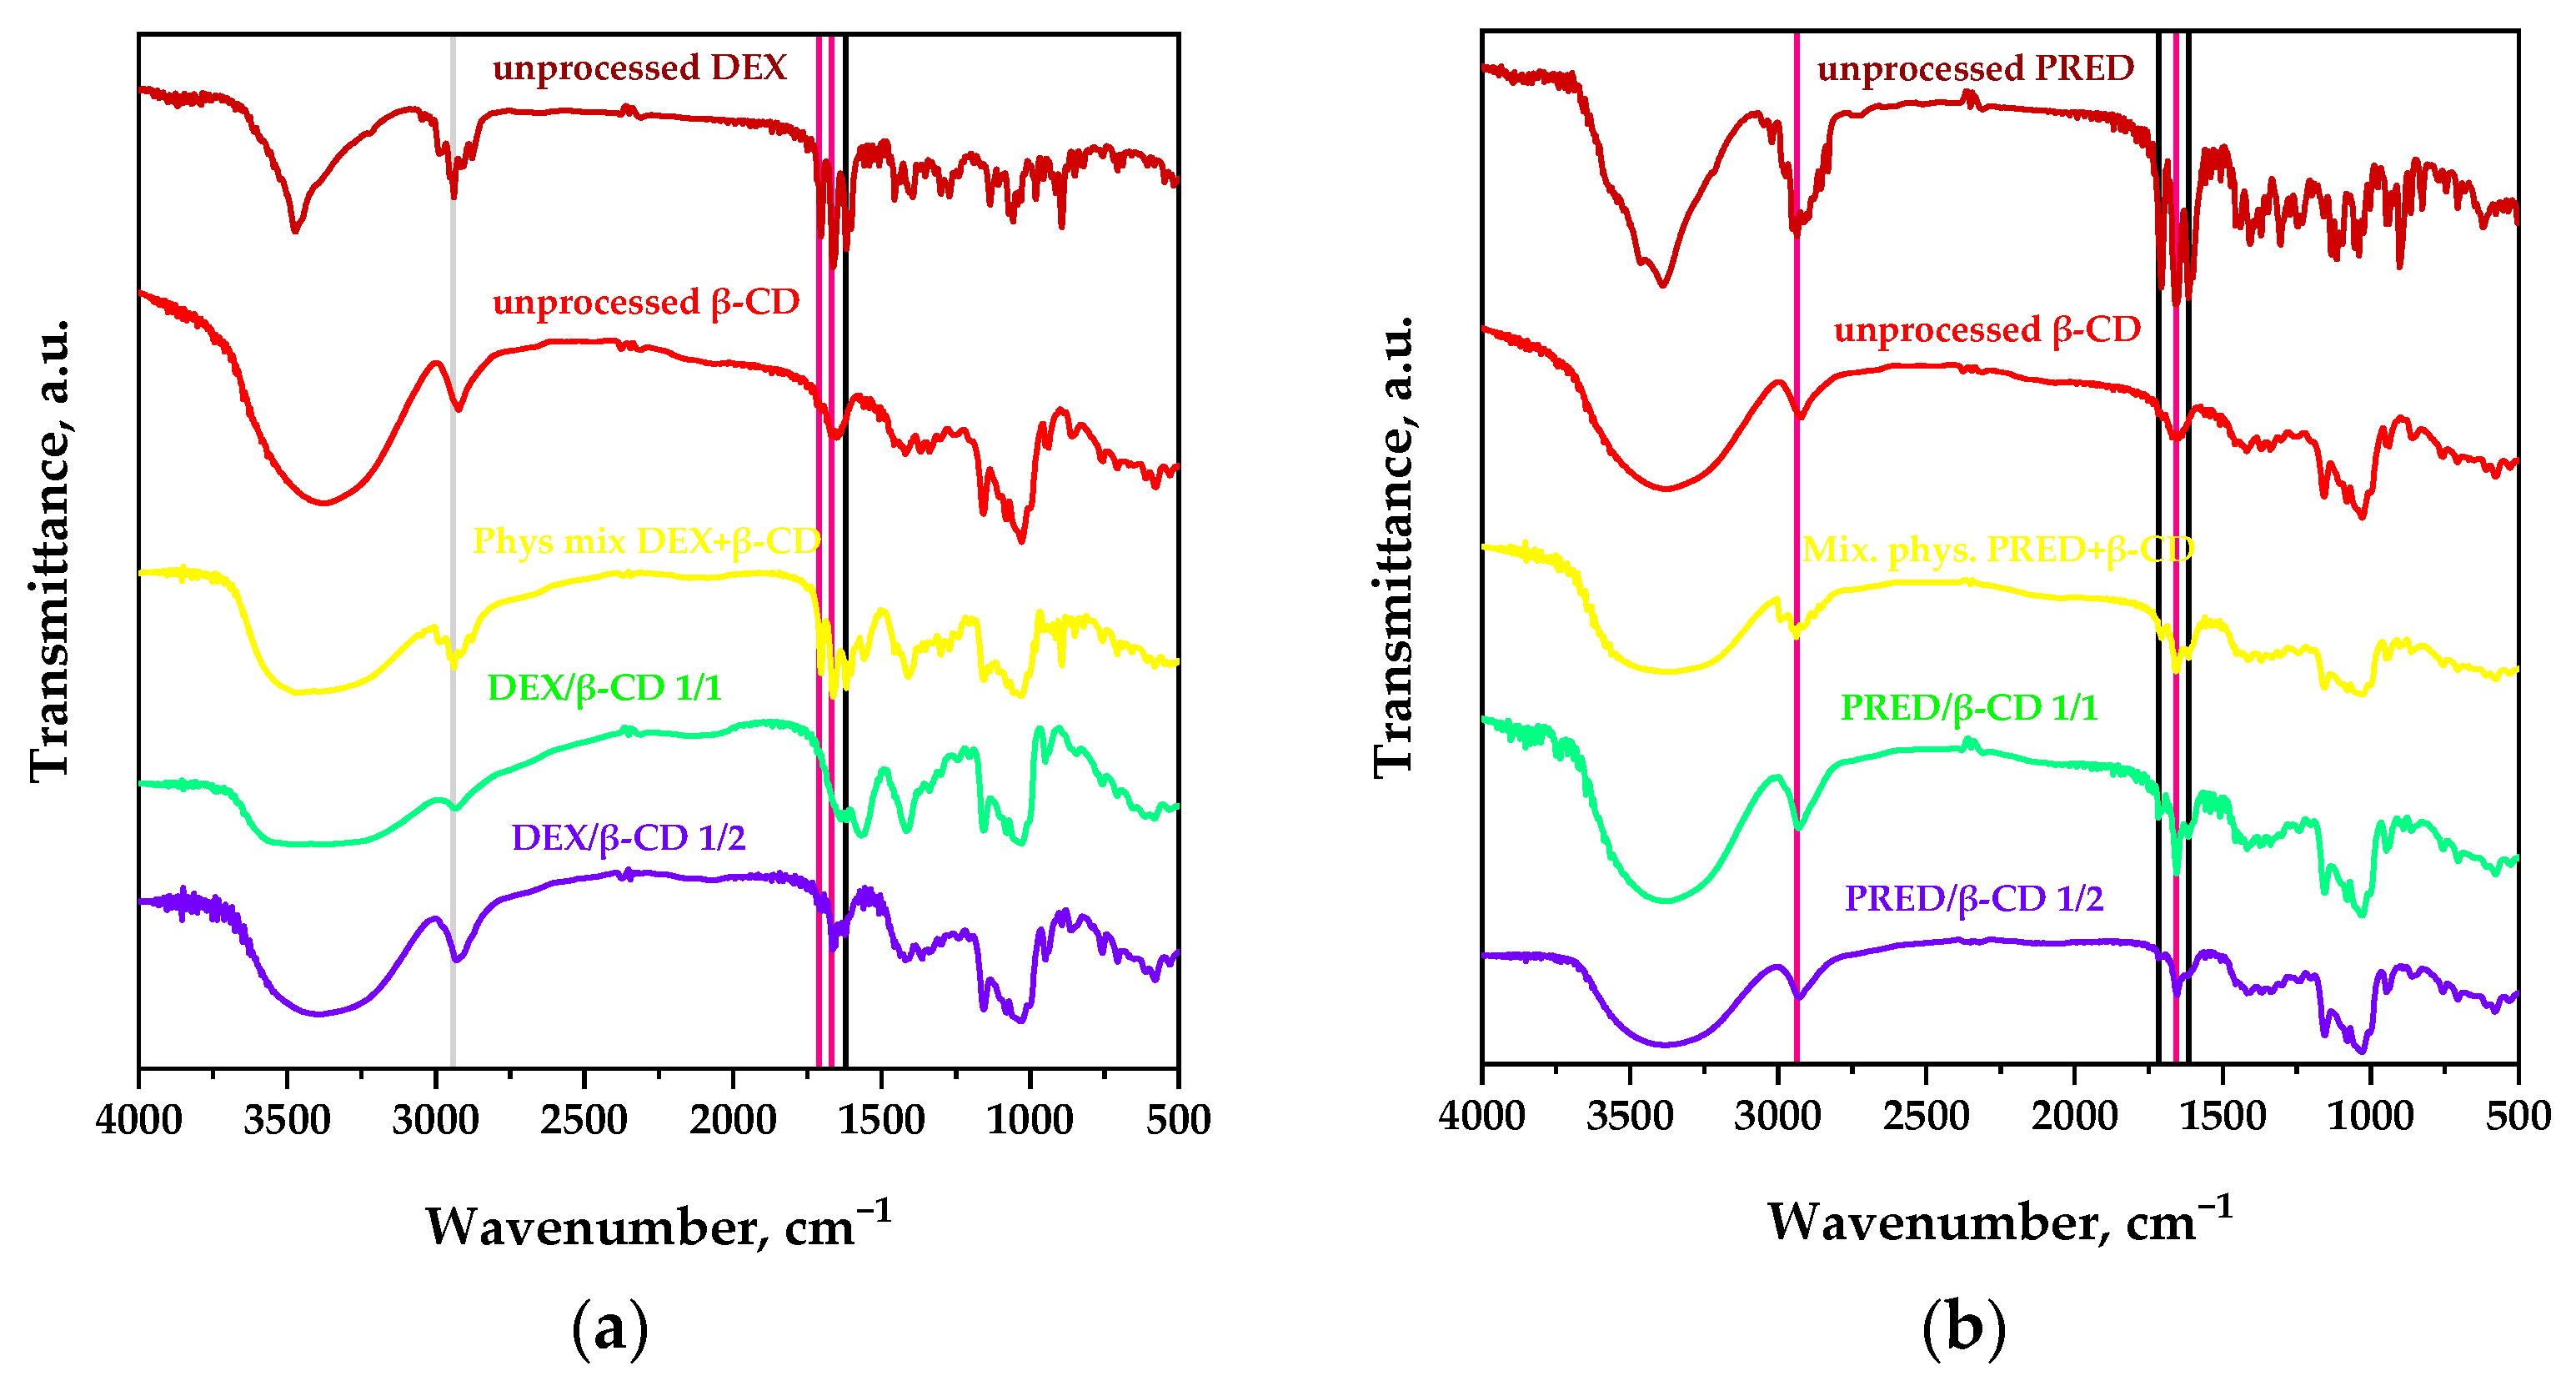
2.3.2. Fourier Transform Infrared Characterization
2.3.3. X-ray Diffraction
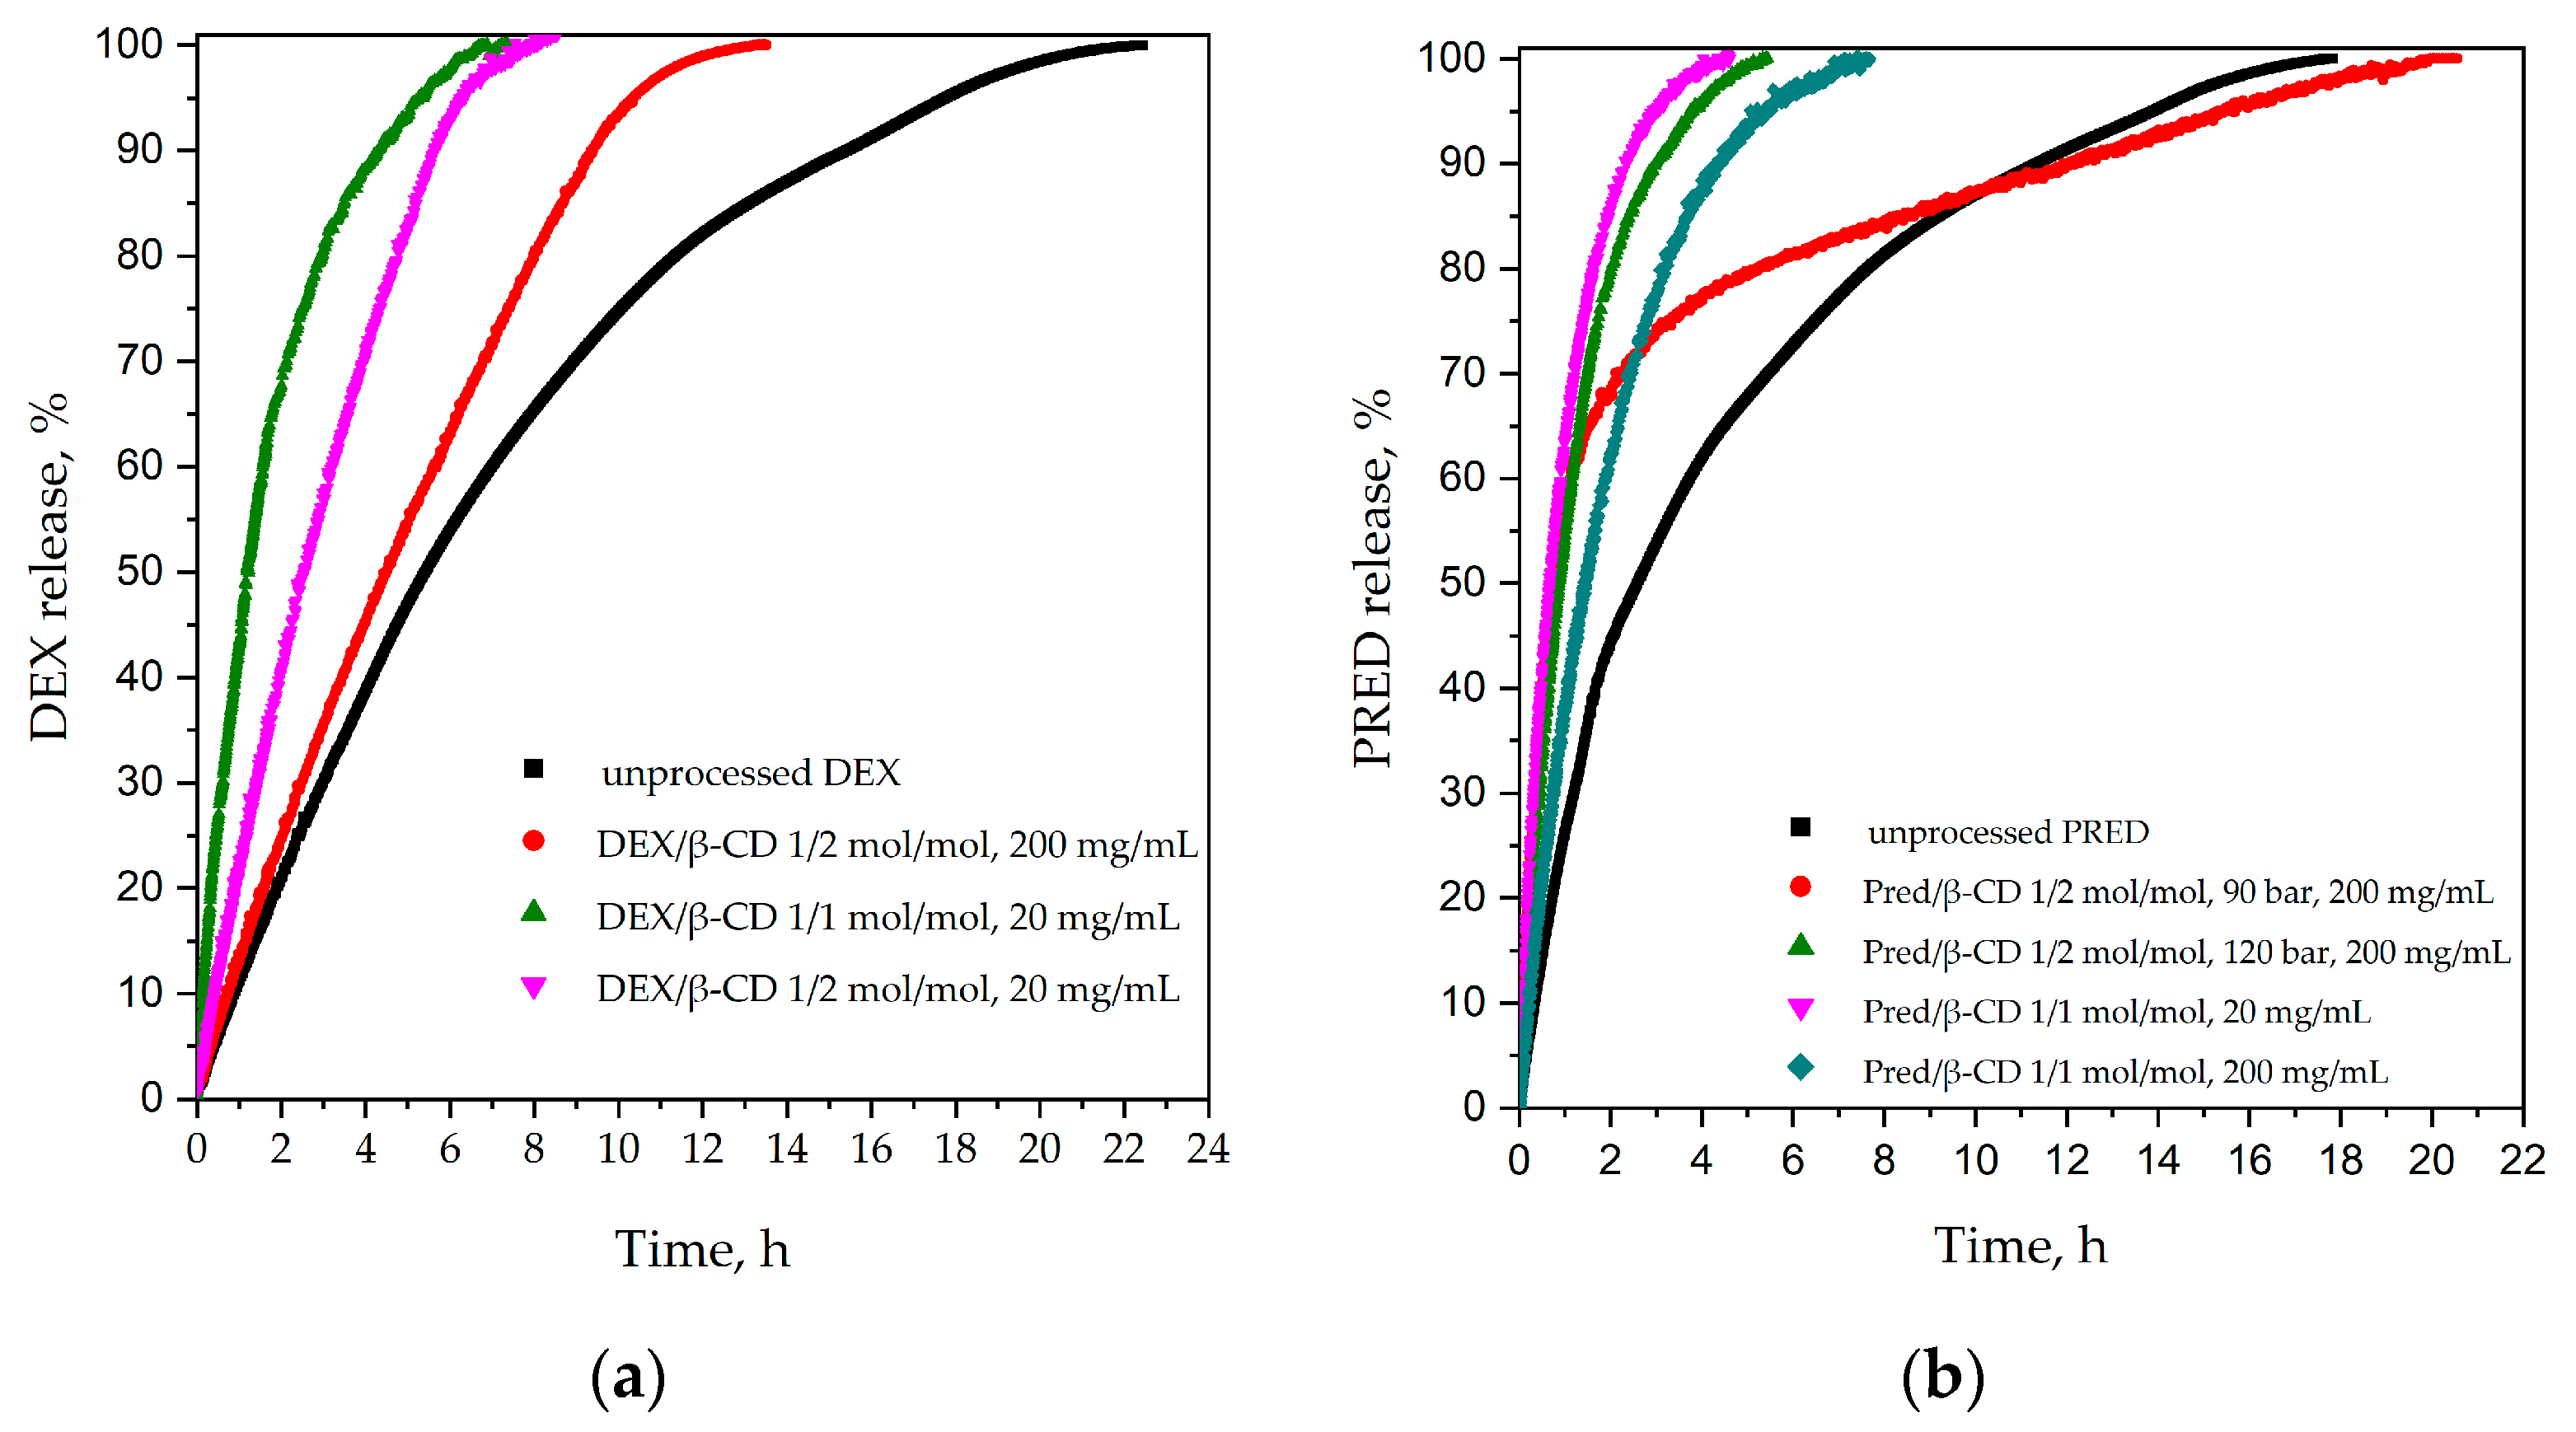
2.3.4. Dissolution Tests
2.3.5. Dissolution Tests
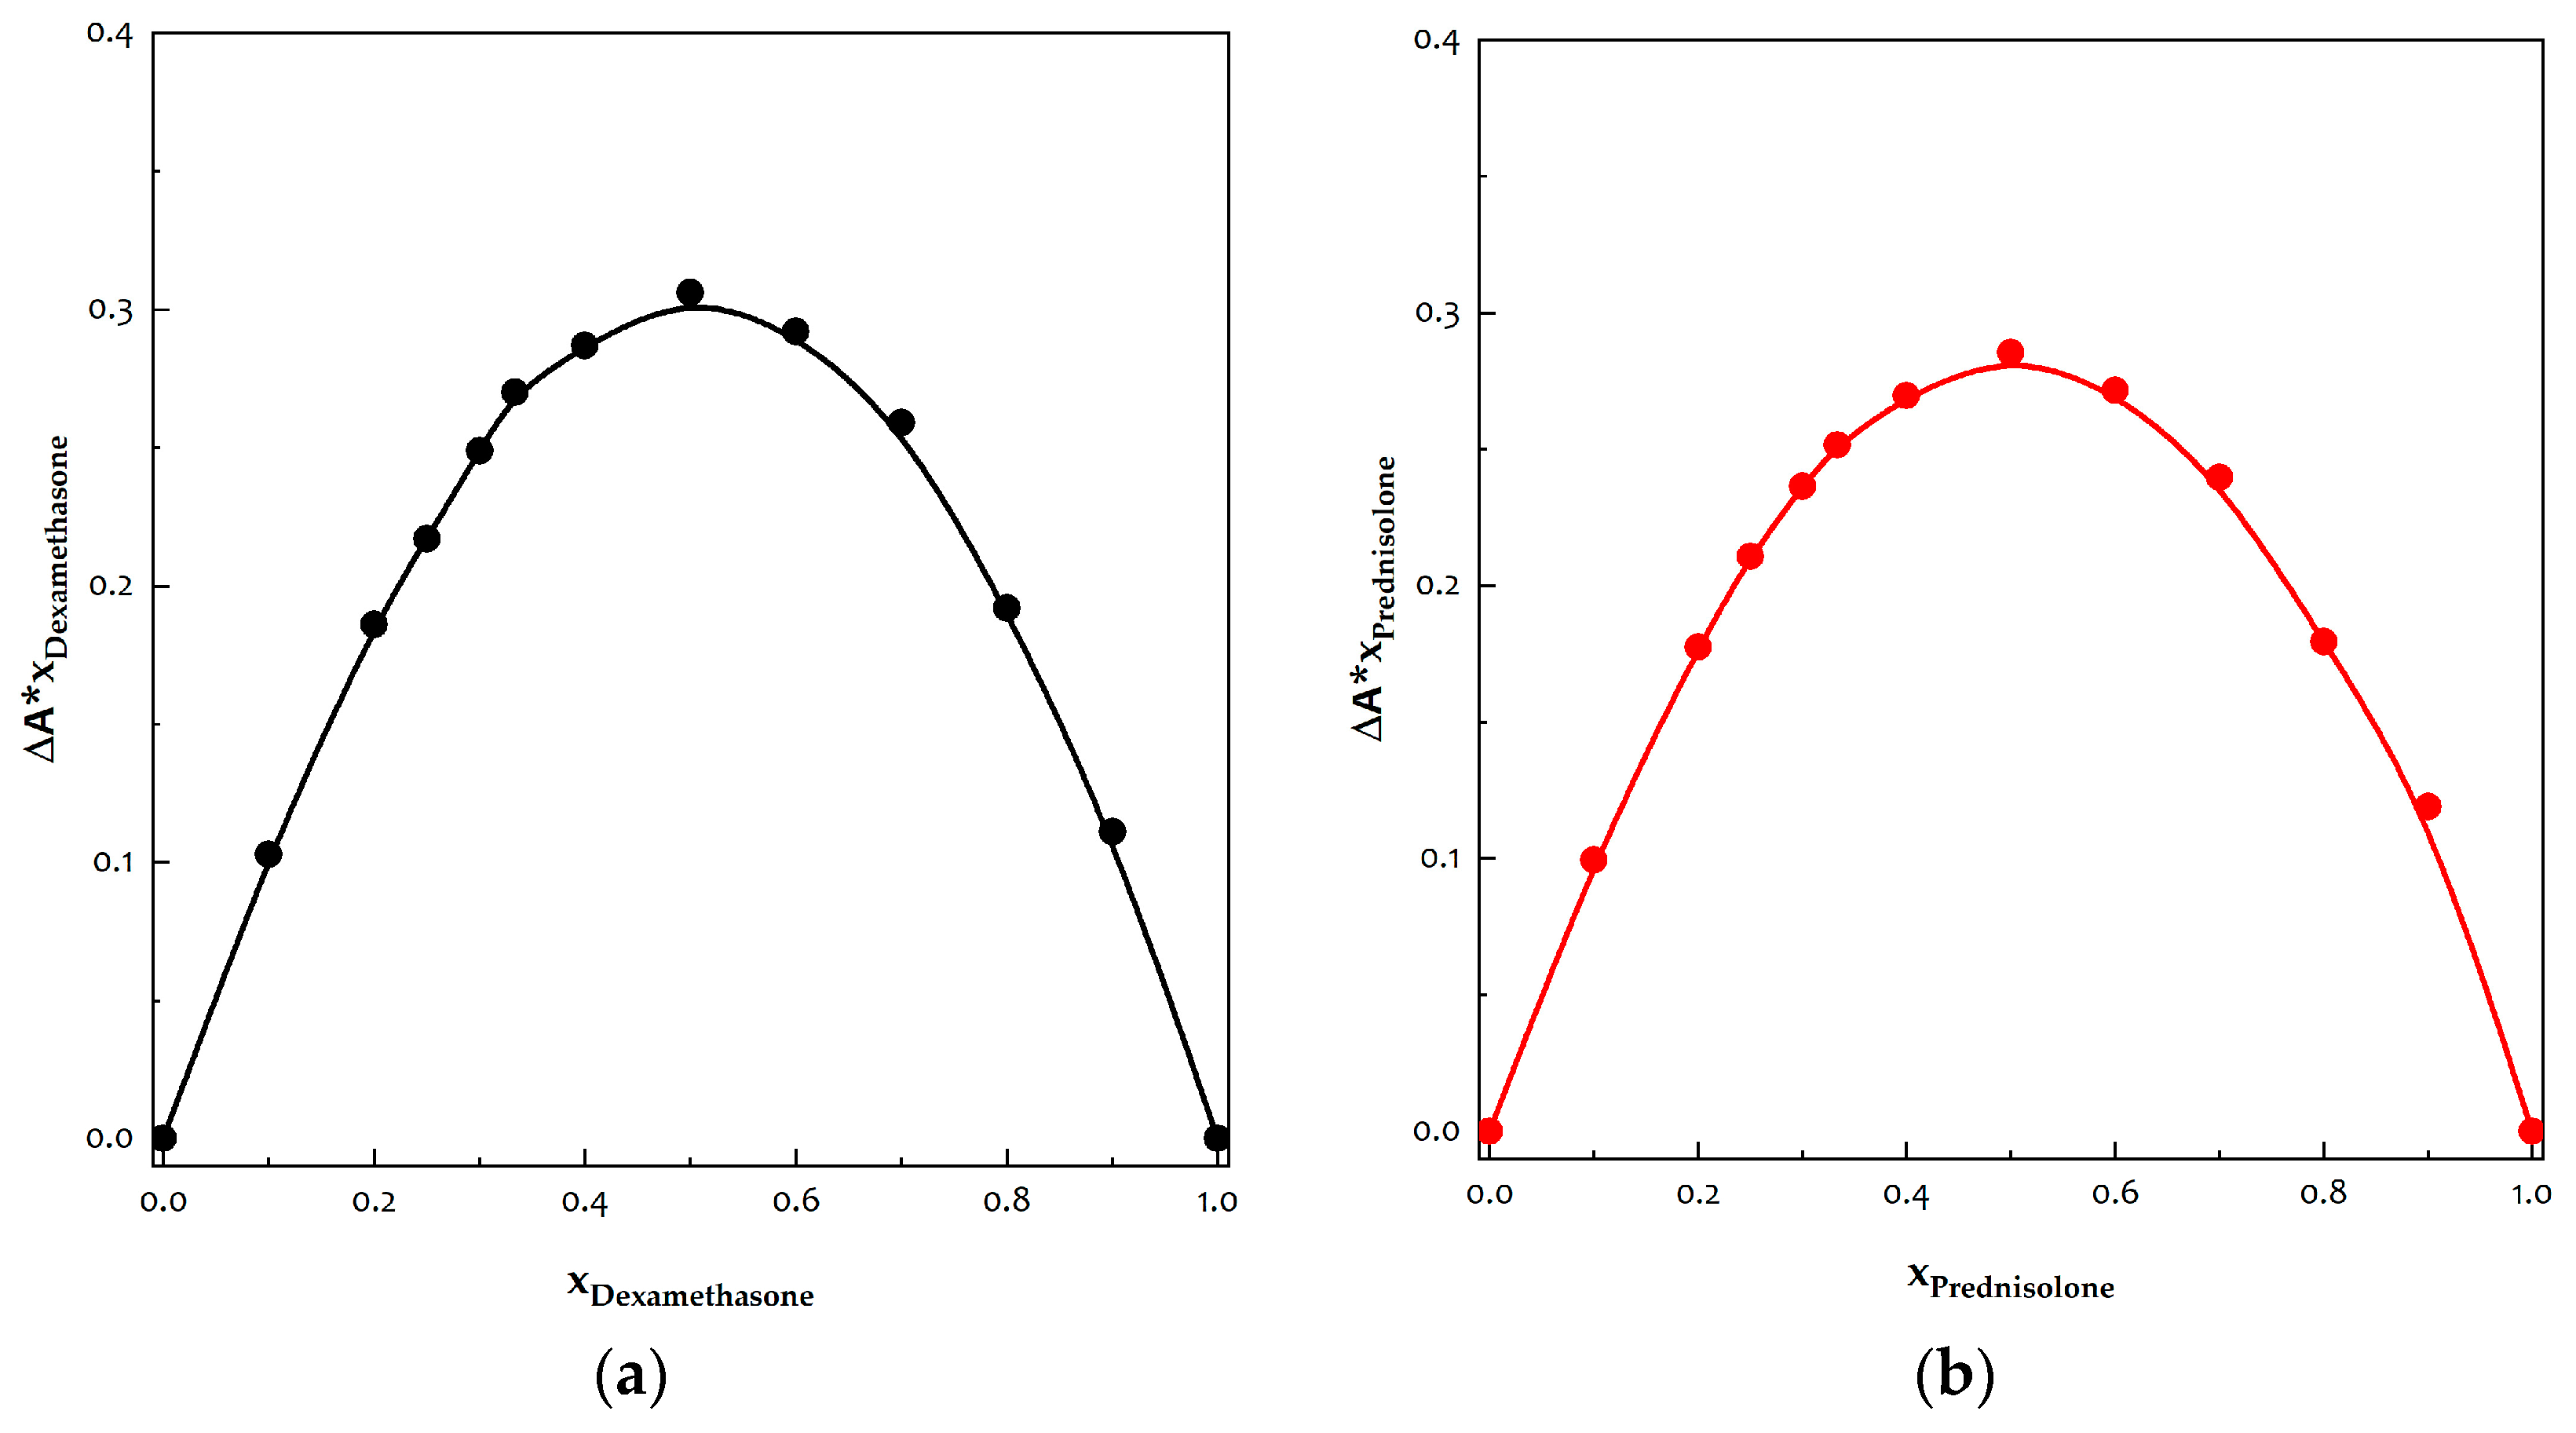
2.3.6. Job’s Method
3. Results and Discussion
3.1. Preliminary Test for DEX Micronization
3.2. DEX/β-Cyclodextrin
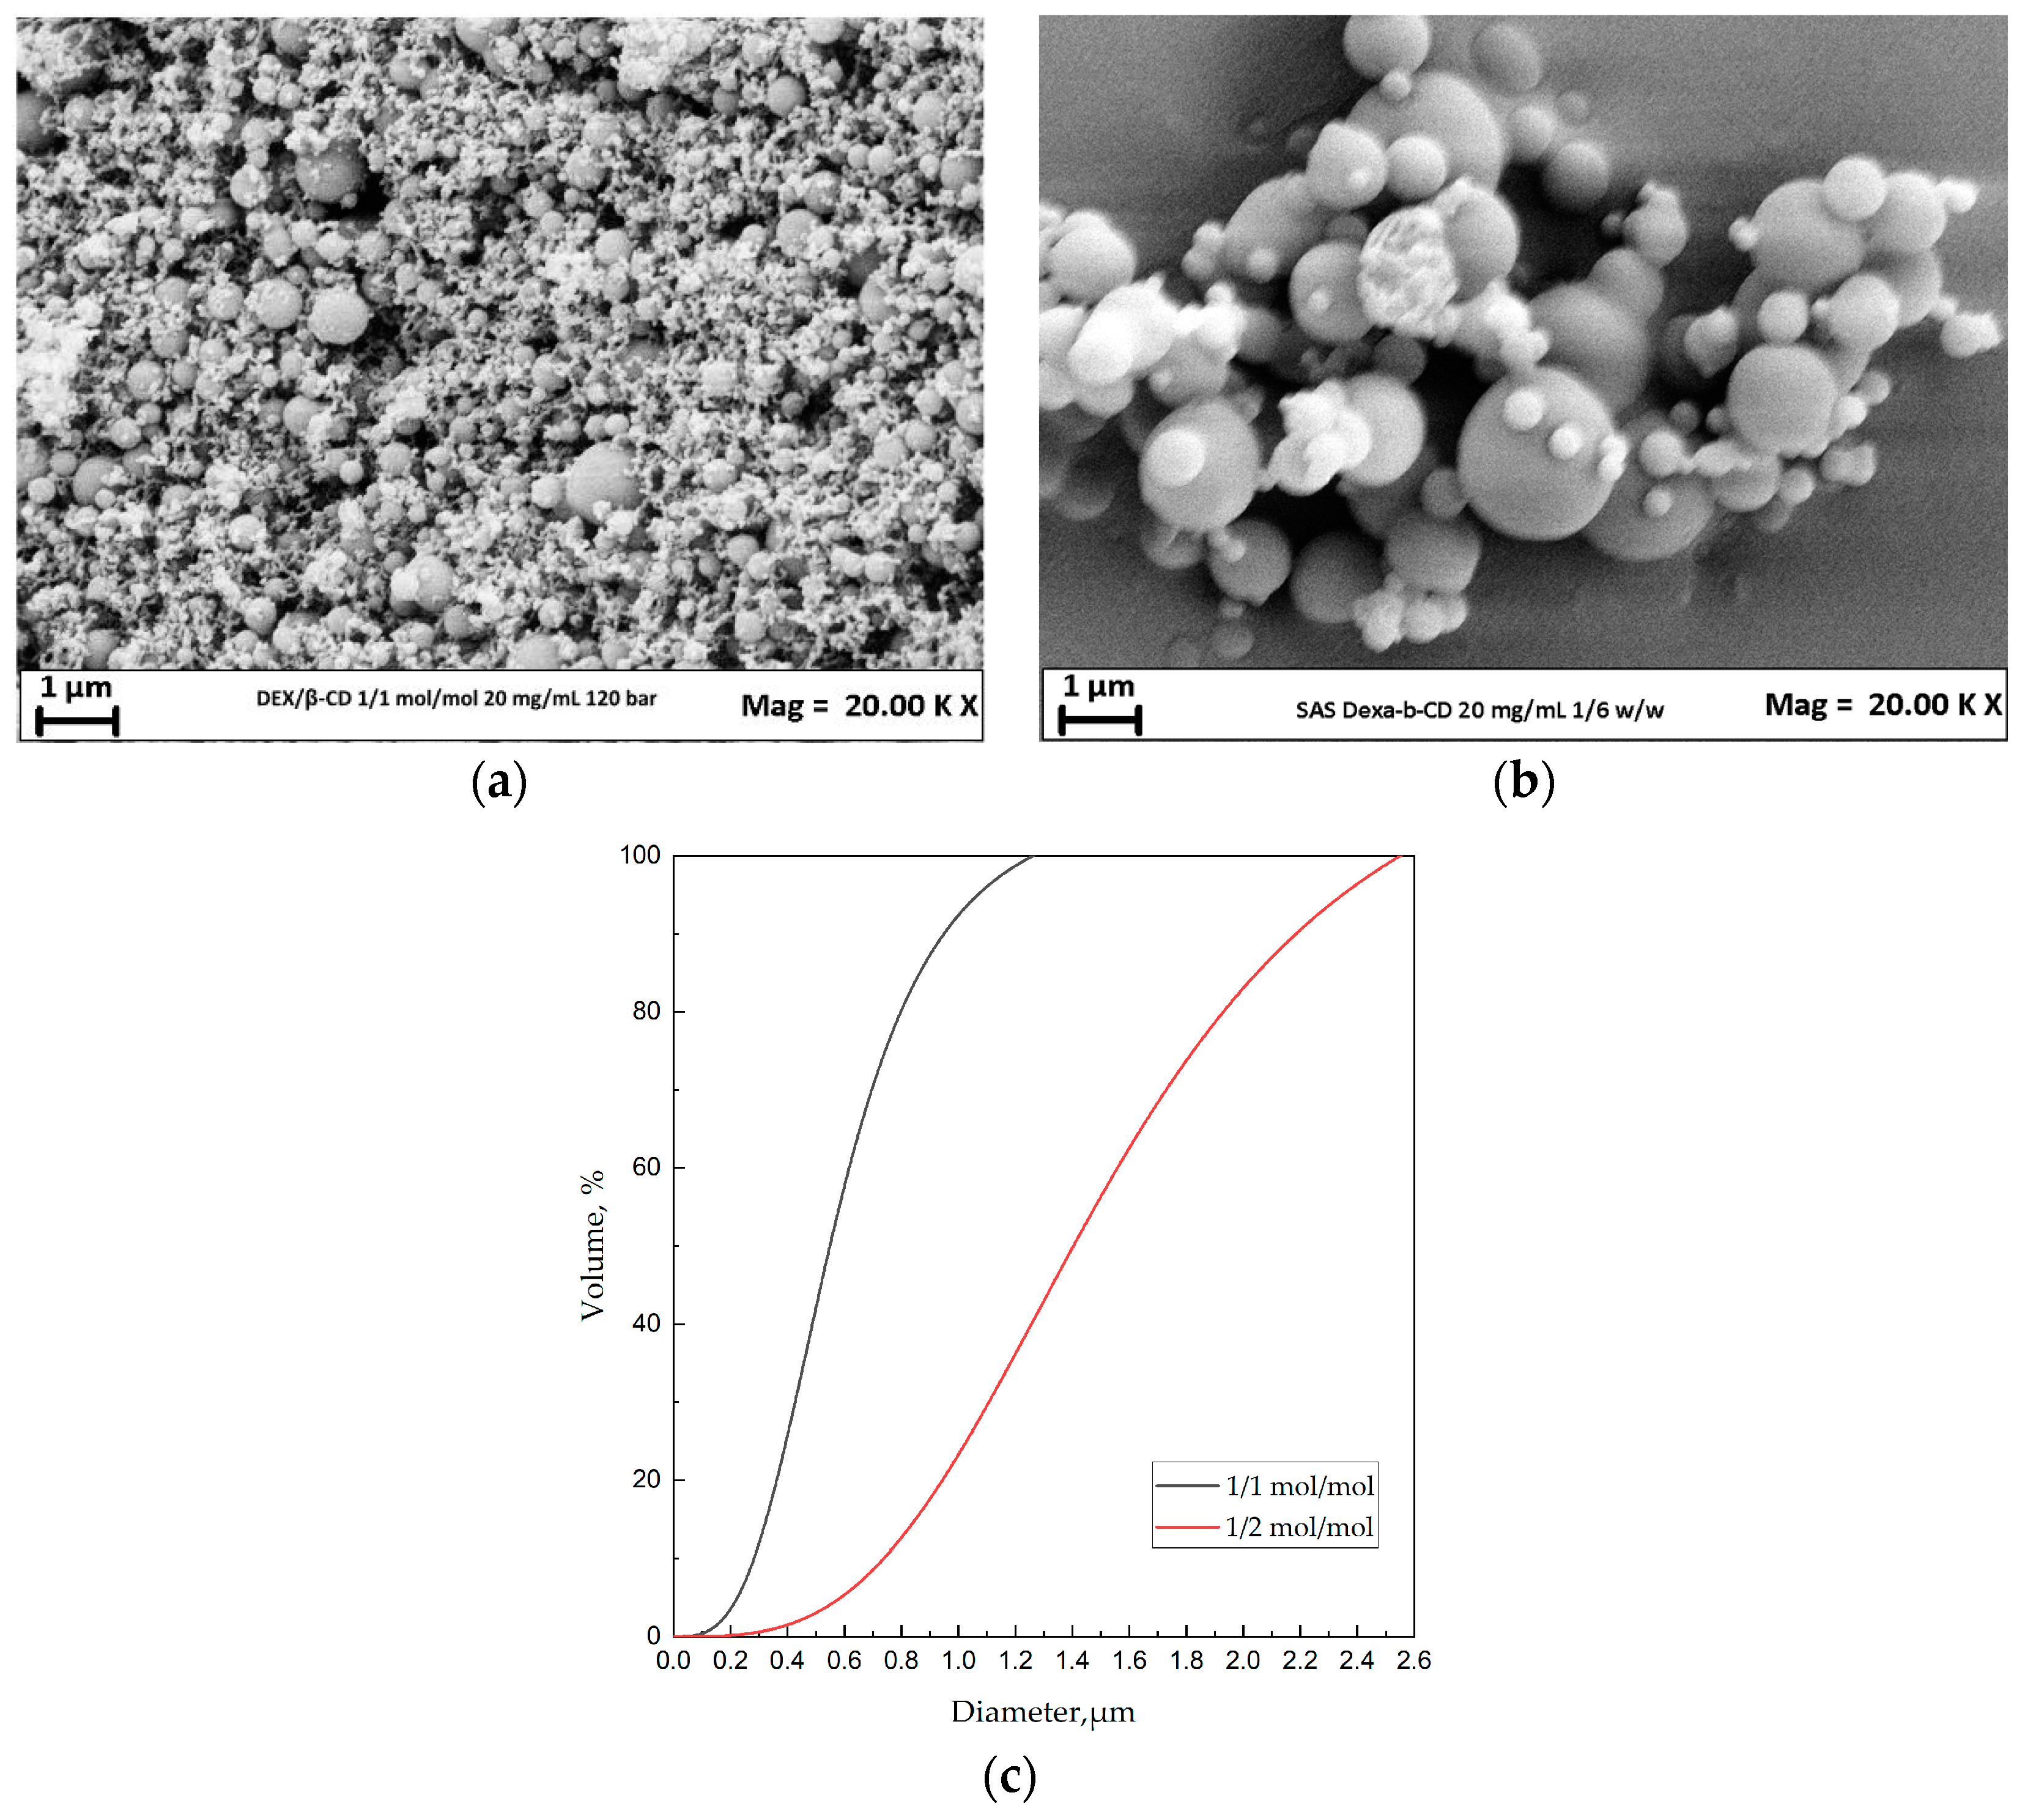
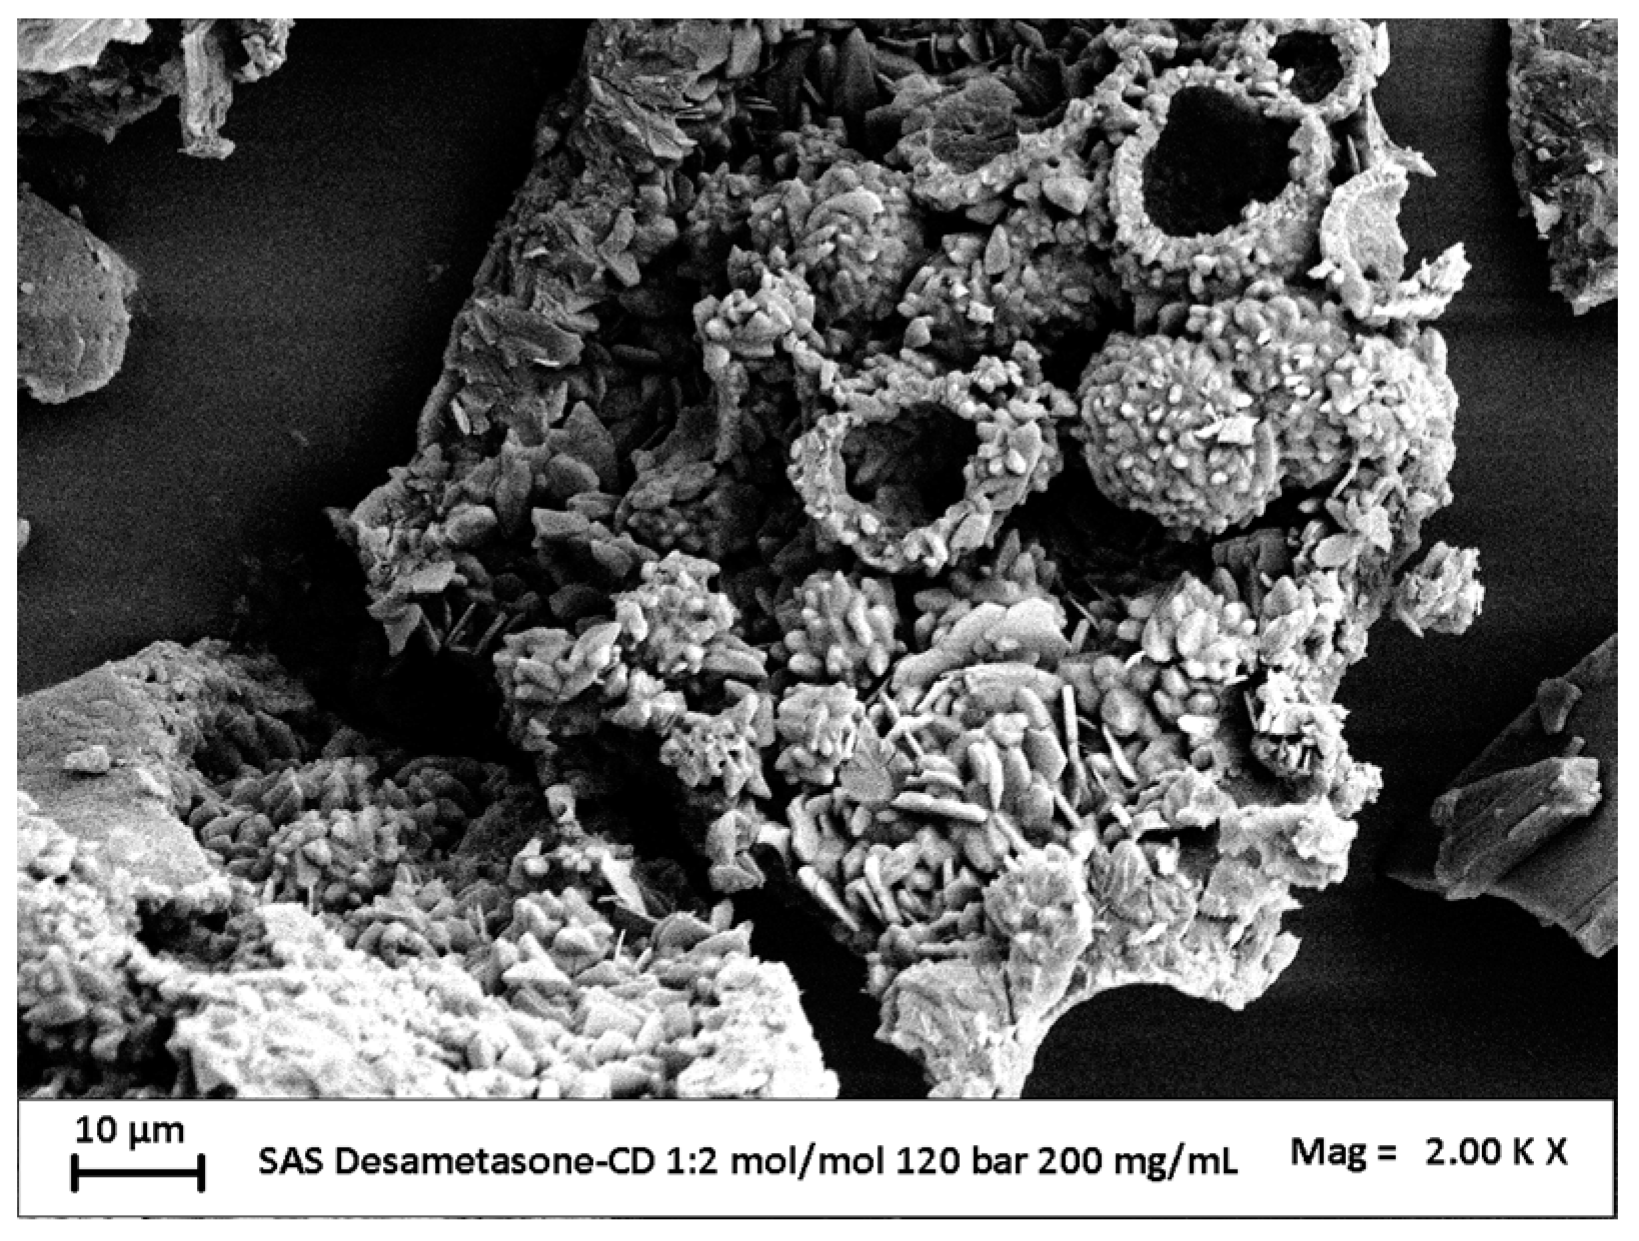
3.2.1. Effect of the DEX/β-CD Ratio
3.2.2. Effect of Concentration
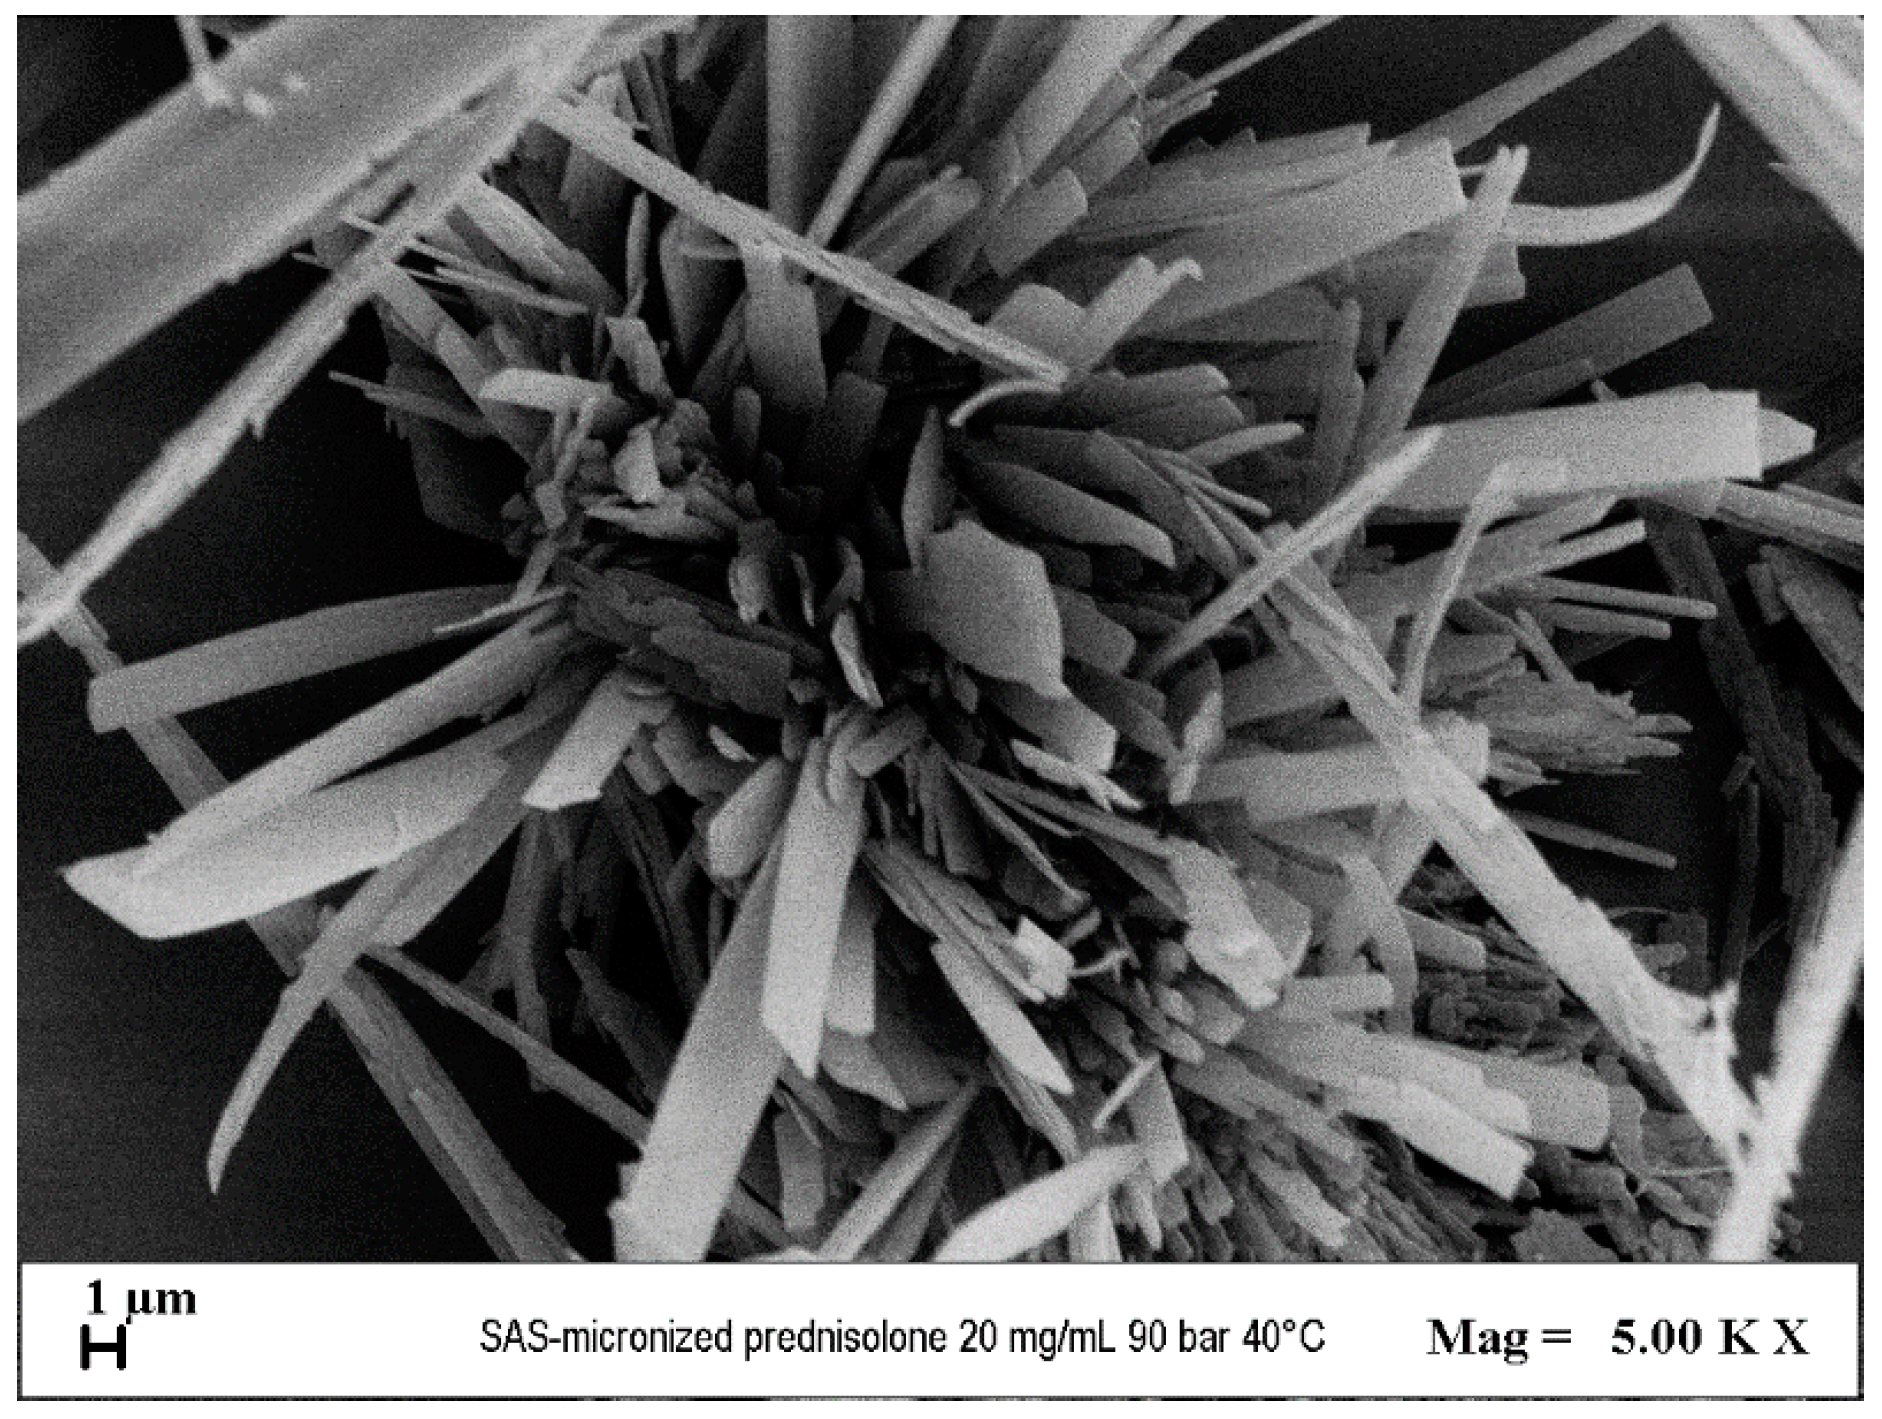
3.3. Preliminary Test for PRED Micronization
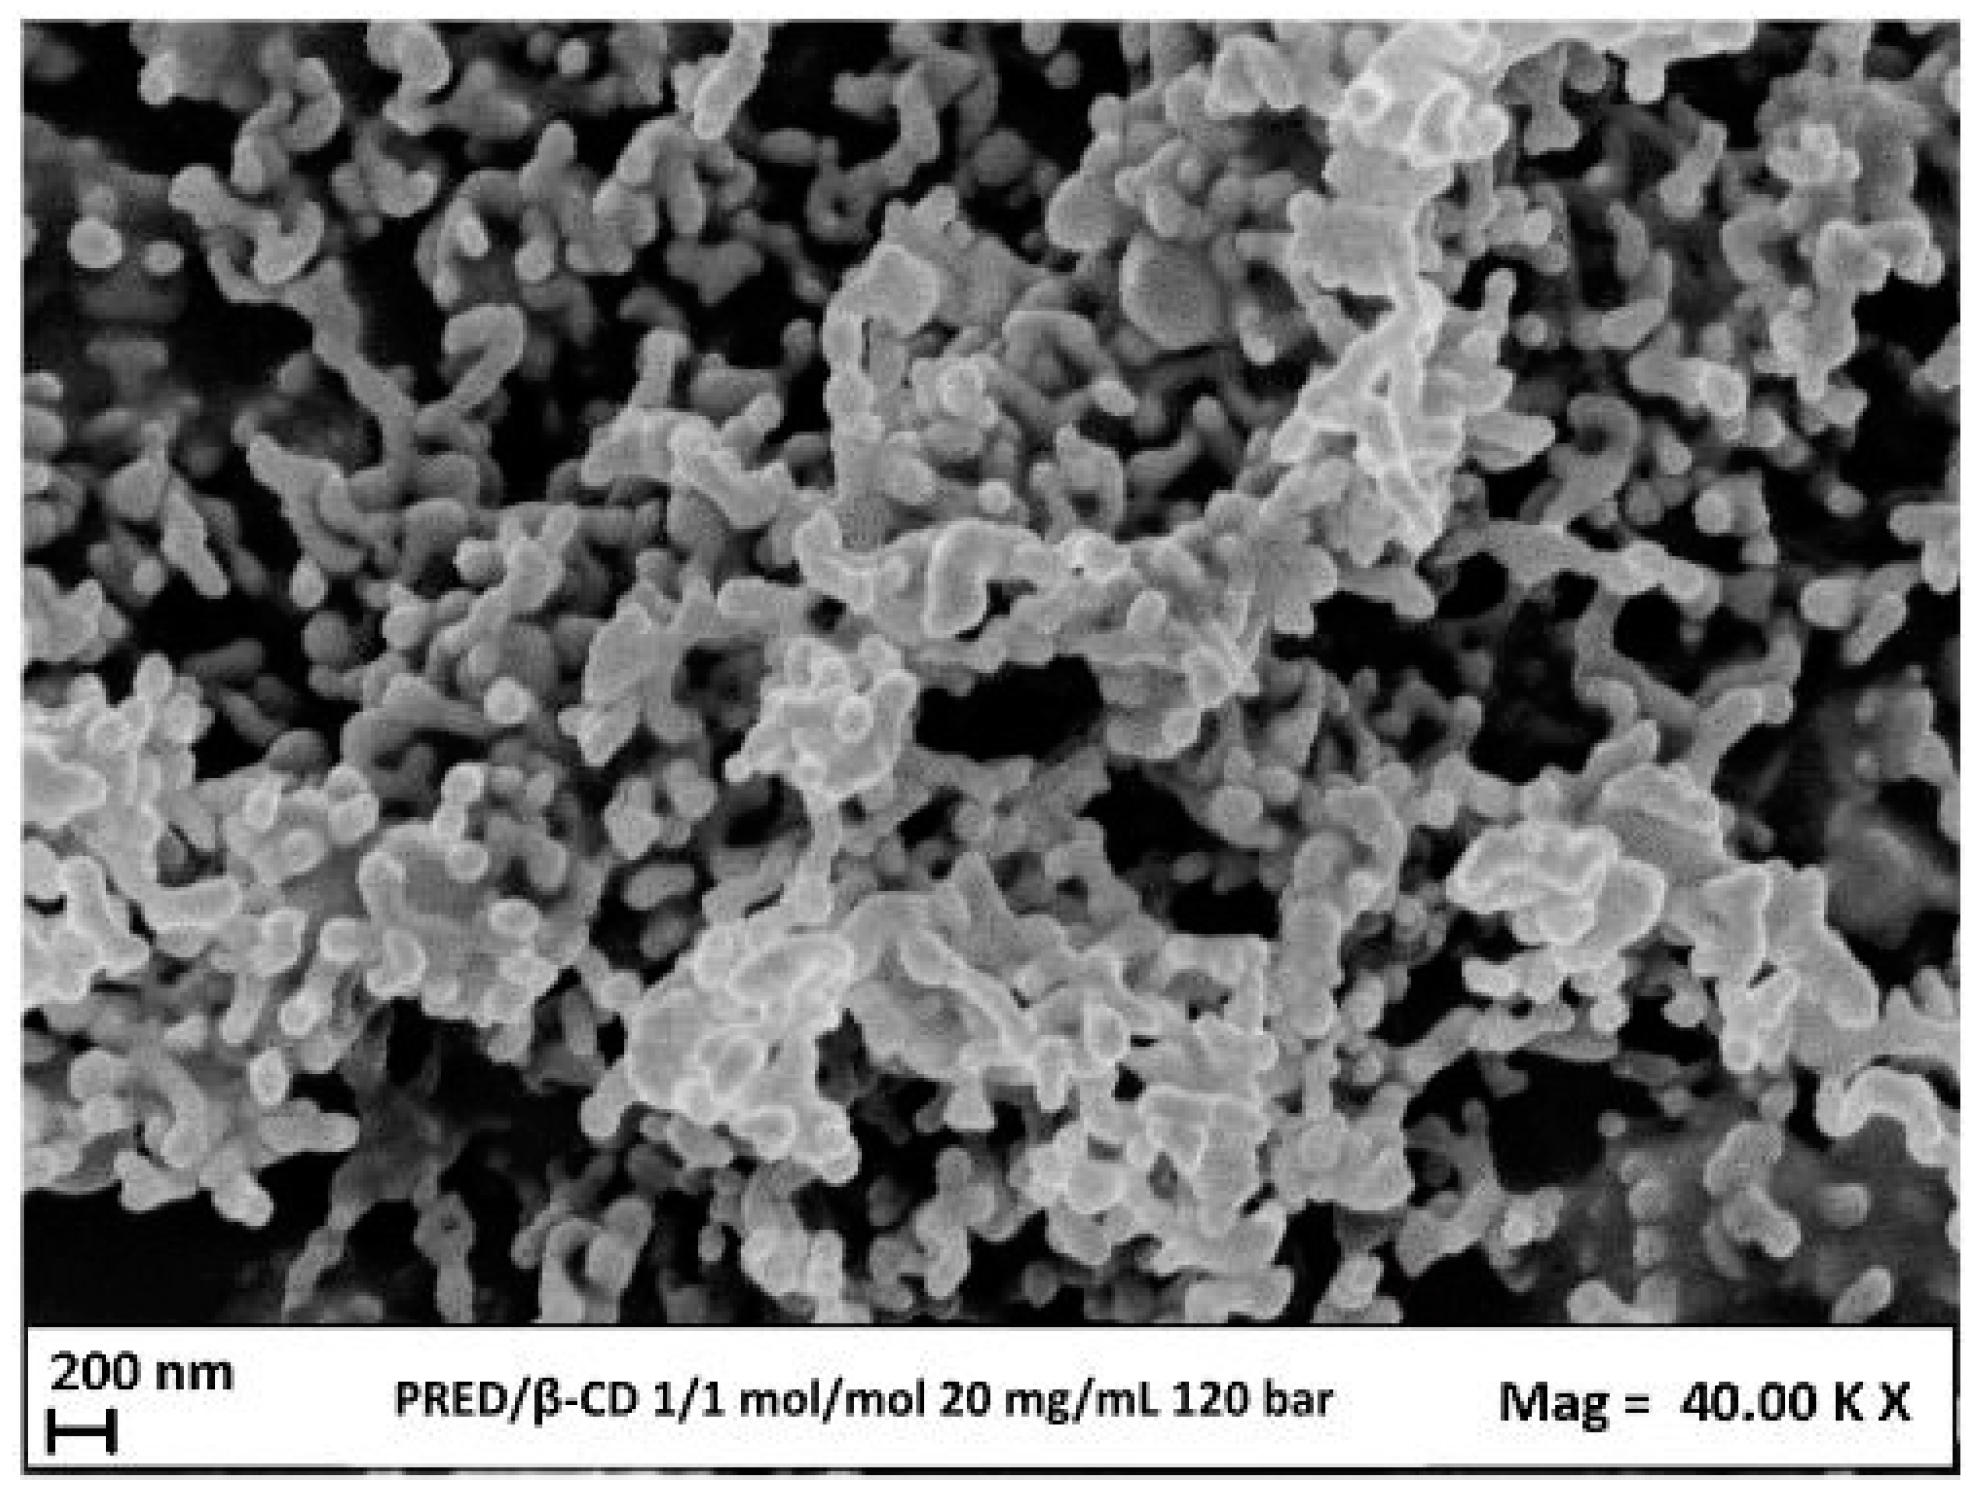
3.4. Micronization of PRED/β-CD Complexes
3.4.1. Effect of Pressure
3.4.2. Effect of Molar Ratio PRED:β-CD
3.4.3. Effect of Total Concentration
3.5. Determination of Encapsulation Yield
3.6. Characterization
3.7. Determination of Stoichiometries of Inclusion Complexes
4. Conclusions
Author Contributions
Funding
Institutional Review Board Statement
Data Availability Statement
Conflicts of Interest
References
- Samuel, S.; Nguyen, T.; Choi, H.A. Pharmacologic Characteristics of Corticosteroids. J. Neurocrit. Care 2017, 10, 53–59. [Google Scholar] [CrossRef]
- Caramori, G.; Mumby, S.; Girbino, G.; Chung, K.F.; Adcock, I.M. Corticosteroids. In Nijkamp and Parnham’s Principles of Immunopharmacology; Parnham, M.J., Nijkamp, F.P., Rossi, A.G., Eds.; Springer International Publishing: Cham, Switzerland, 2019; pp. 661–688. [Google Scholar] [CrossRef]
- Caramori, G.; Ruggeri, P.; Casolari, P.; Chung, K.F.; Girbino, G.; Adcock, I.M. Fluticasone furoate and vilanterol for the treatment of chronic obstructive pulmonary disease. Expert Rev. Respir. Med. 2017, 11, 955–967. [Google Scholar] [CrossRef] [PubMed]
- Mehta, A.B.; Nadkarni, N.J.; Patil, S.P.; Godse, K.V.; Gautam, M.; Agarwal, S. Topical corticosteroids in dermatology. Indian J. Dermatol. Venereal. Leprol. 2016, 82, 371–378. [Google Scholar] [CrossRef] [PubMed]
- Lammers, T.; Sofias, A.M.; van der Meel, R.; Schiffelers, R.; Storm, G.; Tacke, F.; Koschmieder, S.; Brümmendorf, T.H.; Kiessling, F.; Metselaar, J.M. Dexamethasone nanomedicines for COVID-19. Nat. Nanotechnol. 2020, 15, 622–624. [Google Scholar] [CrossRef] [PubMed]
- Zhao, Z.; Jia, Z.; Foster, K.W.; Wei, X.; Qiao, F.; Jiang, H.; Jin, Y.; Li, G.; Chen, N.; Zhao, G.; et al. Dexamethasone prodrug nanomedicine (ZSJ-0228) treatment significantly reduces lupus nephritis in mice without measurable side effects—A 5-month study. Nanomed. Nanotechnol. Biol. Med. 2021, 31, 102302. [Google Scholar] [CrossRef] [PubMed]
- Quan, L.; Zhang, Y.; Crielaard, B.J.; Dusad, A.; Lele, S.M.; Rijcken, C.J.F.; Metselaar, J.M.; Kostková, H.; Etrych, T.; Ulbrich, K.; et al. Nanomedicines for Inflammatory Arthritis: Head-to-Head Comparison of Glucocorticoid-Containing Polymers, Micelles, and Liposomes. ACS Nano 2014, 8, 458–466. [Google Scholar] [CrossRef]
- Sarkar, I.; Sen, A. In silico screening predicts common cold drug Dextromethorphan along with Prednisolone and Dexamethasone can be effective against novel Coronavirus disease (COVID-19). J. Biomol. Struct. Dyn. 2022, 40, 3706–3710. [Google Scholar] [CrossRef]
- Alqurshi, A.; Hanafy, A.F.; Abdalla, A.M.; Guda, T.K.; Gabr, K.E.; Royall, P.G. Ocular anti-inflammatory activity of prednisolone acetate loaded chitosan-deoxycholate self-assembled nanoparticles. Int. J. Nanomed. 2019, 14, 3679–3689. [Google Scholar] [CrossRef]
- Brusini, R.; Varna, M.; Couvreur, P. Advanced nanomedicines for the treatment of inflammatory diseases. Adv. Drug Deliv. Rev. 2020, 157, 161–178. [Google Scholar] [CrossRef]
- Banchero, M. Supercritical Carbon Dioxide as a Green Alternative to Achieve Drug Complexation with Cyclodextrins. Pharmaceuticals 2021, 14, 562–597. [Google Scholar] [CrossRef]
- Jansook, P.; Ogawa, N.; Loftsson, T. Cyclodextrins: Structure, physicochemical properties and pharmaceutical applications. Int. J. Pharm. 2018, 535, 272–284. [Google Scholar] [CrossRef] [PubMed]
- Adeoye, O.; Cabral-Marques, H. Cyclodextrin nanosystems in oral drug delivery: A mini review. Int. J. Pharm. 2017, 531, 521–531. [Google Scholar] [CrossRef] [PubMed]
- Weeber, A.W.; Bakker, H. Amorphization by ball milling. A review. Phys. B Condens. Matter 1988, 153, 93–135. [Google Scholar] [CrossRef]
- Morais, A.R.d.V.; Alencar, É.d.N.; Xavier Júnior, F.H.; Oliveira, C.M.d.; Marcelino, H.R.; Barratt, G.; Fessi, H.; Egito, E.S.T.d.; Elaissari, A. Freeze-drying of emulsified systems: A review. Int. J. Pharm. 2016, 503, 102–114. [Google Scholar] [CrossRef] [PubMed]
- Vehring, R. Pharmaceutical particle engineering via spray drying. Pharm. Res. 2008, 25, 999–1022. [Google Scholar] [CrossRef] [PubMed]
- Louey, M.D.; Van Oort, M.; Hickey, A.J. Aerosol dispersion of respirable particles in narrow size distributions produced by jet-milling and spray-drying techniques. Pharm. Res. 2004, 21, 1200–1206. [Google Scholar] [CrossRef] [PubMed]
- Mottola, S.; Mancuso, A.; Sacco, O.; Vaiano, V.; De Marco, I. Photocatalytic Systems Based on ZnO Produced by Supercritical Antisolvent for Ceftriaxone Degradation. Catalysts 2023, 13, 1173. [Google Scholar] [CrossRef]
- Uwineza, P.A.; Waśkiewicz, A. Recent Advances in Supercritical Fluid Extraction of Natural Bioactive Compounds from Natural Plant Materials. Molecules 2020, 25, 3847. [Google Scholar] [CrossRef]
- Mottola, S.; Viscusi, G.; Iannone, G.; Belvedere, R.; Petrella, A.; De Marco, I.; Gorrasi, G. Supercritical Impregnation of Mesoglycan and Lactoferrin on Polyurethane Electrospun Fibers for Wound Healing Applications. Int. J. Mol. Sci. 2023, 24, 9269–9283. [Google Scholar] [CrossRef]
- Baldino, L.; Cardea, S.; Reverchon, E. A supercritical CO2 assisted electrohydrodynamic process used to produce microparticles and microfibers of a model polymer. J. CO2 Util. 2019, 33, 532–540. [Google Scholar] [CrossRef]
- Reverchon, E.; Schiavo Rappo, E.; Cardea, S. Flexible supercritical CO2-assisted process for poly(methyl methacrylate) structure formation. Polym. Eng. Sci. 2006, 46, 188–197. [Google Scholar] [CrossRef]
- Knez, Ž.; Markočič, E.; Leitgeb, M.; Primožič, M.; Knez Hrnčič, M.; Škerget, M. Industrial applications of supercritical fluids: A review. Energy 2014, 77, 235–243. [Google Scholar] [CrossRef]
- Franco, P.; De Marco, I. Preparation of non-steroidal anti-inflammatory drug/β-cyclodextrin inclusion complexes by supercritical antisolvent process. J. CO2 Util. 2021, 44, 101397. [Google Scholar] [CrossRef]
- Rosas, M.D.; Piqueras, C.M.; Piva, G.K.; Ramírez-Rigo, M.V.; Filho, L.C.; Bucalá, V. Simultaneous formation of inclusion complex and microparticles containing Albendazole and β-Cyclodextrin by supercritical antisolvent co-precipitation. J. CO2 Util. 2021, 47, 101505. [Google Scholar] [CrossRef]
- Yan, T.; Ji, M.; Sun, Y.; Yan, T.; Zhao, J.; Zhang, H.; Wang, Z. Preparation and characterization of baicalein/hydroxypropyl-β-cyclodextrin inclusion complex for enhancement of solubility, antioxidant activity and antibacterial activity using supercritical antisolvent technology. J. Incl. Phenom. Macrocycl. Chem. 2020, 96, 285–295. [Google Scholar] [CrossRef]
- Prosapio, V.; Reverchon, E.; De Marco, I. Coprecipitation of Polyvinylpyrrolidone/β-Carotene by Supercritical Antisolvent Processing. Ind. Eng. Chem. Res. 2015, 54, 11568–11575. [Google Scholar] [CrossRef]
- Job, P.M.J. Formation and stability of inorganic complexes in solution. Ann. Chim. 1928, 9, 113–203. [Google Scholar]
- Campardelli, R.; Reverchon, E.; De Marco, I. Dependence of SAS particle morphologies on the ternary phase equilibria. J. Supercrit. Fluids 2017, 130, 273–281. [Google Scholar] [CrossRef]
- Jiang, H.-L.; Lin, J.-C.; Hai, W.; Tan, H.-W.; Luo, Y.-W.; Xie, X.-L.; Cao, Y.; He, F.-A. A novel crosslinked β-cyclodextrin-based polymer for removing methylene blue from water with high efficiency. Colloids Surf. A Physicochem. Eng. Asp. 2019, 560, 59–68. [Google Scholar] [CrossRef]
- Prosapio, V.; De Marco, I.; Reverchon, E. PVP/corticosteroid microspheres produced by supercritical antisolvent coprecipitation. Chem. Eng. J. 2016, 292, 264–275. [Google Scholar] [CrossRef]
- Tahir, S.; Yasmeen, K.; Hanif, M.; Khaliq, O.; Muhammad, H.; Hafsa; Tahiri, I.A.; Jahangir, S.; Ali, S.T. Electrochemical Methodology for NSAID’s Determination and its Interaction with Steroid Dexamethasone. Int. J. Electrochem. Sci. 2019, 14, 5748–5762. [Google Scholar] [CrossRef]
- Jun, S.W.; Kim, M.-S.; Kim, J.-S.; Park, H.J.; Lee, S.; Woo, J.-S.; Hwang, S.-J. Preparation and characterization of simvastatin/hydroxypropyl-β-cyclodextrin inclusion complex using supercritical antisolvent (SAS) process. Eur. J. Pharm. Biopharm. 2007, 66, 413–421. [Google Scholar] [CrossRef] [PubMed]
- Barzegar-Jalali, M.; Adibkia, K.; Valizadeh, H.; Shadbad, M.R.S.; Nokhodchi, A.; Omidi, Y.; Mohammadi, G.; Nezhadi, S.H.; Hasan, M. Kinetic analysis of drug release from nanoparticles. J. Pharm. Pharm. Sci. 2008, 11, 167–177. [Google Scholar] [CrossRef] [PubMed]
- Mircioiu, C.; Voicu, V.; Anuta, V.; Tudose, A.; Celia, C.; Paolino, D.; Fresta, M.; Sandulovici, R.; Mircioiu, I. Mathematical Modeling of Release Kinetics from Supramolecular Drug Delivery Systems. Pharmaceutics 2019, 11, 140. [Google Scholar] [CrossRef] [PubMed]
- Yunus Basha, R.; Sampath Kumar, T.S.; Doble, M. Dual delivery of tuberculosis drugs via cyclodextrin conjugated curdlan nanoparticles to infected macrophages. Carbohydr. Polym. 2019, 218, 53–62. [Google Scholar] [CrossRef]
- Ünal, S.; Varan, G.; Benito, J.M.; Aktaş, Y.; Bilensoy, E. Insight into oral amphiphilic cyclodextrin nanoparticles for colorectal cancer: Comprehensive mathematical model of drug release kinetic studies and antitumoral efficacy in 3D spheroid colon tumors. Beilstein J. Org. Chem. 2023, 19, 139–157. [Google Scholar] [CrossRef]
- Papadopoulou, V.; Kosmidis, K.; Vlachou, M.; Macheras, P. On the use of the Weibull function for the discernment of drug release mechanisms. Int. J. Pharm. 2006, 309, 44–50. [Google Scholar] [CrossRef]
- Saha, S.; Roy, A.; Roy, K.; Roy, M.N. Study to explore the mechanism to form inclusion complexes of β-cyclodextrin with vitamin molecules. Sci. Rep. 2016, 6, 35764. [Google Scholar] [CrossRef]


| API | API/β-CD (mol/mol) | P (bar) | Ctot (mg/mL) | Morphology | MD ± SD (μm) |
|---|---|---|---|---|---|
| / | 0/1 | 120 | 100 | MP | 1.731 ± 0.48 |
| DEX | 1/0 | 120 | 10 | C | - |
| 1/1 | 120 | 20 | MP | 0.197 ± 0.18 | |
| 1/2 | 120 | 20 | MP + cMP | 0.609 ± 0.42 | |
| 120 | 200 | C + AGG | - | ||
| PRED | 1/0 | 90 | 20 | C | - |
| 1/1 | 120 | 20 | cMP | 0.131 ± 0.07 | |
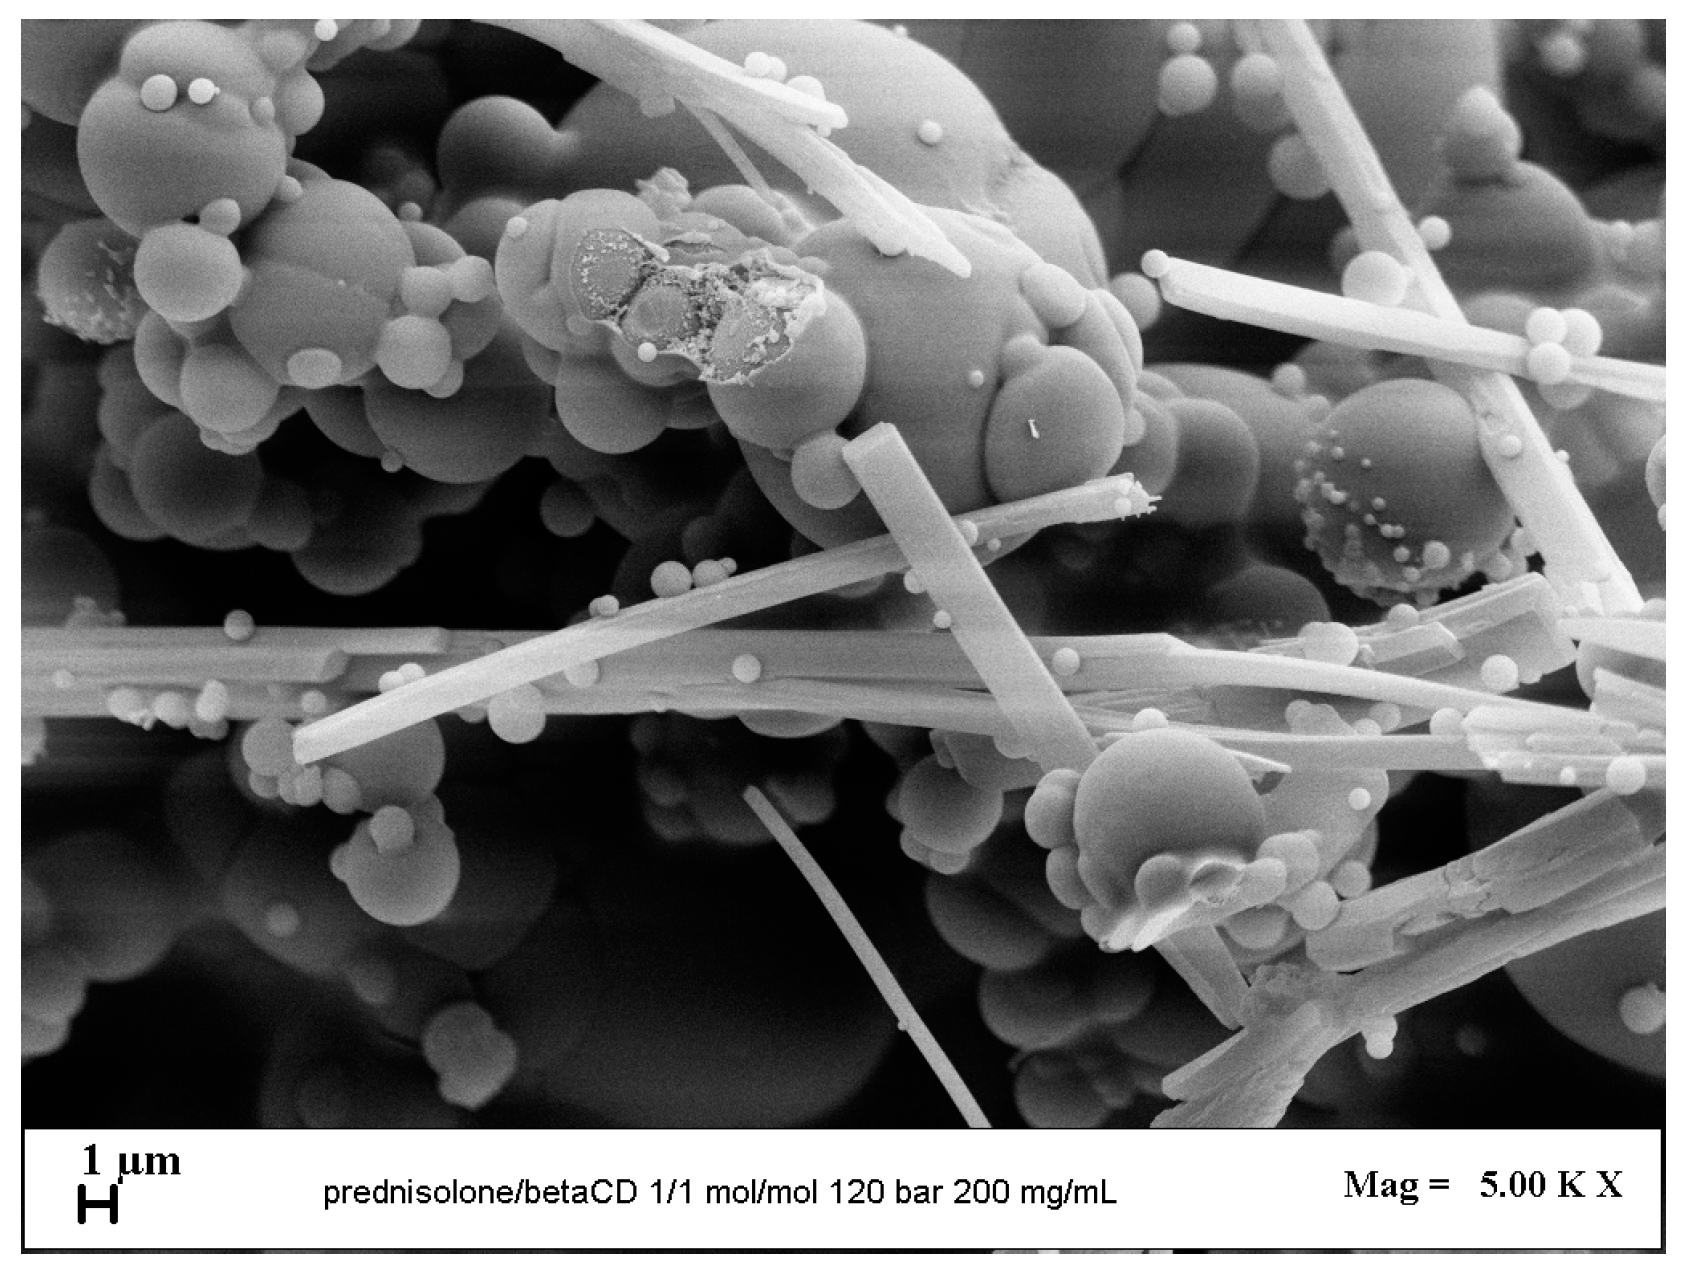
| 120 | 200 | cMP + C | 4.19 ± 4.03 | ||
| 1/2 | 90 | 200 | cMP + C | 0.435 ± 0.30 | |
| 120 | 200 | cMP + MP | 2.14 ± 1.43 |
| API | API:β-CD (mol:mol) | P (bar) | Ctot (mg/mL) | Encapsulation Yield (%) |
|---|---|---|---|---|
| DEX | 1/1 | 120 | 200 | 93 |
| 1/2 | 120 | 20 | 87 | |
| 200 | 57 | |||
| PRED | 1/1 | 120 | 20 | 89 |
| 200 | 78 | |||
| 1/2 | 90 | 200 | 55 | |
| 120 | 200 | 68 |
| Model and Equation | a | b | c | R2 |
|---|---|---|---|---|
| Dexamethasone | ||||
| Korsmeyer–Peppas y = a × tb | 44.811 ± 0.279 | 0.452 ± 0.279 | 0.9667 | |
| Peppas–Sahlin y = a × tb + c × t2b | 50.331 ± 0.122 | 0.729 ± 0.003 | −6.430 ± 0.034 | 0.9972 |
| Weibull y = 100 × (1 − exp(−a × tb)) | 1.898 ± 0.007 | 0.916 ± 0.004 | 0.9993 | |
| Higuchi y = a × t0.5 | 42.041 ± 0.138 | 0.9602 | ||
| Prednisolone | ||||
| Korsmeyer–Peppas y = a × tb | 60.397 ± 0.297 | 0.403 ± 0.005 | 0.9540 | |
| Peppas–Sahlin y = a × tb + c × t2b | 60.397 ± 0.298 | 0.403 ± 0.005 | 4.115 × 10⁻¹⁶ ± 0 | 0.9546 |
| Weibull y = 100 × (1 − exp(−a × tb)) | 1.070 ± 0.002 | 0.931 ± 0.002 | 0.9999 | |
| Higuchi y = a × t0.5 | 56.032 ± 0.263 | 0.9190 | ||
Disclaimer/Publisher’s Note: The statements, opinions and data contained in all publications are solely those of the individual author(s) and contributor(s) and not of MDPI and/or the editor(s). MDPI and/or the editor(s) disclaim responsibility for any injury to people or property resulting from any ideas, methods, instructions or products referred to in the content. |
© 2023 by the authors. Licensee MDPI, Basel, Switzerland. This article is an open access article distributed under the terms and conditions of the Creative Commons Attribution (CC BY) license (https://creativecommons.org/licenses/by/4.0/).
Share and Cite
Mottola, S.; De Marco, I. Supercritical Antisolvent Precipitation of Corticosteroids/β-Cyclodextrin Inclusion Complexes. Polymers 2024, 16, 29. https://doi.org/10.3390/polym16010029
Mottola S, De Marco I. Supercritical Antisolvent Precipitation of Corticosteroids/β-Cyclodextrin Inclusion Complexes. Polymers. 2024; 16(1):29. https://doi.org/10.3390/polym16010029
Chicago/Turabian StyleMottola, Stefania, and Iolanda De Marco. 2024. "Supercritical Antisolvent Precipitation of Corticosteroids/β-Cyclodextrin Inclusion Complexes" Polymers 16, no. 1: 29. https://doi.org/10.3390/polym16010029
APA StyleMottola, S., & De Marco, I. (2024). Supercritical Antisolvent Precipitation of Corticosteroids/β-Cyclodextrin Inclusion Complexes. Polymers, 16(1), 29. https://doi.org/10.3390/polym16010029