Article

Development of Three-Dimensional (3D) Biodegradable Polyglycolic Acid Fiber (PGA) Preforms for Scaffold Applications: Experimental Patterning and Fiber Volume Fraction-Porosity Modeling Study

1
Nano/Micro Fiber Preform Design and Composite Laboratory, Department of Textile Engineering, Faculty of Engineering, Erciyes University, Talas 38039, Kayseri, Turkey
2
Nanotechnology Application and Research Centre (ERNAM), Erciyes University, Talas 38039, Kayseri, Turkey
*
Author to whom correspondence should be addressed.
Polymers 2023, 15(9), 2083; https://doi.org/10.3390/polym15092083
Submission received: 25 February 2023 / Revised: 22 April 2023 / Accepted: 25 April 2023 / Published: 27 April 2023
(This article belongs to the Topic Advances in Biomaterials)

Abstract

:
Three-dimensional (3D) biodegradable polyglycolic acid fiber (PGA) preforms were developed as temporary scaffolds for three-dimensional tissue regeneration applications. Three-dimensional biodegradable polyglycolic acid fiber (PGA) preforms including various degrees of interlaced structures called 3D plain, semi-interlaced, and orthogonal woven preforms were designed. Analytical relations and finite element model-based software (TexGen) on fiber volume fraction and porosity fraction were proposed to predict scaffolds’ stiffness and strength properties considering micromechanics relations. It was revealed that yarn-to-yarn space, density, and angles of all 3D PGA fiber preforms were heterogeneous and demonstrated direction-dependent features (anisotropy). Total fiber volume fractions (Vfp) and porosity fraction (Vtpr) predicted by analytic and numerical modelling of all 3D scaffolds showed some deviations compared to the measured values. This was because yarn cross-sections in the scaffolds were changed from ideal circular yarn (fiber TOW) geometry to high-order ellipse (lenticular) due to inter-fiber pressure generated under a tensile-based macrostress environment during preform formation. Z-yarn modulus (Ez-yarn) and strength (σz-yarn) were probably critical values due to strong stiffness and strength in the through-the-thickness direction where hydrogel modulus and strengths were negligibly small. Morphology of the scaffold showed that PGA fiber sets in the preform were locally distorted, and they appeared as inconsistent and inhomogeneous continuous fiber forms. Additionally, various porosity shapes in the preform based on the virtual model featured complex shapes from nearly trapezoidal beams to partial or concave rectangular beams and ellipsoid rectangular cylinders. It was concluded that 3D polyglycolic acid fiber preforms could be a temporary supportive substrate for 3D tissue regeneration because cells in the scaffold’s thickness can grow via through-the-thickness fiber (z-yarn), including various possible mechanobiology mechanisms.

Graphical Abstract

1. Introduction

Medical technologies including tissue engineering, tissue regeneration and cell therapies, organ printing and cell patterning, a range of drug and gene delivery systems, and nanotechnology-based imaging and diagnostic systems are intensively researched by various universities, organizations, and state laboratories [1]. These materials encompass conventional metals, ceramics, and synthetic polymers including contemporary materials such as biopolymers, graphene nanoplatelets (GNPs), carbon nanotubes (CNTs), and quantum dots (QDs) [2,3,4,5,6]. The developments of tissue engineering can create engineered tissues, cells, and organs such as skin (scar tissue) and cartilage [1,7]. It is one of the comprehensive subjects in inter- and multidisciplinary areas. It is defined as applying engineering and life science to develop engineering tissue and understand its structure, including functional principles [8]. Scaffold materials and fabrication technologies play a critical role in tissue engineering. Engineered tissues, particularly for reconstructive surgery and transplantation, exhibited remarkable promise in replacing degraded organs [9]. Three-dimensional tissue formations during temporary scaffold design are crucial, especially chosen materials and fabrication methods [9].
It was reported that progress in tissue engineering shows steadily slow growth in terms of clinical outcomes and commercialization. This partly complex integration comprises various phases, from sourcing cells to incorporating generated tissue into a host where engineering-biology principles must be systematically applied via an interdisciplinary approach [10,11]. In addition, medical textile fiber and fabrics used in hygiene and healthcare (wound care, bandages, sutures, and meshes) were also actively researched [12]. Specifically, three-dimensional (3D) medical textiles can be employed in wound dressing, vascular grafting, and scaffolding for tissue engineering. It was included in the medical devices classification system established by the US Food and Drug Administration [13]. On the other hand, textile forming technologies such as two-dimensional (2D) weaving, 2D knitting, 2D braiding, three-dimensional (3D) weaving [14], and 3D braiding [15,16] were used to develop engineered 3D tissue scaffolds for various tissues and organs [17]. Further, textile fabric, substrate, or preform [18,19] in developing artificial organs has shown its unique advantages in mimicking human tissues’ hierarchical, anisotropic, and strain-stiffening properties [20]. Three-dimensional textile preforms architectures affect the fiber volume fraction [21], porosity [22], and mechanical properties of 3D composites [23,24,25]. Various textile patterns [20] and their mechanical properties need to be explored for tissue engineering to find textile-based scaffolds [26] that match the mechanical properties of their target tissues [27,28]. Future studies may be concentrated on scaffolds with different structures to induce cells and modeling the fiber-based scaffold to simulate mechano-chemical and mechano-biological properties considering natural organs [17,29].
Natural polymers employed for scaffold fabrication were considered protein-based (silk, fibrin, gelatin and collagen, and dextran) [30] and carbohydrate-based (agarose, alginate, hyaluronan and chitosan) in that they are generally hydrogels, which are three-dimensional cross-linked hydrophilic structures [31]. Contrarily, synthetic polymers (thermoplastic) in used 3D scaffolds for cartilage tissue engineering are the poly-α-hydroxy esters, especially polylactic acid (PLA), polyglycolic acid (–(C2H2O2)n–O–CO–CH2–, PGA) [32] and poly(lactide-co-glycolide) (PLGA) [33,34], which is formed as a continuous filamentary bundle structure (fiber or yarns) via melt spinning, wet spinning, and electrospinning. They have better mechanical properties and are naturally biodegradable fibers [35,36].
The effects of PLA/PGA composition on the physical adhesion and growth kinetics of chondrocytes seeded onto PLA/PGA nonwoven scaffold were studied. Altering the ratio of PLA to PGA caused insignificant differences in the scaffolds’ compressive moduli and degradation times and changes in adhesion, shape, and proliferation rates of cells seeded onto the hybrid scaffold [37]. Polylactic acid (PLA)-coated polyglycolic acid (PGA)/hydrogel scaffold was used for articular cartilage repair. It was found that scaffold stiffness, degradation time, cell seeding efficiency, and proliferation rates were the critical parameters, and they affected the engineered design of the extracellular matrix-based scaffold [38]. Polylactic acid (PLA) and polyglycolic acid (PGA) polymers were degraded by hydrolysis and enzymatic activity, which depended on critical parameters such as their molecular structure, crystallinity, and copolymer ratio [39]. They can be formed into porous scaffolds or carriers of cells, extracellular matrix components, and bioactive agents [39,40].
The in vitro degradation of PGA was followed by observing the mass, dimensions, crystallinity, tensile strength changes, and surface structure [41]. It was reported that PGA degradation was affected by polymer chain orientation, crystallinity, and immersion media, such as alkaline [41]. Additionally, tensile strength loss was due to chain scission in the amorphous regions, while mass loss appeared when polymer chains became small enough to be soluble [41]. Textured staple polyglycolic PGA fiber (diameter: 13 μm) was formed into a nonwoven fabric (thickness 5 mm) via the carding–needling process. It was obtained that cartilaginous tissue consisting of glycosaminoglycan and collagen was successfully regenerated in the shape of the original PGA scaffold [42]. It was revealed that poly(l-lactic acid) (PLLA) and poly(d,l-lactic-co-glycolic acid) (PLGA)-coated polyglycolic acid (PGA) fiber tubular structure has smooth muscle cells in vitro with appropriate cell distribution due to improved compression strength [43]. The major disadvantages of PLA such as its poor ductility, slow degradation rate, and poor hydrophilicity somewhat limit its applications [44]. Modifying of PLA bulk and surface properties has thus become crucial to increase its applicability [44].
On the other hand, chitosan is a polysaccharide-based natural biopolymer with valuable physico-chemical properties, particularly interactions with proteins, cells, and living organisms [45]. It can be used in 3D preform scaffolds [46]. Furthermore, nanoparticle (silica) or nanofiber-added hydrogels exhibited better mechanical strength properties in tissue engineering cartilage, enhancing cell growth and tissue regeneration due to the biomimetic properties of nanomaterials [35,47]. On the contrary, stem cells-based 3D biomimetic scaffold can work under a natural repair process [48] because it provides a simulated natural environment with chemical and contact guidance for stem cell differentiation [49]. Moreover, it was stated that topographic cues could effectively regulate various mechanisms including the adhesion [50], morphology, migration [51], differentiation [52], proliferation, apoptosis, and other behaviors of cells [53], a phenomenon known as contact guidance [54]. Under in vivo conditions, cells are guided by the complex topographic structures of the extracellular matrix (ECM) [48]. The recent advances in the field of regenerative medicine especially considering multifunctional biomaterials for building biomimetic scaffold in order to regenerate stem cells in vivo were provided [55].
A three-dimensional (3D) poly(lactic-co-glycolic acid)(PLGA)/poly (e-caprolactone) (PCL) scaffold based on wet-electrospinning [56] that consisted of a very loose, dispersive, and randomly oriented porous fiber structure for cell population and differentiation [57], and eventually for the generation of osteochondral (bone) tissue, was developed via the endochondral approach [58]. Layered natural endometrial stromal cells were cultured in a 3D PGA electrospun scaffold in which an electrospun nanoweb was overlaid by a monolayer of endometrial epithelial cells, and it was found that the overall arrangement was identical to the native endometrium [59].
Three-dimensional (3D) bioprinting is a method to create artificial multi-cellular tissues or organs in regenerative medicine and tissue engineering [60]. Three-dimensional bioprinting involves various techniques including droplet, thermal inkjet, acoustic inkjet, micro extrusion, laser-assisted, and stereolithography bioprinting [61,62]. An osteochondral scaffold for articular cartilage repair was created by using three-dimensional printing. The material composition, porosity, macro-architecture, and mechanical properties were varied throughout the scaffold structure [63].
Another study stated that flocked substrate with polyhydroxy butyrate (PHB), polylactide (PLA), chitosan, or collagen is an isotropic highly porous scaffold with high compressive strength and can be used to repair human organs such as cartilage and bone tissue as well as extra-corporeal organs because of adequate vascularization, mechanical strength, and the osseointegration of the scaffold [64].
Articular cartilage study, in particular osteoarthritis (degenerative joint disease), revealed that the parameters such as cell source, signaling molecules, scaffolds architecture [65,66], porosity [67,68,69], permeability and stiffness [70], extracellular matrix content [71], mechanical stimulation, and structure functionality are of paramount importance [72,73,74]. In this respect, biodegradable scaffolds in cartilage tissue engineering provide a comfortable environment for synthesizing cartilage matrix by host cells and temporarily replace the function of the native matrix until new cartilage has formed [75]. For these reasons, the scaffolds have biodegradable, non-toxic byproducts, a porosity that allows diffusion of nutrients and waste products [76], support cell viability, proliferation [77], differentiation [78], and extracellular matrix (ECM) production [78], integrated with the tissue at the defect site, and give mechanical support to the engineered tissue [72,73,79,80]. It was indicated that the scaffold architecture was pivotal in supporting the cellular entrapment within filamentary scaffold [81]. It was also found that scaffolds must have the adequate mechanical strength to provide structural integrity during new tissue regeneration in which the scaffold properties match the native tissues in vivo [82].
It was claimed that the entanglements between filaments and pores in scaffold architecture were crucial in supporting cellular bridging, promoting cellular migration, nutrient transportation, and tissue in-growth [83,84,85]. Furthermore, filament continuity provided the smooth shear stress flow along the inter- and intralayer in the scaffold during exerted biomechanical force [86]. The influence of void fraction and pore size of poly(-lactic acid) (L-PLA) scaffold on the attachment, growth, and extracellular matrix deposition by some cell types was studied. It was found that uniform seeding on scaffolds with a 90% void fraction for each pore size was achieved compared to the scaffold with a 75% void fraction. In addition, it was noted that structural consistencies and irregularities of the scaffold, including material clustering, pore size, surface area, wall thickness, and homogeneity are of critical importance [87]. A mechanoregulation theory based on scaffold shear strain and fluid shear stress was applied to determine scaffold architecture’s influence (pore volume and size) on the mechanical stimuli within initial conditions. Results indicated that shear stress distribution induced by fluid perfusion depends on pore distribution within the scaffold. Gyroid architectures provide better accessibility of the fluid than hexagonal structures [88]. These findings showed that the low permeability design with a spherical pore provided a better microenvironment for chondrogenesis (cartilage matrix) than the high permeability design with a cubical pore [89]. A 3D well-orthotropic woven scaffold/chondrocyte–hydrogel (agarose and fibrin) matrix cartilage tissue composite was developed. Its mechanical (tensile, compressive, and shear) properties were almost equal to natural articular cartilage [90]. The performance of 3D woven composites for a specific application including artificial organ development or organ repair, can be optimized by appropriately selecting the geometric parameters including fiber types, cross-section, and the preform architecture and directional fiber volume. The geometric modeling estimates the volume fraction of filamentary tows and areal density of preforms due to tow crimp in the preform architecture [91,92,93,94,95]. Many challenges remain in polymer-scaffold processing, including the fabrication of highly porous scaffolds of defined architecture to guide tissue growth, the manufacture of high-strength load-bearing scaffolds to replace hard tissues, and the incorporation and delivery of growth factors, and other tissue induction factors to stimulate or enhance organ regeneration [96].
In this study, biodegradable and biocompatible PGA fiber woven scaffolds were developed due to z-yarn reinforcement in the through-the-thickness of the structure. Compared to extrusion 3D printing and electrospinning, there is no true through-the-thickness fiber in the structures, which could affect the cell growth in the thickness during 3D organ development. The literature shows that biocompatible and biodegradable fiber, 3D fiber architecture, fiber volume fraction, pore geometry, and size are crucial for 3D scaffold development, especially for cartilage tissue material applications. Therefore, this research study aimed to develop 3D fiber architectures and experimentally determine their total and directional fiber volume fraction and porosity. Moreover, geometric modeling on fiber volume fraction and porosity was also provided, considering generated experimental data.

2. Materials and Methods

2.1. Development of 3D Structures for Scaffold

Polyglycolic acid (PGA, %100) fiber (Meta Biomed Inc., Cheongju, Ch’ungch’ong-bukto, Republic of Korea, KR) was utilized for making three-dimensional woven preforms for possible scaffold applications. The PGA filament diameter was 13.7 micron. Yarn linear density and density were 6.22 tex and 1.56 g/cm3, respectively. Table 1 presents some of the critical specifications of polyglycolic acid fiber from open literatures [97,98]. PGA yarn was plied (50 yarns, 311 tex) to make sufficiently dense 3D woven preforms based on Kundak’s PhD study under supervision of Bilisik in Graduate School of Natural and Applied Sciences in Erciyes University [99]. Three types of 3D PGA fiber preform architectures based on a previous study of Bilisik et al. [19] were developed, called 3D plain woven preform (3DW-P-ZP), 3D semi-interlaced woven preform (3DW-P-ZO), and 3D orthogonal woven preforms (3DW-O-ZO). They are explained in the following subtitles.

2.1.1. 3D Plain Woven Preform

An experimental rig was refined to make a 3D completely interlaced plain woven preform (warp/filling/z-fiber, plain), semi-interlaced woven preform (warp/filling plain, z-fiber orthogonal), and 3D orthogonal woven preforms (warp/filling/z-yarn, orthogonal) in Nano/Micro Fiber Preform Design and Composite Laboratory in Erciyes University (TR). This method generally involves six distinctive steps to create six-layer preforms, including warp let-off, two-dimensional (2D) shedding or one-dimensional (1D) shedding, multiple filling insertions, z-yarn insertion, beat-up, and take-up [19]. Figure 1 shows the 3D plain weave steps incorporated with schematic unit cell (TexGen) and actual preform. The 3D plain woven preforms can be defined as warp–filling and warp–z-yarns interlaced based on plain (1/1/1) weave pattern to generate filamentary structure [19]. Woven interlacement can be called textile bonding, an analogy from chemical bonding. It is a unique bonding mechanism interconnecting filamentary bundle (TOW) to create architectural structures for specific requirements. After the individual warps of 3D PGA fiber plain woven preform (3DW-P-ZP) were aligned in a matrix of rows and columns as an initial step, an even number of warp layers in the column direction were sequentially moved by using the 2D shedding. Then, fillings between each warp layer in the row direction were inserted for putting the fiber transversely across the in-plane direction before z-yarns were inserted between each warp layer in the column direction for putting the fiber through-the-thickness of the preform. After inserted fibers were beaten up towards the preform formation line, an even number of warp layers in the row direction were sequentially moved by using the 2D shedding. Again, fillings between each warp layer in the row direction were inserted before z-yarn insertion was completed. The last step was take-up to remove the preform from the formation zone. These steps were repeated depending on the required preform length (Figure 1).

2.1.2. 3D Semi-Interlaced Woven Preforms

The 3D semi-interlaced woven preform was achieved by warp and weft, interlaced based on a plain pattern before warp, and z-yarns were interlaced depending upon an orthogonal pattern (warp/filling plain, z-yarn orthogonal) [19]. Figure 2 shows the 3D semi-interlaced weave steps incorporated with schematic unit cell (TexGen) and preform. After the individual warps of 3D PGA fiber semi-interlace woven preform (3DW-P-ZO) were aligned in a matrix of rows and columns as an initial step, an even number of warp layers in the column direction were sequentially moved by using the 1D shedding. Then, fillings between each warp layer in the row direction were inserted for putting the fiber transversely in the in-plane direction before z-yarns were orthogonally inserted between each warp layer in the column direction for putting the fiber through-the-thickness of the preform. After inserted fibers were beaten up towards the preform formation line, an even number of warp layers in the column direction were sequentially and reversely moved by using 1D shedding. Again, fillings between each warp layer in the row direction were inserted before z-yarns insertion was orthogonally completed. The last step was take-up to remove the preform from the formation zone [19]. These steps were repeated depending on the required preform length (Figure 2).

2.1.3. 3D Orthogonal Woven Preforms

The 3D orthogonal woven preform can be made using warp, filling, and z-yarn, which were orthogonally formed in that interlacement that occurred at the surfaces of the preform (warp/filling/z-yarn orthogonal) [19]. Figure 3 shows the 3D orthogonal weave steps incorporated with schematic unit cell (TexGen) and preform. The warp was arranged in a matrix of rows and columns to make 3D PGA fiber orthogonal woven preform (3DW-O-ZO). The first step was filling insertion between each warp layer in the row direction. The second and third steps were z-yarn insertion between each warp layer in the column direction without any interlacement and beat-up, respectively. The fourth step was take-up [19]. After the above steps were repeated, the 3D PGA fiber orthogonal preform structure was made (Figure 3).

2.2. Dimensions, Density, and Angle Measurements

Measurements of all 3D woven preforms (3DW-P-ZP, 3DW-P-ZO, 3DW-O-ZO) were accomplished in normal conditions (out-of-loom). The measurements of the preforms were executed in force-free environments [99]. Structure length (Sl), width (Sw), and thickness (St) measurements of the 3D PGA fiber woven preform structures were fulfilled. The precision of dimensional measurements was 0.01 mm. On the other hand, length, width, and thickness measurements were performed on the different parts of the 3D woven preform structures and were repeated three times. Yarn-to-yarn distance on warp/warp (w-w), filling/filling (f-f), and z-yarn/z-yarn (z-z) in the top, side, and cross-sections of all 3D woven structures were determined. Measured yarn lengths in all woven preform structures included uncrimped warp length (lw), uncrimped filling length (lf), uncrimped total z-yarn length (lzt), z-yarn arc length in the structure surface (lza), and z-yarn length in the structure thickness (lz). The precision of yarn length measurements was 0.2 mm. The densities of the warp, filling, and z-yarn were identified on the top, side, and cross-section of the 3D PGA fiber woven preform. The precision of density measurements was 0.2 ends/10 mm. Measured angles on all 3D PGA fiber woven preform structures were defined as follows: θwc was the warp angle in the fabric thickness; θwm was the warp angle in the fabric width; θws was the warp angle in the fabric length; θfc was the filling angle in the fabric thickness; θfm was the filling angle in the fabric width; θfs was the filling angle in the fabric length; θzc was the z-yarn angle in the fabric thickness; θzm was the z-yarn angle in the fabric width; θzs was the z-yarn angle in the fabric length. The precision of angle measurements was 0.2 degrees. The dimensional measurements of all 3D woven preforms were performed using the Newman digital caliper (measurement length: 0–150 mm and precision: 0.01 mm, China). The uncrimped yarn length and arc-length measurements were performed using a flexible ruler (0–300 mm measurement length and precision 0.2 mm). The angle measurements were performed using the manual angle instrument (measurement angle: 0–180° and precision: 0.2 degrees).

2.2.1. Crimp Measurements

Crimps in the 3D plain and semi-interlaced woven preforms were calculated based on the measured structure dimensions and the uncrimped yarn lengths considering a Tautex digital instrument (James H Heal Co., Halifax, UK) principle. For this reason, the following Equations (1)–(3) were employed [19].
C w ( % ) = ( l w S l ) S l × 100
C f ( % ) = ( l f S w ) S w × 100
C z ( % ) = ( l z t S t ) S t × 100
where Cw is the warp crimp (%), lw is the uncrimped warp length (mm), Sl is the structure length (mm), Cf is the filling crimp (%), lf is the uncrimped filling length (mm), Sw is the structure width (mm), Cz is the z-yarn crimp (%), lzt is the uncrimped total z-yarn length (mm), and St is the structure thickness (mm).

2.2.2. Fiber Volume Fraction Measurements

Fiber volume fraction and void fraction (porosity) were measured considering ASTM D3171-99 and ASTM D2734-91 standards. The volume-based fiber volume fractions of all 3D PGA fiber woven preforms were then calculated by using Equations (4)–(7) [100,101].
V f p = ρ p ρ f 100
V f w ( % ) = ( M w M p 100 ) ρ p ρ f
V f f ( % ) = ( M f M p 100 ) ρ p ρ f
V f z ( % ) = ( M z M p 100 ) ρ p ρ f
where Vfp is the total fiber volume fraction of 3D woven preforms (%), ρp is the fiber density of 3D woven preforms (g/cm3), ρp is the PGA fiber density (g/cm3), Vfw is the fiber volume fractions of warp yarns (%), Vff is the fiber volume fractions of filling yarns (%), and Vfz is the fiber volume fractions of z-yarns (%), Mw is the total mass of warp yarns (gram, g), Mp is the total mass of preform (g), Mf is the total mass of weft yarns (g), and Mz is the total mass of z-yarns (g).
In addition, all 3D PGA fiber preform structures were examined by an optical microscope (Olympus SZ61-TR equipped with Bs200DOC digital image analysis software). A high-resolution digital camera (CANON PowerShot SX30 IS, Tokyo, Japan) was used to image the surface of the PGA fiber structures. Weight measurements were performed on all 3D preform structures using an Ohaus AdventurerTM Pro AV812 (Ohaus Corp., Parsippany, NJ, USA) digital balance. The error in the measurement of weight was ±0.1 mg. All tests were conducted in the standard laboratory atmosphere having a temperature of 23 °C ± 2 °C and relative humidity of 50% ± 10% [102].

2.3. Geometric Modeling

2.3.1. Analytical Model on Volume Fraction and Porosity

Analytical relations on fiber volume fraction and porosity (void content) were proposed for 3D PGA fiber plain woven (3DW-P-ZP), 3D semi-interlaced woven (3DW-P-ZO), and 3D orthogonal woven structures (3DW-O-ZO). Table 2 presents fiber volume fraction equations for 3D plain woven preform. Table 3 presents fiber volume fraction equations for 3D semi-interlaced woven preform and Table 4 shows fiber volume fraction equations for 3D orthogonal woven preform. The analytical models are generally developed based on meso-scale ideal representative volume element from produced actual unit cell of each 3D PGA fiber woven preform structure. Thus, it was assumed that warp, filling, and z-yarn diameters in the 3D preform structure remained circular. Inter-yarn compression and frictional inter-filamentary migrations were neglected. The interlaced and noninterlaced regions in the 3D structures were homogeneously created during the formation process [103]. The representative unit cell geometry (representative volume element) was uniformly displaced and consistently formed throughout the 3D woven structure. Equations (8)–(12) displace fiber volume fraction equations for 3D plain woven preform. Further, Equations (13)–(15) displace fiber volume fraction equations for 3D semi-interlaced woven preform, and Equations (16)–(18) displace fiber volume fraction equations for 3D orthogonal woven preform.

2.3.2. Finite Element Modeling (FEM) on Volume Fraction and Porosity (TexGen)

We used TexGen version 3.12.1 software to model the fiber volume fraction and porosity. The University of Nottingham developed TexGen software for modeling the geometry of textile structures where yarn can be considered various geometric shapes such as circular, ellipse, lenticular, or interpolated cross-sections. Only the smallest repeatable section of yarns was described. However, it can be combined with the repeat vectors depending on the almost infinite meso-scale fabric boundary. Therefore, it is necessary to restrict the model to a finite region of space called the domain. In most cases, the domain corresponds to the unit cell of the textile structure. For instance, after the fabric unit cell was defined considering meso-level design, fiber volume fraction and porosity were computed (Vf = Af/domain, defined unit cell area). TexGen models may be used as the basis of simulations to predict various properties, including textile geometry and mechanics, permeability, and composite mechanical behaviors. Release TexGen software included an update to octree voxel mesh refinement such that an initial number of voxels can be specified, the addition of octree refinement option to export ABAQUS voxel files in the graphical user interface (GUI), correct small intersections tool and various minor changes and bug fixes [104,105,106,107,108].

2.4. Stiffness Calculations on 3D Preforms

Preliminary stiffness and partly strength (tensile and shear) properties of all developed 3D PGA fiber preform structures for scaffolding were theoretically identified considering micromechanics relations as shown in Equations (19)–(21) [109]. Therefore, idealized PGA fiber preform/matrix scaffolds were macroscopically defined and compared to the cartilage. It was assumed that the fiber in preform for the scaffold was homogeneous, linearly elastic, isotropic, regularly spaced, perfectly aligned, and bonded with matrix (hydrogel). In addition, the matrix was homogeneous, isotropic, and linearly elastic. No voids can exist between fiber and matrix. On the other hand, all 3D preforms were initially stress-free, linearly elastic, macroscopically homogeneous, and well-orthotropic [109]. Thus, micromechanical relations (19)–(21) can be applicable on 3D preform scaffolds. All stiffnesses and strength properties of all 3D woven preforms were computed via measured fiber volume fractions, fiber volume fraction derived from analytical relations, and numerical model (TexGen). Micromechanical relations for 3D preform scaffold were provided in Equations (19)–(21) [109]. Using the micromechanical Equations (19)–(21), we can predict the scaffold directional tensile modulus (E), shear modulus (G), and Poisson ratios (ν) properties.
E p = E f × V f p + E m × V m p
G p = G f × V f p + G m × V m p
ν p = ν f × V f p + ν m × V m p
where Ef is the fiber modulus; Em is the matrix modulus; Vfp is the preform fiber volume fraction; Vmp is the preform matrix volume fraction; Ep is the preform modulus; Gf is the fiber shear modulus; Gm is the matrix shear modulus; Gp is the preform shear modulus; νf is the fiber Poisson ratio; νm is the matrix Poisson ratio; νp is the preform Poisson’s ratio.
In addition, the fiber strain was presumed equal to the matrix strain in warp, filling, and z-yarn direction. Therefore, strength Equation (22) can be accepted for defining the directional and total tensile strength of 3D PGA fiber preform structure for scaffold critical volume fractions were achieved via proper preform architecture designs as explained in preform fabrications (Figure 1, Figure 2 and Figure 3). Residual effects, including strength (tensile, shear) and Poisson (directional deformation) parameters between warp/filling and warp/z-yarn were not considered during tensile strength calculations. Moreover, fiber-to-fiber interlacement (textile bonding or filamentary entanglement) in all 3D preforms, which caused stress concentration (straining), were neglected. So, the strength properties of all 3D preform scaffolds can be identified using Equation (22) [109].
σ p s = σ f × V f p + σ m × V m p
where σf is the fiber tensile strength; σm is the matrix tensile strength; σps is the preform tensile strength.

3. Results and Discussion

3.1. Preform Structure for Scaffold Results

Three-dimensional PGA fiber plain (1/1) woven preform for scaffold has interlacements in-plane and out-of-plane of the preform. This interlacement was created between warp-filling in the plane and warp-z-fiber in the out-of-plane during formation as shown in Figure 4(a1–a4). This caused coarse structure, resulting in sizeable local porosity around the fiber interlacement boundary (Figure 4(a2–a4)). Probably, this could be useful for cell adhesion and migration of cells through the predetermined filamentary TOW path to provide mechanical stimulation during cell growth and cell proliferation, especially 3D organ development. On the other hand, polyglycolic acid fiber is biocompatible, biodegradable, and well suited for 3D preform scaffold applications. Thus, it is probably formed three-dimensionally, especially the insertion of the z-yarn in the through-the-thickness of the scaffold to improve cell adhesion and growth. PGA fiber is a continuous form on the surface and inside of the preform (meso-scale) (Figure 4(a3,a4)). In addition, 3D preform surface topography can be tailored depending on cell distribution in the directional fiber volume fraction and fiber directions [9]. This proof-of-concept study was successfully demonstrated for its feasibility. Nonetheless, in vitro and in vivo studies should be carried out on the 3D developed PGA scaffold for future research endeavor. To manufacture higher-order interlaced 3D PGA fiber preform from the loom, two-dimensional shedding must be used and the loom should be automated for consistent preform fabrication for scaffolding for tissue engineering.
Three-dimensional PGA fiber semi-interlaced woven preform for scaffold has interlacements in-plane (plain 1/1), and no interlacements (orthogonal) were out-of-plane of the preform. This 3D structure was made between warp-filling in the plain (1/1) pattern in the plane, and warp-z-fiber in the out-of-plane was orthogonally formed, as shown in Figure 4(b1–b4). Therefore, directional porosity, fiber volume fraction and predetermined PGA fiber path were crated differently (Figure 4(b2–b4). Perhaps this could influence cell distribution and cell differentiation, including cell contact guidance, which means, regulating the adhesion of cells, cell morphology, migration and cell proliferation [50,51]. On the other hand, 3D PGA fiber orthogonal woven preform for scaffold has no interlacements in-plane and out-of-plane of the preform except preform surface where fibers were high order curvature arc form as exhibited in Figure 4(c1–c4). Therefore, uniform fiber volume fraction and porosity can comparatively achieve (Figure 4(c2–c4)). This perhaps affects cell differentiation mainly, including cell contact guidance phenomena. However, in vitro and in vivo studies on all developed 3D PGA fiber preforms for scaffolds are required.

3.1.1. Preform Fiber-to-Fiber Space, Density, and Areal Density Results

Yarn-to-yarn space, density, and angles of all 3D PGA fiber preform structures are presented in Table 5. Figure 5a–c illustrates yarn-to-yarn space, density and areal density of the 3D PGA fiber woven preform structures. Table 5 and Figure 5a show that warp-warp spaces in all 3D structures were almost uniform. However, filling-filling spaces in 3DW-P-ZO were 60% and 14.29% larger at the top of 3DW-P-ZP and 3DW-O-ZO, respectively. On the other hand, the filling-filling space on the side of all 3D structures was slightly distorted during filling insertion, probably due to the low bending rigidity of PGA fiber and process parameters, including light beat-up and interlacement-based preform architecture. The filling-filling distance of 3DW-P-ZO was over twice as large as the 3DW-P-ZP and 3DW-O-ZO due to in-plane and out-of-plane fiber interlacement differences. Z-yarn–z-yarn distances of 3DW-P-ZO and 3DW-P-ZP were 66.67% and 83.83% larger than the 3DW-O-ZO structure. The reason for the z-yarn–z-yarn distance differences between structures on the side were mainly through-the-thickness interlacement patterns (textile bonding) in that it resisted z-yarn during formation after z-yarn insertion. As seen in Table 5 and Figure 5b, preform density (ends/10mm) of warp in all 3D structures was approximately homogenous. However, the filling density of 3DW-O-ZO was twice as compared to the top of 3DW-P-ZP and 3DW-P-ZO. This was because of orthogonal fiber placement in the preform structure. In addition, z-yarn densities on the side of 3DW-P-ZP and 3DW-P-ZO were twice less dense than 3DW-O-ZO due to especially in-plane interlacements, which created frictional resistance during z-yarn packing in the formation zone. Additionally, the preform areal densities of the 3DW-P-ZP and 3DW-P-ZO structures were about 34.55% higher than 3DW-O-ZO, as exhibited in Figure 5c.

3.1.2. Preform Structure Angle Results

Figure 6a,b exhibits angles of warp, weft, and z-yarn along the length of the 3D PGA fiber preform structures. As seen in Table 5 and Figure 6a, the warp angle in the preform length (θws) of 3DW-O-ZO was almost twice higher than 3DW-P-ZP, whereas the z-yarn made an angle (θzm) in the fabric width of 3DW-P-ZP due to in-plane interlacement. On the other hand, the filling angle (θfs) in the preform length was almost the same for all 3D PGA fiber preform structures and the z-yarn angle in the fabric length (θzs) of 3DW-P-ZP was 10° as shown in Figure 6b. Probably, directional fiber angles in the structure potentially affect the cell density and 3D cell growth morphology.

3.1.3. Preform Structure Crimp and Fiber Length Results

Crimp and fiber length measurement results of all 3D PGA fiber-woven preforms are presented in Table 6. Figure 7a–c shows directional crimp ratios, yarn length, and z-yarn length in all 3D PGA fiber woven preform structures. As seen in Table 6 and Figure 7a, directional crimp ratios were proportional, and the z-yarn crimp ratio (%) was the highest and followed by weft and warp crimp ratios (%). Z-yarn crimp (Cz) in 3DW-P-ZP was 50% and five times greater than 3DW-P-ZO and 3DW-O-ZO, respectively. However, weft crimp (Cf) in 3DW-P-ZP was 28.53% and 100% higher than 3DW-P-ZO and 3DW-O-ZO. In addition, warp crimp (Cw) in 3DW-P-ZP was 61.34% and 177.5% larger than 3DW-P-ZO and 3DW-O-ZO. The weft yarn set obtained the lowest crimp ratios of all 3D structures. Z-yarn in all scaffold structures exhibited large crimp deviations due to out-of-plane and surface interlacement, which led to resistance during fiber compression. Furthermore, the large amounts of directional crimps in 3DW-P-ZP were received due to in-plane and through-the-thickness interlacement making the yarn sets more curvature. This could be beneficial during cell contact guidance, including cell growth rate and proliferation.
As seen in Table 6 and Figure 7b, it was identified that yarn set lengths were proportional, and warp length was the longest, followed by filling and z-yarn lengths. The reason was that the warp in the surface of 3DW-O-ZO made a large arc compared to 3DW-P-ZP and 3DW-P-ZO. Furthermore, the total z-yarn length (lzt) in 3D-P-ZP was 25.10% and 41.59% lengthy compared to 3DW-P-ZO and 3DW-O-ZO, respectively (Figure 7c). This was because of the through-the-thickness yarn length (lz) in the 3D PGA fiber plain preform structure. This could be considered especially meaningful for making the 3D tissue formation because cells in the thickness of the scaffold can be growing via through-the-thickness fiber (z-yarn), including various possible mechanisms such as mechanobio stimulus effects, cellular migration, and cellular bridging during in-growth of tissue towards the thickness of scaffold.

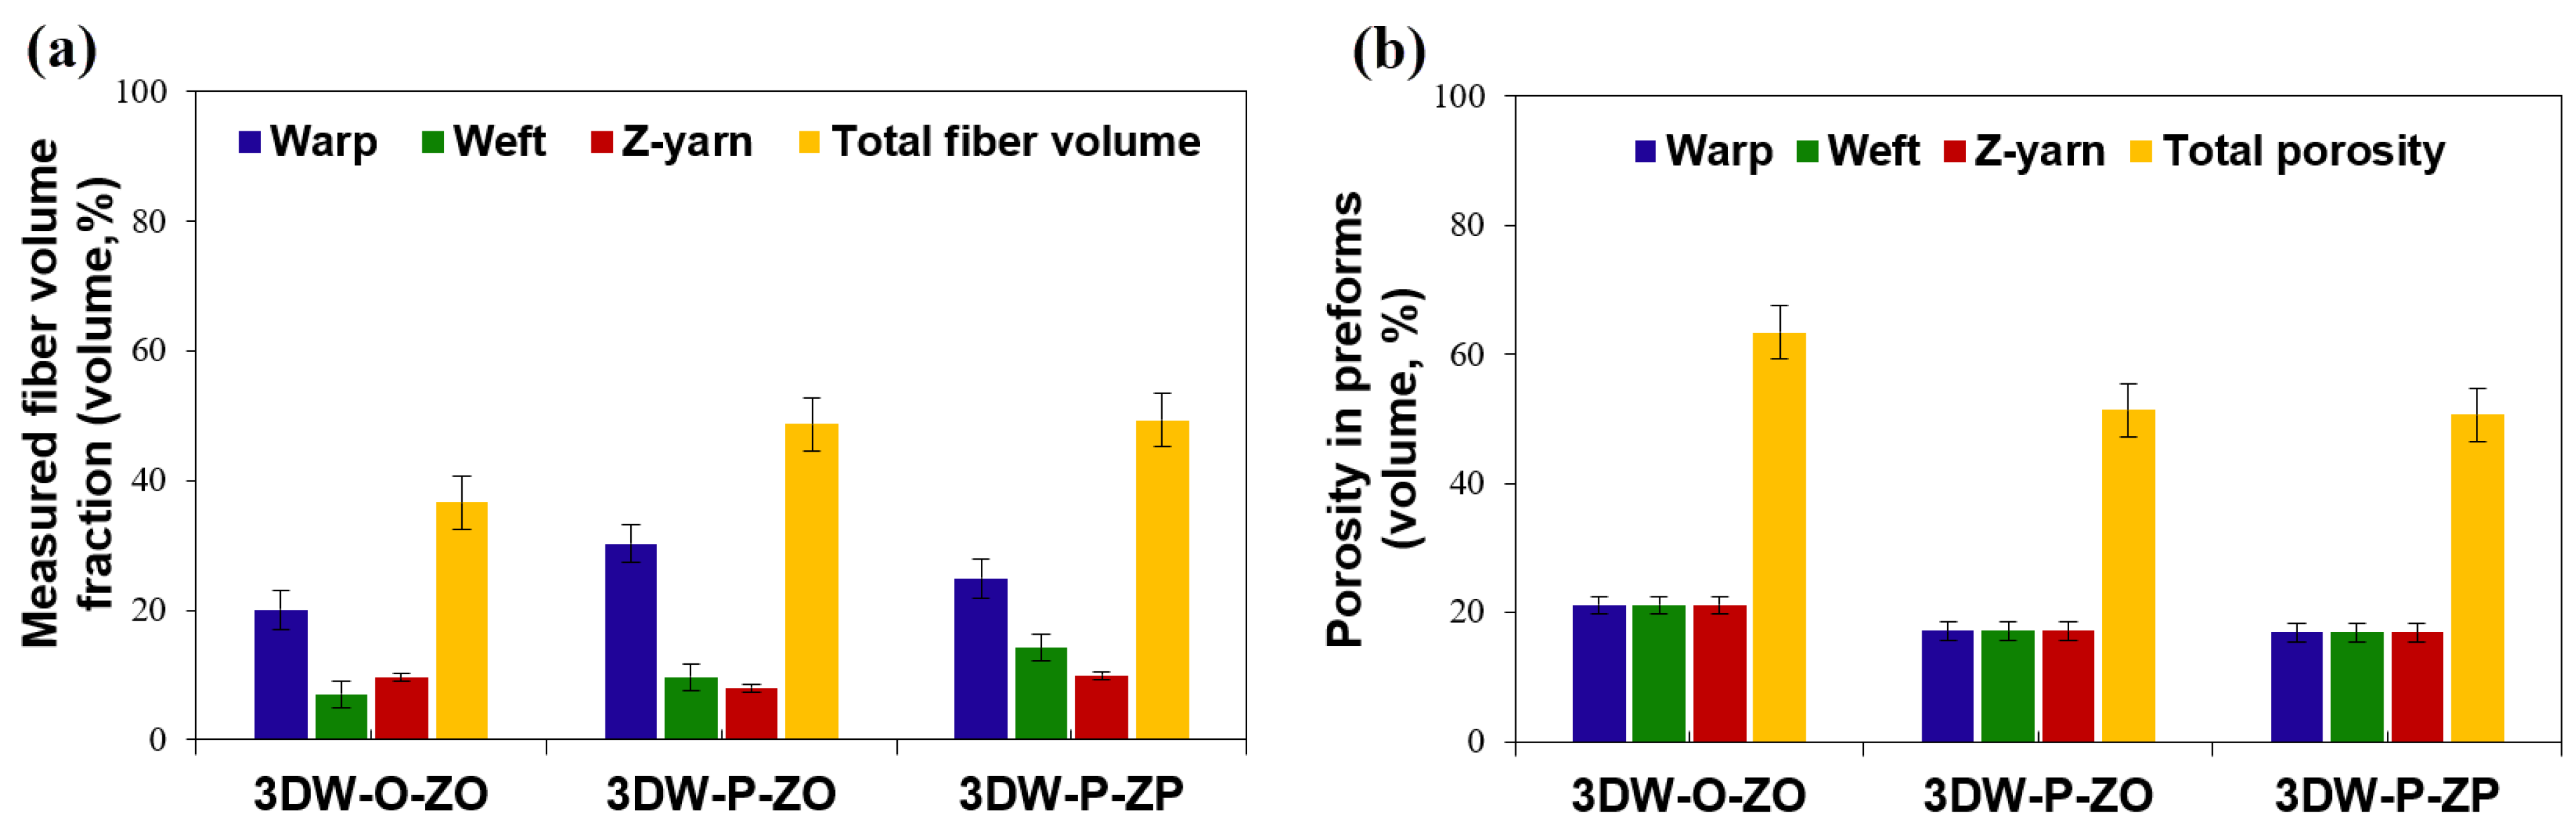
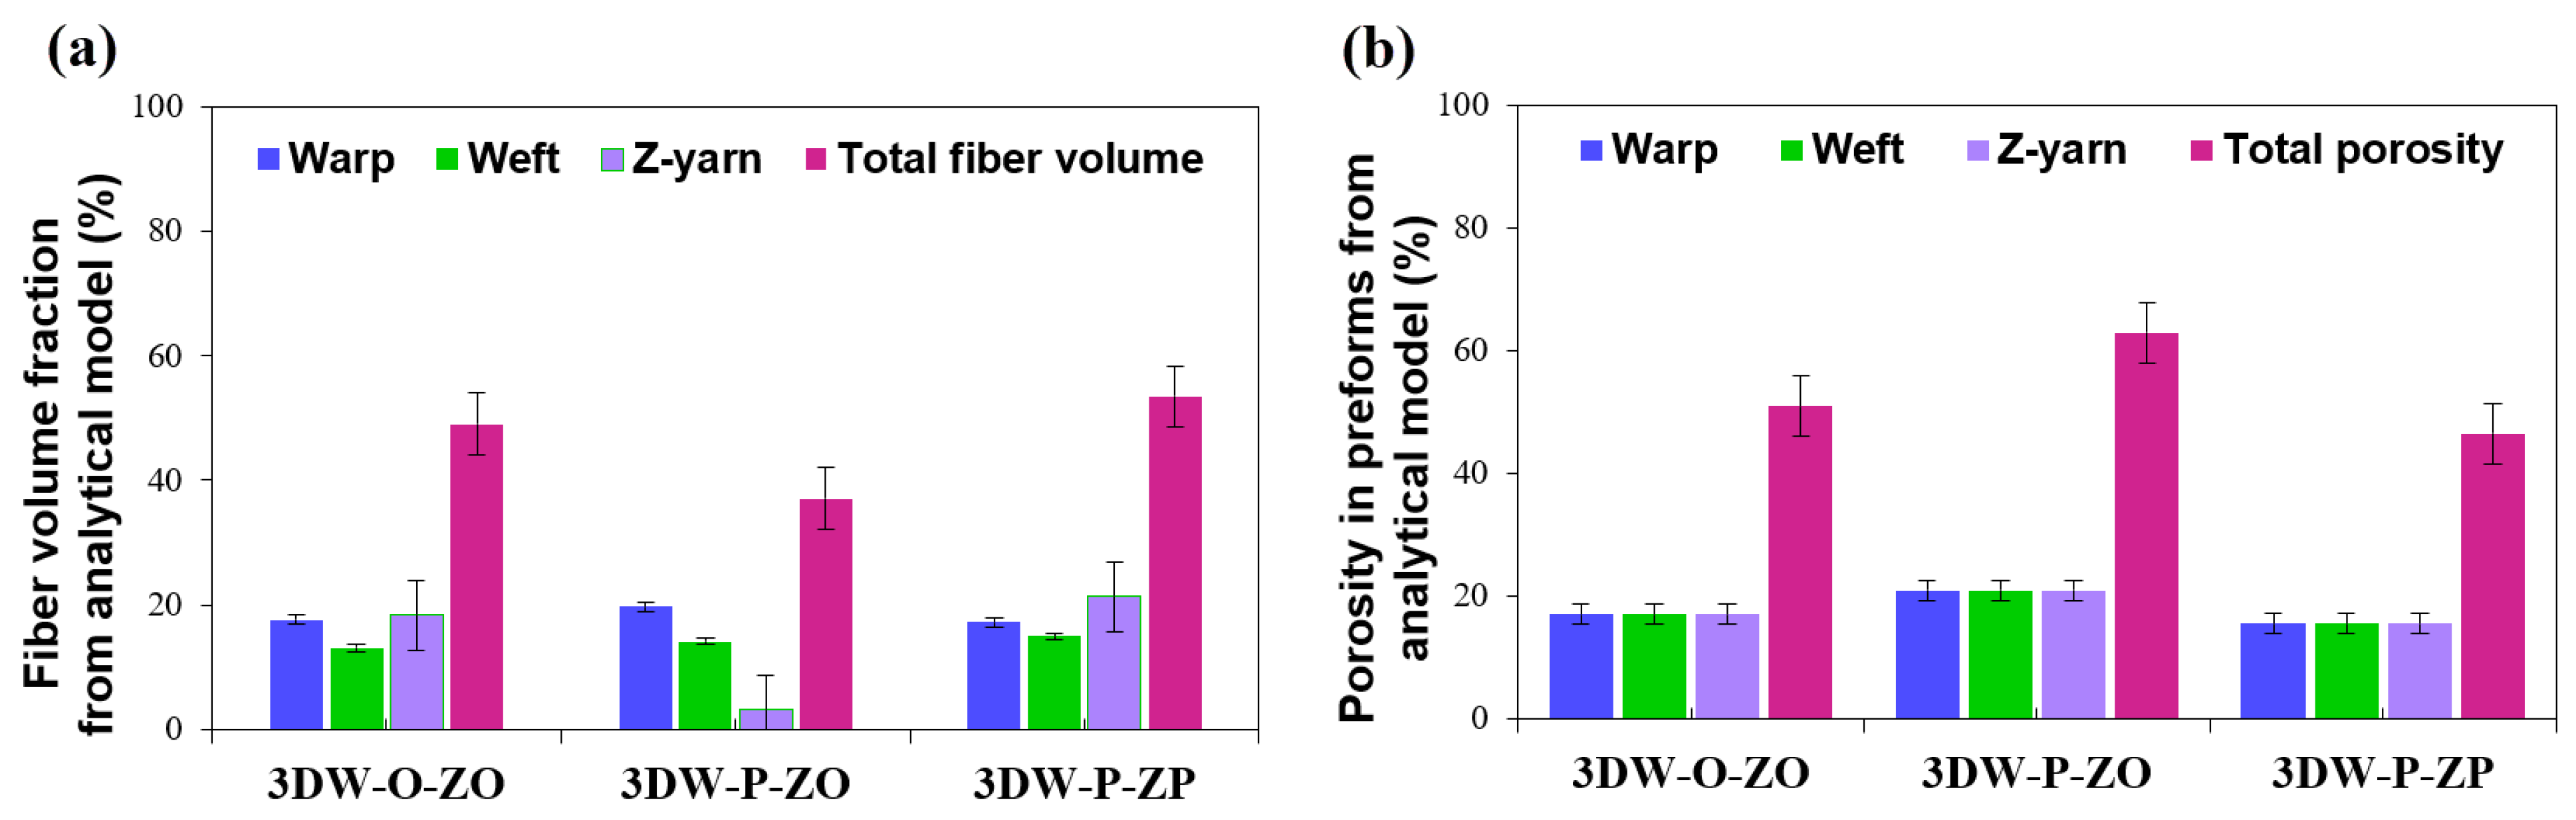
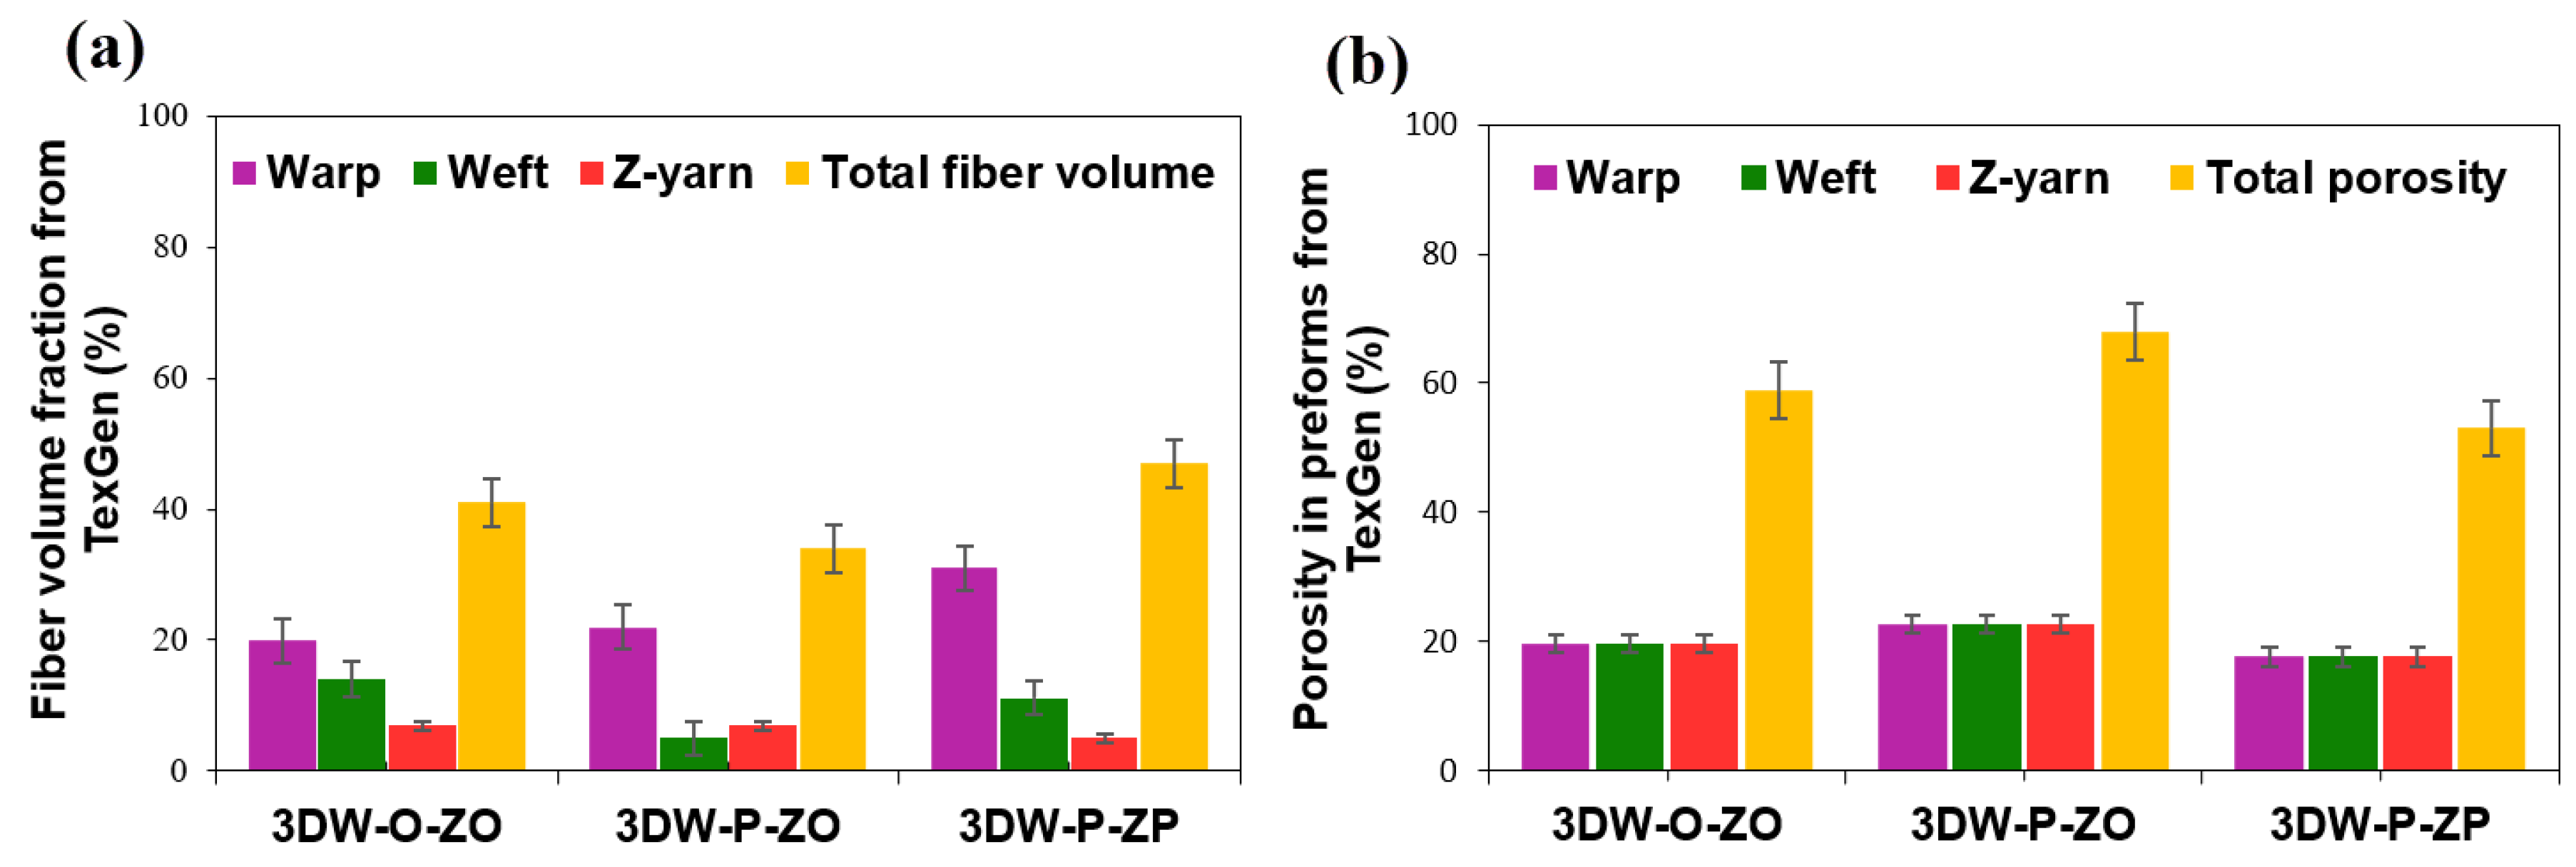
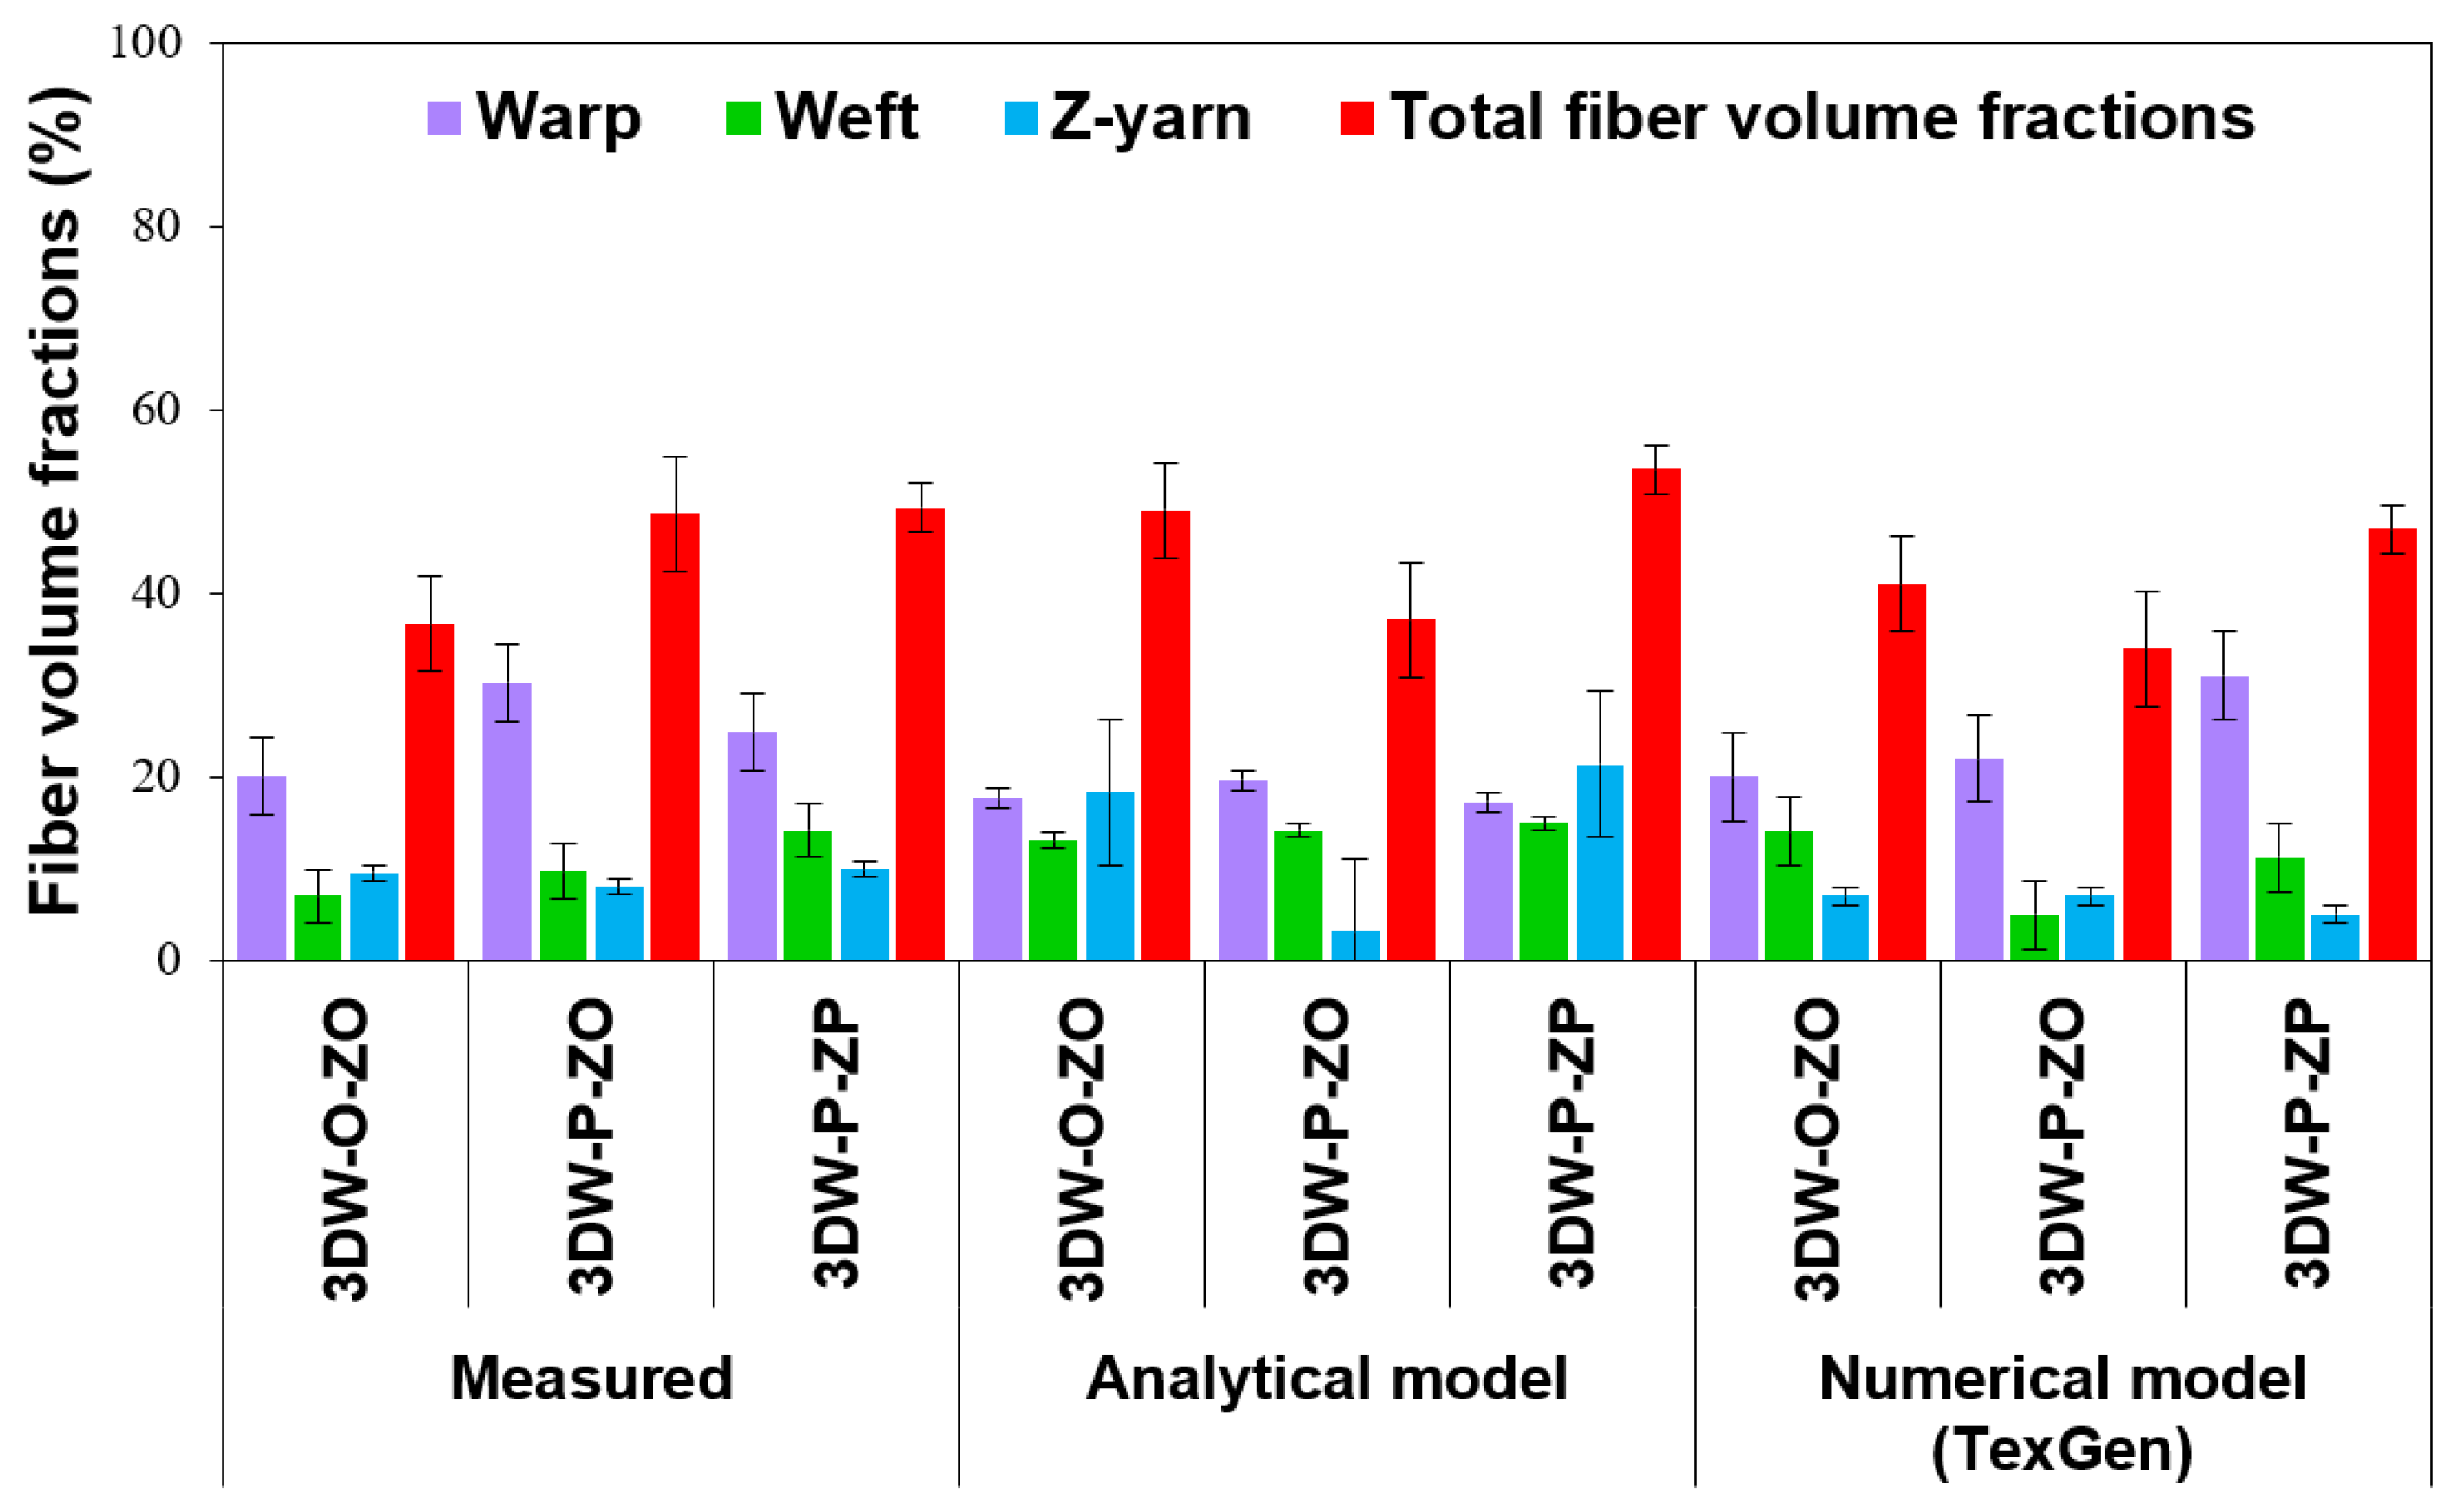
3.2. Volume Fraction and Porosity Results

Fiber volume fractions based on measured values, analytic modeling, and numerical model (TexGen) of all 3D PGA fiber woven preforms are given in Table 7. Figure 8a,b shows fiber volume fractions (%) and fiber porosity fractions (%) of all 3D PGA fiber woven preform structures. Figure 9a,b illustrates the directional and total fiber volume fraction, and porosity fraction (%) of all 3D woven preform received from analytic relations. Figure 10a,b exhibits directional and total fiber volume fraction (%) and porosity fractions (%) of all 3D woven preform received from the numerical model (TexGen).
As seen in Table 7 and Figure 8a, measured directional and total volume fractions were proportional and total volume fraction of 3DW-P-ZP was slightly higher than 3DW-P-ZO and 3DW-O-ZO preform structures. They (Vfp) were varied between 36.66% and 49.33%. In addition, warp fiber volume fraction was the highest, followed by filling and z-yarn. The Vfw of 3DW-P-ZP was 17.76% lower than 3DW-P-ZO but 23.98% higher than 3DW-O-ZO. On the other hand, the Vff of 3DW-P-ZP was 45.73% and 101.28% greater than those of 3DW-P-ZO and 3DW-O-ZO. Vfz of 3DW-P-ZP was 24.03% and 4.29% greater than those of 3DW-P-ZO and 3DW-O-ZO. As seen in Table 7 and Figure 8b, measured directional and the total porosity fractions (Vtpr) were proportional and varied between 50.67% and 63.34%. In addition, total porosity fraction of 3DW-P-ZP was 1.31% and 20% lower than 3DW-P-ZO and 3DW-O-ZO preform structures, respectively.
Table 7 and Figure 9a show that the analytic model’s directional and total volume fractions were slightly proportional. The total volume fraction of 3DW-P-ZP was hardly higher than 3DW-P-ZO and 3DW-O-ZO preform scaffolds. They (Vfp) varied between 37.08% and 53.52%. In addition, warp fiber volume fraction was mainly the highest and almost followed by filling and z-yarn, which was somewhat fluctuated probably due to thickness variations considering surface topography. Vfw of 3DW-P-ZP was 12.63% and 2.49% low compared to 3DW-P-ZO and 3DW-O-ZO. On the other hand, the Vff of 3DW-P-ZP was 5.78% and 14.29% greater than those of 3DW-P-ZO and 3DW-O-ZO, respectively. Vfz of 3DW-P-ZP was over five times and 14.29% greater than those of 3DW-P-ZO and 3DW-O-ZO, respectively. As seen in Table 7 and Figure 9b, directional and total porosity fractions (Vtpr) were proportional and varied between 46.48% and 62.92%. In addition, the total porosity fraction of 3DW-P-ZP was 26.13% and 8.72% lower than 3DW-P-ZO and 3DW-O-ZO preform structures, respectively.
As seen in Table 7 and Figure 10a, directional and total volume fractions from the numerical model (TexGen) were about proportional. The total volume fraction of 3DW-P-ZP was slightly higher than that of 3DW-P-ZO and 3DW-O-ZO preform scaffolds. They (Vfp) varied between 34% and 47%. In addition, the warp fiber volume fraction was the highest followed by filling and z-yarn. Vfw of 3DW-P-ZP was 40.80% and 55% greater than those of 3DW-P-ZO and 3DW-O-ZO, respectively. On the other hand, the Vff of 3DW-P-ZP was 124% greater than 3DW-P-ZO and 20% lower than 3DW-O-ZO. Vfz of 3DW-P-ZP was 28.57% lower than those of 3DW-P-ZO and 3DW-O-ZO. As seen in Table 7 and Figure 10b, directional and total porosity fractions (Vtpr) were proportional and varied between 53% and 68%. In addition, the total porosity fraction of 3DW-P-ZP was 22.06% and 10.17% lower than 3DW-P-ZO and 3DW-O-ZO scaffold structures, respectively. This result may be considered that cell growth and cell density are perhaps proportional with directional fiber volume fractions for each preform scaffolds.

Comparison of Measured Data, Analytic Model, and FE Model (TexGen)

Figure 11 shows directional and total fiber volume fractions of all 3D woven preform structures from measured data, analytic relations, and numerical model (TexGen). As seen in Table 7 and Figure 11, total volume fractions (Vfp) of 3DW-P-ZP predicted by the analytic model were slightly differed (8.49% higher) compared to the measured value, whereas Vfp predicted by the numerical model was 4.72% low compared to the measured fiber volume fraction. On the other hand, total volume fractions (Vfp) of 3DW-P-ZO from the analytic model substantially differed (23.80% lower) compared to the measured value. In contrast, Vfp from the numerical model was 30.13% lower than the measured fiber volume fraction. Furthermore, total volume fractions (Vfp) of 3DW-O-ZO predicted by the analytic model were considerably differed (33.88% higher) compared to the measured value, whereas Vfp predicted by numerical model was slightly 11.84% high compared to the measured fiber volume fraction. The differences in preform fiber volume fraction between the analytical, FE model, and measured valued attributed to the warp, filling, z-yarn (fiber TOW) cross-section deformation under inter-yarn pressure created during formation under constant tension where yarn (fiber TOW) cross-section was distorted from circular to high order degree ellipse or lenticular shape. This influenced fiber TOW porosity (or void) and created additional porosity around the interlacement section of the yarn sets. Therefore, preform scaffold dimensions were changed, especially thickness and width. Moreover, dimensional changes of in preforms can also affect their failure mechanism during the degradation period of PGA fiber in the scaffold architecture.
Total porosity fractions (Vprt) of 3DW-P-ZP predicted by analytic and numerical models were 7.87% and 4.60% higher than compared to the measured value, respectively. Additionally, total porosity fractions (Vprt) of 3DW-P-ZO from analytic and FE models (TexGen) were substantially lower at 22.56% and 32.45% compared to the measured value. Further, the total porosity fractions (Vprt) of 3DW-O-ZO predicted by analytic and TexGen models were 19.61% and 6.85% low compared to the measured value. The results demonstrated that volume fraction and porosity fractions of all 3D woven scaffolds could be accurately predicted depending upon biodegradable tissue regeneration requirements.

3.3. Stiffness and Strength on 3D Preforms Results

The stiffness and strengths of 3D PGA fiber preform scaffolds based on measured values, analytic model, and numerical model (TexGen) are presented in Table 8, where Ewarp (E11), Efilling (E22), and Ez-yarn (E33) are the warp, filling, and z-yarn direction tensile modulus, respectively. Further, Gwarp-filling (G12), Gfilling-z-yarn (G23), and Gz-yarn-warp (G13) are the warp, filling, and z-yarn direction shear modulus, respectively. νwarp-filling12), νfilling-z-yarn23) and νz-yarn-warp31) are the warp, filling, and z-yarn direction Poisson ratios, respectively. In addition, σwarp11), σfilling22), and σz-yarn33) are the warp, filling, and z-yarn direction tensile strengths. These directional stiffness and strength calculations on 3D preforms were carried out considering micromechanical relations as explained in Section 2.4. Figure 12 illustrates directional and preform stiffnesses and tensile strengths of all 3D PGA fiber preform scaffolds from measured values, analytic model, and FE model (TexGen), and Figure 12 also exhibits tensile and shear modulus of all 3D PGA fiber preform scaffolds from measured values, analytic model, and FE model (TexGen).
During stiffness and strength calculations, polyglycolic acid fiber tensile modulus and strength (average 6.5 GPa for modulus, 79.85 MPa for tensile strength) [98] and hydrogel tensile modulus and strength (average 75 × 10−6 GPa for modulus, 25 × 10−3 for tensile strength) [110,111] were considered. In addition, polyglycolic acid fiber Poisson ratios (average 0.35) [112,113] and hydrogel Poisson ratios (average 0.457) [113,114] were conceded. Moreover, directional and total fiber volume fractions of the 3DW-P-ZP, 3DW-P-ZO, and 3DW-O-ZO preform scaffold defined by measured values, an analytical model, and a numerical model (TexGen) were utilized, and a micromechanics principle was applied via tensile modulus Equation (19), shear modulus Equation (20), Poisson ratio Equation (21), and tensile strength Equation (22).
As seen in Table 8 and Figure 12, the tensile modulus (Ep) of 3DW-P-ZP was the highest value, followed by 3DW-P-ZO and 3DW-O-ZO structures. In addition, the warp modulus (Ewarp) was the highest compared to the filling (Efilling) and z-yarn (Ez-yarn) modulus. The tensile moduli obtained from measured, analytic, and numerical models were close to each other. They varied between 2.21 GPa and 3.48 GPa. Z-yarn modulus (Ez-yarn) might probably be critical values during in vitro, in vivo, or ex vivo experiments due to strong stiffness properties through-the-thickness direction where hydrogel modulus was negligibly small.
As seen in Table 8 and Figure 13, the shear modulus (Gp) of 3DW-P-ZP was nearly the highest value and followed by 3DW-P-ZO and 3DW-O-ZO structures. In addition, the warp shear modulus (Gwarp-filling) was the highest compared to the filling (Gfilling-z-yarn) and z-yarn (Gz-yarn-warp) modulus. The shear moduli obtained from measured, analytic, and numerical models were close to each other. They varied between 0.82 GPa and 1.29 GPa. Z-yarn shear modulus (Gz-yarn-warp) could probably be critical values during in vitro, in vivo, or ex vivo experiments due to robust stiffness properties through-the-thickness direction where the hydrogel modulus was comparatively small. It was also obtained that the tensile and shear modulus of all 3D PGA fiber preform scaffolds were proportional to their total fiber volume fractions (Figure 13).
It was found that the tensile strength (σps) of 3DW-P-ZP was the highest value, followed by 3DW-P-ZO and 3DW-O-ZO structures. In addition, warp strength (σw) was the highest compared to the filling (σf) and z-yarn (σz) strength. The tensile strength obtained from measured, analytic, and numerical models were close to each other. They varied between 27.17 MPa and 42.75 MPa. Z-yarn tensile strength is probably critical values during in vitro, in vivo, or ex vivo experiments due to robust strength properties in the thickness of the scaffolds, which can help provide a microstress environment for cells and influence especially cell adhesion, stimulate cell growth, and proliferation rates of cells for 3D tissue regenerations. On the other hand, the ultimate tensile strength of actual articular cartilage varied from 15–35 MPa [90]. The measured tensile strength of the 3D PGA fiber preform scaffold varied from 29.29–39.49 MPa. The tensile strength values of both actual and 3D PGA fiber scaffolds were near each other. Therefore, it was considered that the tensile strength properties of biodegradable 3D fiber PGA fiber scaffold were approximately matching the native tissue.

3.4. Relevance of Possible Results of a Three-Dimensional Preform for the Scaffold of Tissue Engineering

Three-dimensional (3D) biodegradable polyglycolic acid fiber (PGA) preforms were developed for possible applications for the scaffold of 3D tissue regenerations. On the other hand, three-dimensional preform architectures including fiber volume fraction, porosity, stiffness, and strength influenced scaffold properties for tissue engineering. Primarily, 3D tissue regeneration could be possible due to presence of the through-the-thickness continuous polyglycolic acid fiber reinforcement in 3D preform scaffold, which probably stimulates cell contact guidance and mechanical stimulation that match the mechanical properties of regenerated target tissues [9,20,26]. Therefore, various developed 3D polyglycolic acid fiber preforms can be used as a temporary supportive substrate for 3D tissue regeneration, such as articular cartilage, during in vitro, in vivo, or ex-vivo studies.

3.5. Morphology of Preform Structure for Scaffold Results

3.5.1. 3D Plain Woven Preforms

Actual and schematic unit cells views of 3D plain preform architecture are shown in Figure 14. As exhibited in Figure 14, in the meso-scale 3D preform view along filling (cross-section), polyglycolic acid fiber warp cross-sections were a lenticular shape, and each warp cross-section was almost heterogeneous due to applied inter-fiber pressure during scaffold formation (Figure 14a). However, the porosity shape in the preform based on the virtual TexGen model appeared to have an angular curve-I beam. In the meso-scale 3D preform view along warp (side), polyglycolic acid fiber-filling cross-sections were flat lenticular shape, and each filling cross-section was heterogeneous due to applied warp and z-yarn inter-pressure during scaffold formation (Figure 14b). However, the preform’s porosity shape based on the virtual TexGen model appeared nearly partially rectangular. In the meso-scale 3D preform view on surface (top), polyglycolic acid fiber warp and filling were flat rectangular trajectories, and z-yarns had large arc curvature or angularly deformed arc curvature (criss-cross). They were heterogeneous due to exerted inter-fiber pressure generated during fiber-to-fiber interlacements for scaffold formation (Figure 14c). However, the porosity shape in the preform based on the virtual model featured a nearly trapezoidal beam.

3.5.2. 3D Semi-Interlaced Woven Preforms

Actual and schematic unit cells views of 3D semi-interlaced preform architecture are exhibited in Figure 15. As illustrated in Figure 15, in the meso-scale 3D preform view along filling (cross-section), polyglycolic acid fiber warp cross-sections were about ellipse shape, and each warp cross-section was heterogeneous due to applied inter-fiber pressure, which bent yarn cross-sections during scaffold formation (Figure 15a). However, the porosity shape in the preform based on the virtual TexGen model appeared to have concave rectangular beam shapes. In the meso-scale 3D preform view along warp (side), polyglycolic acid fiber filling cross-sections were near to flat lenticular shape and each filling cross-section was heterogeneous due to applied warp and z-yarn inter-pressure causing spreading the PGA filaments around the warp during scaffold formation (Figure 15b). However, the porosity shape in the preform based on the virtual model looked nearly partial trapezoidal or curvy square beams. In the meso-scale 3D preform view on the surface (top), polyglycolic acid fiber warp and filling were flat rectangular trajectories, and z-yarns had large arc curvature. They were heterogeneous due to exerted inter-fiber pressure generated during in-plane fiber-to-fiber interlacements for scaffold formation (Figure 15c). However, the porosity shape in the preform based on the virtual model featured a nearly curvy trapezoidal beam.

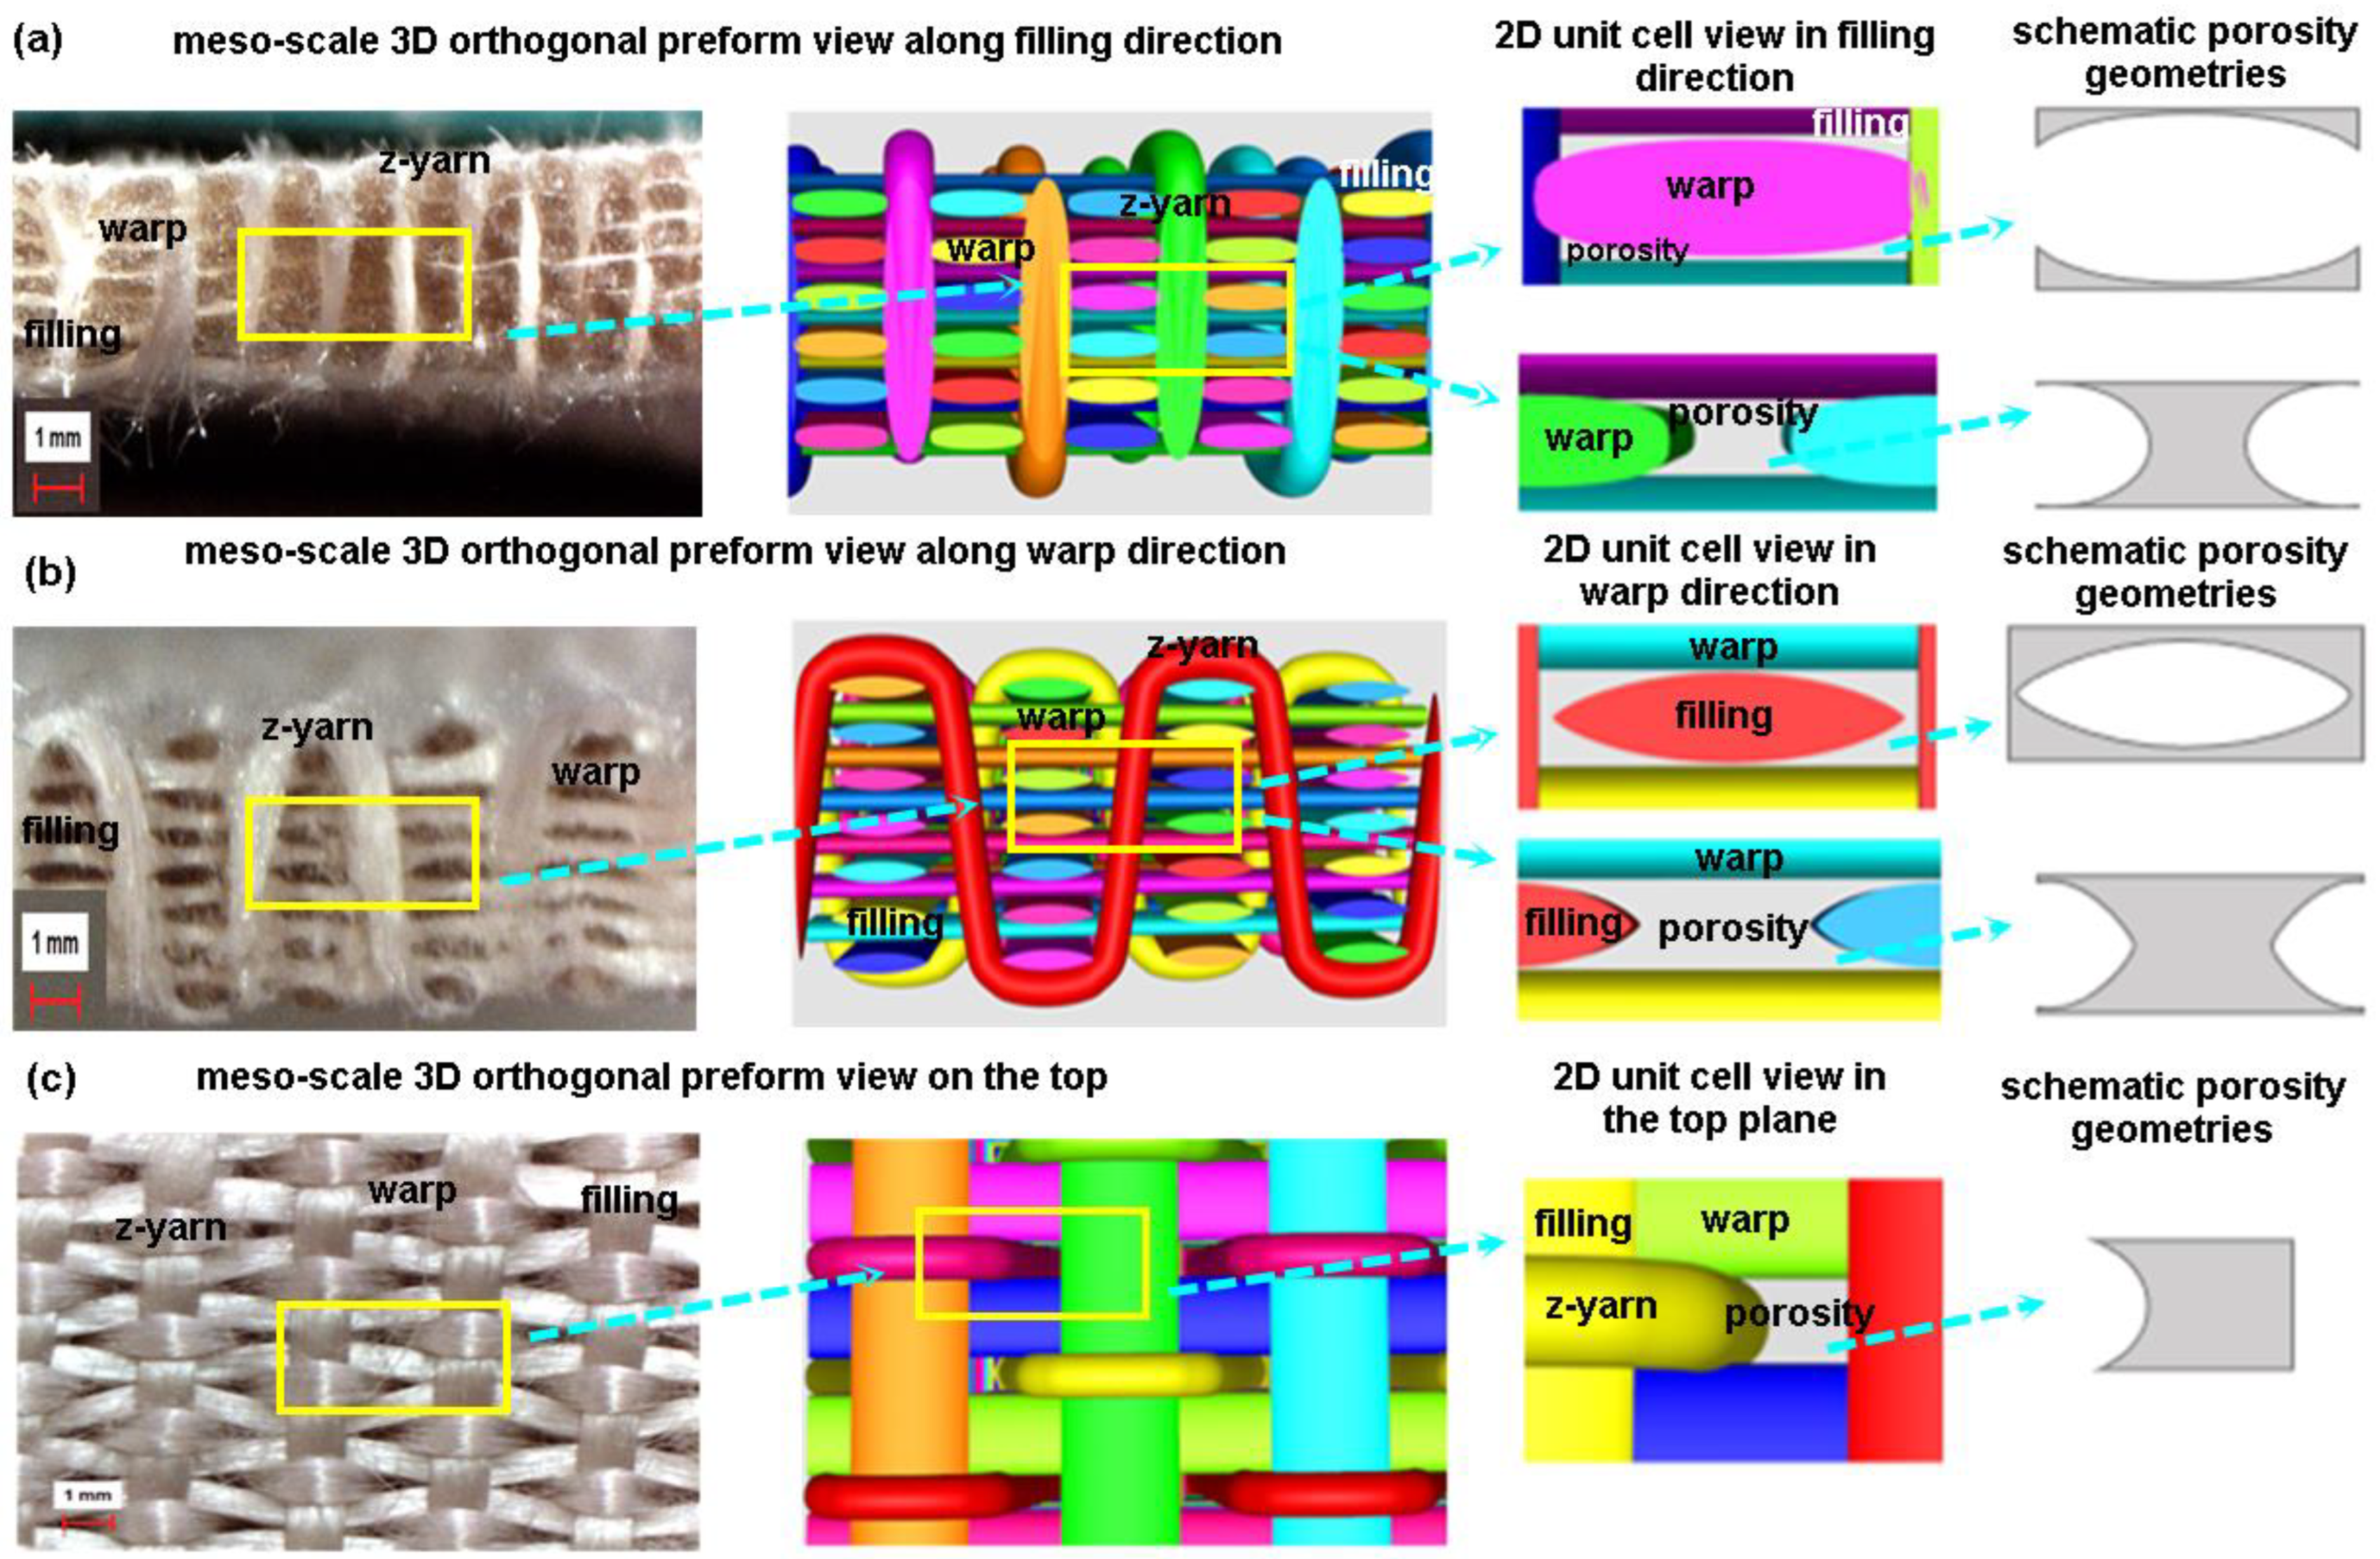
3.5.3. 3D Orthogonal Woven Preforms

Actual and schematic unit cells view of 3D orthogonal preform architecture is depicted in Figure 16. As exhibited in Figure 16, in the meso-scale 3D preform view along filling (cross-section), polyglycolic acid fiber warp cross-sections were near to rectangular or square shape, and each warp cross-section was relatively heterogeneous due to applied inter-fiber pressure during scaffold formation (Figure 16a). However, the porosity shape in the preform based on the numerical model (TexGen) appeared to have a concave and angular curve-I beam, which may be considered as a synclastic curvature and revolution of the body. In the meso-scale 3D preform view along warp (side), polyglycolic acid fiber-filling cross-sections were small-size ellipse shape, and each filling cross-section was heterogeneous due to applied warp and z-yarn inter-pressure during scaffold formation (Figure 16b). However, the porosity shape in the preform based on the virtual model appeared nearly an ellipsoid rectangular cylinder. In the meso-scale 3D preform view on the surface (top), polyglycolic acid fiber warp was intra-curvy small scale, whereas filling was large flat rectangular, and z-yarns had sharp arc curvatures. They were heterogeneous due to exerted inter-fiber pressure generated during surface fiber-to-fiber interlacements (Figure 16c). However, the porosity shape in the preform based on the virtual model featured nearly one side curvy rectangular shape.

4. Conclusions

Three-dimensional (3D) biodegradable polyglycolic acid (PGA) fiber preforms were made to scaffold three-dimensional tissue regeneration such as articular cartilage. Yarn-to-yarn space, density, and angles of all 3D PGA fiber preform were heterogeneous and demonstrated direction-dependent features (anisotropy). Further, it was obtained that directional crimp ratios were proportional, and the z-yarn crimp ratio (%) was the highest and followed by weft and warp crimp ratios (%). Total volume fractions (Vfp) predicted by the analytic and numerical model of all 3D preform scaffolds exhibited some deviations compared to the measured values because yarn cross-sections in the preform were changed from ideal circular geometry to high-order ellipse (lenticular) due to inter-fiber pressure generated during preform formation.
The stiffness properties of 3D preform scaffolds varied between 2.21 GPa and 3.48 GPa. Z-yarn modulus (Ez-yarn) was probably a critical value due to strong stiffness in the through-the-thickness direction where the hydrogel modulus was negligibly small. The tensile strength values of both actual such as articular cartilage and 3D PGA fiber scaffold were near each other. Therefore, it was considered that the tensile strength properties of biodegradable 3D fiber PGA fiber scaffold were approximately matching the native tissue.
The morphology of the preform scaffold showed that PGA fiber sets were locally distorted and appeared in the scaffold as inconsistent and inhomogeneous continuous fiber forms. Additionally, various porosity shapes in the preform based on the virtual model featured nearly trapezoidal beams, curvy trapezoidal, angular curvy beams, partial or concave rectangular beams, curvy square beams, and ellipsoid rectangular cylinders. Therefore, various developed 3D polyglycolic acid fiber preforms can be used as a temporary supportive substrate for 3D tissue regeneration (articular cartilage) due to through-the-thickness fiber (z-yarn) reinforcement. Future research on 3D preform scaffolds should carry out in vivo, in vitro, or ex vivo environments to test their performance for 3D tissue regeneration.

Author Contributions

Conceptualization, K.B.; methodology, K.B.; software, H.K.; validation, K.B., H.K.; formal analysis, K.B.; investigation, H.K.; resources, H.K.; data curation, H.K.; writing—original draft preparation, K.B.; writing—review and editing, K.B.; visualization, H.K.; supervision, K.B.; project administration, K.B.; funding acquisition, K.B. All authors have read and agreed to the published version of the manuscript.

Funding

TUBITAK-MAM: Grant No. 213M691-1003, priority areas research and development support program, partly supported this research.

Institutional Review Board Statement

Not applicable.

Informed Consent Statement

Not applicable.

Data Availability Statement

Data is provided in the article.

Acknowledgments

This work was partly supported by TUBITAK-MAM, Grant No. 213M691-1003 priority areas research and development support program. Thus, they thank Serdar Sezer and Umran Sezer for their partial grant support to the project, especially for supplying the PGA fibers. In addition, the authors would like to thank Gulhan Erdogan and Ozlem Akyurek for scaffold fabrication and some measurements.

Conflicts of Interest

The authors declare no potential conflict in this article’s research, authorship, and publication.

References

  1. Williams, D.F. On the nature of biomaterials. Biomaterials 2009, 30, 5897–5909. [Google Scholar] [CrossRef]
  2. Bilisik, K.; Akter, M. Polymer nanocomposites based on graphite nanoplatelets (GNPs): A review on thermal-electrical conductivity, mechanical and barrier properties. J. Mater. Sci. 2022, 57, 7425–7480. [Google Scholar] [CrossRef]
  3. Bilisik, K.; Syduzzaman, M. Carbon nanotubes in carbon/epoxy multiscale textile preform composites: A review. Polym. Compos. 2021, 42, 1670–1697. [Google Scholar] [CrossRef]
  4. Azzazy, H.M.; Mansour, M.M.; Kazmierczak, S.C. From diagnostics to therapy: Prospects of quantum dots. Clin. Biochem. 2007, 40, 917–927. [Google Scholar] [CrossRef]
  5. Delehanty, J.B.; Mattoussi, H.; Medintz, I.L. Delivering quantum dots into cells: Strategies, progress and remaining issues. Anal. Bioanal. Chem. 2009, 393, 1091–1105. [Google Scholar] [CrossRef]
  6. Pelley, J.L.; Daar, A.S.; Saner, M.A. State of academic knowledge on toxicity and biological fate of quantum dots. Toxicol. Sci. 2009, 112, 276–296. [Google Scholar] [CrossRef]
  7. Williams, D. Benefit and risk in tissue engineering. Mater. Today 2004, 7, 24–29. [Google Scholar] [CrossRef]
  8. Meyer, U. The History of Tissue Engineering and Regenerative Medicine in Perspective. In Fundamentals of Tissue Engineering and Regenerative Medicine; Meyer, U., Handschel, J., Wiesmann, H., Meyer, T., Eds.; Springer: Berlin/Heidelberg, Germany, 2009; pp. 5–12. [Google Scholar]
  9. Ma, P.X. Scaffolds for tissue fabrication. Mater. Today 2004, 7, 30–40. [Google Scholar] [CrossRef]
  10. Williams, D.F. To engineer is to create: The link between engineering and regeneration. Trends Biotechnol. 2006, 24, 4–8. [Google Scholar] [CrossRef] [PubMed]
  11. Griffith, L.G.; Naughton, G. Tissue engineering—Current challenges and expanding opportunities. Science 2002, 295, 1009–1014. [Google Scholar] [CrossRef]
  12. Rajendran, S.; Anand, S.C. Developments in medical textiles. Text. Prog. 2002, 32, 1–42. [Google Scholar] [CrossRef]
  13. Eriksson, S.; Sandsjö, L. Three-dimensional fabrics as medical textiles. In Advances in 3D Textiles; Xiaogang, C., Ed.; Woodhead Publishing: Soston, UK, 2015; pp. 305–340. [Google Scholar] [CrossRef]
  14. Khokar, N. 3D-weaving: Theory and practice. J. Text. Inst. 2001, 92, 193–207. [Google Scholar] [CrossRef]
  15. Bilisik, K. Three-dimensional axial braided preforms: Experimental determination of effects of structure-process parameters on unit cell. Text. Res. J. 2011, 81, 2095–2116. [Google Scholar] [CrossRef]
  16. Bilisik, K.; Sahbaz, N. Structure-unit cell-based approach on three-dimensional representative braided preforms from four-step braiding: Experimental determination of effects of structure-process parameters on predetermined yarn path. Text. Res. J. 2012, 82, 220–241. [Google Scholar] [CrossRef]
  17. Jiao, Y.; Li, C.; Liu, L.; Wang, F.; Liu, X.; Mao, J.; Wang, L. Construction and application of textile-based tissue engineering scaffolds: A review. Biomater. Sci. 2020, 8, 3574–3600. [Google Scholar] [CrossRef]
  18. Bilisik, K.; Karaduman, N.S.; Bilisik, N.E.; Bilisik, H.E. Three-dimensional circular various weave patterns in woven preform structures. Text. Res. J. 2014, 84, 638–654. [Google Scholar] [CrossRef]
  19. Bilisik, K.; Karaduman, N.S.; Bilisik, N.E.; Bilisik, H.E. Three-dimensional fully interlaced woven preforms for composites. Text. Res. J. 2013, 83, 2060–2084. [Google Scholar] [CrossRef]
  20. Jiang, C.; Wang, K.; Liu, Y.; Zhang, C.; Wang, B. Application of Textile Technology in Tissue Engineering: A review. Acta Biomater. 2021, 128, 60–76. [Google Scholar] [CrossRef] [PubMed]
  21. Mahadik, Y.; Hallett, S.R. Finite element modelling of tow geometry in 3D woven fabrics. Compos. Part A Appl. Sci. 2010, 41, 1192–1200. [Google Scholar] [CrossRef]
  22. Zeng, X.; Brown, L.P.; Endruweit, A.; Matveev, M.; Long, A.C. Geometrical modelling of 3D woven reinforcements for polymer composites: Prediction of fabric permeability and composite mechanical properties. Compos. Part A Appl. Sci. 2014, 56, 150–160. [Google Scholar] [CrossRef]
  23. Lin, H.; Zeng, X.; Sherburn, M.; Long, A.C.; Clifford, M.J. Automated geometric modelling of textile structures. Text. Res. J. 2012, 82, 1689–1702. [Google Scholar] [CrossRef]
  24. Potter, E.; Pinho, S.T.; Robinson, P.; Iannucci, L.; McMillan, A.J. Mesh generation and geometrical modelling of 3D woven composites with variable tow cross-sections. Comput. Mater. Sci. 2012, 51, 103–111. [Google Scholar] [CrossRef]
  25. Durville, D. Numerical simulation of entangled materials mechanical properties. J. Mater. Sci. 2005, 40, 5941–5948. [Google Scholar] [CrossRef]
  26. Wu, S.; Duan, B.; Qin, X.; Butcher, J.T. Living nano-micro fibrous woven fabric/hydrogel composite scaffolds for heart valve engineering. Acta Biomater. 2017, 51, 89–100. [Google Scholar] [CrossRef]
  27. Cao, Y.; Vacanti, J.P.; Paige, K.T.; Upton, J.; Vacanti, C.A. Transplantation of chondrocytes utilizing a polymer-cell construct to produce tissue-engineered cartilage in the shape of a human ear. Plast. Reconstr. Surg. 1997, 100, 297–302. [Google Scholar] [CrossRef]
  28. Wu, Y.; Wang, L.; Guo, B.; Ma, P.X. Interwoven aligned conductive nanofiber yarn/hydrogel composite scaffolds for engi-neered 3D cardiac anisotropy. ACS Nano 2017, 11, 5646–5659. [Google Scholar] [CrossRef]
  29. Little, C.J.; Bawolin, N.K.; Chen, X. Mechanical properties of natural cartilage and tissue-engineered constructs. Tissue Eng. Part B Rev. 2011, 17, 213–227. [Google Scholar] [CrossRef] [PubMed]
  30. Spiller, K.L.; Maher, S.A.; Lowman, A.M. Hydrogels for the repair of articular cartilage defects. Tissue Eng. Part B Rev. 2011, 17, 281–299. [Google Scholar] [CrossRef]
  31. Gulrez, S.K.; Al-Assaf, S.; Phillips, G.O. Hydrogels: Methods of preparation, characterisation and applications, In Progress in Molecular and Environmental Bioengineering—From Analysis and Modeling to Technology Applications; Carpi, A., Ed.; InTech: Rijeka, Croatia, 2011; pp. 117–150. [Google Scholar]
  32. Munirah, S.; Kim, S.H.; Ruszymah, B.H.; Khang, G. The use of fibrin and poly (lactic-co-glycolic acid) hybrid scaffold for articular cartilage tissue engineering: An in vivo analysis. Eur. Cell Mater. 2008, 15, 41–52. [Google Scholar] [CrossRef] [PubMed]
  33. Chen, G.; Sato, T.; Ushida, T.; Hirochika, R.; Shirasaki, Y.; Ochiai, N.; Tateishi, T. The use of a novel PLGA fiber/collagen composite web as a scaffold for engineering of articular cartilage tissue with adjustable thickness. J. Biomed. Mater. Res. Part A 2003, 67, 1170–1180. [Google Scholar] [CrossRef] [PubMed]
  34. Jain, R.A. The manufacturing techniques of various drug loaded biodegradable poly (lactide-co-glycolide)(PLGA) devic-es. Biomaterials 2000, 21, 2475–2490. [Google Scholar] [CrossRef] [PubMed]
  35. Asadi, N.; Alizadeh, E.; Salehi, R.; Khalandi, B.; Davaran, S.; Akbarzadeh, A. Nanocomposite hydrogels for cartilage tissue engineering: A review. Artif. Cells Nanomed. Biotechnol. 2018, 46, 465–471. [Google Scholar] [CrossRef] [PubMed]
  36. Azimi, B.; Nourpanah, P.; Rabiee, M.; Arbab, S. Poly (lactid -co-glycolide) fiber: An overview. J. Eng. Fibers Fabr. 2014, 9, 47–66. [Google Scholar]
  37. Moran, J.M.; Pazzano, D.; Bonassar, L.J. Characterization of polylactic acid–polyglycolic acid composites for cartilage tissue engineering. Tissue Eng. 2003, 9, 63–70. [Google Scholar] [CrossRef] [PubMed]
  38. Chu, C.R.; Coutts, R.D.; Yoshioka, M.; Harwood, F.L.; Monosov, A.Z.; Amiel, D. Articular cartilage repair using allogeneic perichondrocyteseeded biodegradable porous polylactic acid (PLA): A tissue-engineering study. J. Biomed. Mater. Res. 1995, 29, 1147–1154. [Google Scholar] [CrossRef] [PubMed]
  39. Athanasiou, K.A.; Agrawal, C.M.; Barber, F.A.; Burkhart, S.S. Orthopaedic applications for PLA-PGA biodegradable polymers. Arthrosc.-J. Arthrosc. Relat. Surg. 1998, 14, 726–737. [Google Scholar] [CrossRef]
  40. Lee, J.W.; Gardella, J.A. In vitro hydrolytic surface degradation of poly (glycolic acid): Role of the surface segregated amorphous region in the induction period of bulk erosion. Macromolecules 2001, 34, 3928–3937. [Google Scholar] [CrossRef]
  41. Ginde, R.M.; Gupta, R.K. In vitro chemical degradation of poly (glycolic acid) pellets and fibers. J. Appl. Polym. Sci. 1987, 33, 2411–2429. [Google Scholar] [CrossRef]
  42. Freed, L.E.; Vunjak-Novakovic, G.; Biron, R.J.; Eagles, D.B.; Lesnoy, D.C.; Barlow, S.K.; Langer, R. Biodegradable polymer scaffolds for tissue engineering. Biotechnology 1994, 12, 689–693. [Google Scholar] [CrossRef]
  43. Mooney, D.J.; Mazzoni, C.L.; Breuer, C.; McNamara, K.; Hern, D.; Vacanti, J.P.; Langer, R. Stabilized polyglycolic acid fibre-based tubes for tissue engineering. Biomaterials 1996, 17, 115–124. [Google Scholar] [CrossRef]
  44. Xiao, L.; Wang, B.; Yang, G.; Gauthier, M. Poly(Lactic Acid)-Based Biomaterials: Synthesis, Modification and Applications. In Biomedical Science, Engineering and Technology; InTech: London, UK, 2012. [Google Scholar]
  45. Croisier, F.; Jérôme, C. Chitosan-based biomaterials for tissue engineering. Eur. Polym. J. 2013, 49, 780–792. [Google Scholar] [CrossRef]
  46. Xia, W.; Liu, W.; Cui, L.; Liu, Y.; Zhong, W.; Liu, D.; Cao, Y. Tissue engineering of cartilage with the use of chitosan-gelatin complex scaffolds. J. Biomed. Mater. Res.-B Appl. Biomater. 2004, 71, 373–380. [Google Scholar] [CrossRef] [PubMed]
  47. Zhang, L.; Webster, T.J. Nanotechnology and nanomaterials: Promises for improved tissue regeneration. Nano Today 2009, 4, 66–80. [Google Scholar] [CrossRef]
  48. Liao, S.; Chan, C.K.; Ramakrishna, S. Stem cells and biomimetic materials strategies for tissue engineering. Mater. Sci. Eng. C 2008, 28, 1189–1202. [Google Scholar] [CrossRef]
  49. Yang, Q.; Peng, J.; Guo, Q.; Huang, J.; Zhang, L.; Yao, J.; Yang, F.; Wang, S.; Xu, W.; Wang, A.; et al. A cartilage ECM-derived 3-D porous acellular matrix scaffold for in vivo cartilage tissue engineering with PKH26-labeled chondrogenic bone marrow-derived mesenchymal stem cells. Biomaterials 2008, 29, 2378–2387. [Google Scholar] [CrossRef]
  50. Vacanti, J.P.; Vacanti, C.A. The history and scope of tissue engineering. In Principles of Tissue Engineering, 4th ed.; Elsevier Inc.: Amsterdam, The Netherlands; Imprint in Academic Press: Cambridge, MA, USA, 2014; pp. 3–8. [Google Scholar] [CrossRef]
  51. West, J.L.; Hubbell, J.A. Polymeric biomaterials with degradation sites for proteases involved in cell migration. Macromolecules 1999, 32, 241–244. [Google Scholar] [CrossRef]
  52. Stachowiak, A. Principles and Practice of Tissue Engineering; MIT OpenCourseWare, 20.109 Spring 2010; Module3, Lecture 1; Massachusetts Institute of Technology: Cambridge, MA, USA, 2010. [Google Scholar]
  53. Stachowiak, A.N.; Wang, Y.; Huang, Y.C.; Irvine, D.J. Homeostatic lymphoid chemokines synergize with adhesion ligands to trigger T and B lymphocyte chemokinesis. J. Immunol. 2006, 177, 2340–2348. [Google Scholar] [CrossRef]
  54. Rosenberg, S.A.; Yang, J.C.; Restifo, N.P. Cancer immunotherapy: Moving beyond current vaccines. Nat. Med. 2004, 10, 909–915. [Google Scholar] [CrossRef]
  55. Şeker, Ş.; Elçin, A.E.; Elçin, Y.M. Advances in Regenerative Medicine and Biomaterials. In Gene, Drug, and Tissue Engineering; Pereira, G.C., Ed.; Methods in Molecular Biology; Humana: New York, NY, USA, 2013; Volume 2575. [Google Scholar] [CrossRef]
  56. Yang, W.; Yang, F.; Wang, Y.; Both, S.K.; Jansen, J.A. In vivo bone generation via the endochondral pathway on three-dimensional electrospun fibers. Acta Biomater. 2013, 9, 4505–4512. [Google Scholar] [CrossRef]
  57. Li, W.-J.; Shanti, R.M.; Tuan, R.S. Electrospinning Technology for Nanofibrous Scaffolds in Tissue Engineering. In Nanotechnologies for the Life Sciences; Wiley-VCH Verlag GmbH & Co. KGaA: Weinheim, Germany, 2006; p. 9. [Google Scholar]
  58. Langer, R.; Vacanti, J.P. Tissue engineering. Science 1993, 260, 920–926. [Google Scholar] [CrossRef] [PubMed]
  59. Amiri, S.; Bagher, Z.; Sene, A.A.; Aflatoonian, R.; Mehdizadeh, M.; Milan, P.B.; Ghazizadeh, L.; Ashrafi, M.; Amjadi, F. Evaluation of polyglycolic acid as an animal-free biomaterial for three-dimensional culture of human endometrial cells. Clin. Exp. Reprod. Med. 2022, 49, 259–269. [Google Scholar] [CrossRef] [PubMed]
  60. Matai, I.; Kaur, G.; Seyedsalehi, A.; McClinton, A.; Laurencin, C.T. Progress in 3D bioprinting technology for tissue/organ regenerative engineering. Biomaterials 2020, 226, 119536. [Google Scholar] [CrossRef] [PubMed]
  61. Dzobo, K.; Thomford, N.E.; Senthebane, D.A.; Shipanga, H.; Rowe, A.; Dandara, C.; Pillay, M.; Motaung, K.S.C.M. Advances in Regenerative Medicine and Tissue Engineering: Innovation and Transformation of Medicine. Stem Cells Int. 2018, 2018, 2495848. [Google Scholar] [CrossRef] [PubMed]
  62. Parihar, A.; Pandita, V.; Kumar, A.; Parihar, D.S.; Puranik, N.; Bajpai, T.; Khan, R. 3D printing: Advancement in biogenerative engineering to combat shortage of organs and bioapplicable materials. Regen. Eng. Transl. Med. 2021, 8, 173–199. [Google Scholar] [CrossRef] [PubMed]
  63. Sherwood, J.K.; Riley, S.L.; Palazzolo, R.; Brown, S.C.; Monkhouse, D.C.; Coates, M.; Griffith, L.G.; Landeen, L.K.; Ratcliffe, A. A three-dimensional osteochondral composite scaffold for articular cartilage repair. Biomaterials 2002, 23, 4739–4751. [Google Scholar] [CrossRef]
  64. Vellayappan, M.V.; Jaganathan, S.K.; Supriyanto, E. Review: Unraveling the less explored flocking technology for tissue engineering scaffolds. RSC Adv. 2015, 5, 73225–73240. [Google Scholar] [CrossRef]
  65. Nuernberger, S.; Cyran, N.; Albrecht, C.; Redl, H.; Vécsei, V.; Marlovits, S. The influence of scaffold architecture on chondrocyte distribution and behavior in matrix-associated chondrocyte transplantation grafts. Biomaterials 2011, 32, 1032–1040. [Google Scholar] [CrossRef]
  66. Simon, J.L.; Roy, T.D.; Parsons, J.R.; Rekow, E.D.; Thompson, V.P.; Kemnitzer, J.; Ricci, J.L. Engineered cellular response to scaffold architecture in a rabbit trephine defect. J. Biomed. Mater. Res. Part A 2003, 66, 275–282. [Google Scholar] [CrossRef]
  67. Woodfield, T.B.F.; Blitterswijk, C.V.; Wijn, J.D.; Sims, T.J.; Hollander, A.P.; Riesle, J. Polymer scaffolds fabricated with pore-size gradients as a model for studying the zonal organization within tissue-engineered cartilage constructs. Tissue Eng. 2005, 11, 1297–1311. [Google Scholar] [CrossRef]
  68. Mandal, B.B.; Kundu, S.C. Cell proliferation and migration in silk fibroin 3D scaffolds. Biomaterials 2009, 30, 2956–2965. [Google Scholar] [CrossRef]
  69. Kim, U.J.; Park, J.; Kim, H.J.; Wada, M.; Kaplan, D.L. Three-dimensional aqueous-derived biomaterial scaffolds from silk fibroin. Biomaterials 2005, 26, 2775–2785. [Google Scholar] [CrossRef]
  70. Zein, I.; Hutmacher, D.W.; Tan, K.C.; Teoh, S.H. Fused deposition modeling of novel scaffold architectures for tissue engi-neering applications. Biomaterials 2002, 23, 1169–1185. [Google Scholar] [CrossRef]
  71. Murphy, C.M.; Haugh, M.G.; O’brien, F.J. The effect of mean pore size on cell attachment, proliferation and migration in collagen–glycosaminoglycan scaffolds for bone tissue engineering. Biomaterials 2010, 31, 461–466. [Google Scholar] [CrossRef]
  72. Kock, L.; van Donkelaar, C.C.; Ito, K. Tissue engineering of functional articular cartilage: The current status. Cell Tissue Res. 2012, 347, 613–627. [Google Scholar] [CrossRef] [PubMed]
  73. Ikada, Y. Challenges in tissue engineering. J. R. Soc. Interface 2006, 3, 589–601. [Google Scholar] [CrossRef]
  74. Kim, B.S.; Mooney, D.J. Development of biocompatible synthetic extracellular matrices for tissue engineering. Trends Biotechnol. 1998, 16, 224–230. [Google Scholar] [CrossRef]
  75. Hannes Welsch, G.; Mamisch, T.C.; Zak, L.; Blanke, M.; Olk, A.; Marlovits, S.; Trattnig, S. Evaluation of cartilage repair tissue after matrix-associated autologous chondrocyte transplantation using a hyaluronic-based or a collagen-based scaffold with morphological mocart scoring and biochemical T2 mapping: Preliminary results. Am. J. Sports Med. 2010, 38, 934–942. [Google Scholar] [CrossRef] [PubMed]
  76. Stenhamre, H.; Nannmark, U.; Lindahl, A.; Gatenholm, P.; Brittberg, M. Influence of pore size on the redifferentiation potential of human articular chondrocytes in poly (urethane urea) scaffolds. J. Tissue Eng. Regen. Med. 2011, 5, 578–588. [Google Scholar] [CrossRef]
  77. Mygind, T.; Stiehler, M.; Baatrup, A.; Li, H.; Zou, X.; Flyvbjerg, A.; Kassem, M.; Bünger, C. Mesenchymal stem cell ingrowth and differentiation on coralline hydroxyapatite scaffolds. Biomaterials 2007, 28, 1036–1047. [Google Scholar] [CrossRef] [PubMed]
  78. Lien, S.M.; Ko, L.Y.; Huang, T.J. Effect of pore size on ECM secretion and cell growth in gelatin scaffold for articular cartilage tissue engineering. Acta Biomater. 2009, 5, 670–679. [Google Scholar] [CrossRef]
  79. Kelly, D.J.; Prendergast, P.J. Prediction of the optimal mechanical properties for a scaffold used in osteochondral defect repair. Tissue Eng. 2006, 12, 2509–2519. [Google Scholar] [CrossRef]
  80. Genes, N.G.; Rowley, J.A.; Mooney, D.J.; Bonassar, L.J. Effect of substrate mechanics on chondrocyte adhesion to modified alginate surfaces. Arch. Biochem. Biophys. 2004, 422, 161–167. [Google Scholar] [CrossRef]
  81. Whang, K.; Healy, K.E.; Elenz, D.R.; Nam, E.K.; Tsai, D.C.; Thomas, C.H.; Nuber, G.W.; Glorieux, F.H.; Travers, R.; Sprague, S.M. Engineering bone regeneration with bioabsorbable scaffolds with novel microarchitecture. Tissue Eng. 1999, 5, 35–51. [Google Scholar] [CrossRef] [PubMed]
  82. Leong, K.F.; Chua, S.C.; Sudarmadji, N.; Yeong, W.Y. Engineering functionally graded tissue engineering scaffolds. J. Mech. Behav. Biomed. Mater. 2008, 1, 140–152. [Google Scholar] [CrossRef]
  83. Karageorgiou, V.; Kaplan, D. Porosity of 3D biomaterial scaffolds and osteogenesis. Biomaterials 2005, 26, 5474–5491. [Google Scholar] [CrossRef] [PubMed]
  84. Muschler, G.F.; Nakamoto, C.; Griffith, L.G. Engineering principles of clinical cell-based tissue engineering. J. Bone Jt. Surg. 2004, 86, 1541–1558. [Google Scholar] [CrossRef] [PubMed]
  85. Tsuruga, E.; Takita, H.; Itoh, H.; Wakisaka, Y.; Kuboki, Y. Pore size of porous hydroxyapatite as the cell-substratum controls BMP-induced osteogenesis. J. Biochem. 1997, 121, 317–324. [Google Scholar] [CrossRef]
  86. Singh, H.; Teoh, S.H.; Low, H.T.; Hutmacher, D.W. Flow modelling within a scaffold under the influence of uni-axial and bi-axial bioreactor rotation. J. Biotechnol. 2005, 119, 181–196. [Google Scholar] [CrossRef]
  87. Zeltinger, J.; Sherwood, J.K.; Graham, D.A.; Müeller, R.; Griffith, L.G. Effect of pore size and void fraction on cellular adhesion, proliferation, and matrix deposition. Tissue Eng. 2001, 7, 557–572. [Google Scholar] [CrossRef]
  88. Olivares, A.L.; Marsal, È.; Planell, J.A.; Lacroix, D. Finite element study of scaffold architecture design and culture conditions for tissue engineering. Biomaterials 2009, 30, 6142–6149. [Google Scholar] [CrossRef]
  89. Jeong, C.G.; Hollister, S.J. Mechanical and biochemical assessments of three-dimensional poly (1, 8-octanediol-co-citrate) scaffold pore shape and permeability effects on in vitro chondrogenesis using primary chondrocytes. Tissue Eng. Part A 2010, 16, 3759–3768. [Google Scholar] [CrossRef]
  90. Moutos, F.T.; Freed, L.E.; Guilak, F. A biomimetic three-dimensional woven composite scaffold for functional tissue engi-neering of cartilage. Nat. Mater. 2007, 6, 162–167. [Google Scholar] [CrossRef]
  91. Bilisik, K. Multiaxis 3D woven preform and properties of multiaxis 3D woven and 3D orthogonal woven carbon/epoxy composites. J. Reinf. Plast. Compos. 2010, 29, 1173–1186. [Google Scholar] [CrossRef]
  92. Ansar, M.; Wang, X.; Zhou, C. Modeling strategies of 3D woven composites: A review. Compos. Struct. 2011, 93, 1947–1963. [Google Scholar] [CrossRef]
  93. Labanieh, A.R.; Legrand, X.; Koncar, V.; Soulat, D. Novel optimization method to estimate the geometrical properties of a multiaxial 3D woven preform. J. Reinf. Plast. Compos. 2013, 32, 700–712. [Google Scholar] [CrossRef]
  94. Midani, M.; Seyam, A.F.; Saleh, M.N.; Pankow, M. The effect of the through-thickness yarn component on the in-and out-of-plane properties of composites from 3D orthogonal woven preforms. J. Text. Inst. 2019, 110, 317–327. [Google Scholar] [CrossRef]
  95. Green, S.D.; Matveev, M.Y.; Long, A.C.; Ivanov, D.; Hallett, S.R. Mechanical modelling of 3D woven composites considering realistic unit cell geometry. Compos. Struct. 2014, 118, 284–293. [Google Scholar] [CrossRef]
  96. Lu, L.; Mikos, A.G. The importance of new processing techniques in tissue engineering. MRS Bull. 1996, 21, 28–32. [Google Scholar] [CrossRef]
  97. Suture Material & Biomaterial. Available online: https://www.meta-biomed.com/product/suture/overview.php (accessed on 17 December 2022).
  98. Van de Velde, K.; Kiekens, P. Biopolymers: Overview of several properties and consequences on their applica-tions. Polym. Test. 2002, 21, 433–442. [Google Scholar] [CrossRef]
  99. Yildirim, H.K. Development of Biodegradable Three Dimensional (3D) Woven Preform Structures for Artificial Organs. Ph.D. Thesis, Graduate School of Natural and Applied Sciences, Erciyes University, Talas-Kayseri, Turkey, 2022. (In Turkish, Abstract: English). [Google Scholar]
  100. ASTM Standards. D3171-99; Standard Test Methods for Constituent Content of Composite Materials. ASTM International: West Conshohocken, PA, USA, 1991.
  101. ASTM Standards. D2734-91; Standard Test Methods for Void Content of Reinforced Plastics. ASTM International: West Conshohocken, PA, USA, 1991.
  102. ISO Standarts. ISO 139; Textiles-Standard Atmospheres for Conditioning and Testing. International Organization for Standardization: Geneva, Switzerland, 2005.
  103. Grosberg, P. The Tensile Properties of Woven Fabric. In Structural Mechanism of Fiber, Yarns and Fabrics; Hearl, J.W.S., Grosberg, P., Backer, S., Eds.; Wiley-Interscience: Hoboken, NJ, USA, 1969. [Google Scholar]
  104. Sherburn, M. Geometric and Mechanical Modelling of Textiles. Ph.D. Thesis, University of Nottingham, Nottingham, UK, 2007. [Google Scholar]
  105. Lin, H.; Brown, L.P.; Long, A.C. Modelling and Simulating Textile Structures Using TexGen. Adv. Mater. Res. 2011, 331, 44–47. [Google Scholar] [CrossRef]
  106. Long, A.; Brown, L. Modelling the geometry of textile reinforcements for composites: Texgen. In Composite Reinforcements for Optimum Performance; Woodhead Publishing Ltd.: Cambridge, UK, 2011; pp. 239–264. [Google Scholar]
  107. Brown, L.P.; Endruweit, A.; Long, A.; Jones, I.A. Characterisation and modelling of complex textile geometries using TexGen. In Proceedings of the IOP Conference Series: Materials Science and Engineering, Milan, Italy, 17–19 September 2018; Volume 406, p. 012024. [Google Scholar]
  108. Brown, L.; Matveev, M.; Spackman, G. Louisepb/TexGen: TexGen v3.12.1 (Version v3.12.1). Zenodo. Available online: https://zenodo.org/record/4537855 (accessed on 12 February 2021).
  109. Jones, R.M. (Ed.) Micromechanical behavior of a lamina. In Mechanics of Composite Materials, 2nd ed.; Taylor & Francis: Boca Raton, FL, USA, 1999; pp. 121–135. [Google Scholar]
  110. Tavafoghi, M.; Sheikhi, A.; Tutar, R.; Jahangiry, J.; Baidya, A.; Haghniaz, R.; Khademhosseini, A. Engineering tough, injectable, naturally derived, bioadhesive composite hydrogels. Adv. Health Mater. 2020, 9, 1901722. [Google Scholar] [CrossRef] [PubMed]
  111. Elliott, D.M.; Guilak, F.; Vail, T.P.; Wang, J.Y.; Setton, L.A. Tensile properties of articular cartilage are altered by meniscectomy in a canine model of osteoarthritis. J. Orthop. Res. 1999, 17, 503–508. [Google Scholar] [CrossRef]
  112. Takigawa, T.; Morino, Y.; Urayama, K.; Masuda, T. Poisson’s ratio of polyacrylamide (PAAm) gels. Polym. Gels Netw. 1996, 4, 1–5. [Google Scholar] [CrossRef]
  113. Yue, K.; Trujillo-de Santiago, G.; Alvarez, M.M.; Tamayol, A.; Annabi, N.; Khademhosseini, A. Synthesis, properties, and biomedical applications of gelatin methacryloyl (GelMA) hydrogels. Biomaterials 2015, 73, 254–271. [Google Scholar] [CrossRef]
  114. Zhu, W.; Mow, V.C.; Koob, T.J.; Eyre, D.R. Viscoelastic shear properties of articular cartilage and the effects of glycosidase treatments. J. Orthop. Res. 1993, 11, 771–781. [Google Scholar] [CrossRef] [PubMed]
Figure 1. Three-dimensional plain (3DW-P-ZP) preform scaffold and textile bonding steps incorporated with schematic unit cell (TexGen) during formation via an experimental rig (digital image).
Polymers 15 02083 g001
Figure 2. Three-dimensional semi-interlaced (3DW-P-ZO) preform scaffold and textile bonding steps incorporated with schematic unit cell (TexGen) during formation via an experimental rig (digital image).
Polymers 15 02083 g002
Figure 3. Three-dimensional orthogonal (3DW-O-ZO) preform scaffold and textile bonding steps incorporated with schematic unit cell (TexGen) during formation via an experimental rig (digital image).
Polymers 15 02083 g003
Figure 4. Three-dimensional woven preform unit cells. (a1a4) 3D plain (3DW-P-ZP) with schematic unit cell (TexGen), top, side, and cross-section of microstructure images (optical microscope, ×6.7), respectively; (b1b4) 3D semi-interlaced (3DW-P-ZO) with schematic unit cell (TexGen), top, side, and cross-section of microstructure images (optical microscope, ×6.7), respectively; (c1c4) 3D orthogonal (3DW-O-ZO) with schematic unit cell (TexGen), top, side, and cross-section of microstructure images (optical microscope, ×6.7).
Polymers 15 02083 g004
Figure 5. (a) Yarn-to-yarn space in the top of the 3D PGA fiber woven preform structures; (b) density in the top of all 3D woven preform structures, and (c) areal density of all 3D woven preform structures.
Polymers 15 02083 g005
Figure 6. (a) Angle of the warp along the length and angle of the z-yarns along the width of the 3D preform structures; (b) angle of weft and z-yarns along the length of the 3D PGA fiber preform structure.
Polymers 15 02083 g006
Figure 7. (a) Directional crimp of all 3D PGA fiber woven preform structure; (b) yarn lengths in the 3D PGA fiber woven preforms; (c) z-yarn length in the 3D PGA fiber woven preforms.
Polymers 15 02083 g007
Figure 8. (a) Measured fiber volume fractions (%) and (b) fiber porosity fractions (%) of all 3D PGA fiber woven preform structures.
Polymers 15 02083 g008
Figure 9. (a) Directional and total fiber volume fraction (%) and (b) directional and total fiber porosity (%) fractions of all 3D woven preform received from analytic relations.
Polymers 15 02083 g009
Figure 10. (a) Directional and total fiber volume fraction (%) and (b) directional and total fiber porosity (%) fractions of all 3D woven preform received from the numerical model (TexGen).
Polymers 15 02083 g010
Figure 11. Directional and total fiber volume fractions of all 3D woven preform structures from measured data, analytic relations, and numerical model (TexGen).
Polymers 15 02083 g011
Figure 12. Directional and total preform stiffness and tensile strengths of all 3D PGA fiber preform scaffold from measured values, analytical model, and FE model (TexGen).
Polymers 15 02083 g012
Figure 13. Tensile and shear modulus of all 3D PGA fiber preform scaffold from measured values, analytical model, and FE model (TexGen).
Polymers 15 02083 g013
Figure 14. Optical image and schematic view of 3D plain preform architecture (optical microscope image, ×6.7, TexGen). (a) Meso-scale 3D preform view along filling direction (optical microscope image, ×6.7, TexGen); (b) meso-scale 3D preform view along warp direction (optical microscope image, ×6.7, TexGen); and (c) meso-scale 3D preform view on the top (optical microscope image, ×6.7, TexGen).
Polymers 15 02083 g014
Figure 15. Optical image and schematic view of 3D semi-interlaced preform architecture (optical microscope image, ×6.7, TexGen). (a) Meso-scale 3D semi-interlaced preform view along filling direction (optical microscope image, ×6.7, TexGen); (b) meso-scale 3D preform view along warp direction (optical microscope image, ×6.7, TexGen); and (c) meso-scale 3D preform view on the top (optical microscope image, ×6.7, TexGen).
Polymers 15 02083 g015
Figure 16. Optical image and schematic view of 3D orthogonal preform architecture (optical microscope image, ×6.7, TexGen). (a) Meso-scale 3D orthogonal preform view along filling (optical microscope image, ×6.7, TexGen); (b) meso-scale 3D orthogonal preform view along the warp (optical microscope image, ×6.7, TexGen); and (c) meso-scale 3D orthogonal preform view on the top (optical microscope image, ×6.7, TexGen).
Polymers 15 02083 g016
Table 1. Specifications of biodegradable PGA filament and yarn forms.
Fiber TypeFiber Diameter
(μm)
Fiber Density
(g/cm3)
Tensile Strength
(MPa)
Tensile Modulus
(GPa)
Elongation at Break
(%)
Yarn Linear Density
(Tex, Denier)
Yarn Dimension
(Width × Thickness)
(50 Ends, mm)
Degradation Time
(Month)
Polyglycolic acid (PGA, Meta Biomed Inc., Cheongju, Ch‘ungch‘ong-bukto, Republic of Korea)13.70
[97]
1.50
[97]
60–99.70
[98]
6–7
[98]
1.50–20
[98]
6.22 (56)
[97]
1.50 × 0.606–12
[97]
Table 2. Fiber volume fraction equations for 3D plain woven preform.
Volume Fraction Formulae for 3D Plain PreformEquation NumberExplanation
V f w = V w V p V f w = [ N M ( T d f + ( T + 1 ) d z ) ( 1 + C w ) ( π   d w 2 4 ) ] [ ( M d w + ( M + 1 ) d z ) ( N d w + N d f ) ( T d f + ( T + 1 ) d z ) ]   (8)Warp volume percent in preform
V f f   = V f V p V f f   = [ T N ( M d w + M d z ) ( 1 + C f ) ( π   d f 2 4 ) ]   [ ( M d w + ( M + 1 ) d z ) ( N d w + N d f ) ( T d f + ( T + 1 ) d z ) ] (9)Filling volume percent in preform
V f z   = V z V p V f z   = [ T M ( N d w + N d f + 1 d z ) ( 1 + C z ) ( π   d z 2 4 ) ] [ ( M d w + ( M + 1 ) d z ) ( N d w + N d f ) ( T d f + ( T + 1 ) d z ) ]   (10)Z-fiber volume percent in preform
V f p = V f w + V f f + V f z   V f p = V w + V f + V z V p     (11)Preform volume percent
V t p r = 1 V f p V t p r = 1 V f p (12)Porosity percent in preform
Where Vp is the unit cell volume; N is the total number of warp yarns per row; M is the total number of warp yarns per column; T is the weft density number in the unit cell; dw is the warp yarn diameter; df is the weft yarn diameter; dz is the z-yarn diameter; Cw is warp yarn crimp; Cf is weft yarn crimp; Cz is z-yarn crimp; Vw is the warp yarn volume in the unit cell; Vf is the weft yarn volume in the unit cell; Vz is the z-yarn volume in the unit cell; Vfw is the warp yarn volume ratio; Vff is the weft yarn volume ratio; Vfz is the z-yarn volume ratio and Vfp is the total volume ratio and Vtpr is the porosity volume ratio.
Table 3. Fiber volume fraction equations for 3D semi-interlaced woven preform.
Volume Fraction Formulae for 3D Semi-Interlaced PreformEquation NumberExplanation
V f w = V w V p V f w = [ N M ( T d f + ( T + 1 ) d z ) ( 1 + C w ) ( π   d w 2 4 ) ] [ ( M d w + ( M + 1 ) d z ) ( N d w + N d f ) ( T d f + ( T + 1 ) d z ) ]   (13)Warp volume percent in preform
V f f   = V f V p V f f   = [ T N ( M d w + M d z ) ( 1 + C f ) ( π   d f 2 4 ) ] [ ( M d w + ( M + 1 ) d z ) ( N d w + N d f ) ( T d f + ( T + 1 ) d z ) ]     (14)Filling volume percent in preform
V f z   = V z V p V f z   = [ T M ( N d w + N d f + 1 d z ) ( π   d z 2 4 ) ] [ ( M d w + ( M + 1 ) d z ) ( N d w + N d f ) ( T d f + ( T + 1 ) d z ) ]     (15)Z-fiber volume percent in preform
Table 4. Fiber volume fraction equations for 3D orthogonal woven preform.
Volume Fraction Formulae for 3D Orthogonal PreformEquation NumberExplanation
V f w = V w V p V f w = [ ( N M T d f + ( T + 1 ) d z ) ( π   d w 2 4 ) ] [ ( M d w + ( M + 1 ) d z ) ( N d w + ( N + 1 ) d f ) ( T d f + ( T + 1 ) d z ) ]   (16)Warp volume percent in preform
V f f   = V f V p V f f = [ ( T ( N + 1 ) ( M d w + M d z ) )   ( π   d f 2 4 ) ] [ ( M d w + ( M + 1 ) d z ) ( N d w + ( N + 1 ) d f ) ( T d f + ( T + 1 ) d z ) ]   (17)Filling volume percent in preform
V f z   = V z V p V f z = [ ( T M ( N d w + ( N + 1 ) d f + d z ) ) ( π   d z 2 4 ) ] [ ( M d w + ( M + 1 ) d z ) ( N d w + ( N + 1 ) d f ) ( T d f + ( T + 1 ) d z ) ]   (18)Z-fiber volume percent in preform
Table 5. Yarn-to-yarn space, density, and angles of all 3D PGA fiber woven preform structures.
Yarn-to-Yarn Space
Preform StructureLayer NumberTotal Yarn NumberStructureYarn–Yarn Distance
(Top × Side × Cross-Section)
Warp
(N × M)
Filling
(N + 1, N)
Z-Yarn
(M + 1)
Width × Thickness
(Sw × St, mm)
Warp-Warp
(mm)
Filling-Filling
(mm)
Z-Yarn-Z-Yarn
(mm)
3DW-O-ZO66 × 207 × 11 × 2128.00 × 5.661 × 0.5 × 13 × 7 × 0.31 × 6 × 1
3DW-P-ZO6 × 206 × 11 × 2120.30 × 3.991 × 1 × 18 × 8 × 11 × 10 × 1
3DW-P-ZP6 × 206 × 11 × 2027.66 × 4.001 × 0.8 × 15 × 5 × 0.31 × 11 × 1
Density
Preform StructureLayer NumberTotal Yarn NumberStructurePreform Density
(Top × Side × Cross-Section)
Preform Areal Density
(g/cm3)
Warp
(N × M)
Filling
(N + 1, N)
z-yarn
(M + 1)
Length × Width × Thickness
(Sl × Sw × St, mm)
Warp
(ends/10 mm)
Filling
(ends/10 mm)
Z-yarn
(ends/10 mm)
3DW-O-ZO66 × 207 × 11 × 21100 × 28.00 × 5.668 × – × 84 × 4 × –6 × 2 × 60.55 ± 0.10
3DW-P-ZO6 × 206 × 11 × 21125 × 20.30 × 3.999 × – × 92 × 2 × –9 × 1 × 90.73 ± 0.10
3DW-P-ZP6 × 206 × 11 × 20100 × 27.66 × 4.009 × – × –2 × 2 × –8 × 1 × 80.74 ± 0.10
Angles
Preform StructureLayer NumberTotal Yarn NumberWarp AngleFilling AngleZ-Yarn Angle
WarpFillingz-yarnwc°)–(θwm°)ws°)fc°)fm°)–(θfs°)zc°)zm°)zs°)
3DW-O-ZO66 × 207 × 11 × 210–029 ± 14.50900–907090 ± 5.770
3DW-P-ZO6 × 206 × 11 × 210–00900–904090 ± 5.770
3DW-P-ZP6 × 206 × 11 × 20* −7515 ± 14.50130–904080 ± 5.7710 ± 5.77
* It could not measure.
Table 6. Crimp and fiber length measurements of all 3D PGA fiber woven preforms.
Crimp
Preform StructureLayer Number Uncrimp Yarn LengthStructureCrimp
Warp
(lw, mm)
Filling
(lf, mm)
Z-Yarn
(lzt, mm)
Length
(Sl, mm)
Width
(Sw, mm)
Thickness
(St, mm)
Warp
(Cw, %)
Filling
(Cf, %)
Z-Yarn
(Cz, %)
3DW-O-ZO65130750286.362.00 ± 1.757.14 ± 3.5710.06 ± 20.06
3DW-P-ZO3020829186.003.44 ± 1.7511.11 ± 3.5733.33 ± 20.06
3DW-P-ZP382415362310.005.55 ± 1.7514.28 ± 3.5750.00 ± 20.06
Yarn Length
Preform StructureLayer NumberTotal Yarn NumberUncrimp Warp Length
(lw,mm)
Uncrimp Filling Length
(lf, mm)
Uncrimp Z-Yarn Length
WarpFillingZ-YarnZ-Yarn Arc Length
(lza, mm)
Z-Yarn Length
(lz, mm)
Total Z-Yarn Length
(lzt, mm)
3DW-O-ZO66 × 207 × 11 × 2115146.3466.3612.36
3DW-P-ZO6 × 206 × 11 × 2114040.30103.9913.99
3DW-P-ZP6 × 206 × 11 × 2011447.66512.5017.50
Table 7. Fiber volume fractions based on measured values, analytic modeling, and FE model (TexGen) of all 3D PGA fiber woven preforms.
Fiber Volume Fraction (%)3D PGA Fiber Woven Preform Structures
3DW-O-ZO3DW-P-ZO3DW-P-ZP
Measured values
Warp directional fiber volume fraction (Vfw)20.06 ± 4.1530.24 ± 4.1524.87 ± 4.15
Weft directional fiber volume fraction (Vff)7.03 ± 2.939.71 ± 2.9314.15 ± 2.93
Z-directional fiber volume fraction (Vfz)9.55 ± 0.838.03 ± 0.839.96 ± 0.83
Warp directional porosity (Vwpr)21.11 ± 2.3717.11 ± 2.3716.89 ± 2.37
Weft directional porosity (Vfpr)21.11 ± 2.3717.11 ± 2.3716.89 ± 2.37
Z-directional porosity (Vzpr)21.11 ± 2.3717.11 ± 2.3716.89 ± 2.37
Total preform scaffold fiber volume fraction (Vfp)36.66 ± 7.1248.66 ± 7.1249.33 ± 7.12
Total preform scaffold porosity fraction (Vtpr)63.34 ± 7.1251.34 ± 7.1250.67 ± 7.12
Analytical model
Warp directional fiber volume fraction (Vfw)17.67 ± 1.3219.72 ± 1.3217.23 ± 1.32
Weft directional fiber volume fraction (Vff)13.09 ± 0.9314.17 ± 0.9314.96 ± 0.93
Z-directional fiber volume fraction (Vfz)18.32 ± 9.723.19 ± 9.7221.33 ± 9.72
Warp directional porosity (Vwpr)16.97 ± 2.8320.97 ± 2.8315.49 ± 2.83
Weft directional porosity (Vfpr)16.97 ± 2.8320.97 ± 2.8315.49 ± 2.83
Z-directional porosity (Vzpr)16.97 ± 2.8320.97 ± 2.8315.49 ± 2.83
Total preform scaffold fiber volume fraction (Vfp)49.08 ± 8.5037.08 ± 8.5053.52 ± 8.50
Total preform scaffold porosity (Vtpr)50.92 ± 8.5062.92 ± 8.5046.48 ± 8.50
TexGen model
Warp directional fiber volume fraction (Vfw)20.00 ± 5.8522.00 ± 5.8531.00 ± 5.85
Weft directional fiber volume fraction (Vff)14.00 ± 4.605.00 ± 4.6011.20 ± 4.60
Z-directional fiber volume fraction (Vfz)7.00 ± 1.157.00 ± 1.155.00 ± 1.15
Warp directional porosity (Vwpr)19.66 ± 2.5122.66 ± 2.5117.66 ± 2.51
Weft directional porosity (Vfpr)19.66 ± 2.5122.66 ± 2.5117.66 ± 2.51
Z-directional porosity (Vzpr)19.66 ± 2.5122.66 ± 2.5117.66 ± 2.51
Total preform scaffold fiber volume fraction (Vfp)41.00 ± 6.5034.00 ± 6.5047.00 ± 6.50
Total preform scaffold porosity (Vtpr)59.00 ± 6.5068.00 ± 6.5053.00 ± 6.50
Table 8. Stiffness and strengths of 3D PGA fiber preform scaffolds based on measured values, analytical model, and numerical models (TexGen).
Fiber Volume FractionsPreform StructureTensile Modulus
(GPa)
Shear Modulus
(GPa)
Ewarp
(E11)
Efilling
(E22)
Ez-yarn
(E33)
EpGwarp-filling
(G12)
Gfilling-z-yarn
(G23)
Gz-yarn-warp
(G13)
Gp
Measured 3DW-O-ZO1.30 ± 0.270.46 ± 0.190.62 ± 0.052.38 ± 0.340.480.170.230.88 ± 0.12
3DW-P-ZO1.97 ± 0.270.63 ± 0.190.52 ± 0.053.16 ± 0.410.730.230.191.17 ± 0.15
3DW-P-ZP1.62 ± 0.270.92 ± 0.190.65 ± 0.053.21 ± 0.180.600.340.241.19 ± 0.07
Analytical model3DW-O-ZO1.15 ± 0.070.85 ± 0.051.19 ± 0.523.19 ± 0.340.430.320.441.18 ± 0.12
3DW-P-ZO1.28 ± 0.070.92 ± 0.050.21 ± 0.522.41 ± 0.410.480.340.100.89 ± 0.15
3DW-P-ZP1.12 ± 0.070.97 ± 0.051.39 ± 0.523.48 ± 0.180.420.360.511.29 ± 0.07
FE model (TexGen)3DW-O-ZO1.30 ± 0.310.91 ± 0.240.46 ± 0.062.66 ± 0.340.480.340.170.99 ± 0.12
3DW-P-ZO1.43 ± 0.310.33 ± 0.240.46 ± 0.062.21 ± 0.410.530.120.170.82 ± 0.15
3DW-P-ZP2.02 ± 0.310.73 ± 0.240.33 ± 0.063.06 ± 0.180.750.270.121.13 ± 0.07
Fiber Volume FractionsPreform StructurePoisson RatiosTensile Strengths
(MPa)
νwarp-filling
ν12
νfilling-z-yarn
ν23
νz-yarn-warp
ν13
νpσwarp
σ11
σfilling
σ22
σz-yarn
σ33
σps
Measured 3DW-O-ZO0.440.450.450.4216.04 ± 3.325.64 ± 2.347.65 ± 0.6629.29 ± 4.11
3DW-P-ZO0.430.450.450.4124.16 ± 3.327.78 ± 2.346.44 ± 0.6638.87 ± 5.04
3DW-P-ZP0.430.440.450.4019.88 ± 3.3211.32 ± 2.347.98 ± 0.6639.40 ± 2.15
Analytical model3DW-O-ZO0.440.440.440.4014.13 ± 0.8710.47 ± 0.6114.65 ± 6.3439.20 ± 4.11
3DW-P-ZO0.440.440.450.4215.77 ± 0.8711.34 ± 0.612.57 ± 6.3429.62 ± 5.04
3DW-P-ZP0.440.440.430.4013.78 ± 0.8711.97 ± 0.6117.05 ± 6.3442.75 ± 2.15
FE model (TexGen)3DW-O-ZO0.440.440.450.4115.99 ± 3.8211.20 ± 3.005.61 ± 0.7532.75 ± 4.11
3DW-P-ZO0.430.450.450.4217.59 ± 3.824.02 ± 3.005.61 ± 0.7527.17 ± 5.04
3DW-P-ZP0.420.450.450.4124.77 ± 3.828.97 ± 3.004.02 ± 0.7537.54 ± 2.15
Articular cartilage
Tensile modulus
(MPa, 10% ε)
Complex shear modulus
(MPa)
Ultimate tensile strengths
(MPa)
5.00–25.50 [90]0.20–2.00 [90]15–35 [90]
Disclaimer/Publisher’s Note: The statements, opinions and data contained in all publications are solely those of the individual author(s) and contributor(s) and not of MDPI and/or the editor(s). MDPI and/or the editor(s) disclaim responsibility for any injury to people or property resulting from any ideas, methods, instructions or products referred to in the content.

