
Sustainable Nanomagnetism: Investigating the Influence of Green Synthesis and pH on Iron Oxide Nanoparticles for Enhanced Biomedical Applications

 ,
,  , ,
, ,  ,
,  and
and 
Abstract
:
1. Introduction
2. Materials and Methods
2.1. Materials
2.2. Nanoparticle Synthesis
2.3. Nanoparticle Characterization
2.4. Antioxidant Potential
2.5. Preparation and Characterization of PCL/GNMIOP Membranes
2.6. Statistical Analysis
3. Results
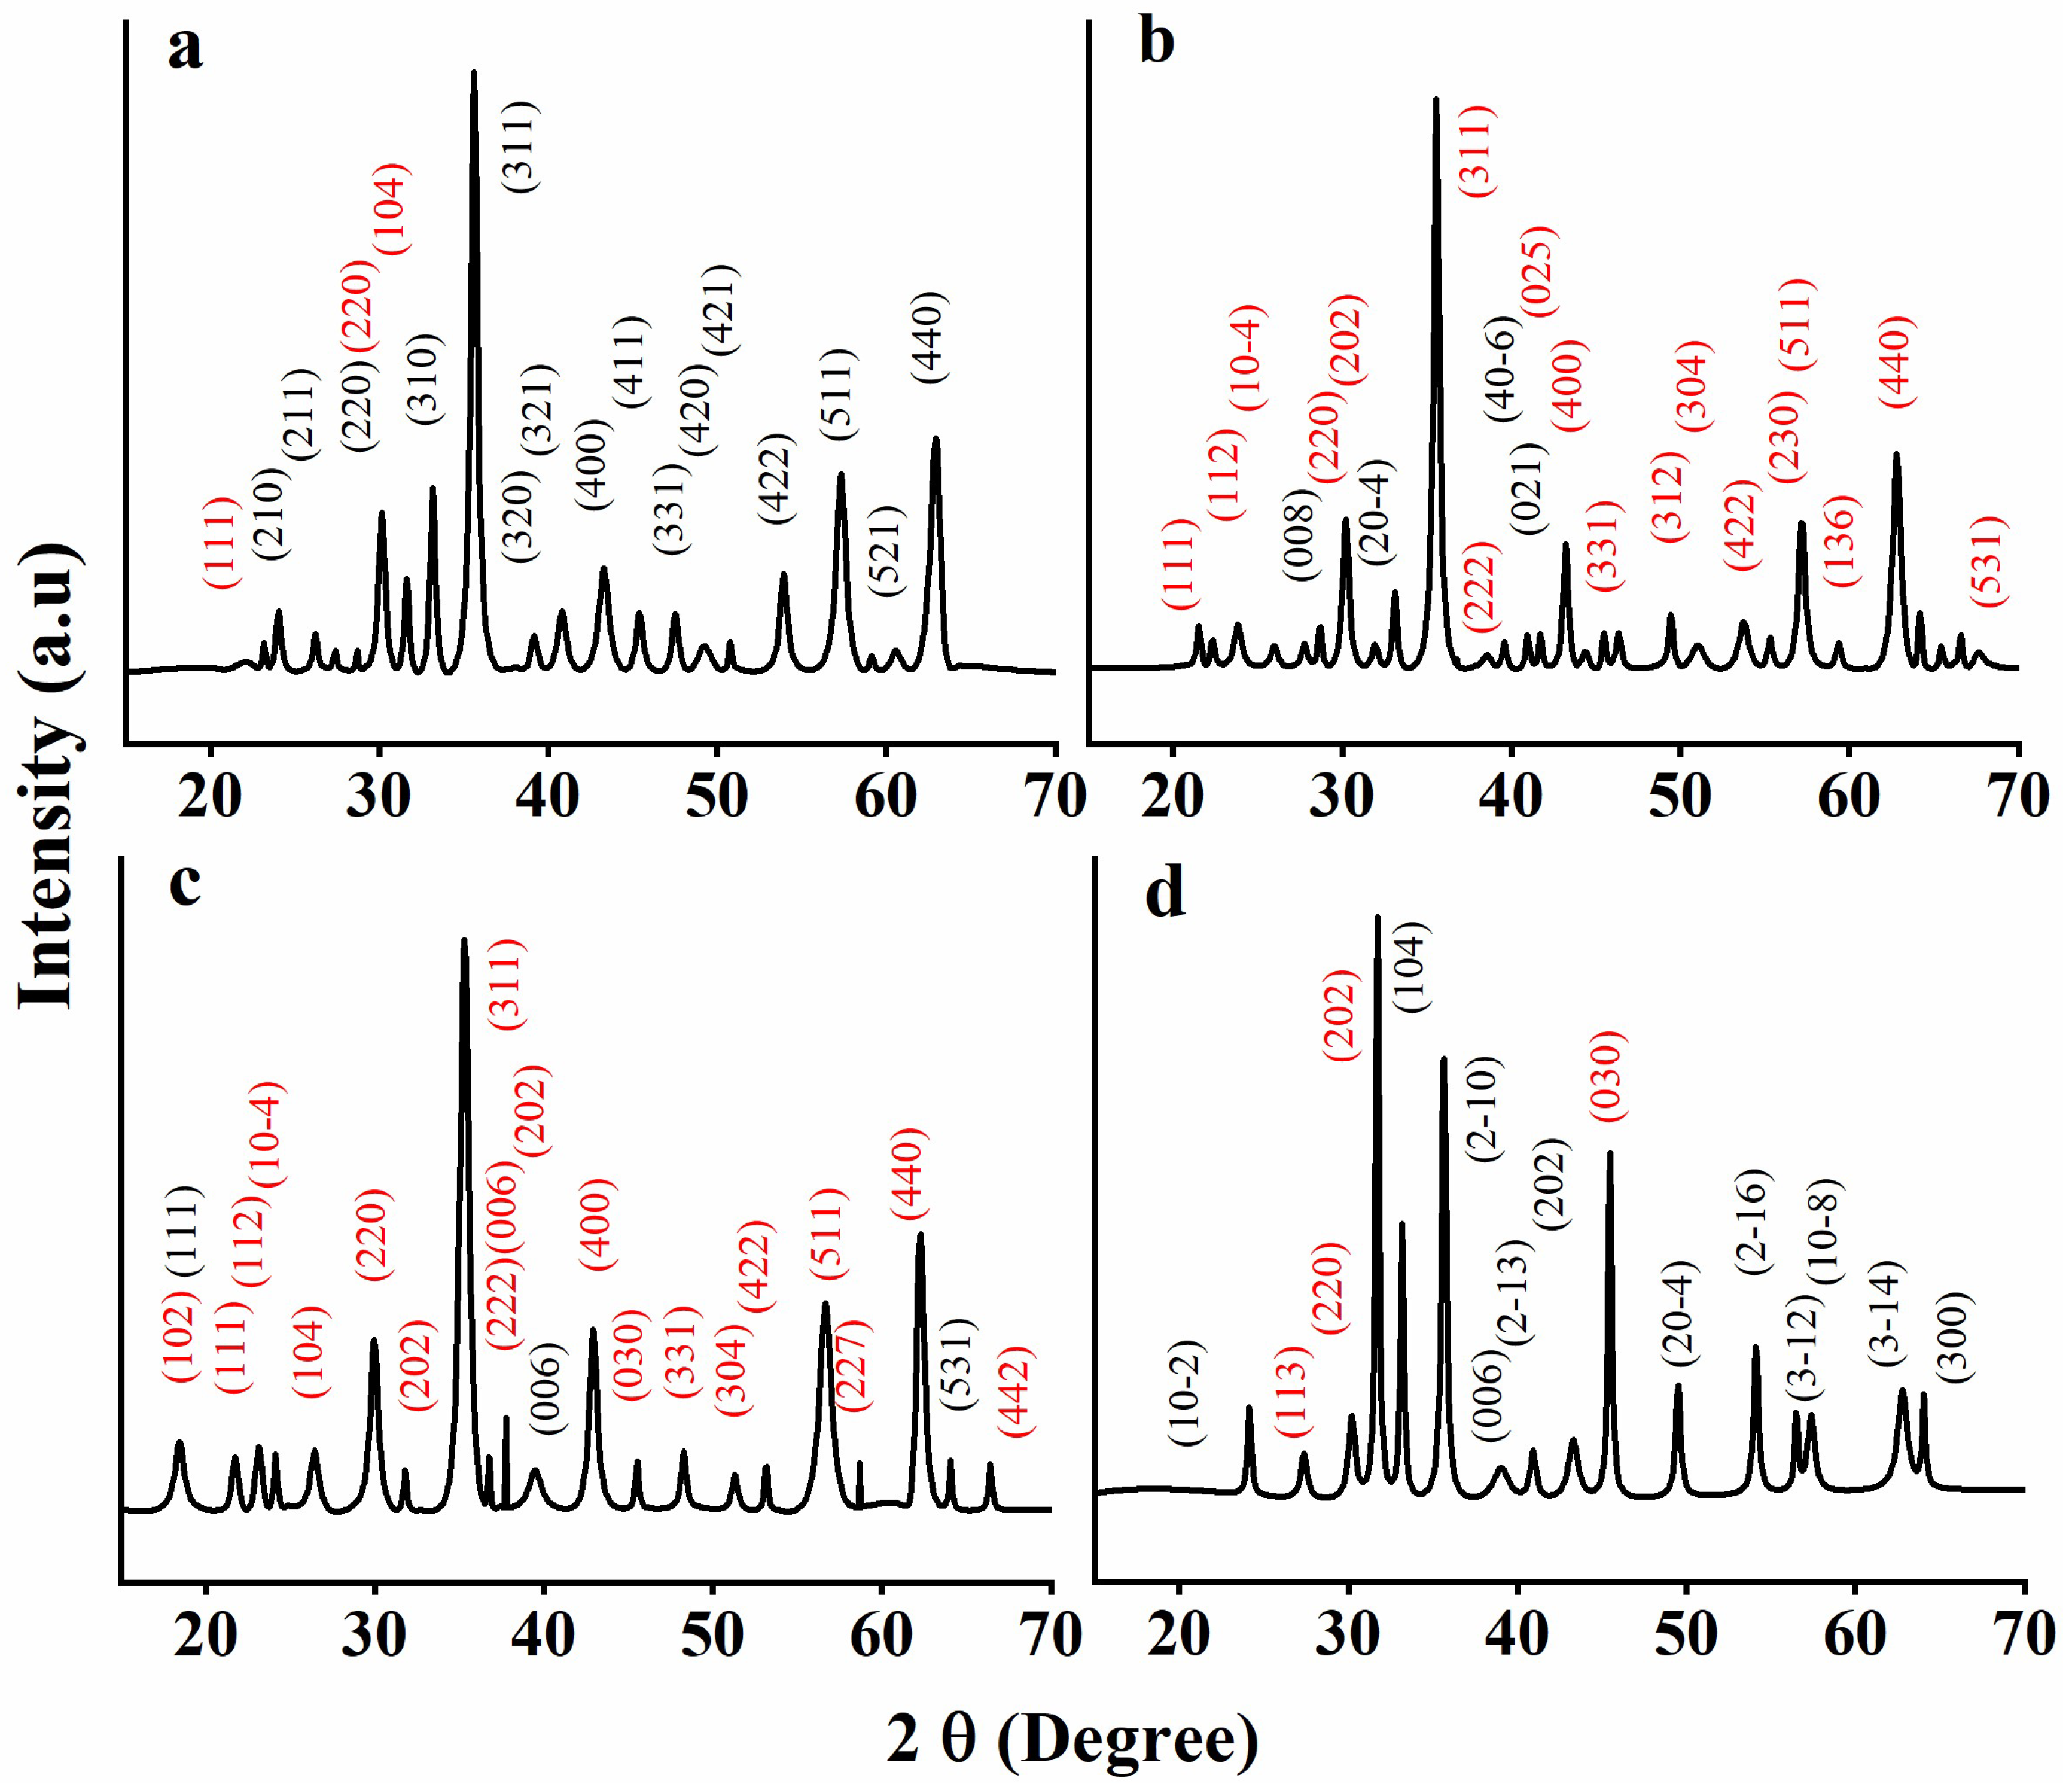
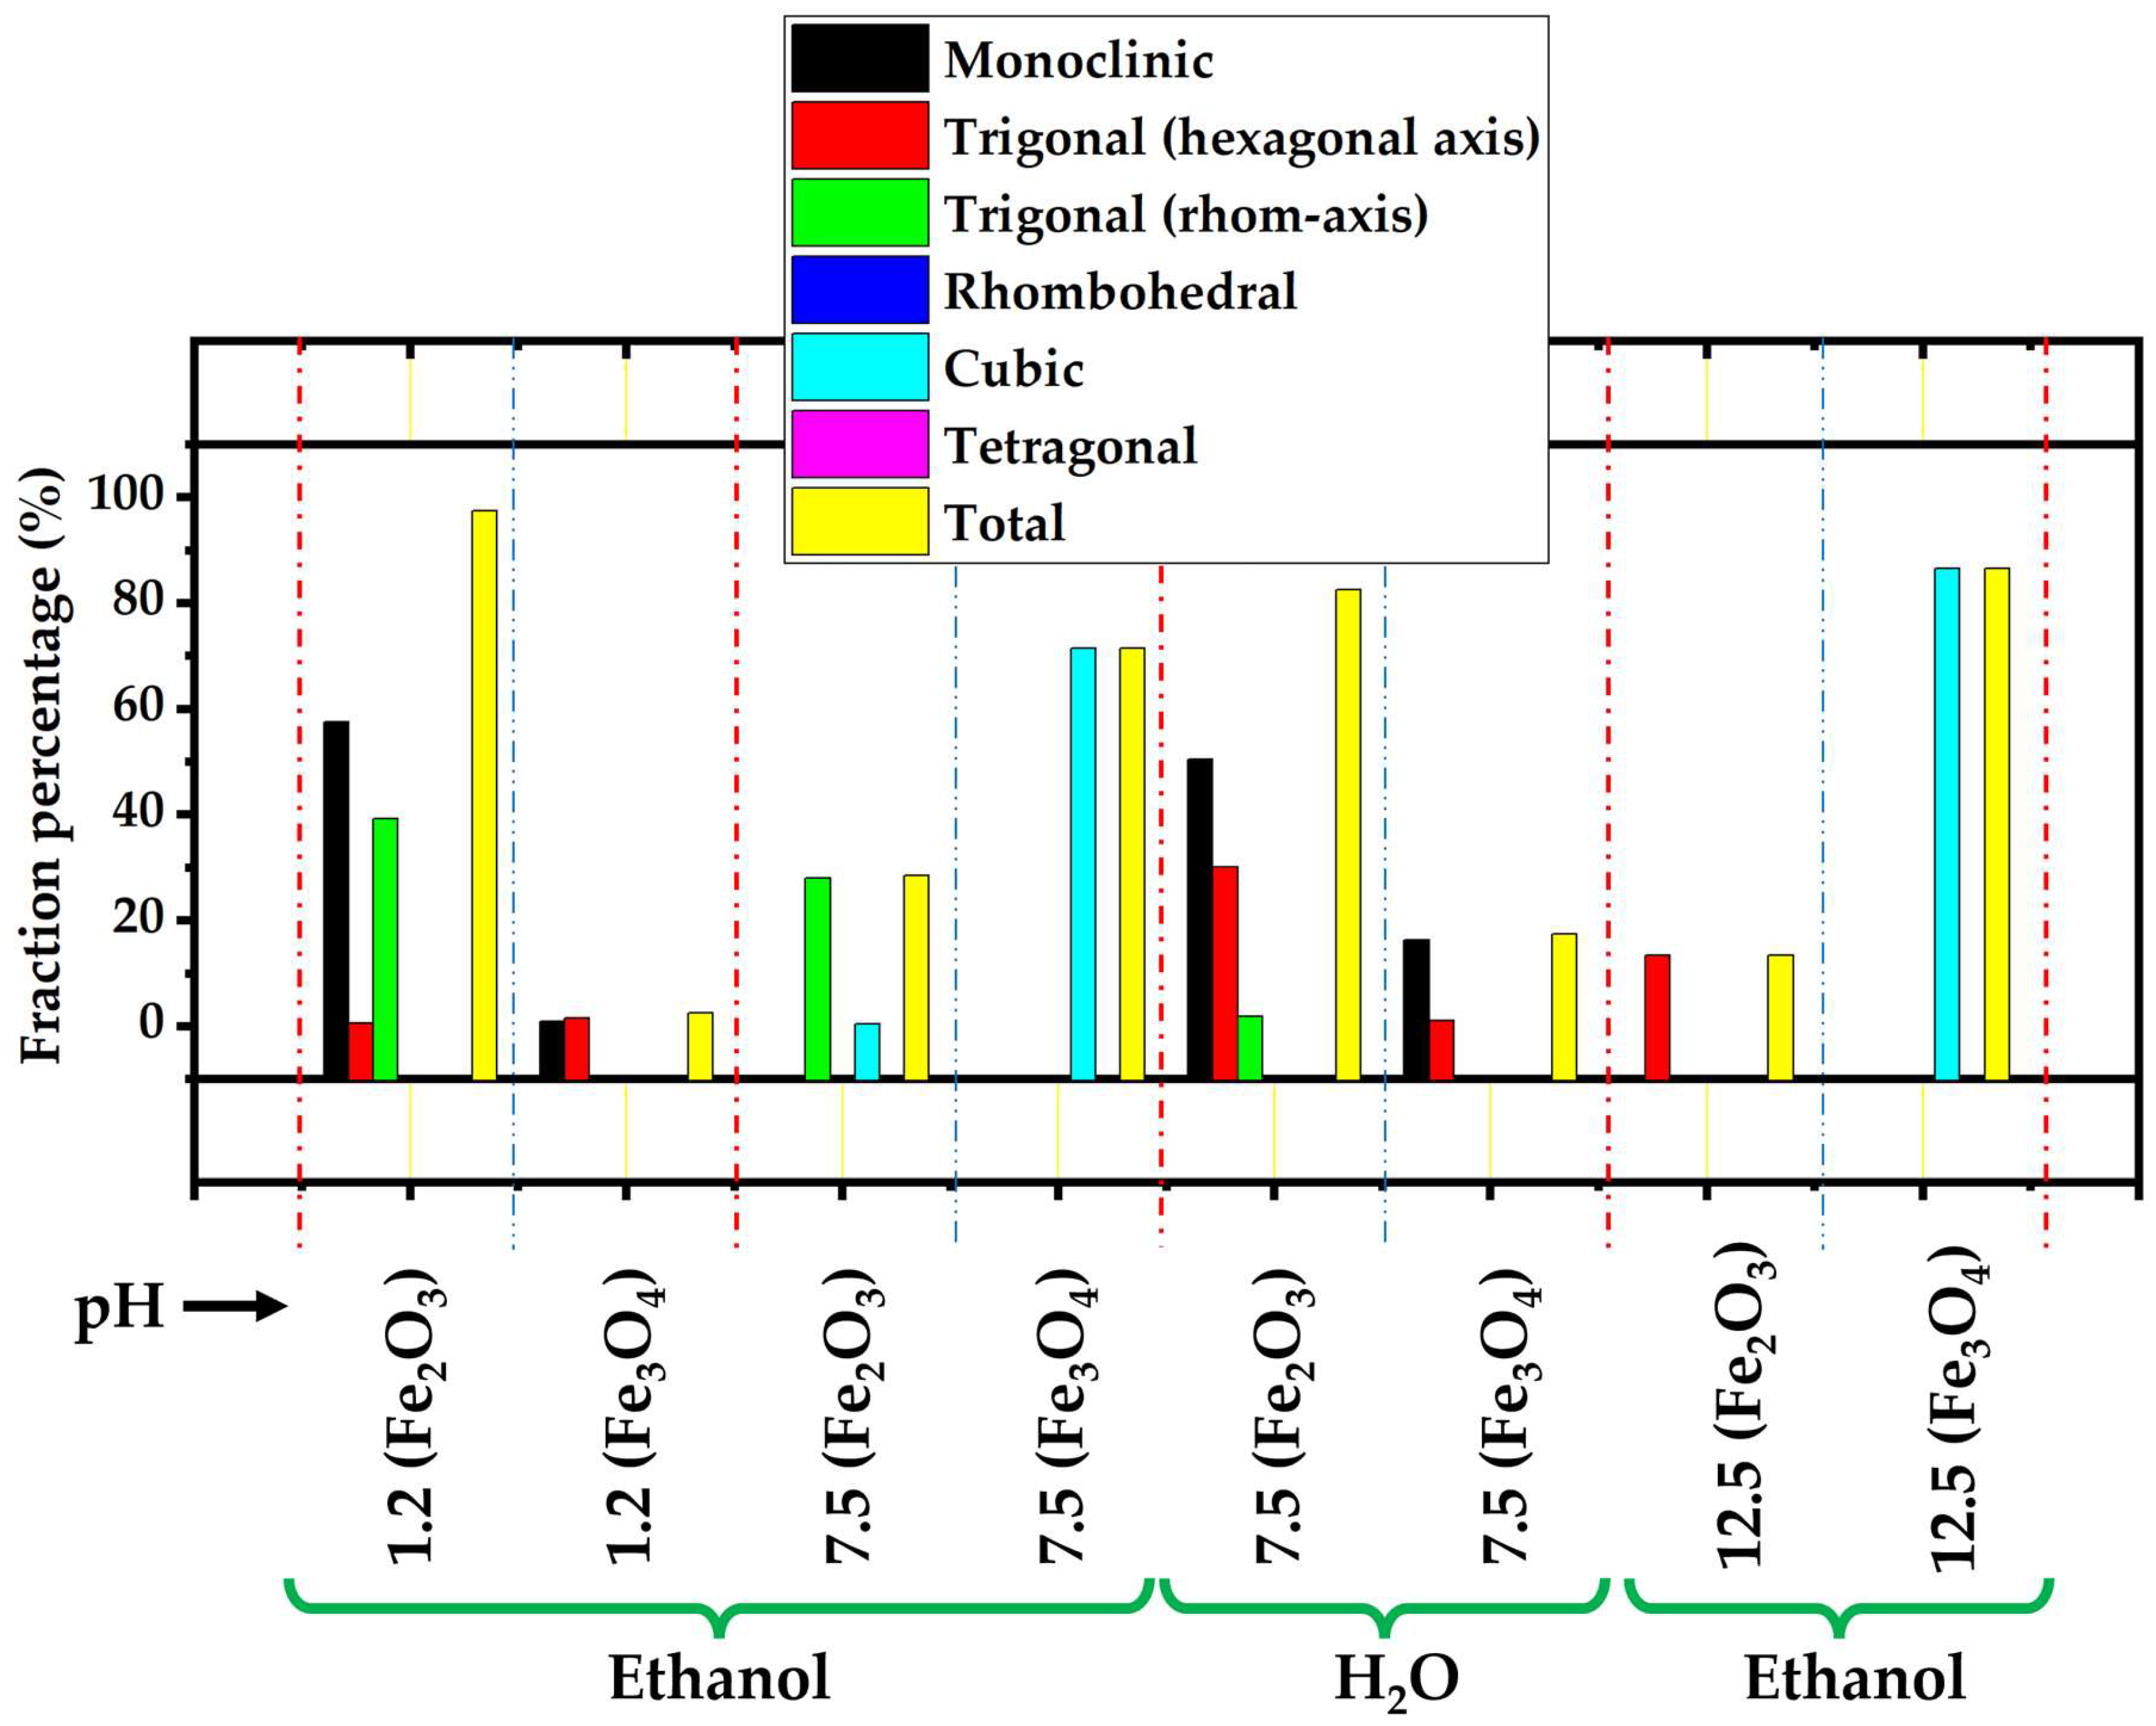
3.1. XRD
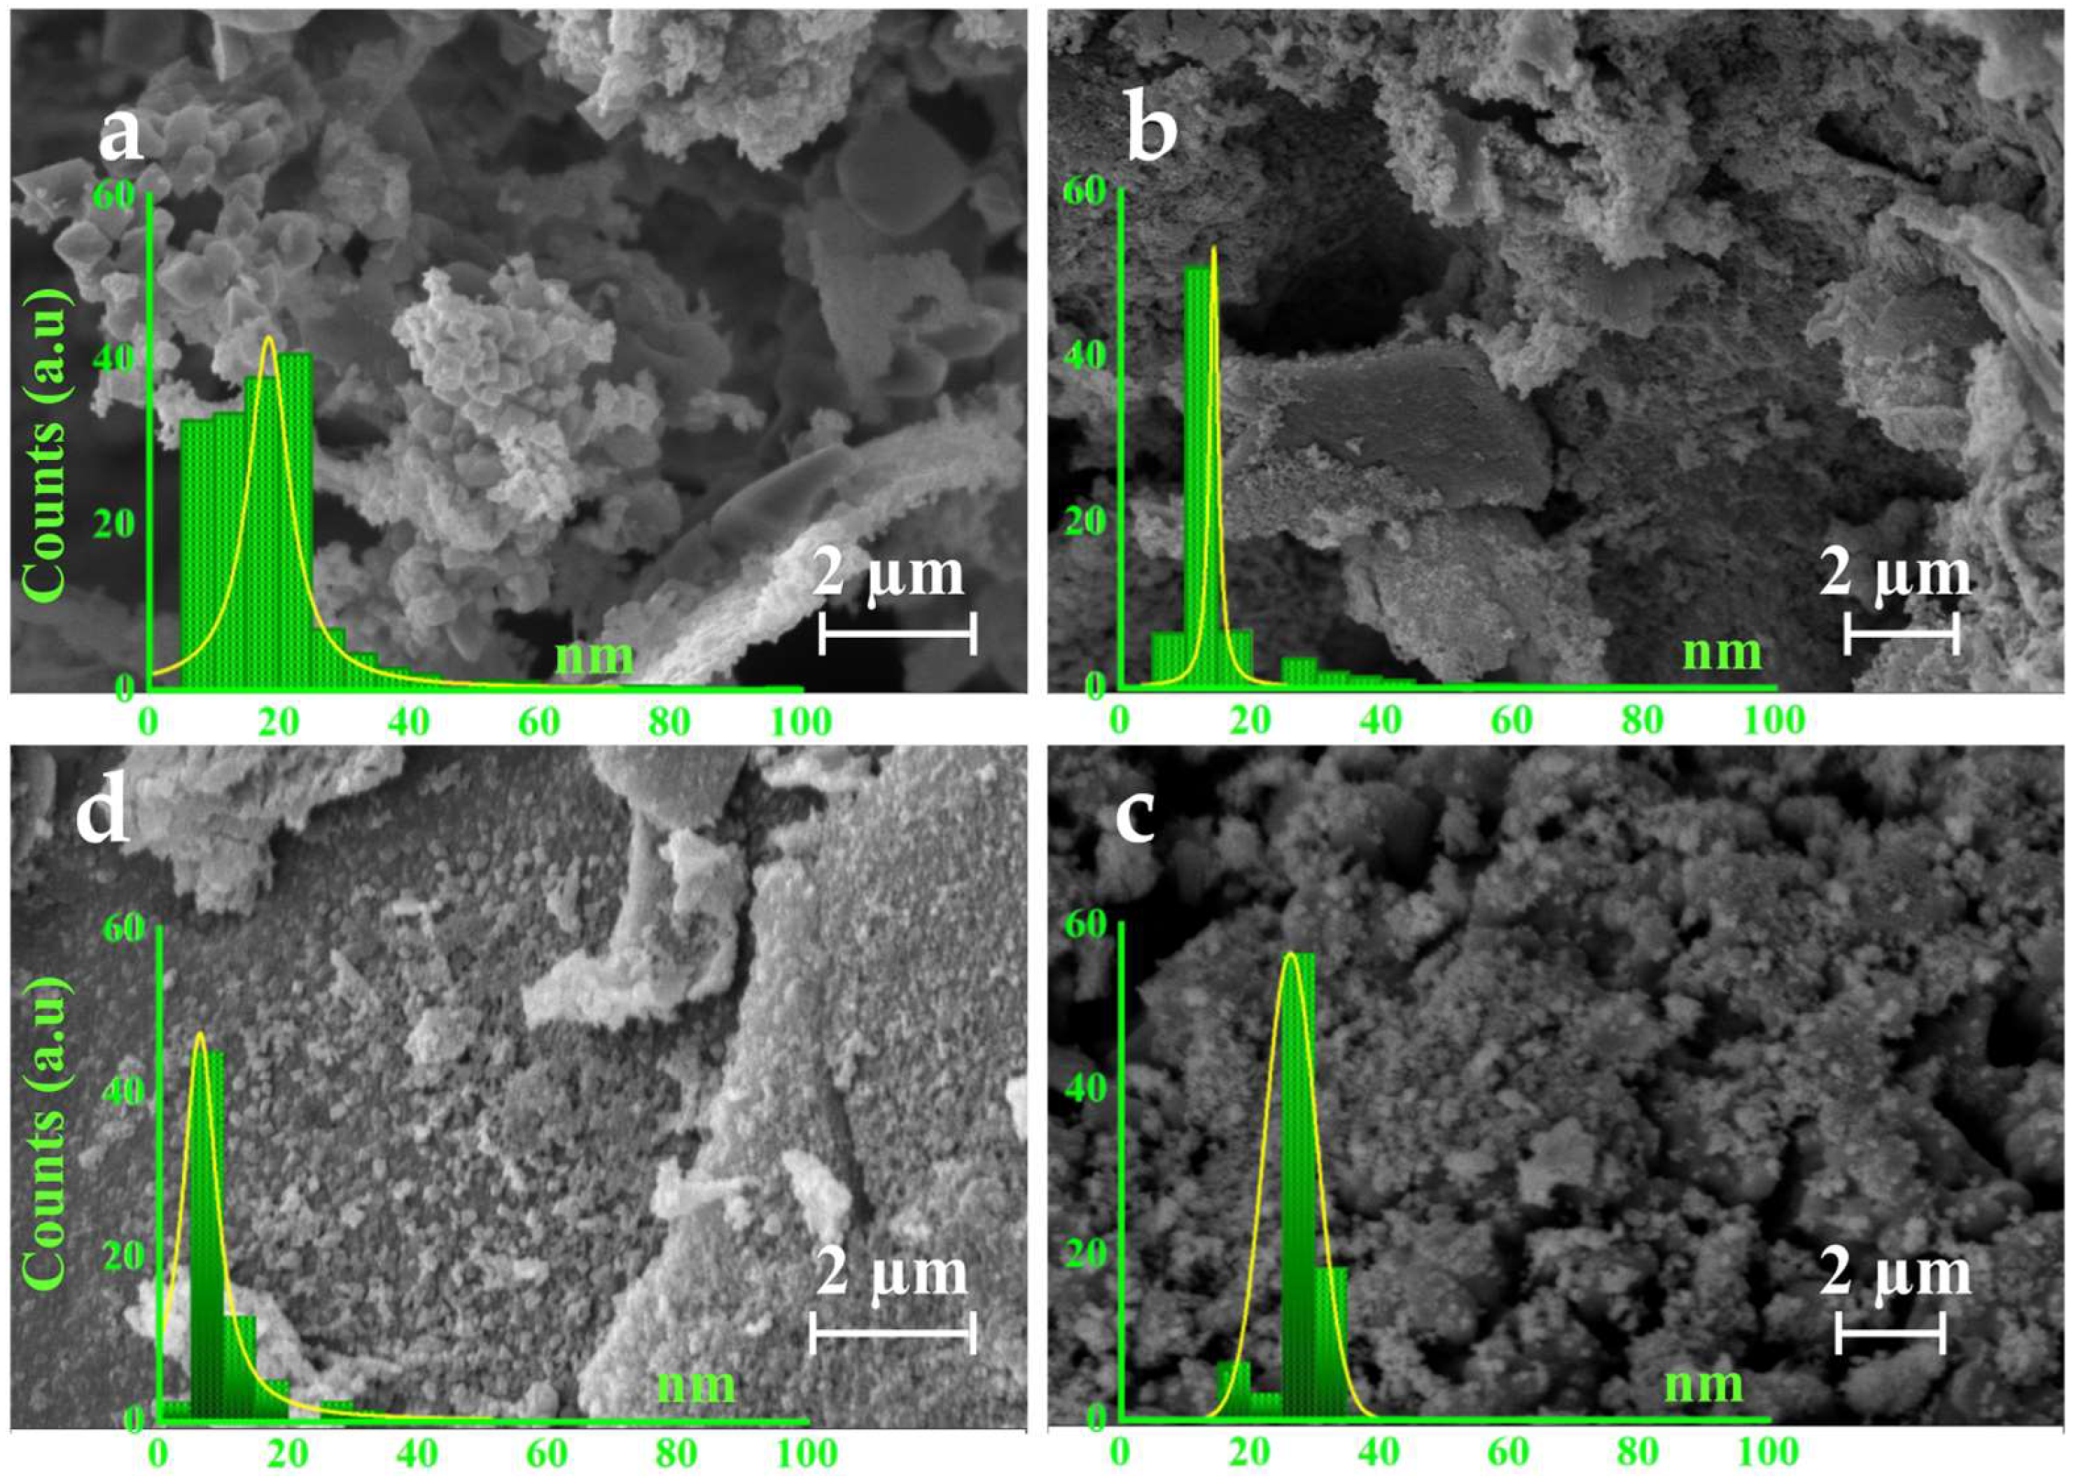
3.2. SEM
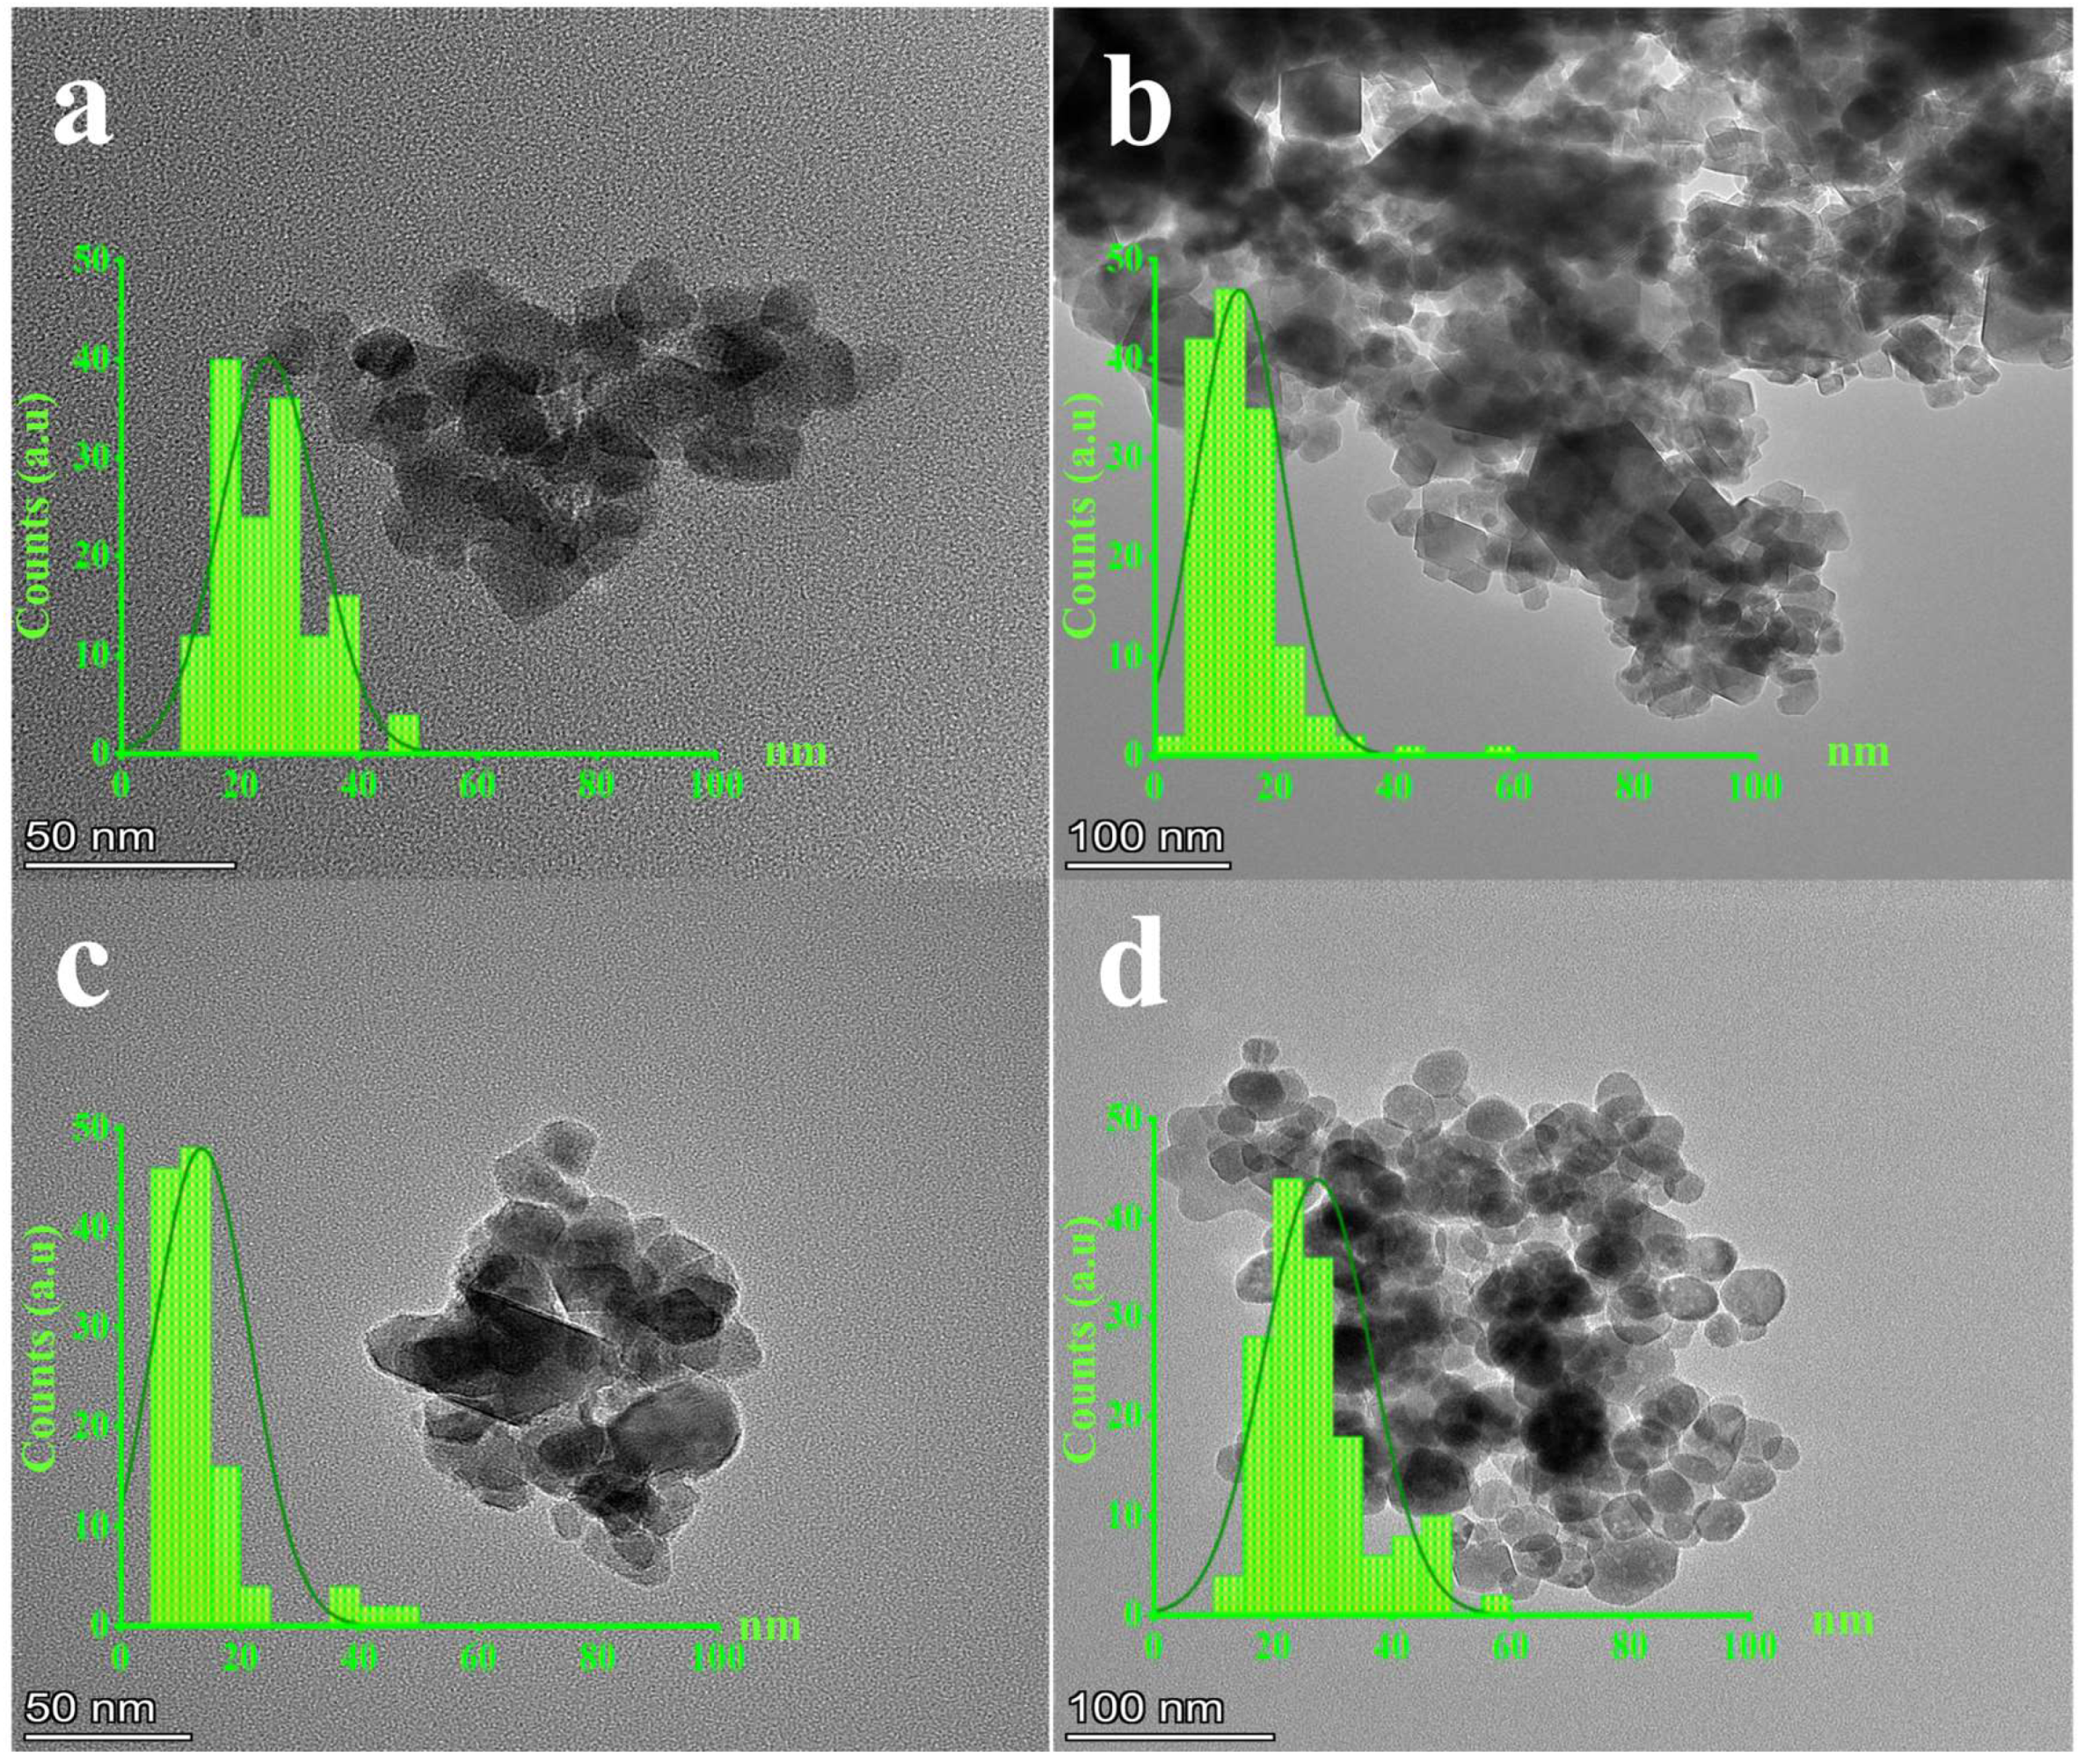
3.3. TEM
3.4. FTIR
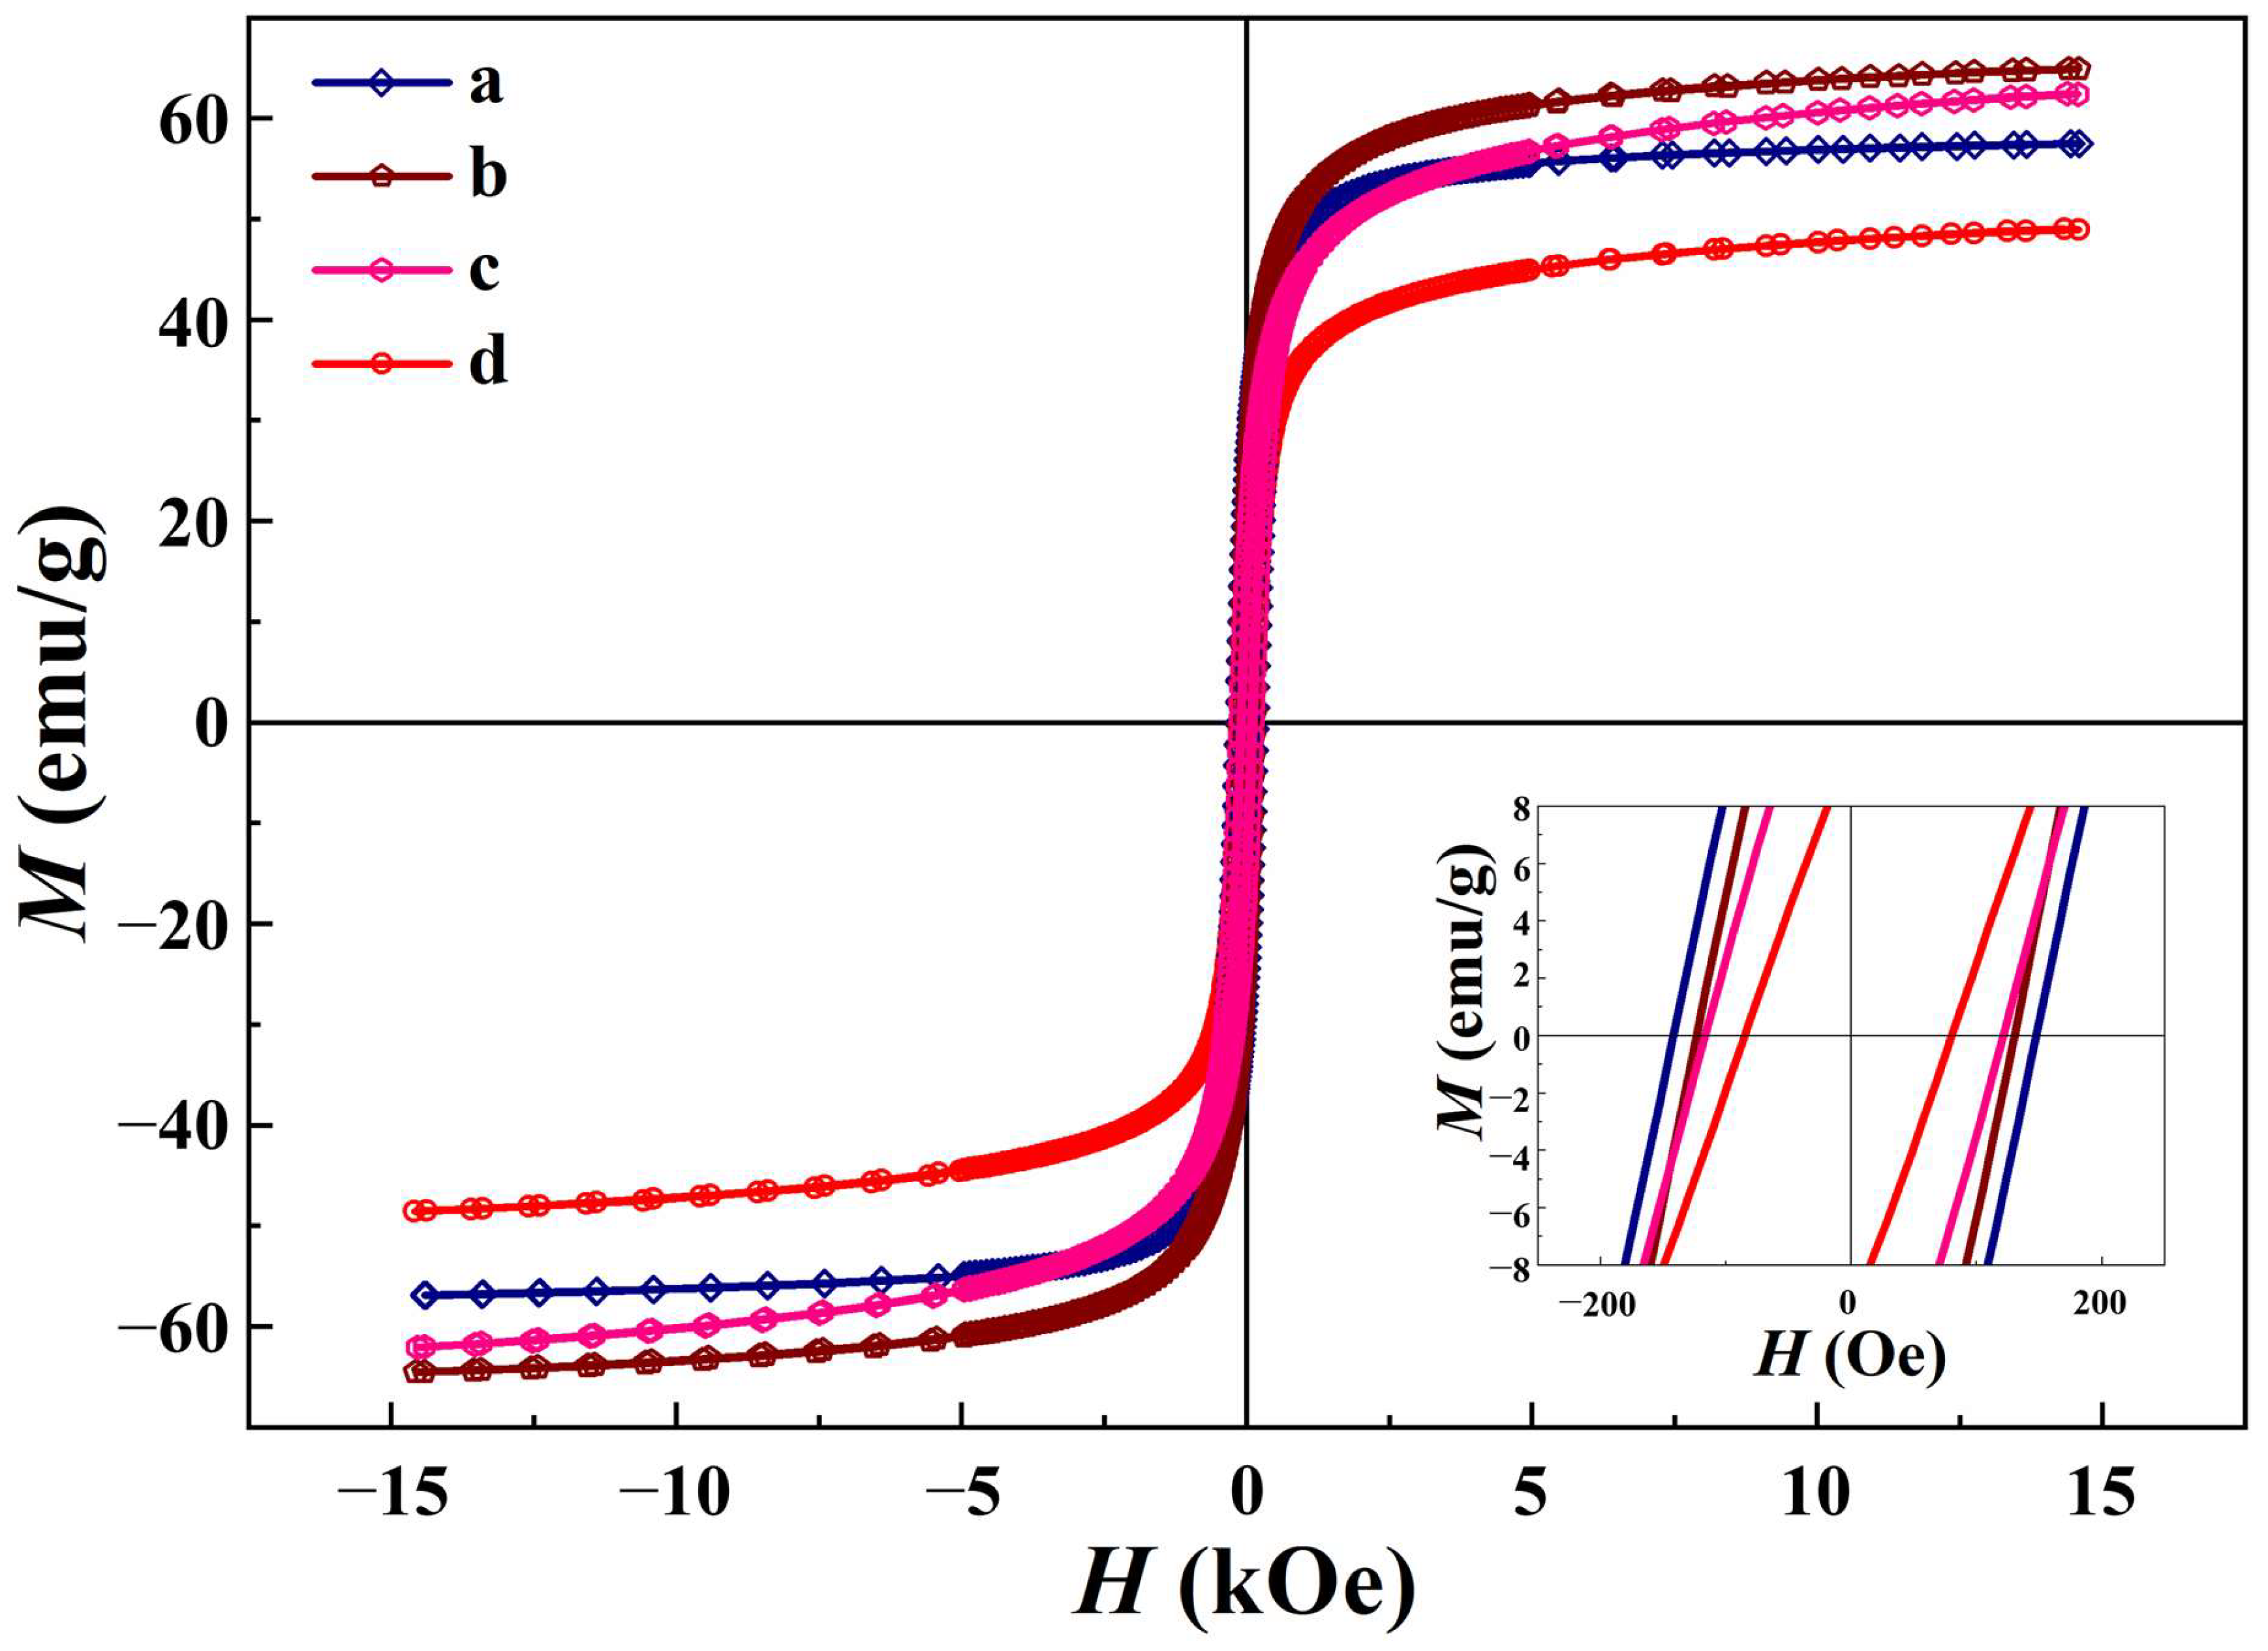
3.5. Magnetic Properties
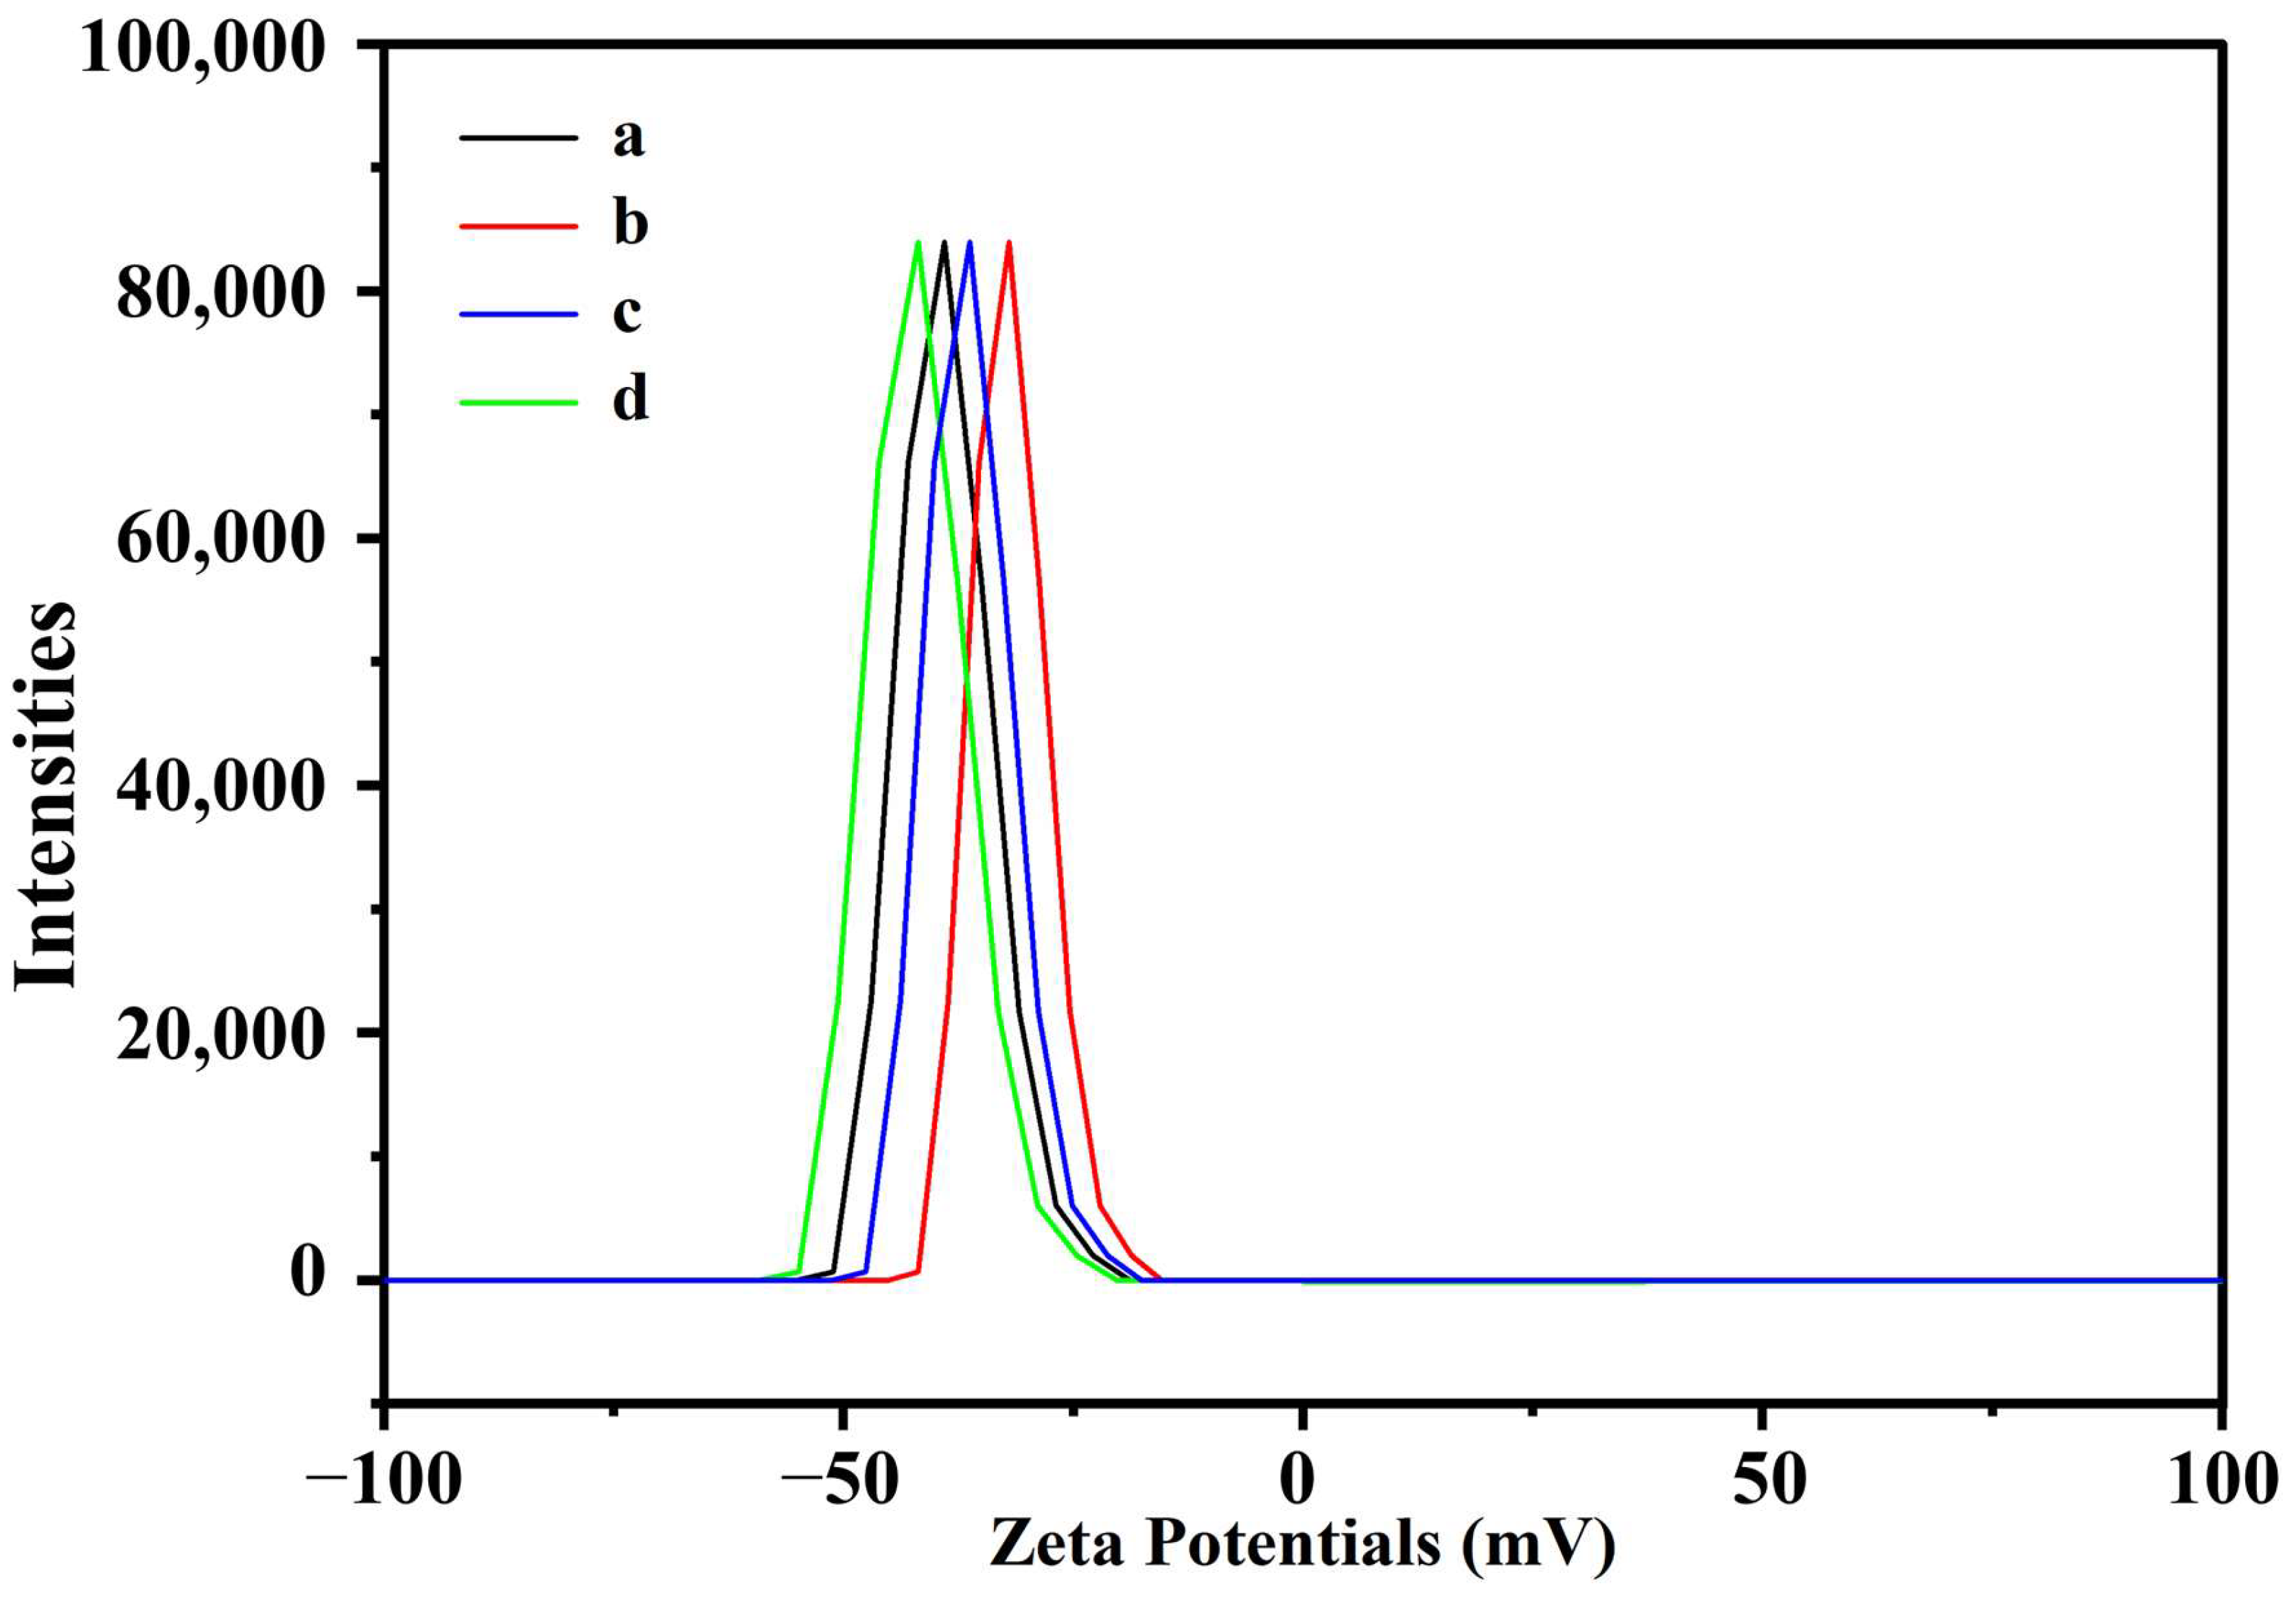
3.6. Nanoparticle Stability
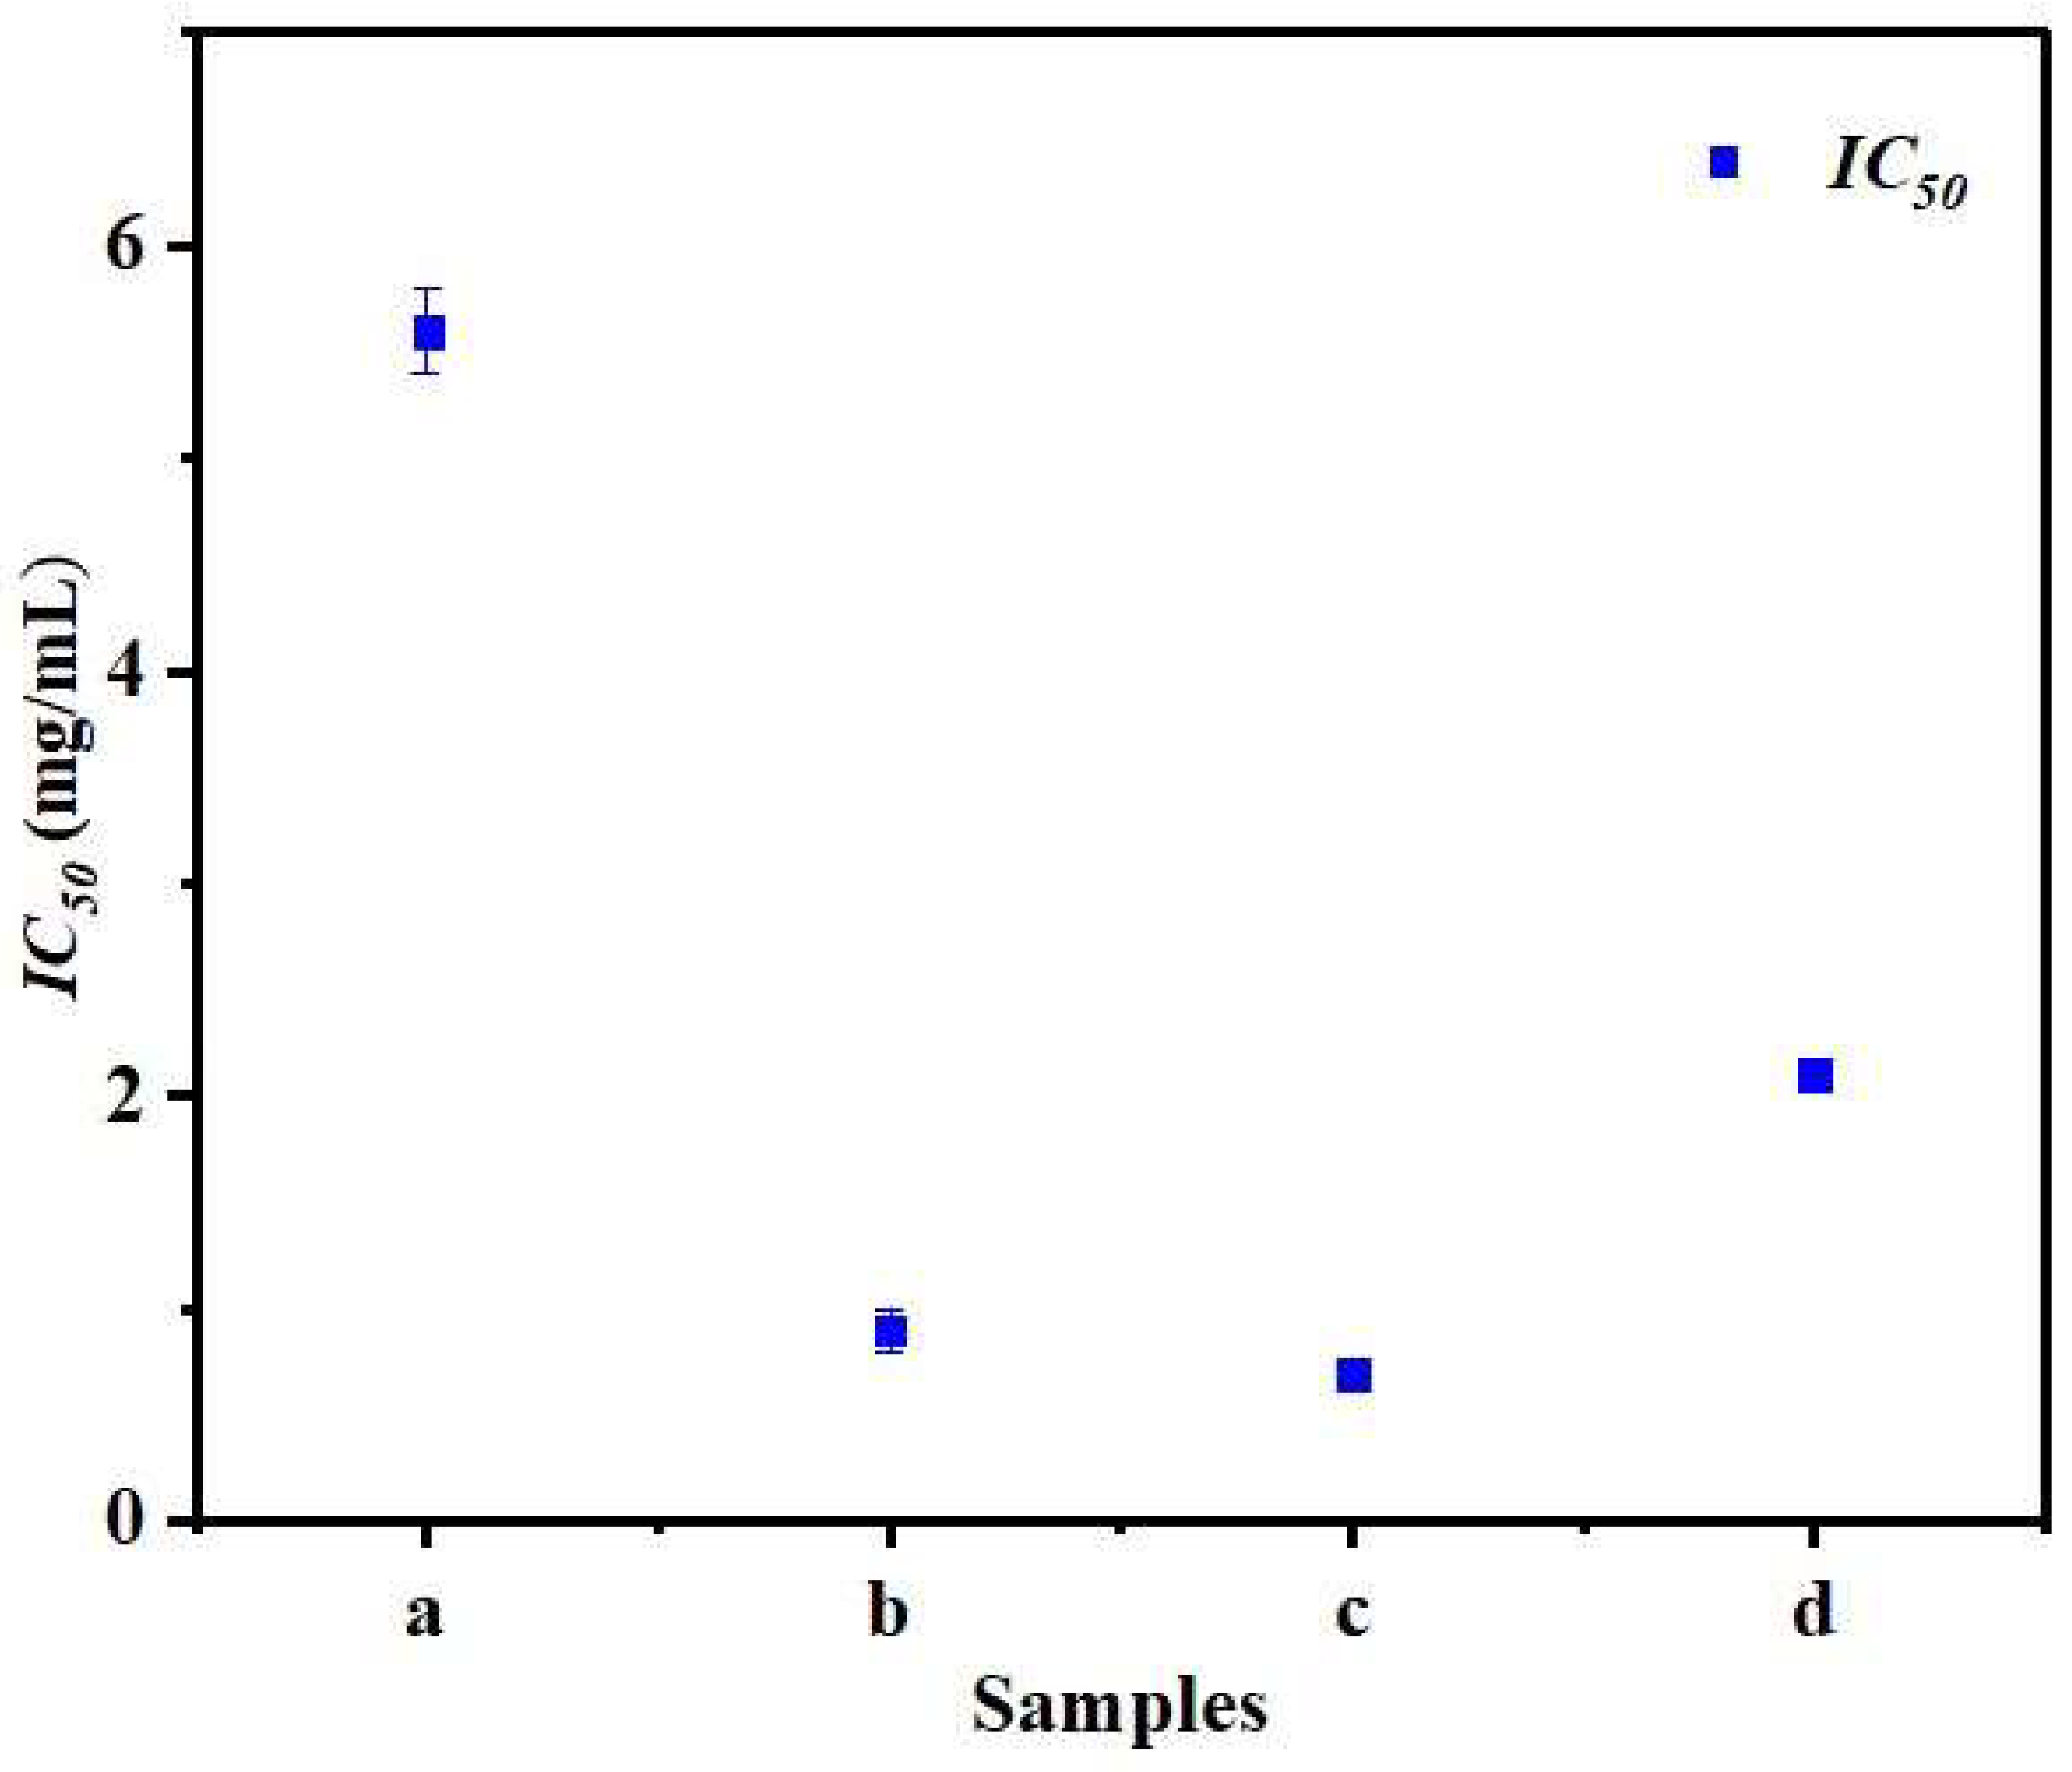
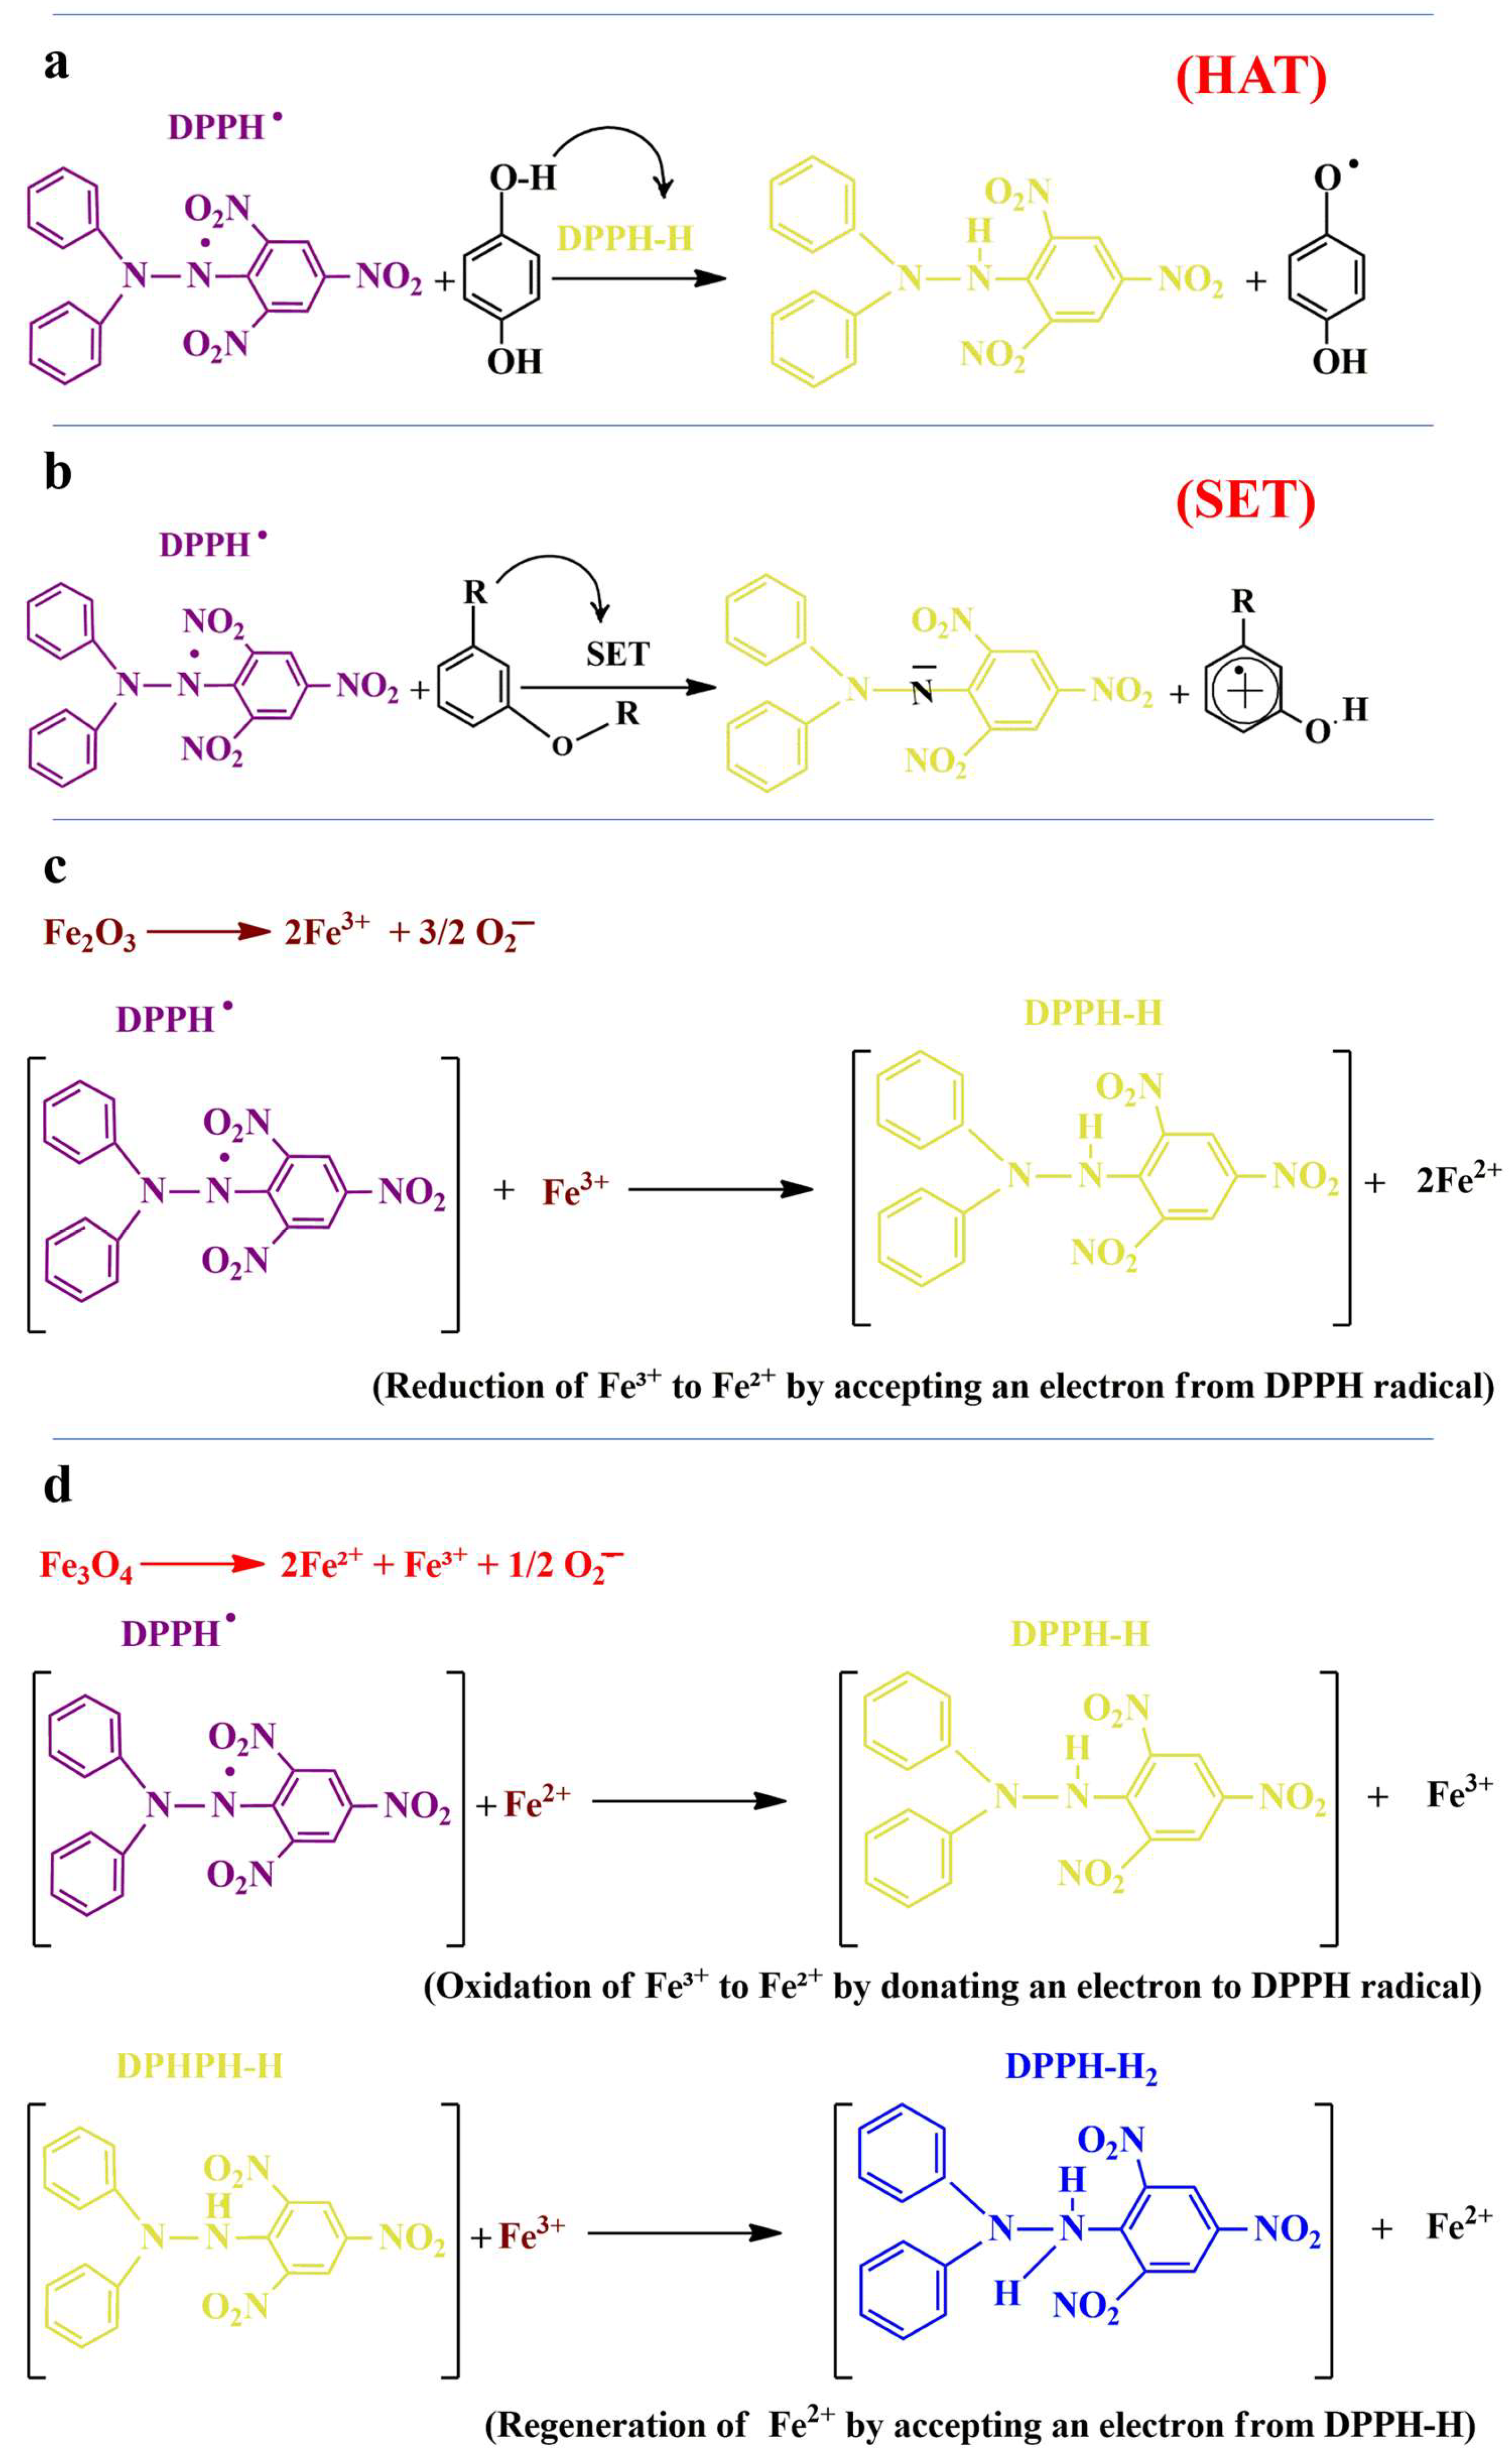
3.7. Antioxidant Activity
3.8. Characterization of PCL/GNMIOP Membranes
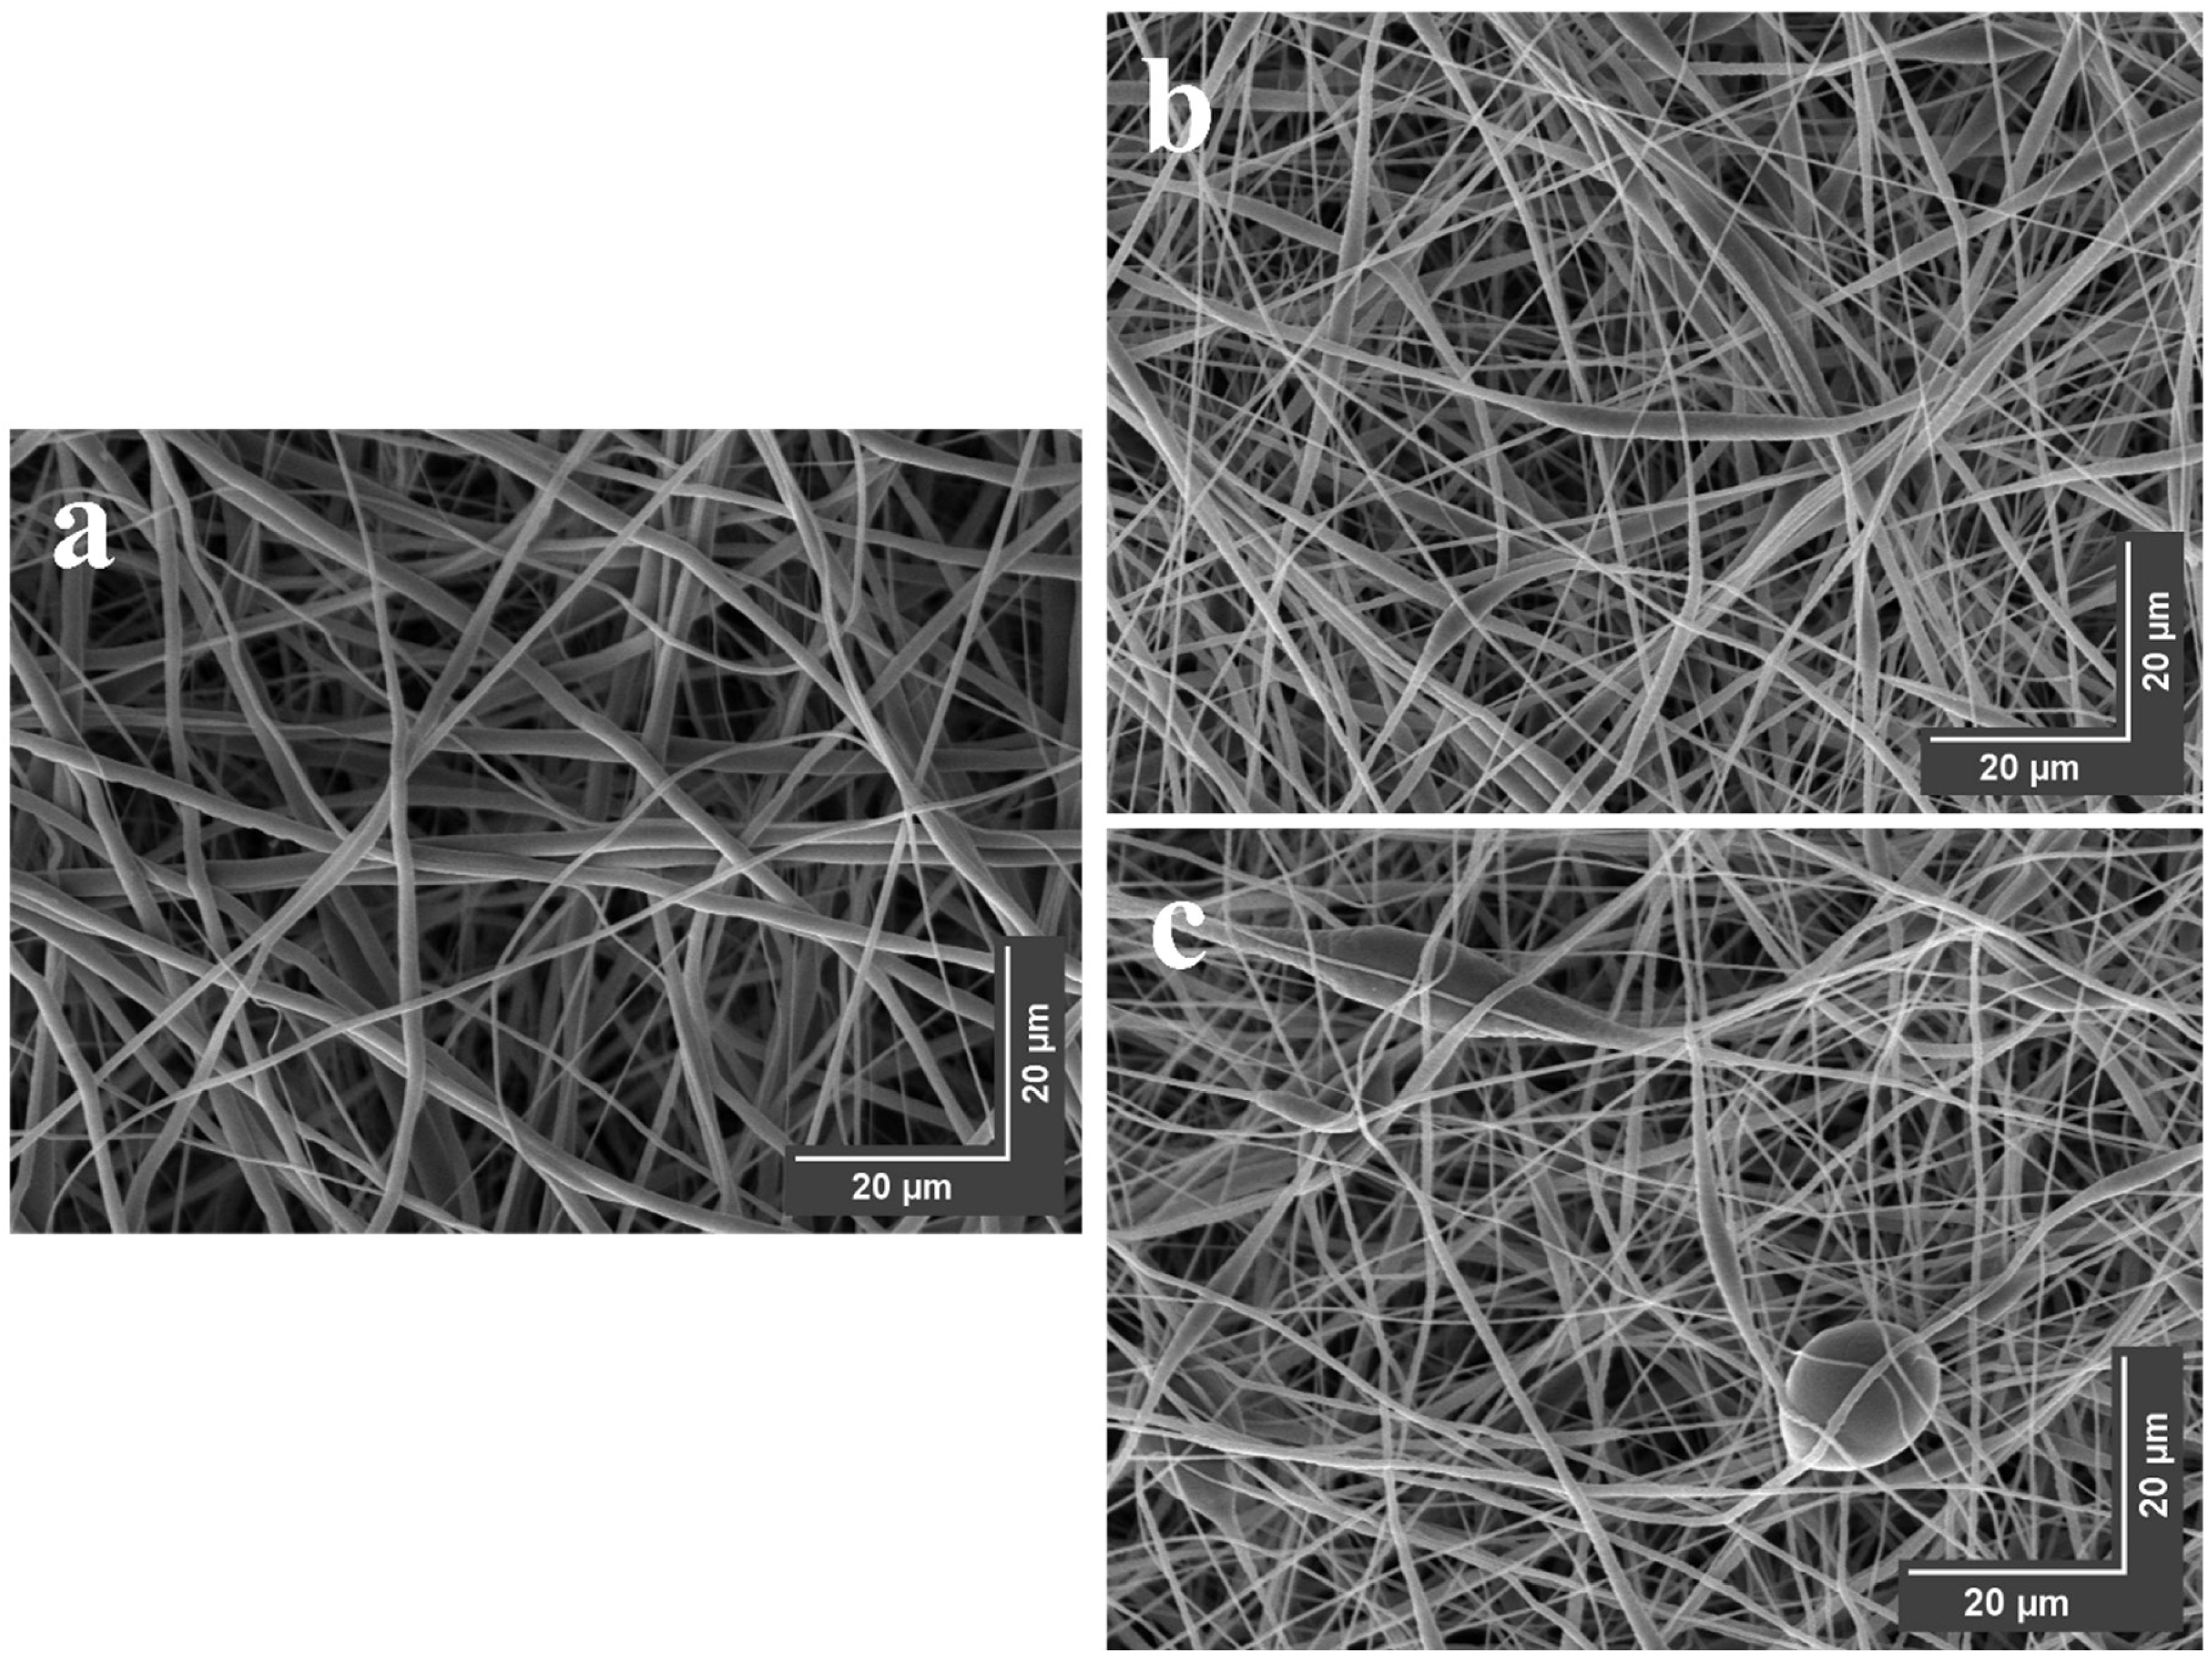
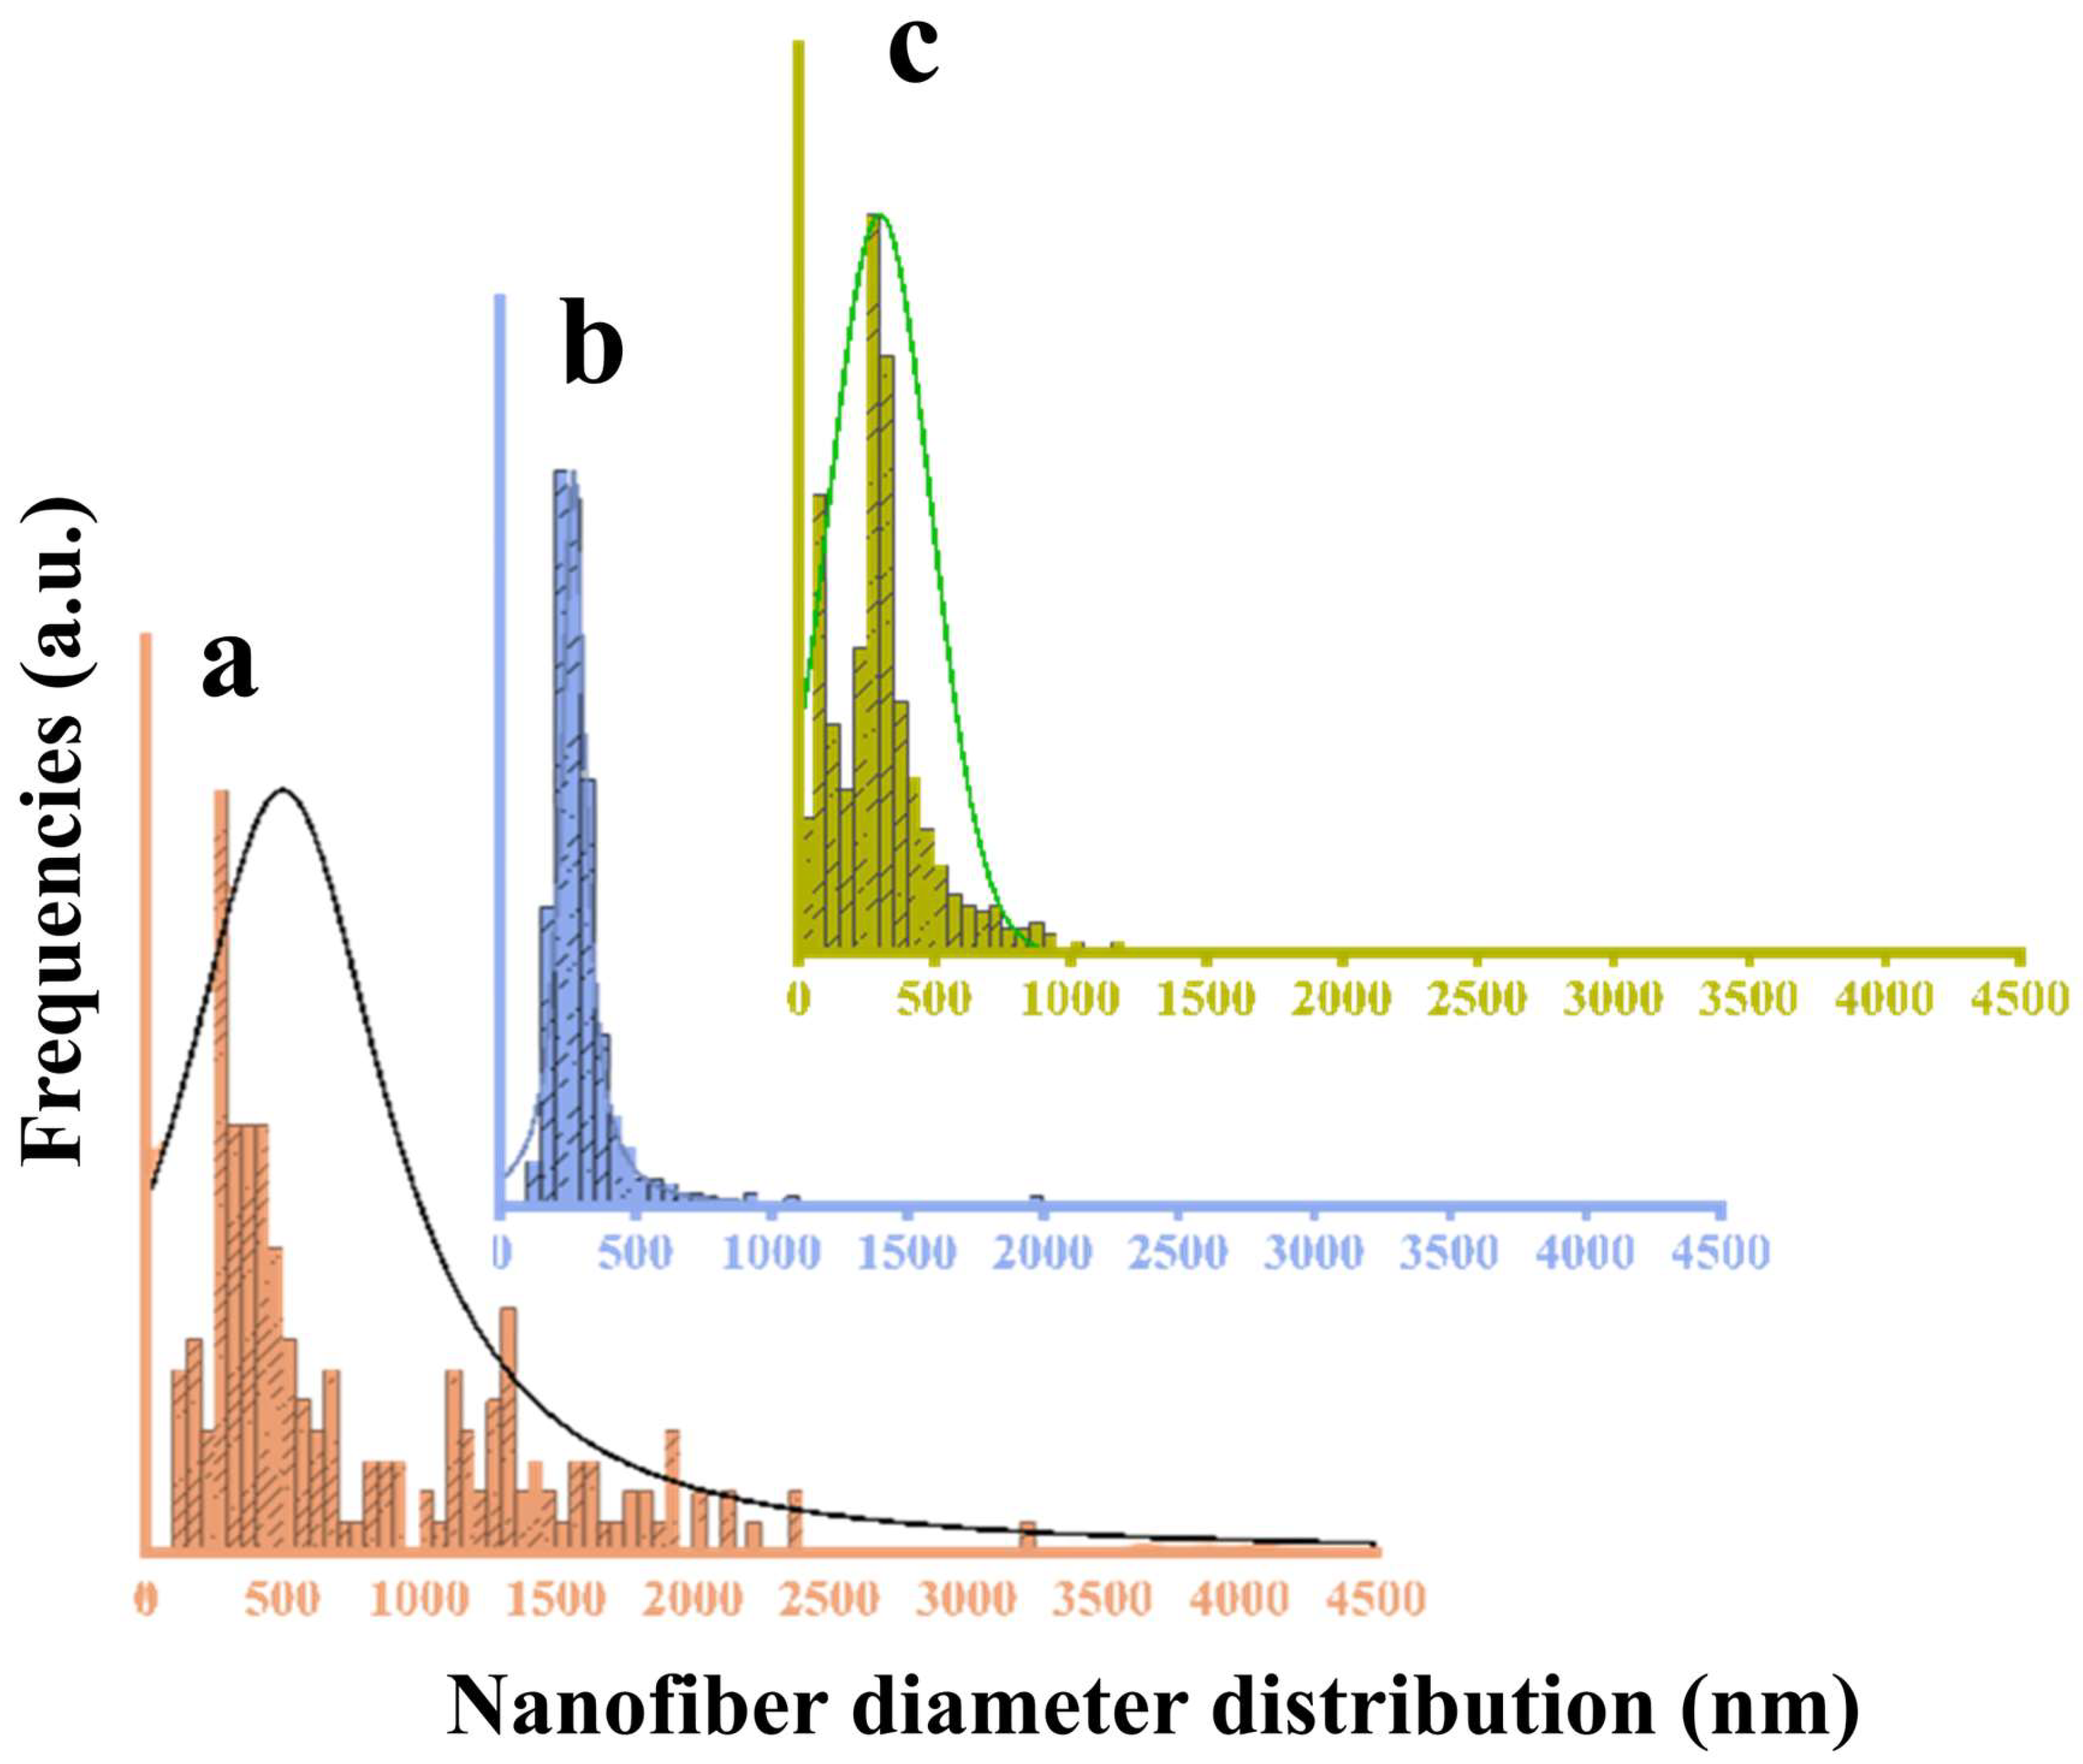
3.8.1. SEM Visualization
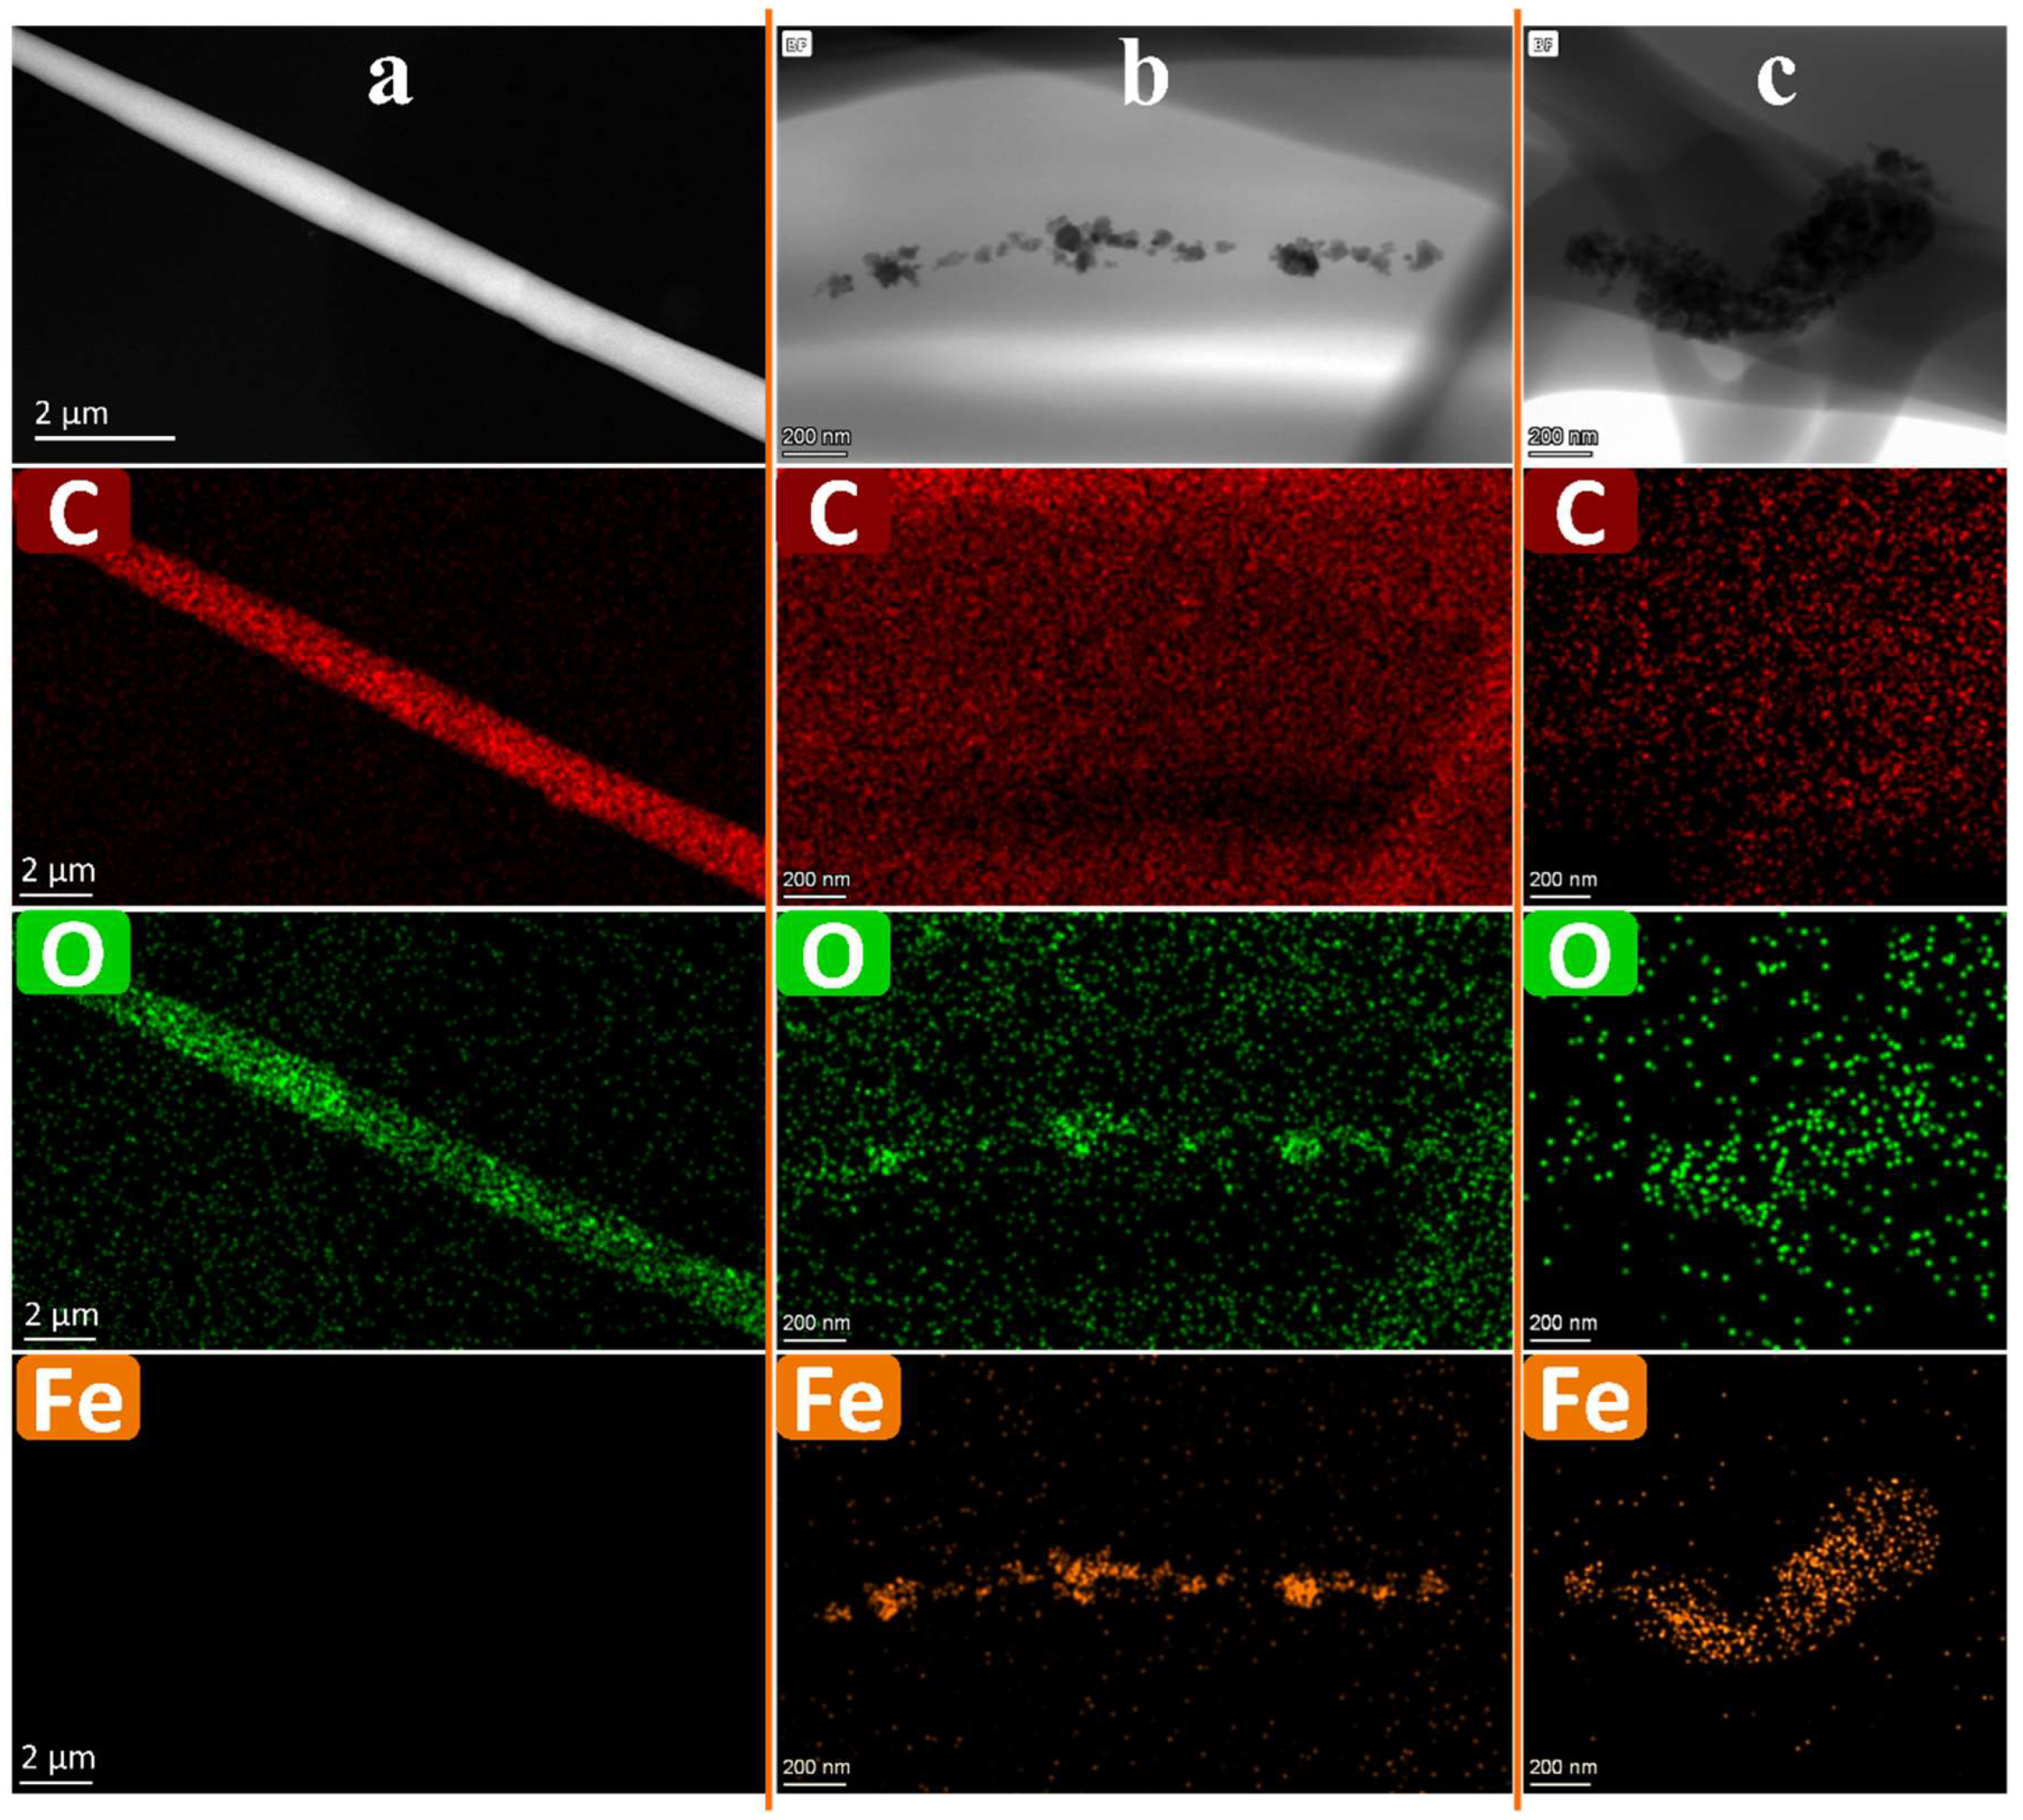
3.8.2. TEM
3.8.3. Surface Roughness
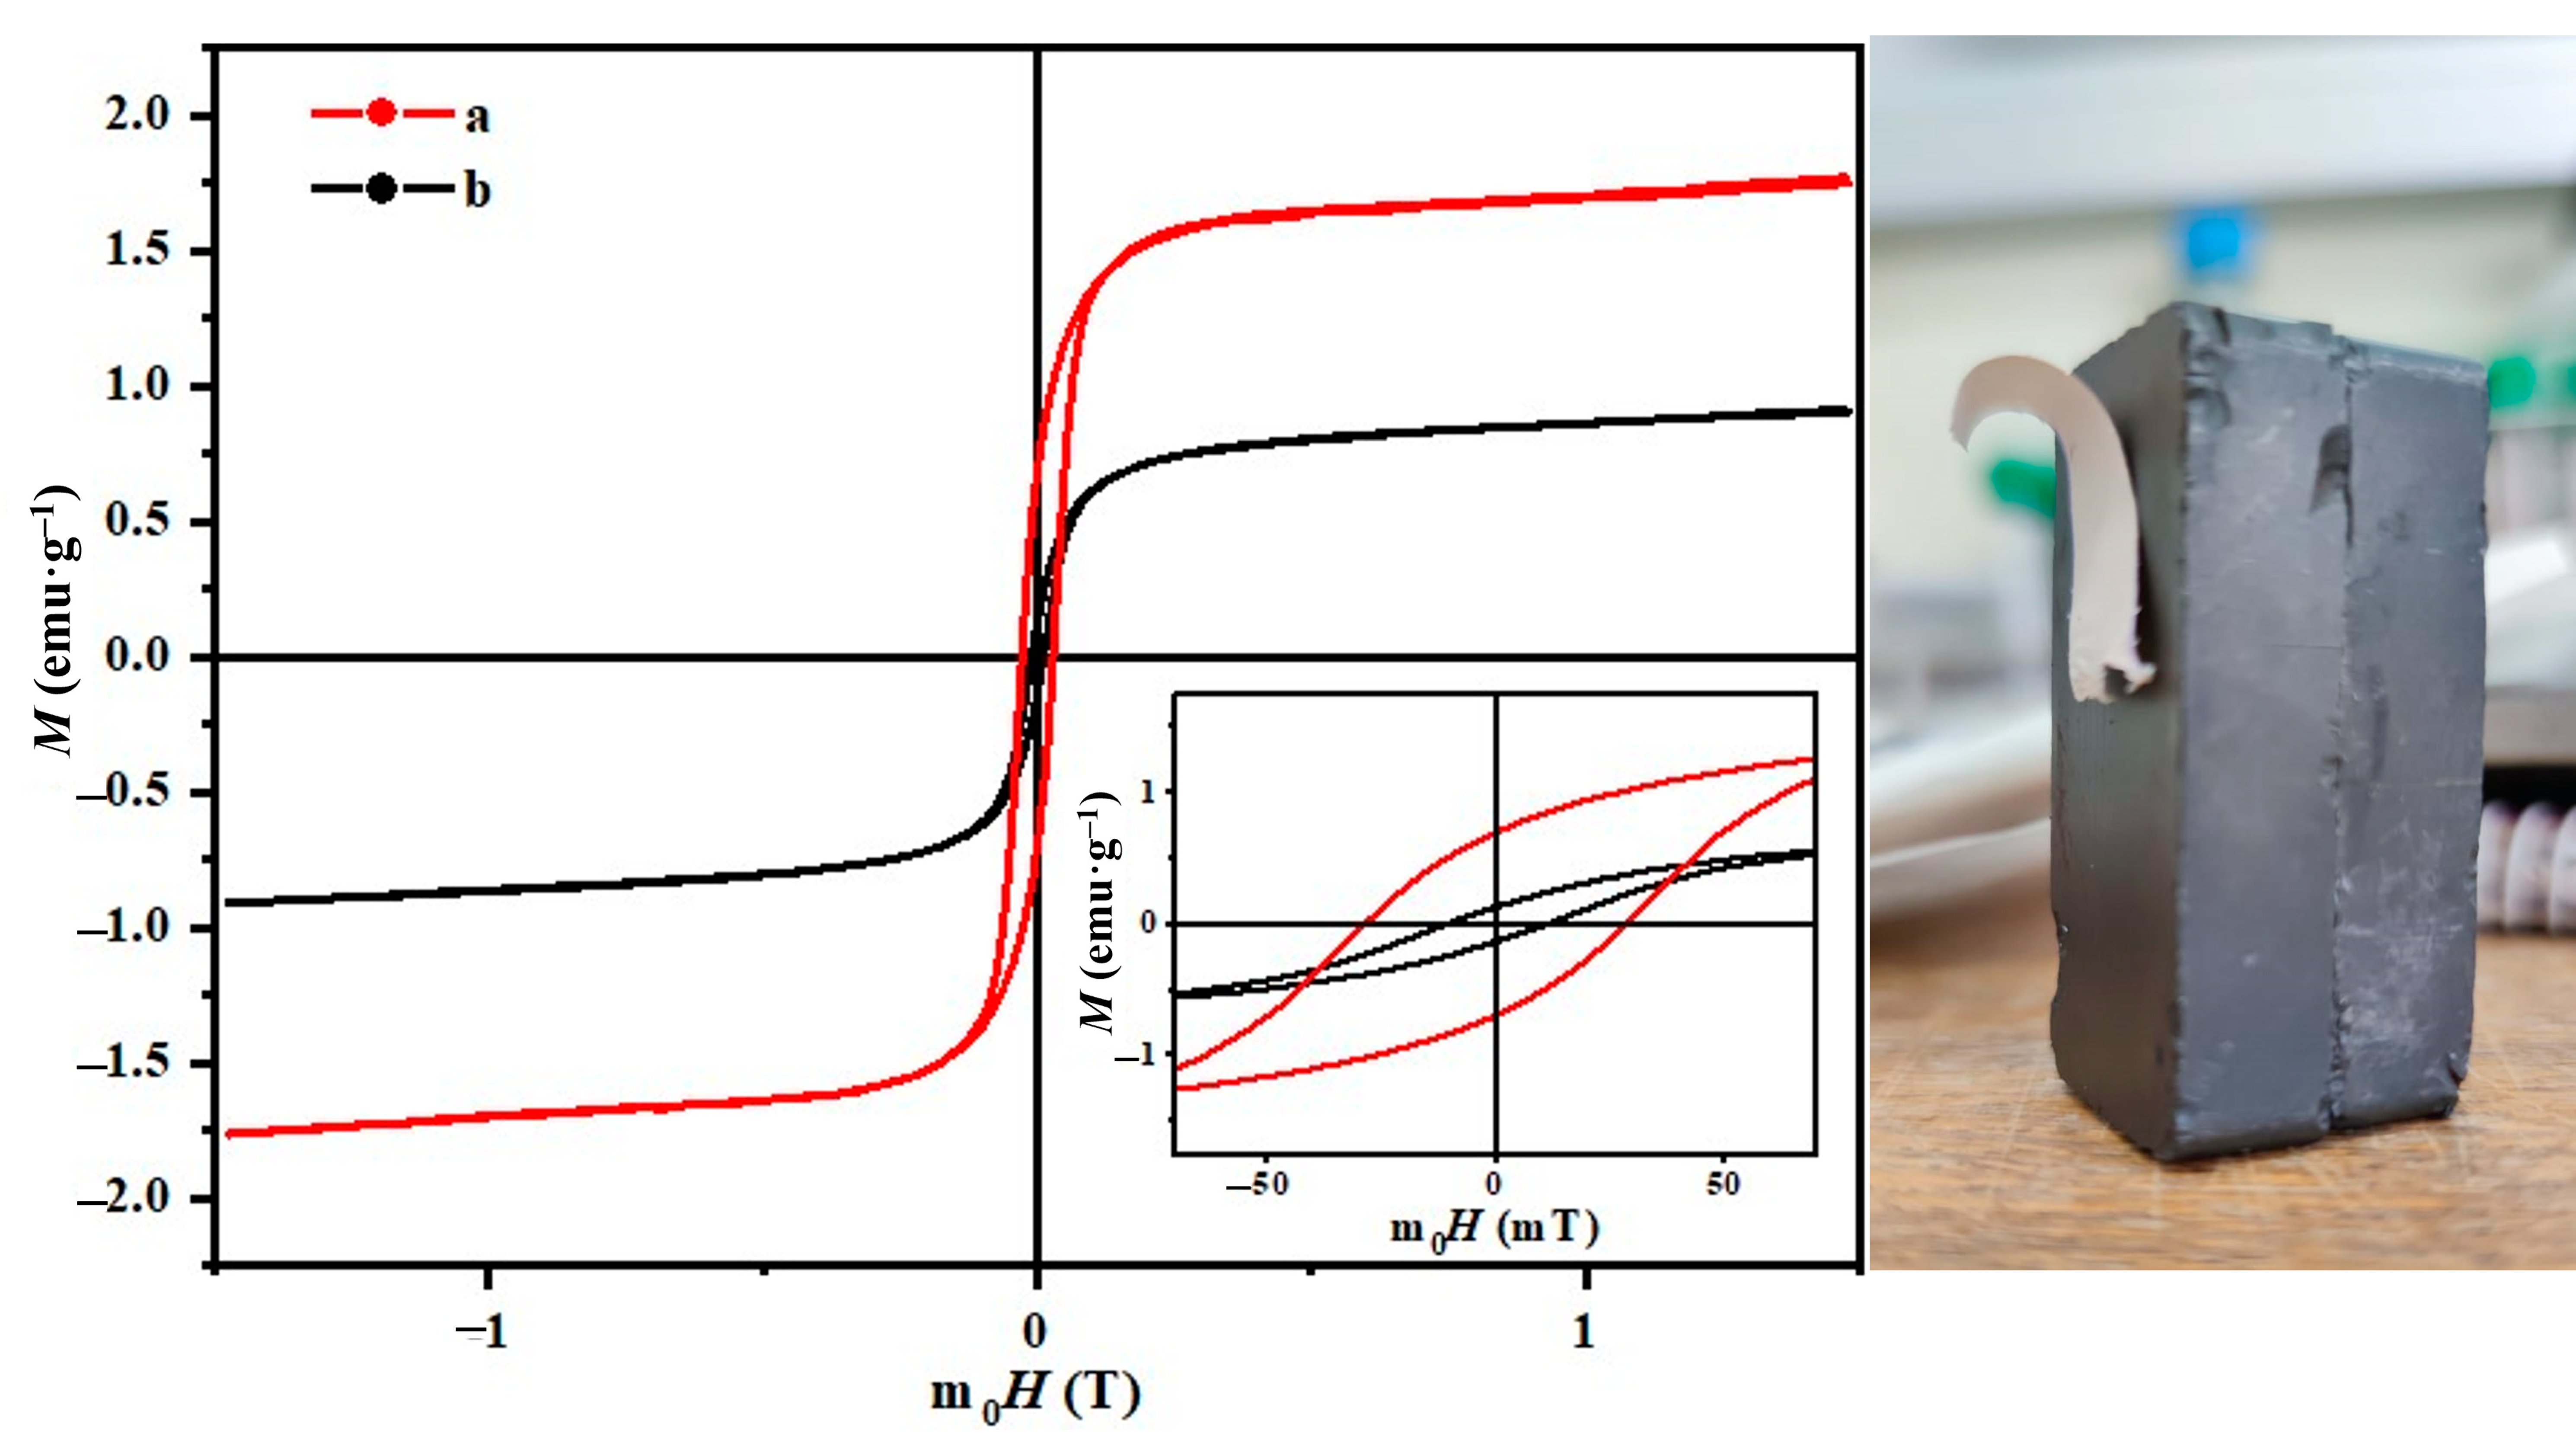
3.8.4. Fiber Magnetic Properties
3.8.5. Free Radical Inhibition Percentage (FRIP, %)
4. Conclusions
Author Contributions
Funding
Institutional Review Board Statement
Data Availability Statement
Acknowledgments
Conflicts of Interest
References
- Chaudhuri, S.K.; Malodia, L. Biosynthesis of zinc oxide nanoparticles using leaf extract of Calotropis gigantea: Characterization and its evaluation on tree seedling growth in nursery stage. Appl. Nanosci. 2017, 7, 501–512. [Google Scholar] [CrossRef]
- Li, G.; Jiang, Y.; Huang, K.; Ding, P.; Chen, J. Preparation and properties of magnetic Fe3O4—Chitosan nanoparticles. J. Alloys Compd. 2008, 466, 451–456. [Google Scholar] [CrossRef]
- Abdullah, J.A.A.; Perez-Puyana, V.; Guerrero, A.; Romero, A. Novel hybrid electrospun poly(ε-caprolactone) nanofibers containing green and chemical magnetic iron oxide nanoparticles. J. Appl. Polym. Sci. 2023. [Google Scholar] [CrossRef]
- Cornell, R.M.; Schwertmann, U. The Iron Oxides; John Wiley & Sons: Hoboken, NJ, USA, 2003; ISBN 9783527302741. [Google Scholar]
- Fernández-Remolar, D.C. Iron oxides, hydroxides and oxy-hydroxides. In Encyclopedia of Astrobiology; Springer: Berlin/Heidelberg, Germany, 2015; pp. 1268–1270. [Google Scholar]
- Maldonado-Camargo, L.; Unni, M.; Rinaldi, C. Magnetic characterization of iron oxide nanoparticles for biomedical applications. Methods Mol. Biol. 2017, 1570, 47–71. [Google Scholar] [CrossRef] [PubMed]
- Tran, N.; Mir, A.; Mallik, D.; Sinha, A.; Nayar, S.; Webster, T.J. Bactericidal effect of iron oxide nanoparticles on Staphylococcus aureus. Int. J. Nanomed. 2010, 5, 277–283. [Google Scholar] [CrossRef]
- Laurent, S.; Forge, D.; Port, M.; Roch, A.; Robic, C.; Vander Elst, L.; Muller, R.N. Magnetic Iron Oxide Nanoparticles: Synthesis, Stabilization, Vectorization, Physicochemical Characterizations, and Biological Applications. Chem. Rev. 2008, 108, 2064–2110. [Google Scholar] [CrossRef]
- Wang, Y.; Yang, Q.; Shan, G.; Wang, C.; Du, J.; Wang, S.; Li, Y.; Chen, X.; Jing, X.; Wei, Y. Preparation of silver nanoparticles dispersed in polyacrylonitrile nanofiber film spun by electrospinning. Mater. Lett. 2005, 59, 3046–3049. [Google Scholar] [CrossRef]
- Shankar, S.; Wang, L.-F.; Rhim, J. Effect of melanin nanoparticles on the mechanical, water vapor barrier, and antioxidant properties of gelatin-based films for food packaging application. Food Packag. Shelf Life 2019, 21, 100363. [Google Scholar] [CrossRef]
- Azam, A.; Ahmed, A.S.; Oves, M.; Khan, M.S.; Habib, S.S.; Memic, A. Antimicrobial activity of metal oxide nanoparticles against Gram-positive and Gram-negative bacteria: A comparative study. Int. J. Nanomed. 2012, 7, 6003–6009. [Google Scholar] [CrossRef]
- Singh, N.; Jenkins, G.J.S.; Asadi, R.; Doak, S.H. Potential toxicity of superparamagnetic iron oxide nanoparticles (SPION). Nano Rev. 2010, 1, 5358. [Google Scholar] [CrossRef]
- Mukherjee, P.; Ahmad, A.; Mandal, D.; Senapati, S.; Sainkar, S.R.; Khan, M.I.; Parishcha, R.; Ajaykumar, P.V.; Alam, M.; Kumar, R.; et al. Fungus-Mediated Synthesis of Silver Nanoparticles and Their Immobilization in the Mycelial Matrix: A Novel Biological Approach to Nanoparticle Synthesis. Nano Lett. 2001, 1, 515–519. [Google Scholar] [CrossRef]
- Toropov, N.; Vartanyan, T. Noble Metal Nanoparticles: Synthesis and Optical Properties. Compr. Nanosci. Nanotechnol. 2019, 61–88. [Google Scholar] [CrossRef]
- Zayed, M.F.; Eisa, W.H. Phoenix dactylifera L. leaf extract phytosynthesized gold nanoparticles; controlled synthesis and catalytic activity. Spectrochim. Acta Mol. Biomol. Spectrosc. 2014, 121, 238–244. [Google Scholar] [CrossRef] [PubMed]
- Bashir, M.; Riaz, S.; Naseem, S. Effect of pH on Ferromagnetic Iron Oxide Nanoparticles; Elsevier: Amsterdam, The Netherlands, 2015; Volume 2. [Google Scholar]
- Yu, X.; Yang, X.; Li, G. Magnetically Separable Fe2O3/g-C3N4 Nanocomposites with Cocoon-Like Shape: Magnetic Properties and Photocatalytic Activities. J. Electron. Mater. 2018, 47, 672–676. [Google Scholar] [CrossRef]
- Noruzi, M.; Zare, D.; Khoshnevisan, K.; Davoodi, D. Rapid green synthesis of gold nanoparticles using Rosa hybrida petal extract at room temperature. Spectrochim. Acta Part A Mol. Biomol. Spectrosc. 2011, 79, 1461–1465. [Google Scholar] [CrossRef] [PubMed]
- Abdullah, J.A.A.; Salah Eddine, L.; Abderrhmane, B.; Alonso-González, M.; Guerrero, A.; Romero, A.; Ahmed, J.A.; Salah, L.; Abderrhmane, B. Green synthesis and characterization of iron oxide nanoparticles by pheonix dactylifera leaf extract and evaluation of their antioxidant activity. Sustain. Chem. Pharm. 2020, 17, 100280. [Google Scholar] [CrossRef]
- Bibi, I.; Kamal, S.; Ahmed, A.; Iqbal, M.; Nouren, S.; Jilani, K.; Nazar, N.; Amir, M.; Abbas, A.; Ata, S.; et al. Nickel nanoparticle synthesis using Camellia sinensis as reducing and capping agent: Growth mechanism and photo-catalytic activity evaluation. Int. J. Biol. Macromol. 2017, 103, 783–790. [Google Scholar] [CrossRef] [PubMed]
- Abdullah, J.A.A.; Jiménez-Rosado, M.; Perez-Puyana, V.; Guerrero, A.; Romero, A. Green Synthesis of FexOy Nanoparticles with Potential Antioxidant Properties. Nanomaterials 2022, 12, 2449. [Google Scholar] [CrossRef]
- Yew, C.H.T.; Azari, P.; Choi, J.R.; Muhamad, F.; Pingguan-Murphy, B. Electrospun polycaprolactone nanofibers as a reaction membrane for lateral flow assay. Polymers 2018, 10, 1387. [Google Scholar] [CrossRef]
- ISO. Slotted Countersunk Flat Head Screws—Product Grade A iTeh STANDARD PREVIEW; ISO: Geneva, Switzerland, 2009. [Google Scholar]
- Ayachi, A.A.; Mechakra, H.; Silvan, M.M.; Boudjaadar, S.; Achour, S. Monodisperse α-Fe2O3 nanoplatelets: Synthesis and characterization. Ceram. Int. 2015, 41, 2228–2233. [Google Scholar] [CrossRef]
- Pecharromán, C.; González-Carreño, T.; Iglesias, J.E. The infrared dielectric properties of maghemite, γ-Fe2O3, from reflectance measurement on pressed powders. Phys. Chem. Miner. 1995, 22, 21–29. [Google Scholar] [CrossRef]
- Nakagiri, N.; Manghnani, M.H.; Ming, L.C.; Kimura, S. Crystal structure of magnetite under pressure. Phys. Chem. Miner. 1986, 13, 238–244. [Google Scholar] [CrossRef]
- El Mendili, Y.; Abdelouas, A.; Bardeau, J.-F. Insight into the mechanism of carbon steel corrosion under aerobic and anaerobic conditions. Phys. Chem. Chem. Phys. 2013, 15, 9197. [Google Scholar] [CrossRef] [PubMed]
- El Mendili, Y.; Bardeau, J.-F.; Randrianantoandro, N.; Grasset, F.; Greneche, J.-M. Insights into the Mechanism Related to the Phase Transition from γ-Fe2O3 to α-Fe2O3 Nanoparticles Induced by Thermal Treatment and Laser Irradiation. J. Phys. Chem. C 2012, 116, 23785–23792. [Google Scholar] [CrossRef]
- Wright, J.P.; Attfield, J.P.; Radaelli, P.G. Charge ordered structure of magnetite. Phys. Rev. B 2002, 66, 214422. [Google Scholar] [CrossRef]
- Haavik, C.; Stølen, S.; Fjellvåg, H.; Hanfland, M.; Häusermann, D. Equation of state of magnetite and its high-pressure modification: Thermodynamics of the Fe-O system at high pressure. Am. Miner. 2000, 85, 514–523. [Google Scholar] [CrossRef]
- Solano, E.; Frontera, C.; Puente Orench, I.; Puig, T.; Obradors, X.; Ricart, S.; Ros, J. Neutron and X-ray diffraction study of ferrite nanocrystals obtained by microwave-assisted growth. A structural comparison with the thermal synthetic route. Corrigendum. J. Appl. Crystallogr. 2014, 47, 1478. [Google Scholar] [CrossRef]
- Wright, J.P.; Bell, A.M.T.; Attfield, J.P. Variable temperature powder neutron diffraction study of the Verwey transition in magnetite Fe3O4. Solid State Sci. 2000, 2, 747–753. [Google Scholar] [CrossRef]
- Salgado, P.; Márquez, K.; Rubilar, O.; Contreras, D.; Vidal, G. The effect of phenolic compounds on the green synthesis of iron nanoparticles (FexOy-NPs) with photocatalytic activity. Appl. Nanosci. 2019, 9, 371–385. [Google Scholar] [CrossRef]
- Răcuciu, M.; Oancea, S. ATR-FTIR Versus Raman spectroscopy used for structural analyses of the iron oxide nanoparticles. Rom. Reports Phys. 2019, 71, 1–10. [Google Scholar]
- Zhang, S.; Wu, W.; Xiao, X.; Zhou, J.; Ren, F.; Jiang, C. Preparation and characterization of spindle-like Fe3O4 mesoporous nanoparticles. Nanoscale Res. Lett. 2011, 6, 89. [Google Scholar] [CrossRef] [PubMed]
- Nalbandian, L.; Patrikiadou, E.; Zaspalis, V.; Patrikidou, A.; Hatzidaki, E.; Papandreou, C.N. Magnetic Nanoparticles in Medical Diagnostic Applications: Synthesis, Characterization and Proteins Conjugation. Curr. Nanosci. 2015, 12, 455–468. [Google Scholar] [CrossRef]
- Bertolucci, E.; Galletti, A.M.R.; Antonetti, C.; Marracci, M.; Tellini, B.; Piccinelli, F.; Visone, C. Chemical and magnetic properties characterization of magnetic nanoparticles. In Proceedings of the 2015 IEEE International Instrumentation and Measurement Technology Conference (I2MTC), Piza, Italy, 11–14 May 2015; pp. 1492–1496. [Google Scholar] [CrossRef]
- Manzo, M.; Ahmed, H.; Nasrazadani, S. Study on emission spectral lines of hematite and magnetite for purity’s differentiation. AIP Adv. 2020, 10, 105327. [Google Scholar] [CrossRef]
- Noukelag, S.K.; Arendse, C.J.; Maaza, M. Biosynthesis of hematite phase a-Fe2O3 nanoparticles using an aqueous extract of Rosmarinus officinalis leaves. Mater. Today Proc. 2020, 43, 3679–3683. [Google Scholar] [CrossRef]
- Shamaila, S.; Sajjad, A.K.L.; Ryma, N.-A.; Farooqi, S.A.; Jabeen, N.; Majeed, S.; Farooq, I. Advancements in nanoparticle fabrication by hazard free eco-friendly green routes. Appl. Mater. Today 2016, 5, 150–199. [Google Scholar] [CrossRef]
- Rajeswari, V.D.; Khalifa, A.S.; Elfasakhany, A.; Badruddin, I.A.; Kamangar, S.; Brindhadevi, K. Green and ecofriendly synthesis of cobalt oxide nanoparticles using Phoenix dactylifera L: Antimicrobial and photocatalytic activity. Appl. Nanosci. 2021, 11, 1367–1375. [Google Scholar] [CrossRef]
- Chandrasekar, N.; Mohan Kumar, K.M.; Balasubramnian, K.S.; Karunamurthy, K.; Varadharajan, R. Facile synthesis of iron oxide, iron-cobalt and zero valent iron nanoparticles and evaluation of their anti microbial activity, free radicle scavenginging activity and antioxidant assay. Dig. J. Nanomater. Biostructures 2013, 8, 765–775. [Google Scholar]
- Li, Q.; Kartikowati, C.W.; Horie, S.; Ogi, T.; Iwaki, T.; Okuyama, K. Correlation between particle size/domain structure and magnetic properties of highly crystalline Fe3O4 nanoparticles. Sci. Rep. 2017, 7, 9894. [Google Scholar] [CrossRef]
- Wang, Y.; Ahn, J.; Kim, D.; Ren, W.J.J.; Liu, W.; Zhang, Z.D.D.; Choi, C.J.J. Effect of washing process on the magnetic properties of Nd-Fe-B nanoparticles prepared by reduction-diffusion method. J. Magn. Magn. Mater. 2017, 439, 91–94. [Google Scholar] [CrossRef]
- Chikazumi, S. Physics of Magnetism; Wiley: New York, NY, USA, 1964; ISBN 9780471155355. Available online: https://lccn.loc.gov/64014985 (accessed on 27 August 2023).
- Luna, C.; Morales, M.d.P.; Serna, C.J.; Vazquez, M. Multidomain to single-domain transition for uniform Co 80 Ni 20 nanoparticles. Nanotechnology 2003, 14, 268–272. [Google Scholar] [CrossRef]
- Jayanthi, S.A.; Nathan, D.M.G.T.; Jayashainy, J.; Sagayaraj, P. A novel hydrothermal approach for synthesizing α-Fe2O3, γ-Fe2O3 and Fe3O4 mesoporous magnetic nanoparticles. Mater. Chem. Phys. 2015, 162, 316–325. [Google Scholar] [CrossRef]
- Dowlath, M.J.H.; Musthafa, S.A.; Mohamed Khalith, S.B.; Varjani, S.; Karuppannan, S.K.; Ramanujam, G.M.; Arunachalam, A.M.; Arunachalam, K.D.; Chandrasekaran, M.; Chang, S.W.; et al. Comparison of characteristics and biocompatibility of green synthesized iron oxide nanoparticles with chemical synthesized nanoparticles. Environ. Res. 2021, 201, 111585. [Google Scholar] [CrossRef] [PubMed]
- Elizondo-Villarreal, N.; Verástegui-Domínguez, L.; Rodríguez-Batista, R.; Gándara-Martínez, E.; Alcorta-García, A.; Martínez-Delgado, D.; Rodríguez-Castellanos, E.A.; Vázquez-Rodríguez, F.; Gómez-Rodríguez, C. Green Synthesis of Magnetic Nanoparticles of Iron Oxide Using Aqueous Extracts of Lemon Peel Waste and Its Application in Anti-Corrosive Coatings. Materials 2022, 15, 8328. [Google Scholar] [CrossRef] [PubMed]
- Lemine, O.M.; Omri, K.; Zhang, B.; El Mir, L.; Sajieddine, M.; Alyamani, A.; Bououdina, M. Sol-gel synthesis of 8 nm magnetite (Fe3O4) nanoparticles and their magnetic properties. Superlattices Microstruct. 2012, 52, 793–799. [Google Scholar] [CrossRef]
- Iida, H.; Takayanagi, K.; Nakanishi, T.; Osaka, T. Synthesis of Fe3O4 nanoparticles with various sizes and magnetic properties by controlled hydrolysis. J. Colloid Interface Sci. 2007, 314, 274–280. [Google Scholar] [CrossRef] [PubMed]
- Baldassarre, F.; Cacciola, M.; Ciccarella, G. A predictive model of iron oxide nanoparticles flocculation tuning Z-potential in aqueous environment for biological application. J. Nanoparticle Res. 2015, 17, 1–21. [Google Scholar] [CrossRef]
- Zhao, X.; Zhou, L.; Shahid, M.; Rajoka, R.; Yan, L.; Shao, D.; Zhu, J.; Shi, J.; Huang, Q.; Yang, H. Critical Reviews in Biotechnology Fungal silver nanoparticles: Synthesis, application and challenges. Crit. Rev. Biotechnol. 2018, 38, 817–835. [Google Scholar] [CrossRef]
- Shah, S.T.; Yehye, W.A.; Chowdhury, Z.Z.; Simarani, K. Magnetically directed antioxidant and antimicrobial agent: Synthesis and surface functionalization of magnetite with quercetin. PeerJ 2019, 7, e7651. [Google Scholar] [CrossRef]
- Abdullah, J.A.A.; Díaz-García, Á.; Law, J.Y.; Romero, A.; Franco, V.; Guerrero, A. Quantifying the Structure and Properties of Nanomagnetic Iron Oxide Particles for Enhanced Functionality through Chemical Synthesis. Nanomaterials 2023, 13, 2242. [Google Scholar] [CrossRef]
- Mahdy, S.A.; Raheed, Q.J.; Kalaichelvan, P.T. Antimicrobial activity of zero-valent iron nanoparticles. Int. J. Mod. Eng. Res. 2012, 2, 578–581. [Google Scholar]
- Zeb, A. Concept, mechanism, and applications of phenolic antioxidants in foods. J. Food Biochem. 2020, 44, e13394. [Google Scholar] [CrossRef] [PubMed]
- Leopoldini, M.; Russo, N.; Toscano, M. The molecular basis of working mechanism of natural polyphenolic antioxidants. Food Chem. 2011, 125, 288–306. [Google Scholar] [CrossRef]
- Phenols, H.; Rhile, I.J.; Markle, T.F.; Nagao, H.; Dipasquale, A.G.; Lam, O.P.; Lockwood, M.A.; Rotter, K.; Mayer, J.M. Concerted Proton—Electron Transfer in the Oxidation of. J. Am. Chem. Soc. 2006, 128, 6075–6088. [Google Scholar]
- Perron, N.R.; Wang, H.C.; Deguire, S.N.; Jenkins, M.; Lawson, M.; Brumaghim, J.L. Kinetics of iron oxidation upon polyphenol binding. Dalt. Trans. 2010, 39, 9982–9987. [Google Scholar] [CrossRef] [PubMed]
- Perron, N.R.; Brumaghim, J.L. A review of the antioxidant mechanisms of polyphenol compounds related to iron binding. Cell Biochem. Biophys. 2009, 53, 75–100. [Google Scholar] [CrossRef] [PubMed]
- del Ángel-Sánchez, K.; Borbolla-Torres, C.I.; Palacios-Pineda, L.M.; Ulloa-Castillo, N.A.; Elías-Zúñiga, A. Development, Fabrication, and Characterization of Composite Polycaprolactone Membranes Reinforced with TiO2 Nanoparticles. Polymers 2019, 11, 1955. [Google Scholar] [CrossRef] [PubMed]
- Phothisarattana, D.; Harnkarnsujarit, N. Migration, aggregations and thermal degradation behaviors of TiO2 and ZnO incorporated PBAT/TPS nanocomposite blown films. Food Packag. Shelf Life 2022, 33, 100901. [Google Scholar] [CrossRef]
- Villasante, J.; Martin-Lujano, A.; Almajano, M.P. Characterization and application of gelatin films with pecan walnut and shell extract (Carya illinoiensis). Polymers 2020, 12, 1424. [Google Scholar] [CrossRef]
- Phothisarattana, D.; Wongphan, P.; Promhuad, K.; Promsorn, J.; Harnkarnsujarit, N. Biodegradable Poly(Butylene Adipate-Co-Terephthalate) and Thermoplastic Starch-Blended TiO2 Nanocomposite Blown Films as Functional Active Packaging of Fresh Fruit. Polymers 2021, 13, 4192. [Google Scholar] [CrossRef]
- Abdullah, J.A.A.; Jiménez-Rosado, M.; Guerrero, A.; Romero, A. Gelatin-Based Biofilms with FexOy-NPs Incorporated for Antioxidant and Antimicrobial Applications. Materials 2022, 15, 1966. [Google Scholar] [CrossRef]
- Lin, J.; Miao, L.; Zhong, G.; Lin, C.; Dargazangy, R.; Alexander-Katz, A. Understanding the synergistic effect of physicochemical properties of nanoparticles and their cellular entry pathways. Commun. Biol. 2020, 3, 205. [Google Scholar] [CrossRef]


| GNMIOPs | |||||||
|---|---|---|---|---|---|---|---|
| 1.2 | 7.5 | 12.5 | |||||
| Ethanol | H2O | ||||||
| 2θ (°) | Planes | 2θ (°) | Planes | 2θ (°) | Planes | 2θ (°) | Planes |
| 18.30 | (111) Fe2+ | 21.55 | (111) Fe2+ | 24.12 | (10-2) Fe3+ | 18.13 | (111) Fe3+ |
| 23.20 | (210) Fe3+ | 23.83 | (112) Fe2+ | 27.38 | (113) Fe2+ | 18.31 | (102) Fe2+ |
| 26.23 | (211) Fe3+ | 25.99 | (10-4) Fe2+ | 30.23 | (220) Fe2+ | 21.76 | (111) Fe2+ |
| 30.17 | (220) Fe3+ | 28.71 | (008) Fe3+ | 31.70 | (202) Fe2+ | 23.15 | (112) Fe2+ |
| 30.17 | (220) Fe2+ | 30.23 | (220) Fe2+ | 33.17 | (104) Fe3+ | 24.12 | (10-4) Fe2+ |
| 31.64 | (−104) Fe2+ | 33.12 | (202) Fe2+ | 35.68 | (2-10) Fe3+ | 26.44 | (104) Fe2+ |
| 33.17 | (310) Fe3+ | 35.56 | (20-4) Fe3+ | 39.02 | (006) Fe3+ | 30.04 | (220) Fe2+ |
| 35.62 | (311) Fe3+ | 38.57 | (311) Fe2+ | 40.94 | (2-13) Fe3+ | 31.80 | (202) Fe2+ |
| 39.17 | (320) Fe3+ | 39.59 | (222) Fe2+ | 43.29 | (202) Fe3+ | 35.31 | (311) Fe2+ |
| 40.82 | (321) Fe3+ | 41.74 | (40-6) Fe3+ | 45.47 | (030) Fe2+ | 36.90 | (222) Fe2+ |
| 43.29 | (400) Fe3+ | 43.22 | (021) Fe3+ | 49.51 | (20-4) Fe3+ | 37.11 | (202) Fe2+ |
| 45.40 | (411) Fe3+ | 44.37 | (400) Fe2+ | 54.09 | (2-16) Fe3+ | 38.72 | (116) Fe2+ |
| 47.52 | (331) Fe3+ | 45.47 | (030) Fe2+ | 56.48 | (3-12) Fe3+ | 39.50 | (006) Fe3+ |
| 49.26 | (420) Fe3+ | 46.34 | (331) Fe2+ | 57.40 | (10-8) Fe3+ | 43.05 | (400) Fe2+ |
| 50.79 | (421) Fe3+ | 49.44 | (312) Fe2+ | 62.77 | (3-14) Fe3+ | 45.52 | (030) Fe2+ |
| 53.91 | (422) Fe3+ | 51.04 | (304) Fe2+ | 64.01 | (300) Fe3+ | 48.74 | (311) Fe2+ |
| 57.34 | (511) Fe3+ | 53.74 | (422) Fe2+ | 51.30 | (304) Fe2+ | ||
| 60.57 | (521) Fe3+ | 55.32 | (230) Fe2+ | 53.18 | (422) Fe2+ | ||
| 57.15 | (511) Fe2+ | 56.66 | (511) Fe2+ | ||||
| 59.36 | (136) Fe2+ | 59.07 | (227) Fe2+ | ||||
| 62.78 | (440) Fe2+ | 62.29 | (440) Fe2+ | ||||
| 64.19 | (410) Fe2+ | 64.07 | (531) Fe3+ | ||||
| 65.43 | (412) Fe2+ | 66.41 | (442) Fe2+ | ||||
| 66.58 | (531) Fe2+ | ||||||
| 67.62 | (332) Fe2+ | ||||||
| Samples | GNMIOPs | |||||||
|---|---|---|---|---|---|---|---|---|
| pH | 1.2 | 7.5 | 12.5 | |||||
| Ethanol | H2O | |||||||
| Crystal system/phase (%) | Fe3+ | Fe2+ | Fe3+ | Fe2+ | Fe3+ | Fe2+ | Fe3+ | Fe2+ |
| Monoclinic | 6.0 | 15.6 | 19.0 | 4.3 | ||||
| Trigonal (hexagonal axis) | 8.6 | 62.4 | 1 | 1.1 | ||||
| Trigonal (rhombohedral axis) | ||||||||
| Rhombohedral | ||||||||
| Cubic | 78.2 | 7.2 | 84.4 | 17 | 3.4 | 91.2 | ||
| Tetragonal | 0.6 | |||||||
| Total | 78.2 | 21.8 | 15.6 | 84.4 | 62.4 | 37.6 | 3.4 | 94.6 |
| Sample | GNMIOPs | |||
|---|---|---|---|---|
| pH/Washing Solvent | 1.2 | 7.5 | 12.5 | |
| Ethanol | H2O | |||
| Crystallinity% | 89.9 | 95.2 | 91.1 | 99.0 |
| D XRD (nm) | 21.3 ± 1.4 b | 17.8 ± 1.0 c | 23.5 ± 0.6 a | 6.6 ± 4.9 d |
| D SEM (nm) | 18.6 ± 1.1 b | 14.2 ± 0.5 c | 20.8 ± 0.1 a | 8.3 ± 0.9 d |
| D TEM (nm) | 20.7 ± 1.0 b | 12.4 ± 0.5 c | 22.2 ± 0.4 a | 10.6 ± 0.2 d |
| IC50 (mg/mL) | 5.6 ± 0.2 a | 0.9 ± 0.1 c | 2.1 ± 0.0 b | 0.7 ± 0.0 d |
| Sample | GNMIOPs | |||
|---|---|---|---|---|
| Parameter | 1.2 | 7.5 | 12.5 | |
| Ethanol | H2O | |||
| Ms (emu/g) | 57.5 c | 64.9 a | 49.3 d | 62.4 b |
| Hc (Oe) | 144.8 a | 126.4 b | 82.4 d | 120.4 c |
| Mr (emu/g) | 23.4 a | 21.7 b | 10.2 d | 16.0 c |
| Mr/Ms | 0.41 | 0.33 | 0.21 | 0.26 |
| Zeta potential (mV) | −38.9 b | −31.8 d | −41.6 a | −35.1 c |
| Synthesis Method | Ms (emu/g) | Hc (Oe) | Mr (emu/g) | Size (nm) | Phase | Reference |
|---|---|---|---|---|---|---|
| GNMIOPs (pH 1.2) | 57.5 | 144.8 | 23.4 | 21.3 | Fe2O3 (78.2%) | This study |
| GNMIOPs (pH 7.5) | 64.9 | 126.4 | 21.7 | 17.8 | Fe3O4 (84.4%) | This study |
| GNMIOPs (pH 12.5) | 62.4 | 120.4 | 16.0 | 6.6 | Fe3O4 (94.6%) | This study |
| GNMIOPs (pH 7.5, H2O) | 49.3 | 82.4 | 10.2 | 23.5 | Fe3O4 (62.4%) | This study |
| Hydrothermal | 1.9 | 415.0 | 0.7 | 52.1 | Fe2O3 | [47] |
| Hydrothermal | 58.6 | 330.4 | 16.7 | 13.2 | γ–Fe2O3 | [47] |
| Hydrothermal | 40.3 | 381.6 | 13.1 | 14.3 | Fe3O4 | [47] |
| Green | 60 | - | 110 | 13.0 | FeO | [48] |
| Green | 50 | - | - | - | Fe3O4 | [49] |
| Co-precipitation | 2 | - | 155 | 23.0 | FeO | [48] |
| Modified sol–gel | 47 | - | 0.7 | 8.0 | Fe3O4 | [50] |
| Hydrolysis | 55.4 | - | 9.8 | 9.0 | Fe3O4 | [51] |
| Sample | Davg (nm) | Ms (emu/g) | Mr (emu/g) | Hc (mT) | RMS (nm) | Ra (nm) | FRIP (%) |
|---|---|---|---|---|---|---|---|
| a | 253 ± 109 | - | - | - | 21 ± 13 | 18 ± 10 | 21 |
| b | 288 ± 124 | 1.8 | 0.7 | 10.9 | 72 ± 10 | 56 ± 8 | 58 |
| c | 365 ± 178 | 0.9 | 0.1 | 28.3 | 85 ± 26 | 73 ± 22 | 52 |
Disclaimer/Publisher’s Note: The statements, opinions and data contained in all publications are solely those of the individual author(s) and contributor(s) and not of MDPI and/or the editor(s). MDPI and/or the editor(s) disclaim responsibility for any injury to people or property resulting from any ideas, methods, instructions or products referred to in the content. |
© 2023 by the authors. Licensee MDPI, Basel, Switzerland. This article is an open access article distributed under the terms and conditions of the Creative Commons Attribution (CC BY) license (https://creativecommons.org/licenses/by/4.0/).
Share and Cite
Abdullah, J.A.A.; Díaz-García, Á.; Law, J.Y.; Romero, A.; Franco, V.; Guerrero, A. Sustainable Nanomagnetism: Investigating the Influence of Green Synthesis and pH on Iron Oxide Nanoparticles for Enhanced Biomedical Applications. Polymers 2023, 15, 3850. https://doi.org/10.3390/polym15183850
Abdullah JAA, Díaz-García Á, Law JY, Romero A, Franco V, Guerrero A. Sustainable Nanomagnetism: Investigating the Influence of Green Synthesis and pH on Iron Oxide Nanoparticles for Enhanced Biomedical Applications. Polymers. 2023; 15(18):3850. https://doi.org/10.3390/polym15183850
Chicago/Turabian StyleAbdullah, Johar Amin Ahmed, Álvaro Díaz-García, Jia Yan Law, Alberto Romero, Victorino Franco, and Antonio Guerrero. 2023. "Sustainable Nanomagnetism: Investigating the Influence of Green Synthesis and pH on Iron Oxide Nanoparticles for Enhanced Biomedical Applications" Polymers 15, no. 18: 3850. https://doi.org/10.3390/polym15183850
APA StyleAbdullah, J. A. A., Díaz-García, Á., Law, J. Y., Romero, A., Franco, V., & Guerrero, A. (2023). Sustainable Nanomagnetism: Investigating the Influence of Green Synthesis and pH on Iron Oxide Nanoparticles for Enhanced Biomedical Applications. Polymers, 15(18), 3850. https://doi.org/10.3390/polym15183850