
Hydrogen Permeability of Polyamide 6 Used as Liner Material for Type IV On-Board Hydrogen Storage Cylinders

 ,
,  ,
, 
Abstract
:1. Introduction
2. Experimental
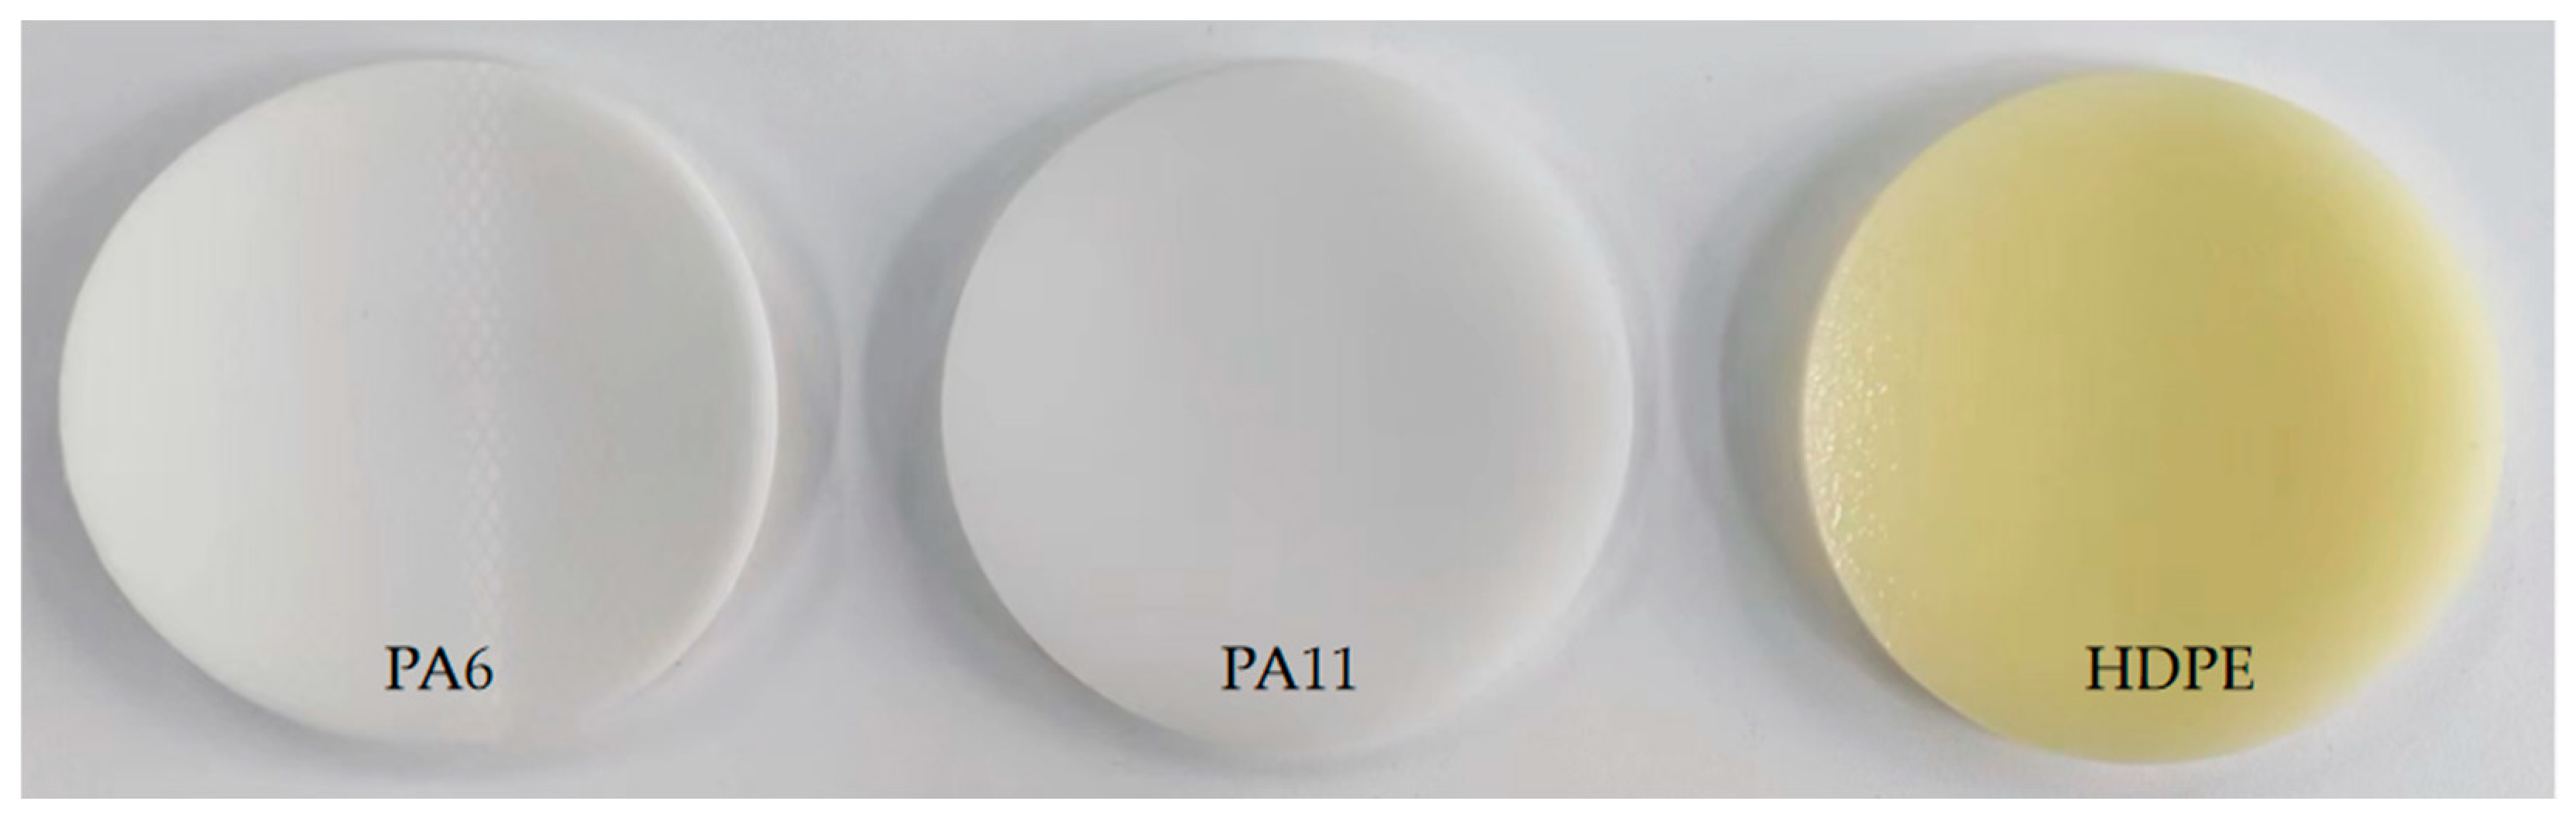
2.1. Sample Preparation
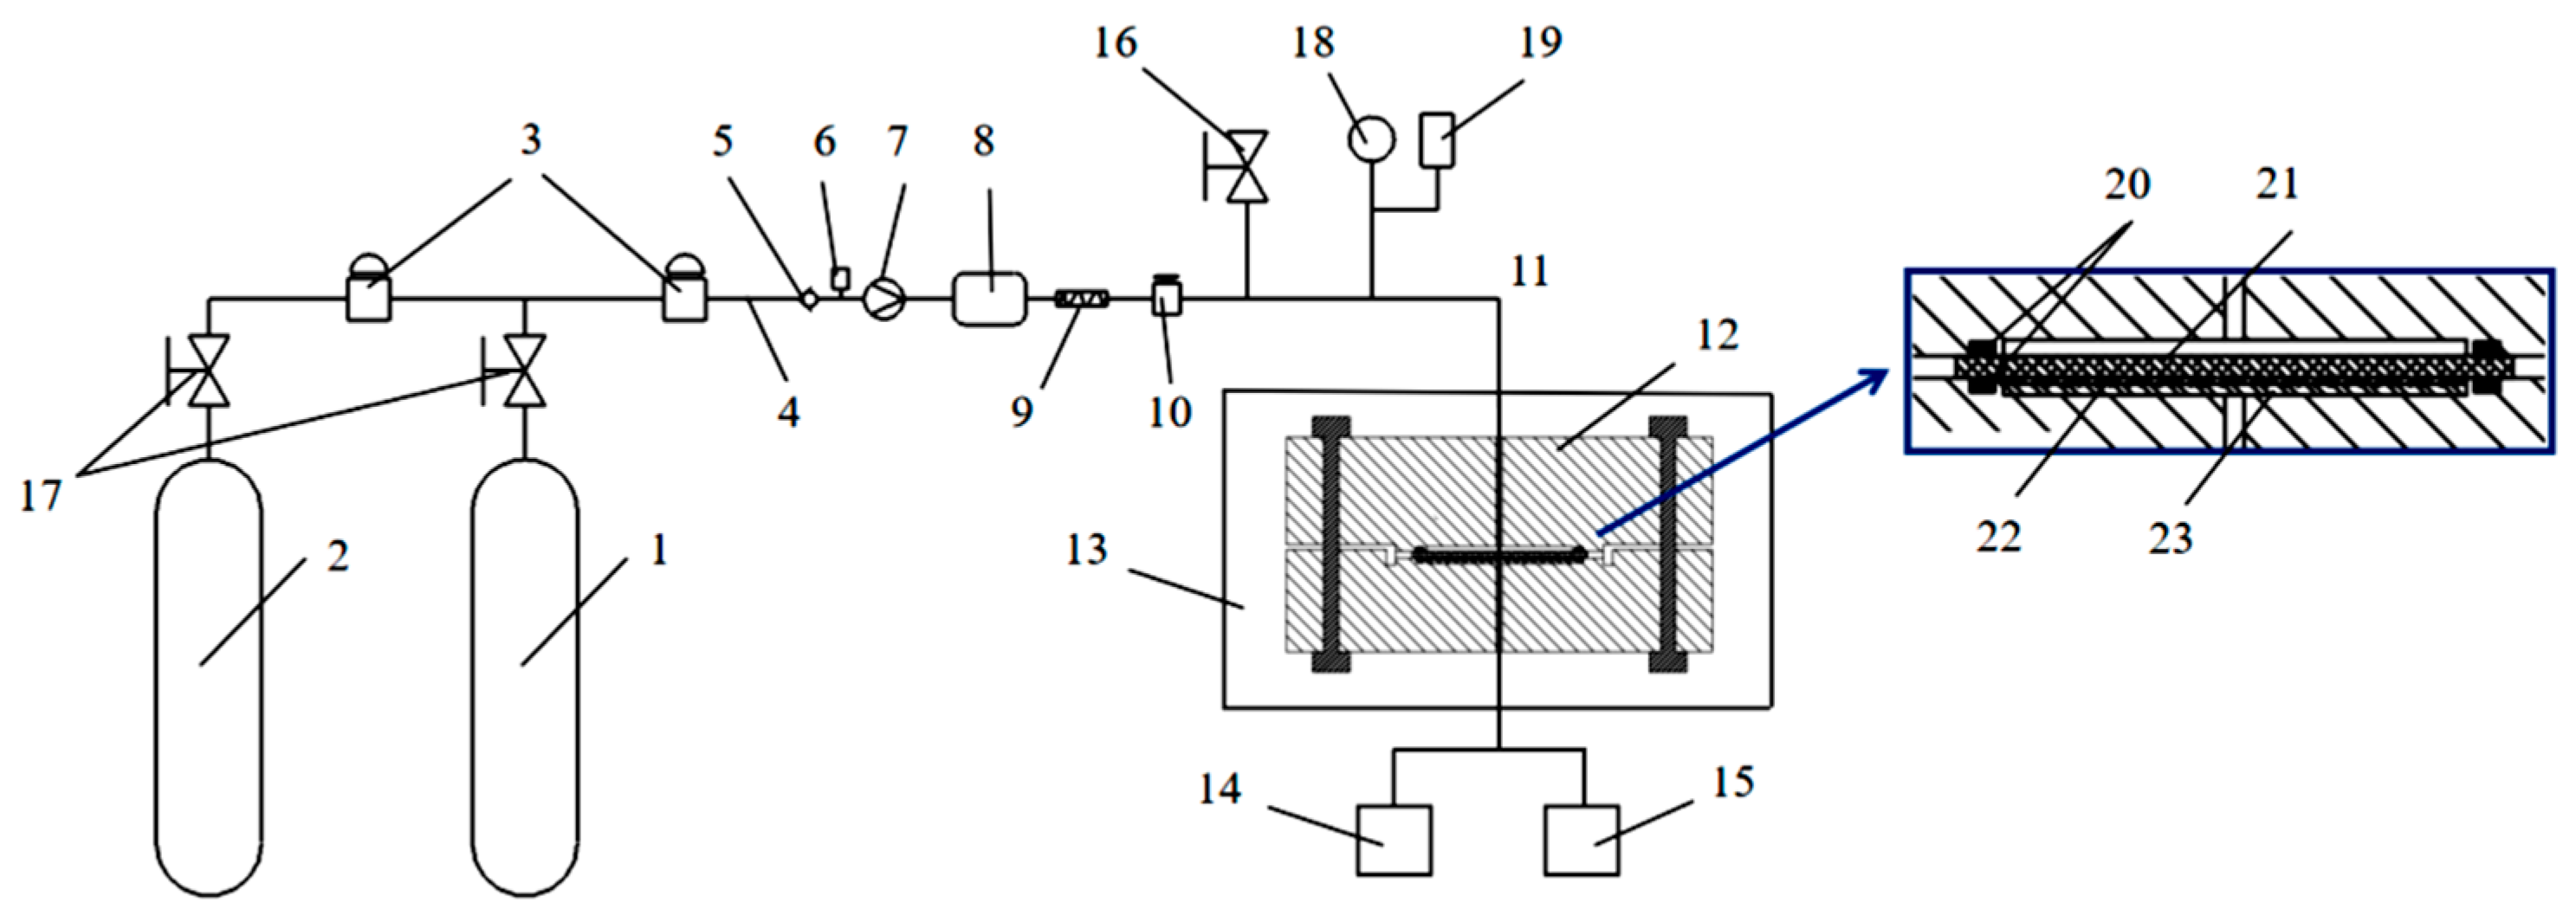
2.2. Hydrogen Permeation Test Device and Test Procedure
2.3. Test Method for Hydrogen Permeability of Materials
3. Results and Discussion
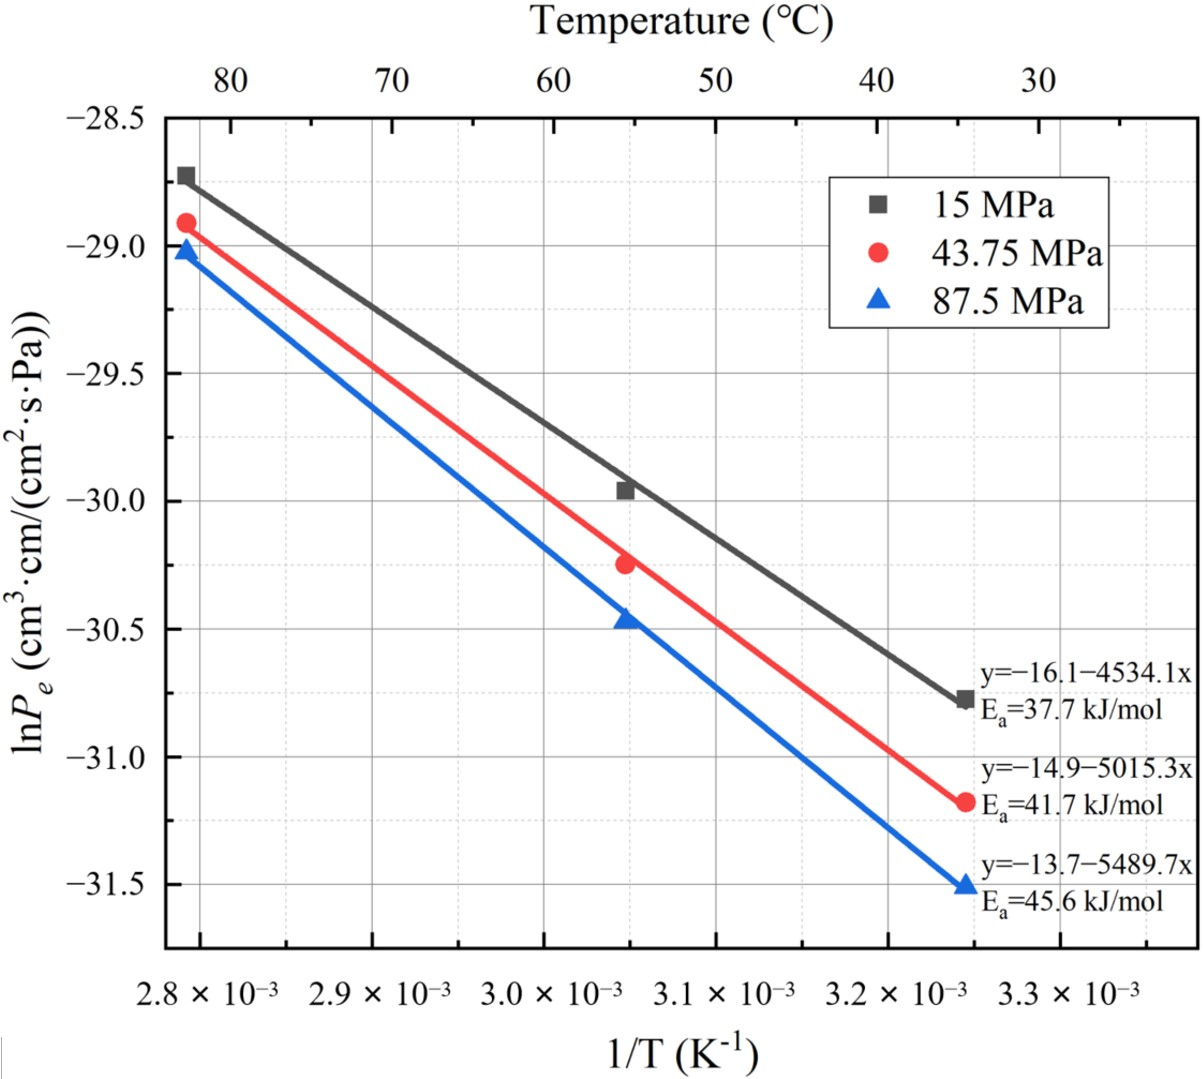
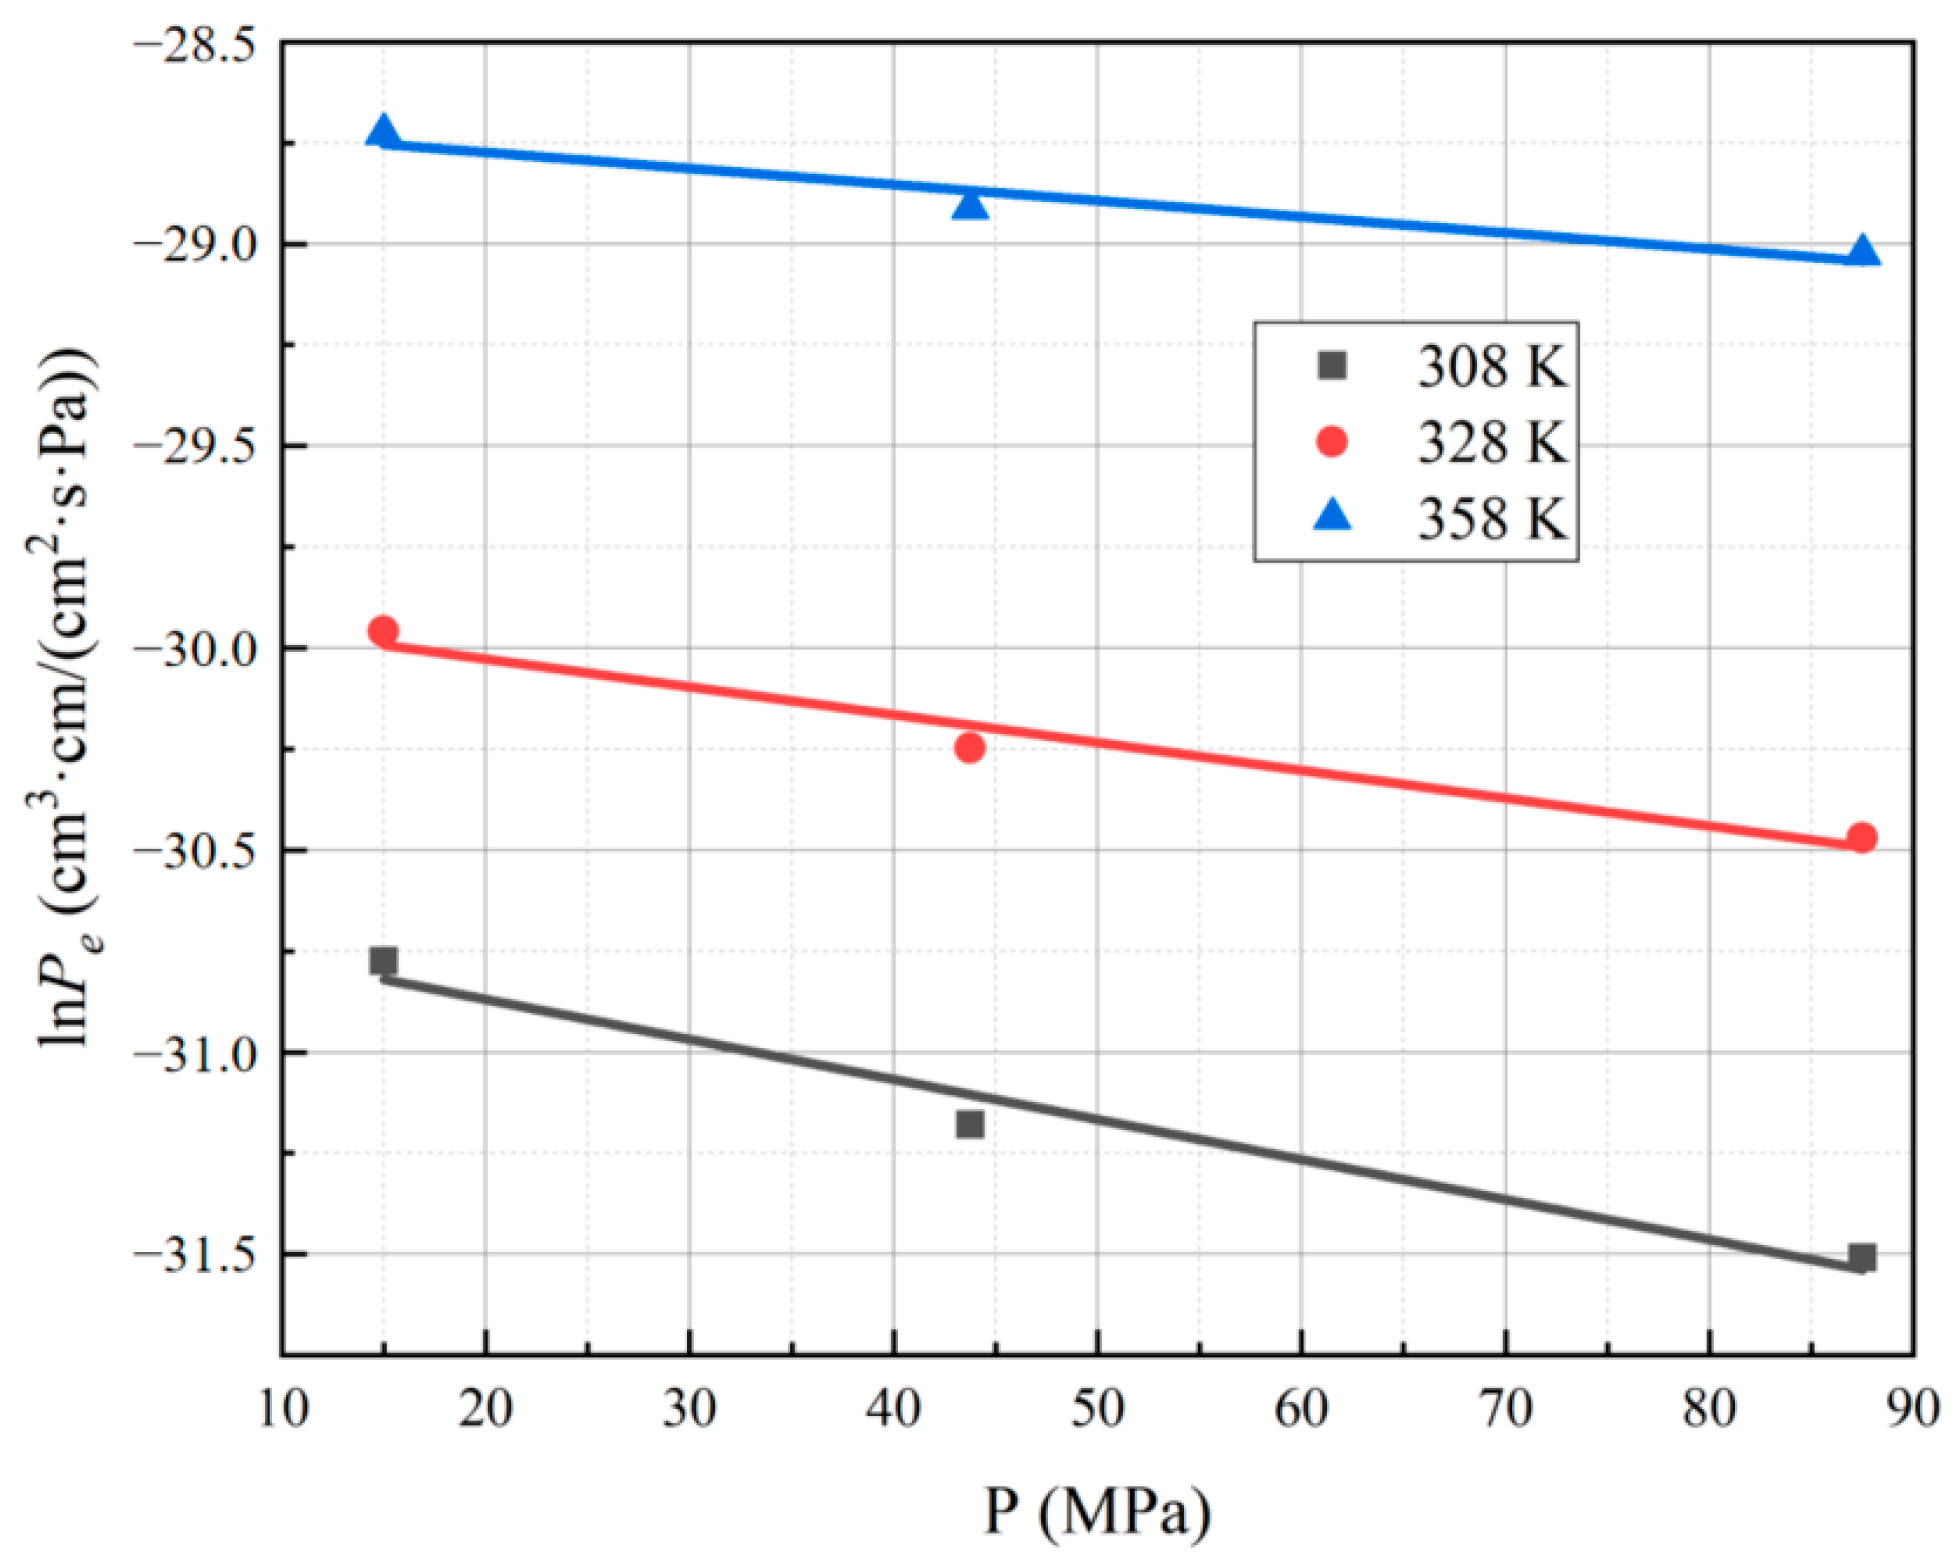
3.1. Effect of Different Test Temperatures and Pressures on the Hydrogen Permeability Coefficient of PA6
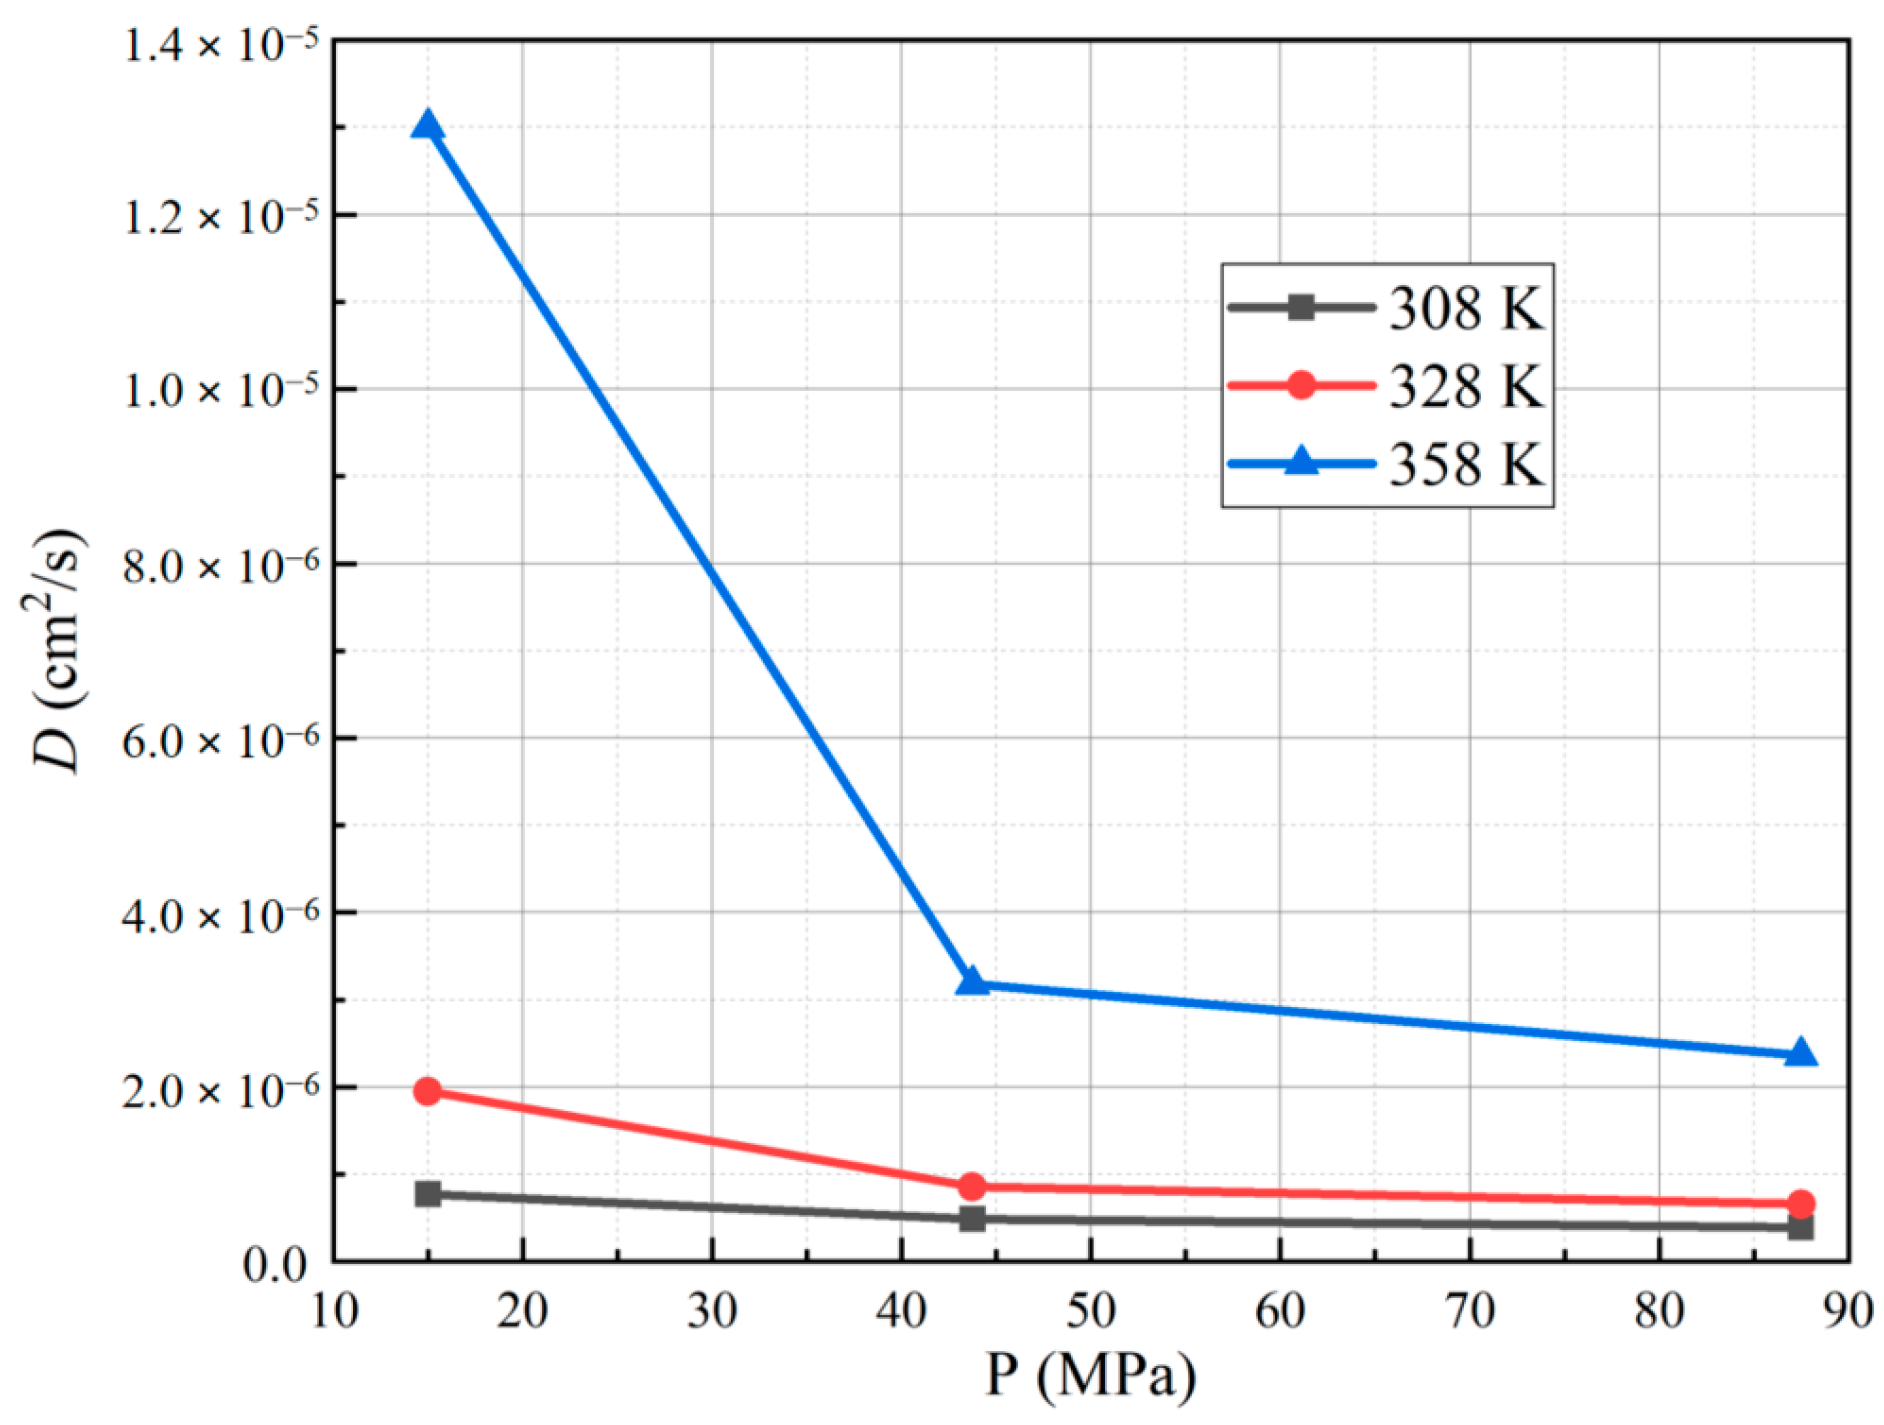
3.2. Effect of Different Test Temperatures and Pressures on the Diffusion Coefficient of PA6
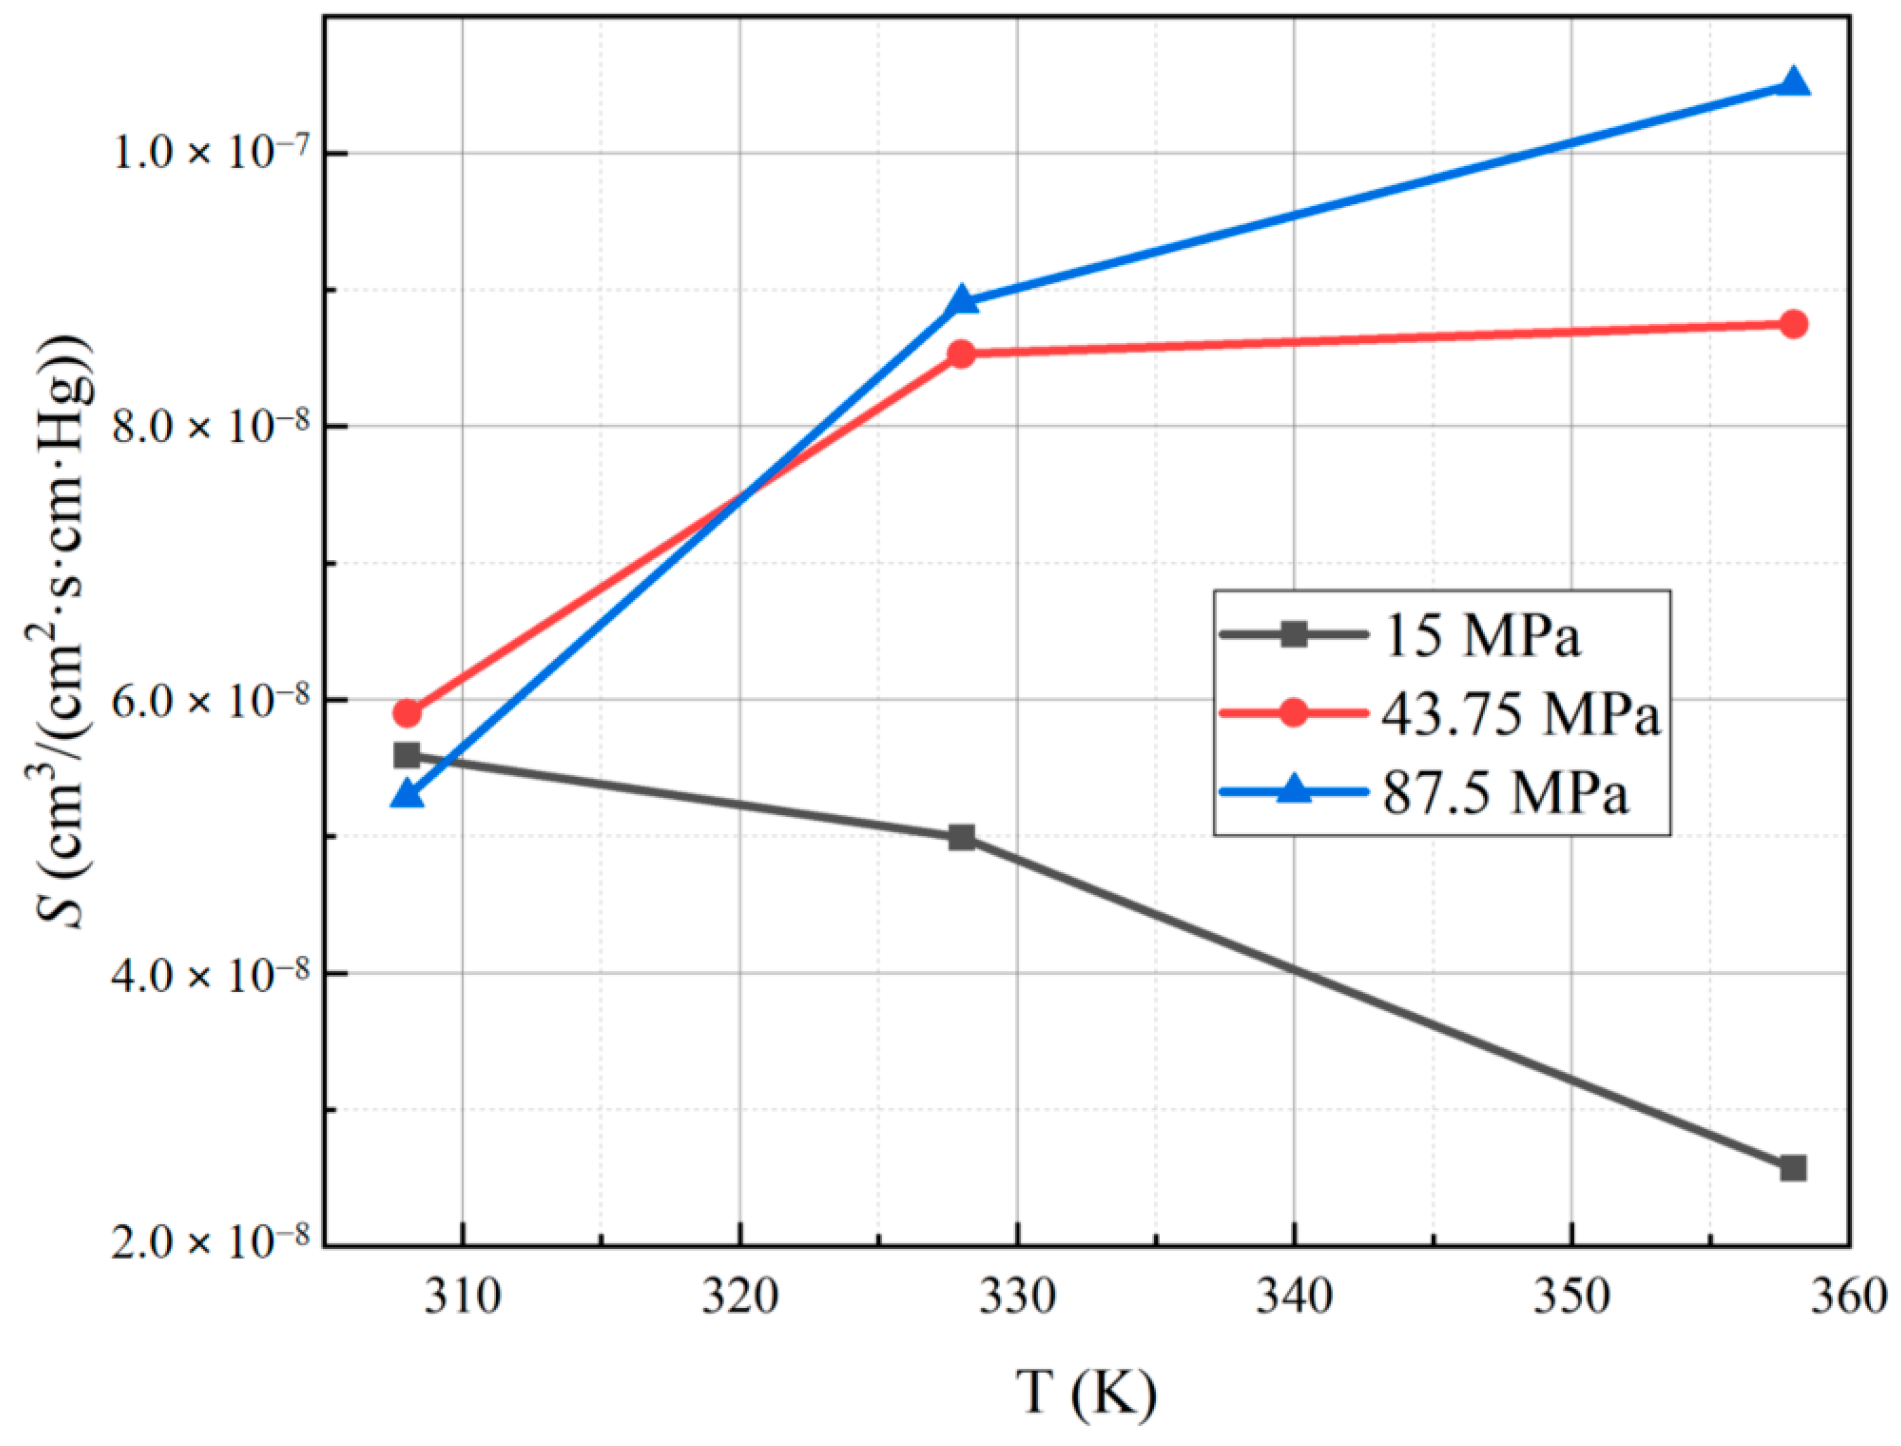
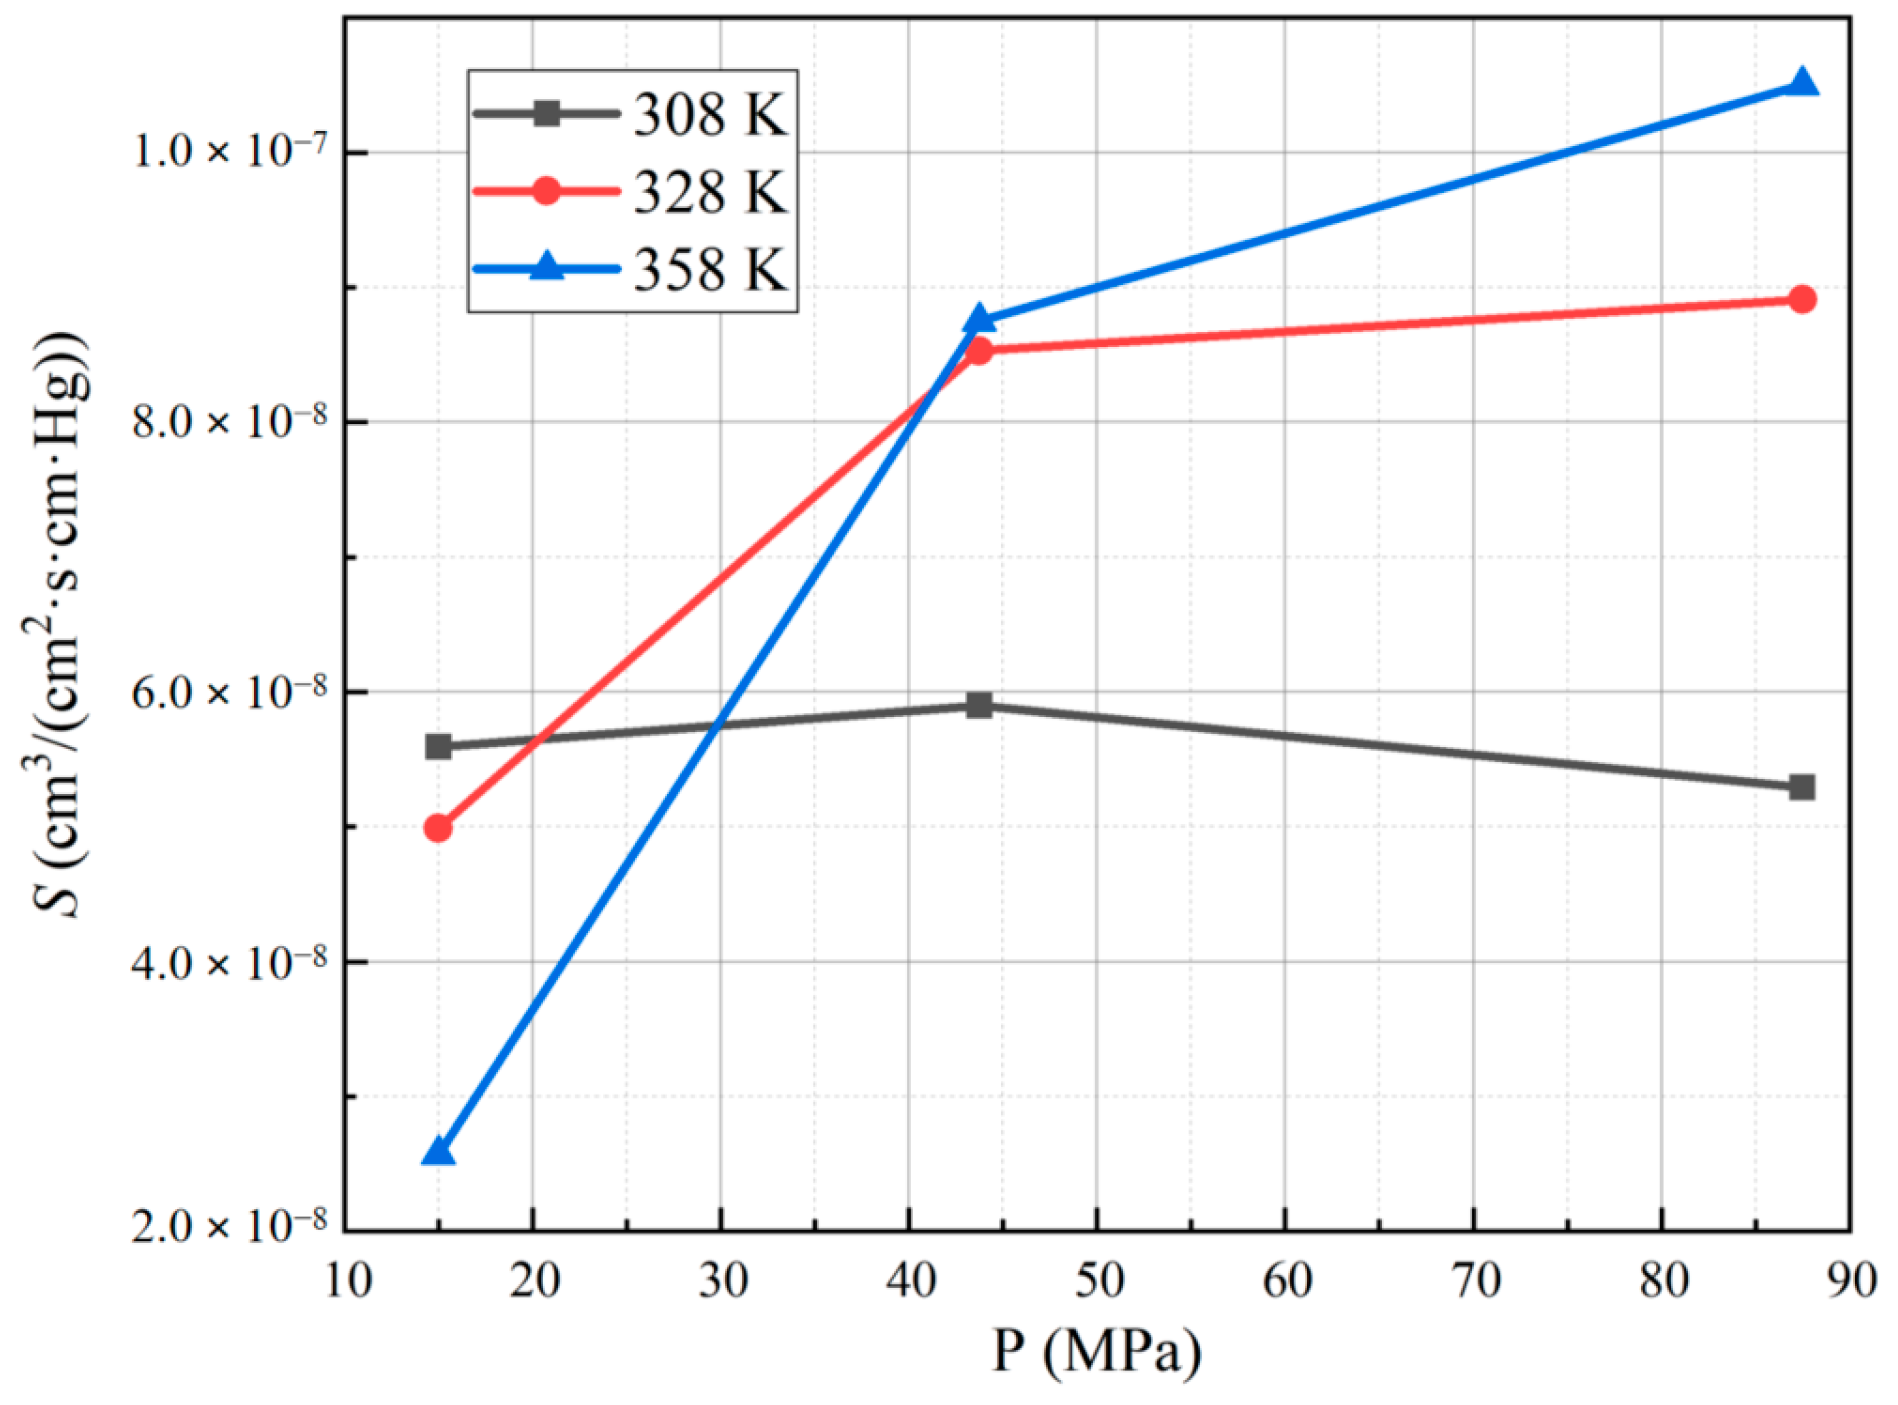
3.3. Effect of Different Test Temperatures and Pressures on the Solubility Coefficient of PA6
3.4. Differences in Hydrogen Permeability among Commonly Used Liner Materials for Type IV On-Board Hydrogen Storage Cylinders
4. Conclusions and Prospect
- (1)
- The logarithm of the hydrogen permeability coefficient for PA6 demonstrates a linear relationship with the reciprocal of temperature, and the hydrogen permeability coefficient of the material increases with higher test temperatures. Additionally, the logarithm of the hydrogen permeability coefficient for PA6 exhibits a linear relationship with the test pressure, and the hydrogen permeability coefficient of the material decreases with higher test pressures.
- (2)
- The diffusion coefficient of PA6 increases with higher test temperatures, and the lower the pressure, the more pronounced the increase in the diffusion coefficient. Additionally, the diffusion coefficient of PA6 decreases with higher test pressures, and the higher the temperature, the more pronounced the decrease in the diffusion coefficient. Notably, the solubility coefficient of PA6 does not show a significant dependence on the test temperature and pressure.
- (3)
- At a test temperature of 288 K and a pressure of 70 MPa, it is observed that compared to PA6, the hydrogen permeability coefficients of PA11 and HDPE increase by approximately 8.7% and 242%, respectively. Similarly, the diffusion coefficients of PA11 and HDPE increase by about 12.5% and 350%, respectively, relative to PA6. On the other hand, the solubility coefficients of the three materials do not exhibit significant differences. Among the three materials, PA6 has slightly stronger hydrogen permeation resistance than PA11, while HDPE has the least resistance.
Author Contributions
Funding
Institutional Review Board Statement
Data Availability Statement
Conflicts of Interest
Appendix A

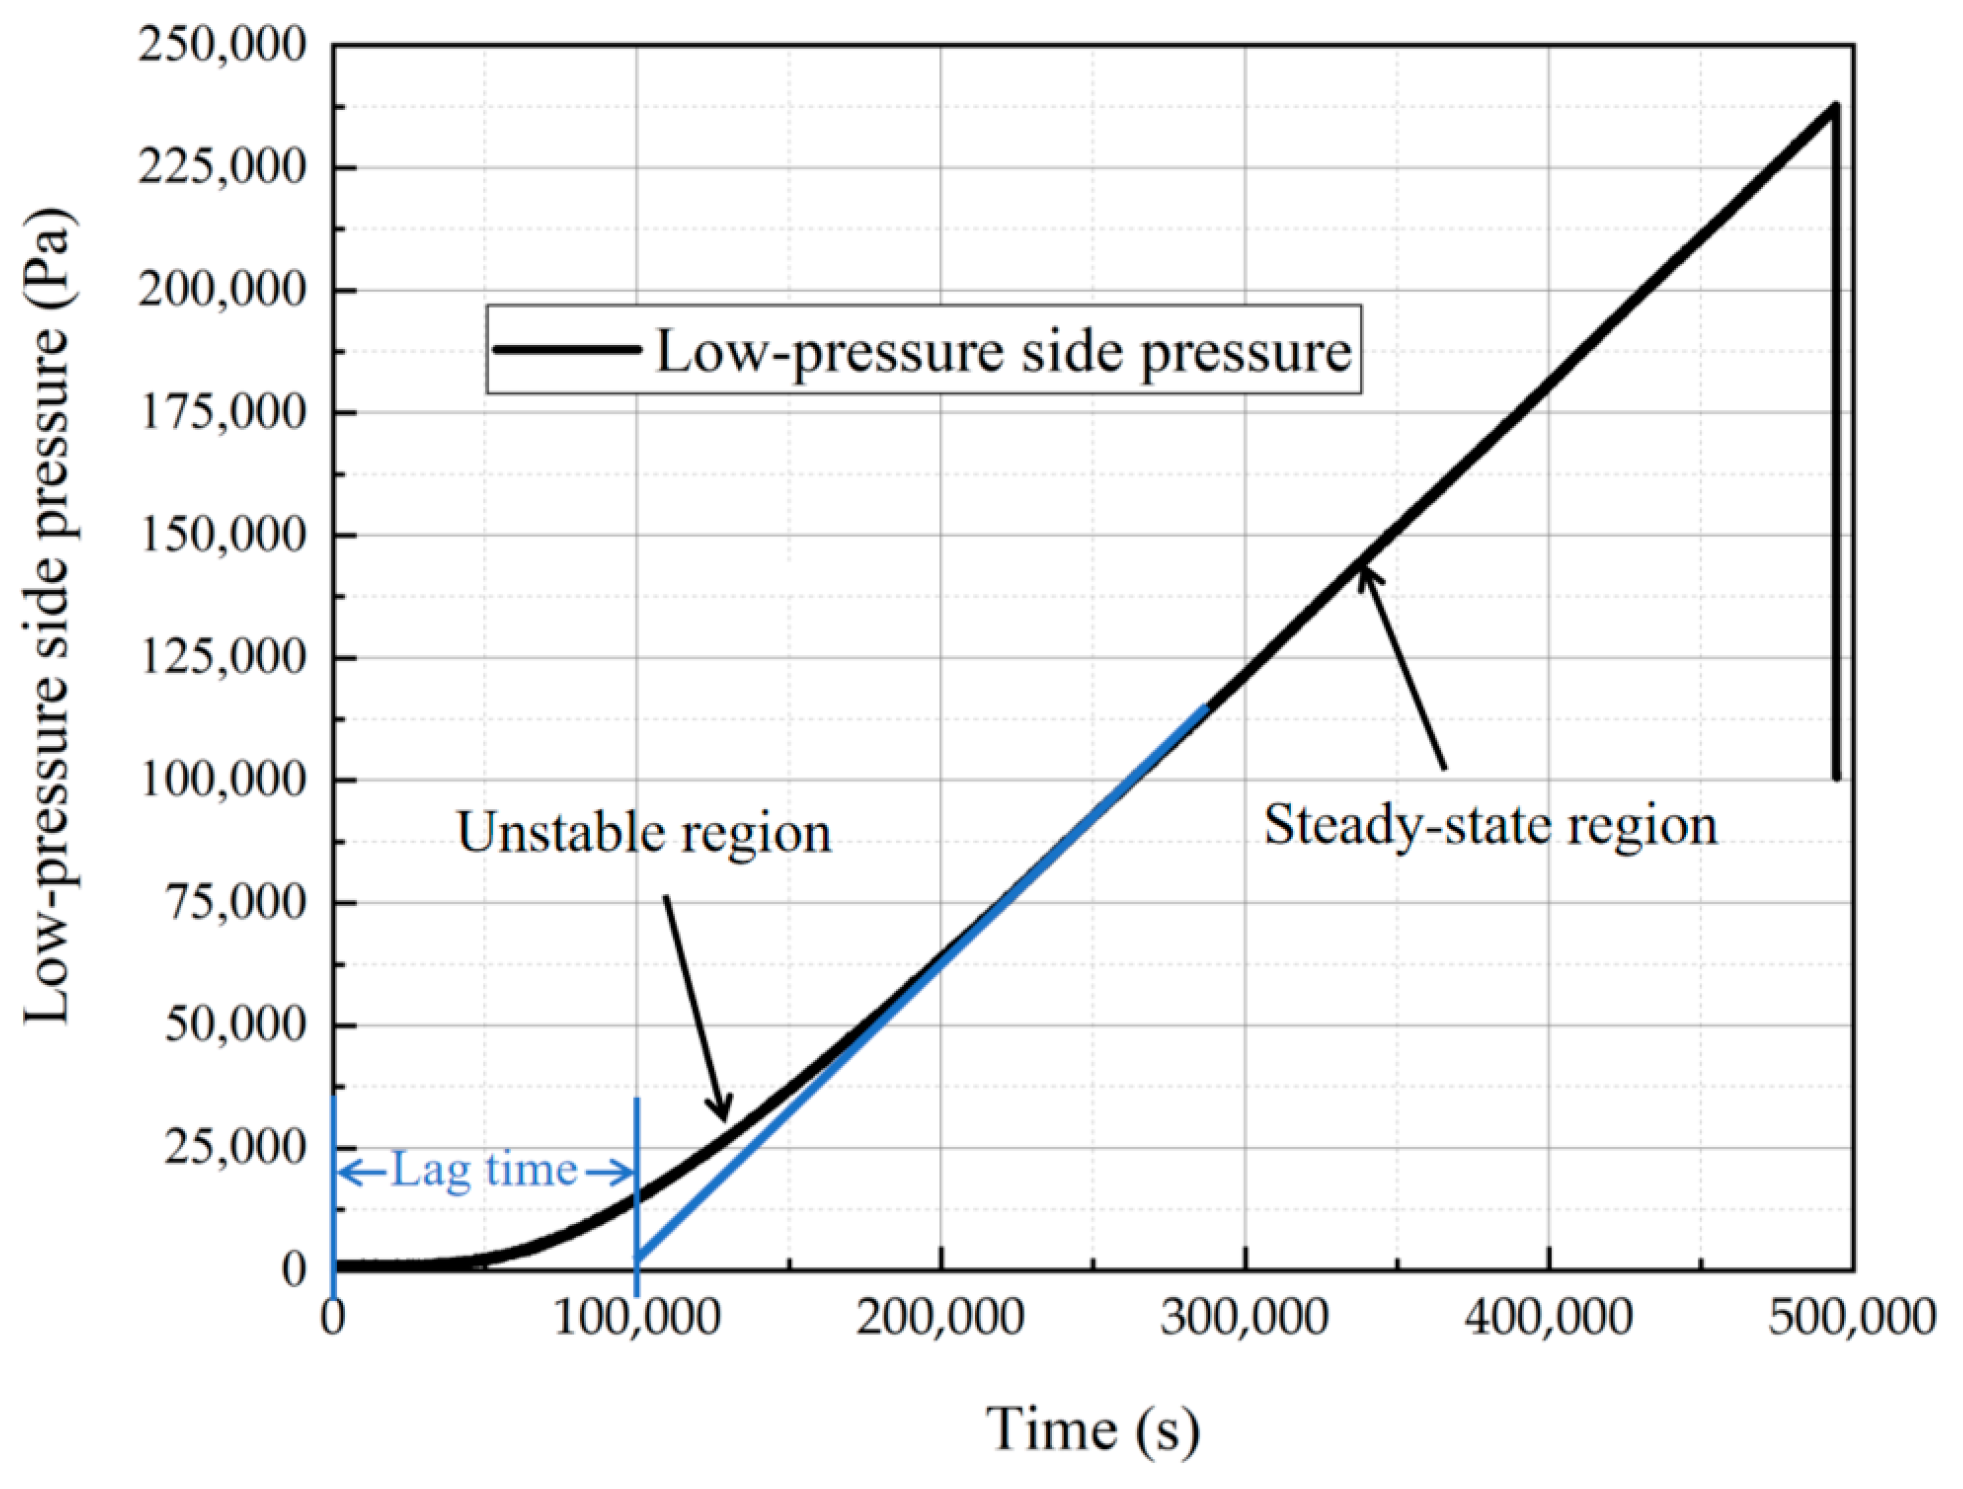
| Data Integration Diagram of Different Time Periods | Δp/Δt (pa/s) | d (cm) | Lag Time (s) | Pe (cm3·cm/(cm2·s·Pa)) | D (cm2/s) | S (cm3/(cm2·s·cm·Hg)) |
|---|---|---|---|---|---|---|
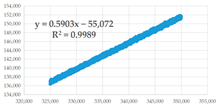 (a) 325,001–350,000 s | 0.5903 | 0.35 | 93,294.93 | 1.714 × 10⁻¹⁴ | 2.188 × 10⁻⁷ | 7.832 × 10⁻⁸ |
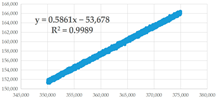 (b) 350,001–375,000 s | 0.5861 | 0.35 | 91,585.05 | 1.701 × 10⁻¹⁴ | 2.229 × 10⁻⁷ | 7.634 × 10⁻⁸ |
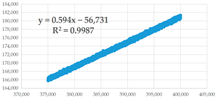 (c) 375,001–400,000 s | 0.594 | 0.35 | 95,506.73 | 1.725 × 10⁻¹⁴ | 2.138 × 10⁻⁷ | 8.068 × 10⁻⁸ |
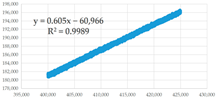 (d) 400,001–425,000 s | 0.605 | 0.35 | 100,770.25 | 1.757 × 10⁻¹⁴ | 2.026 × 10⁻⁷ | 8.670 × 10⁻⁸ |
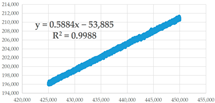 (e) 425,001–450,000 s | 0.5884 | 0.35 | 91,578.86 | 1.708 × 10⁻¹⁴ | 2.229 × 10⁻⁷ | 7.663 × 10⁻⁸ |
| Average value | / | / | / | 1.72 × 10⁻¹⁴ | 2.19 × 10⁻⁷ | 7.85 × 10⁻⁸ |
References
- Li, J.; Liu, J.; Zhao, B.; Wang, D.; Guo, S.; Song, J.; Li, X. Research on Temperature Rise of Type IV Composite Hydrogen Storage Cylinders in Hydrogen Fast-Filling Process. Energies 2023, 16, 2918. [Google Scholar] [CrossRef]
- Manoharan, Y.; Hosseini, S.E.; Butler, B.; Alzhahrani, H.; Senior, B.T.F.; Ashuri, T.; Krohn, J. Hydrogen Fuel Cell Vehicles; Current Status and Future Prospect. Appl. Sci. 2019, 9, 2296. [Google Scholar] [CrossRef]
- Li, J.; Lv, R.; Gu, C.; Liu, Y.; Li, J.; Li, X. An Ageing Test Standards Analysis on Thermoplastic Liners of Type IV Composite Hydrogen Storage Tanks. Energies 2023, 16, 2818. [Google Scholar] [CrossRef]
- Son, D.-S.; Chang, S.-H. Evaluation of modeling techniques for a type III hydrogen pressure vessel (70 MPa) made of an aluminum liner and a thick carbon/epoxy composite for fuel cell vehicles. Int. J. Hydrogen Energy 2012, 37, 2353–2369. [Google Scholar] [CrossRef]
- Roh, H.; Hua, T.; Ahluwalia, R. Optimization of carbon fiber usage in Type 4 hydrogen storage tanks for fuel cell automobiles. Int. J. Hydrogen Energy 2013, 38, 12795–12802. [Google Scholar] [CrossRef]
- Yersak, T.A.; Baker, D.R.; Yanagisawa, Y.; Slavik, S.; Immel, R.; Mack-Gardner, A.; Herrmann, M.; Cai, M. Predictive model for depressurization-induced blistering of type IV tank liners for hydrogen storage. Int. J. Hydrogen Energy 2017, 42, 28910–28917. [Google Scholar] [CrossRef]
- Pépin, J.; Lainé, E.; Grandidier, J.-C.; Benoit, G.; Mellier, D.; Weber, M.; Langlois, C. Replication of liner collapse phenomenon observed in hyperbaric type IV hydrogen storage vessel by explosive decompression experiments. Int. J. Hydrogen Energy 2018, 43, 4671–4680. [Google Scholar] [CrossRef]
- Blanc-Vannet, P.; Papin, P.; Weber, M.; Renault, P.; Pepin, J.; Lainé, E.; Tantchou, G.; Castagnet, S.; Grandidier, J.-C. Sample scale testing method to prevent collapse of plastic liners in composite pressure vessels. Int. J. Hydrogen Energy 2018, 44, 8682–8691. [Google Scholar] [CrossRef]
- CSA ANSI CHMC 2-19; Test Methods for Evaluating Material Compatibility in Compressed Hydrogen Applications Polymers. CSA Gas Standards (CSA/AM): Toronto, ON, Canada, 2019.
- ISO 11114-5; Gas Cylinders-Compatibility of Cylinder and Valve Materials with Gas Contents. ISO: Geneva, Switzerland, 2022.
- SAE J2579; Standard for Fuel Systems in Fuel Cell and Other Hydrogen Vehicles. SAE: Warrendale, PA, USA, 2018.
- Kane, M. Permeability, Solubility, and Interaction of Hydrogen in Polymers—An Assessment of Materials for hydrogen Transport; Savannah River Site (SRS): Aiken, SC, USA, 2008.
- George, S.C.; Thomas, S. Transport phenomena through polymeric systems. Prog. Polym. Sci. 2001, 26, 985–1017. [Google Scholar] [CrossRef]
- Zhang, D.; Ding, N.; Zhang, Z.; Cai, X.; Shao, X.; Li, H. Hydrogen Permeation Behavior of Polyethylene Liner for Type IV Vessel. Adv. New Renew. Energy 2022, 10, 15–19. (In Chinese) [Google Scholar]
- Zhang, D.; Li, H.; Qi, D.; Ding, N.; Shao, X.; Wei, B.; Cai, X. Gas permeation behaviors of high-density polyethylene as a liner material of flexible pipes. Nat. Gas Ind. 2017, 37, 104–110. (In Chinese) [Google Scholar]
- Guo, S.; Lv, J.; Gao, Z.; Xue, H.; Liang, J.; Sun, F. Discussion on Permeability Parameters of Fully-wrapped Hydrogen Storage Cylinder with Non-metal Liner. Low Temp. Spec. Gases 2020, 38, 16–18. (In Chinese) [Google Scholar]
- Klopffer, M.H.; Flaconneche, B. Transport Properdines of Gases in Polymers: Bibliographic Review. Oil Gas Sci. Technol.—Rev. d’IFP Energies Nouv. 2001, 56, 223–244. [Google Scholar] [CrossRef]
- Klopffer, M.-H.; Berne, P.; Espuche, E. Development of Innovating Materials for Distributing Mixtures of Hydrogen and Natural Gas. Study of the Barrier Properties and Durability of Polymer Pipes. Oil Gas Sci. Technol. 2014, 70, 305–315. [Google Scholar] [CrossRef]
- Pepin, J.; Lainé, E.; Grandidier, J.-C.; Castagnet, S.; Blanc-Vannet, P.; Papin, P.; Weber, M. Determination of key parameters responsible for polymeric liner collapse in hyperbaric type IV hydrogen storage vessels. Int. J. Hydrogen Energy 2018, 43, 16386–16399. [Google Scholar] [CrossRef]
- Humpenöder, J. Gas permeation of fibre reinforced plastics. Cryogenics 1998, 38, 143–147. [Google Scholar] [CrossRef]
- Yamabe, J.; Nishimura, S. Influence of fillers on hydrogen penetration properties and blister fracture of rubber composites for O-ring exposed to high-pressure hydrogen gas. Int. J. Hydrogen Energy 2009, 34, 1977–1989. [Google Scholar] [CrossRef]
- Fujiwara, H.; Ono, H.; Onoue, K.; Nishimura, S. High-pressure gaseous hydrogen permeation test method -property of polymeric materials for high-pressure hydrogen devices (1)-. Int. J. Hydrogen Energy 2020, 45, 29082–29094. [Google Scholar] [CrossRef]
- Fujiwara, H.; Ono, H.; Ohyama, K.; Kasai, M.; Kaneko, F.; Nishimura, S. Hydrogen permeation under high pressure conditions and the destruction of exposed polyethylene-property of polymeric materials for high-pressure hydrogen devices (2)-. Int. J. Hydrogen Energy 2021, 46, 11832–11848. [Google Scholar] [CrossRef]
- Sun, Y.; Lv, H.; Zhou, W.; Zhang, C. Research on hydrogen permeability of polyamide 6 as the liner material for type Ⅳ hydrogen storage tank. Int. J. Hydrogen Energy 2020, 45, 24980–24990. [Google Scholar] [CrossRef]
- Barth, R.R.; Simmons, K.L.; Marchi, C.W.S. Polymers for Hydrogen Infrastructure and Vehicle Fuel Systems; Sandia National Lab: Livermore, CA, USA, 2013. [CrossRef]
- GB/T 42610-2023; Test Method for Evaluating Hydrogen Compatibility of Plastic Liner of High Pressure Gaseous Hydrogen Cylinders. State Administration for Market Regulation: Beijing, China, 2023.
- GB/T 1038.1-2022; Plastics-Film and Sheeting-Determination of Gas-Transmission Rate—Part 1: Differential-Pressure Methods. State Administration for Market Regulation: Beijing, China, 2022.
- Rogers, C.E. Permeation of Gases and Vapours in Polymers. In Polymer Permeability; Springer: Berlin, Germany, 1985; pp. 11–73. [Google Scholar] [CrossRef]
- Li, X.; Huang, Q.; Liu, Y.; Zhao, B.; Li, J. Review of the Hydrogen Permeation Test of the Polymer Liner Material of Type IV On-Board Hydrogen Storage Cylinders. Materials 2023, 16, 5366. [Google Scholar] [CrossRef]
- Naito, Y.; Mizoguchi, K.; Terada, K.; Kamiya, Y. The effect of pressure on gas permeation through semicrystalline polymers above the glass transition temperature. J. Polym. Sci. Part B Polym. Phys. 1991, 29, 457–462. [Google Scholar] [CrossRef]
- Fumitoshi, K.; Hirotada, F.; Shin, N. Influence of high-pressure hydrogen gas on crystalline polymers. In Proceedings of the 33rd Polymer Degradation Discussion Group, St. Julians, Malta, 1–5 September 2019. [Google Scholar]

| Conditions | Pe | InPe |
|---|---|---|
| 308 K, 15 MPa | 4.31 × 10⁻¹⁴ | −30.78 |
| 308 K, 43.75 MPa | 2.88 × 10⁻¹⁴ | −31.18 |
| 308 K, 87.5 MPa | 2.07 × 10⁻¹⁴ | −31.51 |
| 328 K, 15 MPa | 9.75 × 10⁻¹⁴ | −29.96 |
| 328 K, 43.75 MPa | 7.31 × 10⁻¹⁴ | −30.25 |
| 328 K, 87.5 MPa | 5.85 × 10⁻¹⁴ | −30.47 |
| 358 K, 15 MPa | 3.34 × 10⁻¹³ | −28.73 |
| 358 K, 43.75 MPa | 2.78 × 10⁻¹³ | −28.91 |
| 358 K, 87.5 MPa | 2.48 × 10⁻¹³ | −29.03 |
| Temperature | 308 K | 328 K | 358 K | |
|---|---|---|---|---|
| Pressure | ||||
| 15 MPa | 7.71 × 10⁻⁷ | 1.95 × 10⁻⁶ | 1.30 × 10⁻⁵ | |
| 43.75 MPa | 4.87 × 10⁻⁷ | 8.57 × 10⁻⁷ | 3.18 × 10⁻⁶ | |
| 87.5 MPa | 3.91 × 10⁻⁷ | 6.57 × 10⁻⁷ | 2.36 × 10⁻⁶ | |
| Temperature | 308 K | 328 K | 358 K | |
|---|---|---|---|---|
| Pressure | ||||
| 15 MPa | 5.59 × 10⁻⁸ | 4.99 × 10⁻⁸ | 2.57 × 10⁻⁸ | |
| 43.75 MPa | 5.90 × 10⁻⁸ | 8.53 × 10⁻⁸ | 8.75 × 10⁻⁸ | |
| 87.5 MPa | 5.29 × 10⁻⁸ | 8.91 × 10⁻⁸ | 1.05 × 10⁻⁷ | |
| Materials | Pe (cm3·cm/(cm2·s·Pa)) | D (cm2/s) | S (cm3/(cm2·s·cm·Hg)) |
|---|---|---|---|
| PA6 | 1.72 × 10⁻¹⁴ | 2.19 × 10⁻⁷ | 7.85 × 10⁻⁸ |
| PA11 | 1.87 × 10⁻¹⁴ | 2.43 × 10⁻⁷ | 7.71 × 10⁻⁸ |
| HDPE | 5.88 × 10⁻¹⁴ | 9.73 × 10⁻⁷ | 6.05 × 10⁻⁸ |
Disclaimer/Publisher’s Note: The statements, opinions and data contained in all publications are solely those of the individual author(s) and contributor(s) and not of MDPI and/or the editor(s). MDPI and/or the editor(s) disclaim responsibility for any injury to people or property resulting from any ideas, methods, instructions or products referred to in the content. |
© 2023 by the authors. Licensee MDPI, Basel, Switzerland. This article is an open access article distributed under the terms and conditions of the Creative Commons Attribution (CC BY) license (https://creativecommons.org/licenses/by/4.0/).
Share and Cite
Dong, C.; Liu, Y.; Li, J.; Bin, G.; Zhou, C.; Han, W.; Li, X. Hydrogen Permeability of Polyamide 6 Used as Liner Material for Type IV On-Board Hydrogen Storage Cylinders. Polymers 2023, 15, 3715. https://doi.org/10.3390/polym15183715
Dong C, Liu Y, Li J, Bin G, Zhou C, Han W, Li X. Hydrogen Permeability of Polyamide 6 Used as Liner Material for Type IV On-Board Hydrogen Storage Cylinders. Polymers. 2023; 15(18):3715. https://doi.org/10.3390/polym15183715
Chicago/Turabian StyleDong, Chufeng, Yitao Liu, Jiepu Li, Guangfu Bin, Chilou Zhou, Wulin Han, and Xiang Li. 2023. "Hydrogen Permeability of Polyamide 6 Used as Liner Material for Type IV On-Board Hydrogen Storage Cylinders" Polymers 15, no. 18: 3715. https://doi.org/10.3390/polym15183715
APA StyleDong, C., Liu, Y., Li, J., Bin, G., Zhou, C., Han, W., & Li, X. (2023). Hydrogen Permeability of Polyamide 6 Used as Liner Material for Type IV On-Board Hydrogen Storage Cylinders. Polymers, 15(18), 3715. https://doi.org/10.3390/polym15183715