Abstract
Reverse osmosis (RO) membrane materials play a key role in determining energy consumption. Currently, CTA is regarded as having one of the highest degrees of chlorine resistance among materials in the RO process. The hollow fiber membrane has the advantages of a large membrane surface area and a preparation process without any redundant processes. Herein, response surface methodology with Box–Behnken Design (BBD) was applied for optimizing the preparation conditions of the cellulose triacetate (CTA) hollow fiber RO membrane. There were four preparation parameters, including solid content, spinning temperature, post-treatment temperature, and post-treatment time, which could affect the permeability of the membrane significantly. In this study, the interaction between preparation parameters and permeability (permeate flux and salt rejection) was evaluated by regression equations. Regression equations can be applied to obtain the optimized preparation parameters of hollow fiber RO membranes and reasonably predict and optimize the permeability of the RO membranes. Finally, the optimized preparation conditions were solid content (44%), spinning temperature (167 °C), post-treatment temperature (79 °C), and post-treatment time (23 min), leading to a permeability of 12.029 (L·m−2·h−1) and salt rejection of 90.132%. This study of reinforced that CTA hollow fiber membrane may promote the transformation of the RO membrane industry.
1. Introduction
In recent years, there has been a growing concern about issues such as water scarcity and environmental pollution all over the world []. Due to the effects of climate change and freshwater resource pollution, the water shortage has further accelerated and is becoming an urgent problem. With the development of society and the increase in population, the shortage of fresh water has aroused the whole world’s attention [,]. Since there are abundant seawater resources, this may be an effective way to consider seawater desalination to compensate for and resolve the problem of freshwater scarcity. Gaining freshwater resources through appropriate desalination technology is of great strategic significance for building a resource-saving and environmentally friendly society [].
Nowadays, RO is generally popular as the most important desalination technology []. In addition, it has slowly replaced traditional evaporation technology, such as multi-stage flash [], and can combine with some new technologies such as capacitive deionization [], electro dialysis [], and membrane distillation [], and is expected to lead the membrane industry in the future. Over the past few decades, the developments in RO membrane materials, membrane processes, feed solution pre-treatment, and the reduction in energy consumption have been studied as remarkable advances [].
There is no denying that one of the key issues is the need to improve the permeate flux of membranes with high salt rejection in the RO filtration process. The permeate flux closely associates with the membrane properties according to molecular-transport models []. Up until now, most water treatment plants employ polyamide (PA) or its derivative RO membranes, which can provide satisfactory permeability and salt rejection []. However, the PA RO membranes have poor chemical stability in oxidation system. For example, free chlorine, which has a good resistance to biofouling, can weaken the PA RO membrane performance [,]. Meanwhile, the PA module configuration needs to be designed as spiral wound with a complex structure because of the narrow membrane area. By comparison, the hollow fiber membrane modules are easier to design, due to their large surface area and their preparation process, which is without any redundant processes [].
Cellulose triacetate (CTA) has emerged as a way to prepare hollow fiber RO membranes, particularly for wastewater with severe biofouling, because of its good chlorine resistance []. Good performance of the CTA RO membrane can be obtained by manipulating preparation conditions. In the past, researchers usually used the one-factor-at-a-time experimental method, which not only consumed more time and expense but also neglected the effect of the interaction among factors [,]. Although the traditional orthogonal method is capable of considering a few factors at the same time, it cannot retrieve a function expression between the factors and response values, and it is difficult to find out the optimal factor combination and response value in the whole area.
The response surface method (RSM) is a collection of statistical and mathematical methods that gives an effective practical means for design optimization. It has been commonly used for experimental designs due to its advantages, such as reduction in the number of experiments that need be executed, resulting in lower reagent consumption and considerably less laboratory work [,,]. In recent years, RSM has played an important role in the biotechnology. However, there has been little focus on the function of RSM in the membrane field. In previous works, Ismail and Lai [] studied the preparation of defect-free asymmetric polysulfone membranes for gas separation through the manipulation of membrane fabrication variables using RSM. Idris et al. [] used RSM to investigate the composition effect of the aqueous phase on the interfacial polymerization of the RO membrane. So far, no study has reported research on using RSM to optimize the preparation conditions of CTA hollow fiber RO membranes for good permeability. RSM was utilized to assess the relationship between response and independent variables, as well as to optimize the relevant condition of variables in order to predict the optimal value of the response. Box–Behnken design (BBD) is a standard RSM design, and is well suited for fitting a quadratic surface to estimate the coefficients of the response function [,].
In our previous study [], we prepared reinforced CTA hollow fiber RO membranes and investigated the effects of solid content and the operating temperature on the performance of membranes. We found that the preparation conditions affected the performance of CTA reverse osmosis (RO) membranes. However, the detailed relationship between the preparation condition and the performance was not investigated. Therefore, to elucidate this relationship, we prepared a new type of CTA hollow fiber RO membrane by using RSM in this work. The interaction between preparation parameters and permeability (permeate flux and salt rejection) was evaluated by regression equations. The preparation parameters mainly included solid content, spinning temperature, post-treatment temperature, and post-treatment time. This work could provide a guide for the preparation process of an RO membrane that can obtain a good performance from hollow fiber RO membranes in practical application.
2. Experiments
2.1. Materials
CTA resins (LT35, average molecular weight (Mn) ≈ 50,000 g/mol) were purchased from Daicel (China) Investment Co., Ltd. (Shanghai, China), and benzoic acid (BA) and ethylene glycol (EG) were kindly provided by Tianjin Fengchuan Chemical Reagent Science and Technology Co., Ltd. (Tianjin, China). Tetramethylene sulfone (TMS) was obtained from Tianjin Kermel Chemical Reagent Co., Ltd. (Tianjin, China). Deionized water (DI) (pH ≈ 7.0) with a resistance of 18 MΩ was used in all experiments. NaCl was the analytical reagent and was used without further purification. Furthermore, the CTA needed to be desiccated to remove moisture in a vacuum oven (24 h, 80 ± 2 °C, 2 mbar).
2.2. Experimental Design
In this study, RSM was utilized to assess the relationship between the response and independent variables, as well as to optimize the relevant condition of variables in order to predict the optimal value of the response. Box–Behnken design (BBD) is a standard RSM design that is well suited for fitting a quadratic surface to estimate the coefficients of the response function [,]. The objective of this study was to evaluate the combined effect of preparation variables on the performance of RO membranes. The variables investigated were solid content (A), spinning temperature (B), post-treatment temperature (C), and post-treatment time (D). Permeate flux (L·m−2·h−1) and salt rejection (%) were the response variables of the RO membrane, optimized using Design-Expert software version 7.0. The levels of the factors are presented in Table 1. For each factor, a high, moderate, and low coded value was designated as 1, 0, and −1, respectively. In the experimental design twenty-nine experiment runs were carried out, which included twenty-four factorial points and five central points. Central points provide additional degrees of freedom for error estimation []. The experimental values and the results of the response surface are presented in Table 2. As there are only three levels for each factor, the appropriate model is the quadratic model Equation (1),
where y is the response function; n is the variable number; and are the values of independent variables; are the regression coefficients for intercept, linear, quadratic, and interaction terms, respectively; is the error between approximate function and real function.

Table 1.
Experimental ranges and levels of the factors.
Table 2.
Box–Behnken design experimental design table and the corresponding permeate flux ((L·m−2·h−1)) and salt rejection (%).
2.3. Membrane Preparation
Firstly, a ploy(p-phenyleneterephthalamide) (PPTA) twisted fiber bundle was prepared by twister with a degree of twist (20T·10 cm−1) and a defined mass ratio of CTA and TMS, and was homogeneously mixed under vigorous mechanical stirring. During the preparation process, TMS was regarded as a plasticizer in order to weaken the sub-valence of polymer molecules, namely van der Waals forces, as well as to increase the mobility of polymer chains. Secondly, using a twin-screw spinning machine with given parameters of temperature and according to the melt spinning method, the reinforced hollow fiber membrane with a twisted fiber bundle supporting layer was prepared. A special channel was designed for different spinneret dimensions. For the preparation process, the CTA (150 °C) melt was spun into the spinneret and coated onto the surface of PPTA twisted fiber bundle. The nascent FR CTA hollow fiber RO membranes were formed with a water coagulation bath (25 °C). Thirdly, the RO membranes were fabricated after TMS was extracted through dipping in a coagulating bath of 10 °C for 24 h. Notably, the coagulating bath was comprised by TMS/ water with a content of 35/65. In order to obtain adequate salt rejection, the RO membranes were treated with a heat treatment process for 15–45 min in water of 60–80 °C. Figure S1 shows the fabrication and forming process of hollow fiber RO membranes, while the parameters and the compositions are tabulated in Table 1.
2.4. RO Membranes’ Permeability
It is well known that the permeability of membranes is mainly represented by permeate flux and salt rejection. In this study, the permeability of the RO membrane was investigated by a lab-scale crossflow filtration system (Figure S2). In general, 2000 mg/L NaCl aqueous solution was usually regarded as brackish water [,]. According to some references [,,], the permeate flux and salt rejection of RO membranes could be evaluated by using NaCl aqueous solution in a lab-scale crossflow filtration system In general, the filtration system maintained the testing temperature (25 ± 2.0 °C) using a low-temperature bath circulator (RW-0525G, Lab Companion, Seoul, Korea), transmembrane pressure (2–5 MPa), and crossflow flux (1 L·min−1). The concentrated liquor was recycled back into the feed tank in order to maintain a constant feed concentration. Meanwhile, the conductivity of the feed solution and permeate water was obtained via a conductivity meter (DDS-11A) []. A glass bottle was utilized to collect permeate water and permeate flux was calculated by Equation (2).
where, is the permeate flux (L·m−2·h−1); A is the available filtration area (m2); V is the permeate water volume (L); t is the testing time (h).
A conductivity meter (DDS-11A) was utilized to measure the conductivity of the feed solution and permeate water. Salt rejection (R) was calculated by Equation (3).
where, is the conductivity of the permeate water; is the conductivity of the feed solution.
3. Results and Discussion
3.1. ANOVA of Permeate Flux
ANOVA was conducted, shedding light on the quality of the regression equation []. The analysis made use of the error sum of squares SSE (n-k-1 degrees of freedom), the total corrected sum of squares SST (n-1 degrees of freedom), and the regression sum of squares SSR (k degrees of freedom). The coefficient of determination R2 (R2 = 1 − (SSE/SST)) was a measure of the proportion of variability that is explained by the fitted model. If the model is perfect, R2 = 1.0. A useful analysis that determined whether a significant number of variations existed is here explained. By F-test (F = SSR/k)/(SSE/(n-k-1)), one could test the hypothesis at the a-level of significance when F > Fα (k, n-k-1). P indicated statistical significance. The statistical significance of a result was an estimated measure of the degree to which it was “true”. More technically, the value of the p-level represented a decreasing index of the reliability of a result. The higher the p-level, the less we believe that the observed relation between variables in the sample was a reliable indicator of the relation between the respective variables. Specifically, the p-level represented the probability of error that was involved in accepting our observed result as valid. In many areas of research, a p-level of 0.05 has been customarily treated as a “borderline acceptable” error level [].
3.1.1. Regression Model and Variance Analysis
The results of Table 3 were fitted with multiple regressions using Design-Expert Version 13, and the second-order fitting equation of membrane permeability flux with respect to four factors was obtained. The expression was as follows:
Table 3.
ANOVA for regression equation of permeate flux.
The quadratic polynomial regression equation corresponding to the true level of each factor was as follows:
Formula (4) was tested based on ANOVA. The variance analysis of the quadratic polynomial model is shown in Table 3. The p value can be seen at significant levels. The p < 0.0001 in this paper showed that the model had statistical significance in the scope of this experimental study. The degree of misalignment indicated the deviation between the predicted value and the experimental data. The misalignment term p = 0.0919 > 0.05 in this model was not significant. It showed that the model had a good fitting degree and could be used as the best preparation parameter for predicting solid content, spinning temperature, post-treatment temperature, and post-treatment time.
From Table 3, it can be seen that the F value of the model was 77.3, which meant that the model was significant. In this case, for the membrane permeation flux, A, B, A2, and B2 had a significant impact on the membrane permeation flux (p < 0.05). The influences of the four factors on the membrane permeate flux were ranked as follows: solid content, spinning temperature, post-treatment time, and post-treatment temperature, which could be judged by the size of F value.
The reliability of the model was analyzed and the results are shown in Table 4. The value of the complex correlation coefficient, which was closer to one, would indicate that the fitting degree of the equation was good []. The model was 0.9872, which showed that the fitting regression equation was reasonable and reliable. The prediction effect of the model are indicated by the modified complex correlation coefficient and the predicted complex correlation coefficient. The larger the coefficient was, the better the prediction effect obtained []. The coefficien of the model was greater than 0.95, indicating that more than 95% of the values could be explained by the model. Since AP = 31.1638 > 4, accidental errors had little effect on the experimental results and the model could predict the entire process accurately enough. CV = 7.02% < 10%, indicating fewer abnormal data. The binary regression equation fitted well and had high reliability. It could be used to predict the relationship between membrane permeation flux and solid content, spinning temperature, post-treatment time, and post-treatment temperature.
Table 4.
The credibility analysis of the permeate flux model.
3.1.2. Verification of the Accuracy of Membrane Permeation Flux Model
A residual is essentially the difference between mechanism and model predicted value (fitting value) []. It is often used to verify the hypothesis of the model, to detect outliers, and then to facilitate the modification of the model []. In the absence of outliers, residuals should conform to the normal distribution, and the points in the residuals’ distribution should be as straight as possible. The normal distribution of residuals in this model is shown in Figure 1A. Most of the experimental points are evenly distributed on or near the straight line, which shows that the residual obeys normal distribution with few outliers and that the fitting of the model was accurate. The comparison between the predicted and experimental values of the model is shown in Figure 1B. Most of the experimental points are on or near the straight line. The predicted values are close to or equal to the measured values, which proves that the model was suitable.
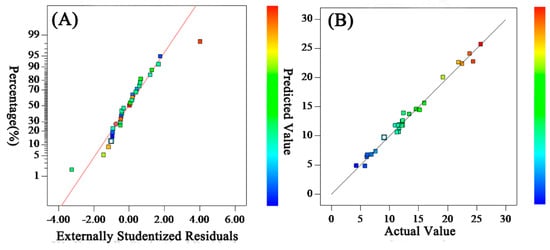
Figure 1.
Residuals’ normal distribution (A) and comparison of predicted and experimental values (B) for Permeation Flux.
3.2. ANOVA of Salt Rejection
3.2.1. Regression Model and Variance Analysis
Design-Expert Version 13 was utilized to fit the results of Table 2, and the second-order fitting equation of the membrane desalination rate with respect to four factors was obtained. The expression was as follows:
Formula (6) was tested based on ANOVA. The variance analysis was shown in Table 5. From Table 5, the model p < 0.0001 showed that the model was extremely significant. The value p = 0.095 > 0.05 for the unfit item of the model was not significant, which indicated that the experimental points could be explained by the model. The A, B, C, AB, A2, D2 term in the quadratic model had a significant effect on membrane salt rejection (p < 0.05), and the interaction between solid content and spinning temperature was strong. From the F value, it could be judged that in the selected experimental range, the four factors affecting the salt rejection of the membrane are sorted as follows: solid content, spinning temperature, post-treatment temperature, and post-treatment time.
Table 5.
ANOVA for regression equation of salt rejection.
The reliability of the model was analyzed, and the results are shown in Table 6. The of this model was 0.9937, , , RR was greater than 0.95 and , AP = 37.3634 > 4, CV = 2.51% < 10%. The binary regression equation could be used to predict the effects of solid content, spinning temperature, post-treatment temperature, and post-treatment time on membrane salt rejection.
Table 6.
The credibility analysis of the model of salt rejection.
3.2.2. Verification of the Accuracy of the Membrane Salt Rejection Model
The normal probability distribution of the residual of the model is shown in Figure 2A, which shows that the residual distribution conformed to the normal distribution. The comparison between the predicted value and the experimental value of the desalination rate model is shown in Figure 2B, which shows that most of the experimental points fall on a straight line, and the predicted value was close to or equal to the measured value, which proves that the model was reliable.
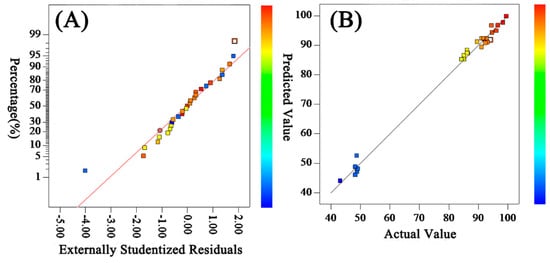
Figure 2.
Residuals’ normal distribution (A) and comparison of predicted and experimental values (B) for salt rejection.
3.3. The Effects of Four Variables on Permeate Flux
The permeability (permeate flux and salt rejection) could be simulated by the response surfaces data when the counter diagram showed different shapes. In general, the interaction between the parameters was not significant when the counter was circular, which can be neglected, while the factors were significant when the contour was elliptic or saddle [,]. In this work, the diagrams of counter and three-dimensional (3D) surface were fitted to give the interaction effects between the preparation parameters, including solid content (A), spinning temperature (B), post-treatment temperature (C), post-treatment time (D), and permeability (permeate flux and salt rejection).
The effect of solid content (A) and spinning temperature (B) on the permeate flux is shown in Figure 3-Q1. The elliptical shape of the contour plot depicts that the interaction between A and B was significant, and the impact factor of A was greater than B. It can be seen in the 3D diagram that the permeate flux obviously decreased with increasing A. This phenomenon was mainly due to the increase in the viscosity of the membrane-forming system, which made the separation layer compact [,]. Compared with A, B showed a relatively slight effect on the permeate flux. When B was high, the movement of molecular chains accelerated, which would have caused strong interactions among the plasticizers and molecules, thus, the tangled chains of molecules were unwinding and forming a loose structure. Meanwhile, the surface of the membrane-forming system could instantaneously reach a high polymer concentration, and the increase in polymer concentration hindered the outward diffusion of volatile plasticizer, finally forming a membrane with a thin dense layer. It was well known that the RO membranes with a thin separation layer were usually prepared with separation performance []. For the synthesis effects of A and B, it could be expected that while decreasing A to achieve a significant enhancement of permeate flux, at the same time a high spinning temperature would also be required.
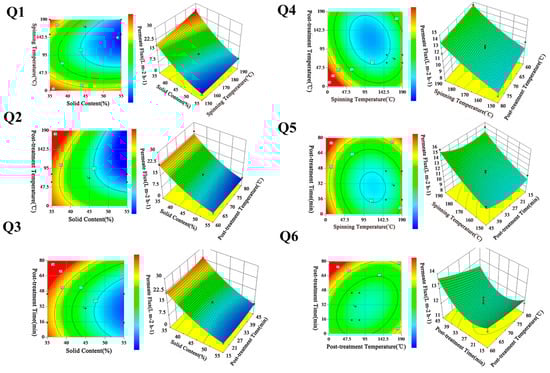
Figure 3.
Contour and 3D diagram of different preparation parameters on permeate flux.
Figure 3-Q2 shows the contour and response surface plot of solid content (A) and post-treatment temperature (C). It can be seen that there was a relatively significant interaction between A and C from observation of the elliptical nature of the contour plot. The surface plot shows that permeate flux increased with the decrease in A. The reason for this has been discussed previously. In addition, the permeate flux decreased slightly but remained basically unchanged, with C ranging between 60 and 80 (°C). This was because as the C increased, the partial binding water in the CTA molecules gained energy, overcoming the hydrogen bonding and breaking away []. This also increased the kinetic motion of the polymer molecular chains as well as enhancing the molecular movement, and the structure of the polymer molecular chains became more compact and more stable. Furthermore, the increase in C made the polar groups in the polymer molecular chains attract to each other, making the membrane dehydrate and shrink, which led to a reduction in permeate flux.
The response surface and the interaction of solid content (A) and post-treatment time (D) is plotted in Figure 3-Q3. According to the contour plot, the interaction between A and D was not obvious. The surface plot shows that permeate flux decreased slightly by increasing D. This was mainly due to the molecule structure of membrane surface becoming tighter with the increase in D, which made the desalination layer on the surface of the membrane more compact. Although changing D in the range of 15–45 min did not have much influence on permeate flux, decreasing A still played a significant role in the enhancement of permeate flux.
Figure 3-Q4 presents the response surface and the contour plot of spinning temperature (B) and post-treatment temperature (C). The contour plot shows that there was an interaction between B and C. It was observed that permeate flux increased by increasing B and increasing C, and the effect of B was more significant than C. As shown in Figure 3-Q5, B had no interaction with D, as is evident from the relatively circular nature of the contour curves. In addition, by increasing D, the permeate flux was obviously decreased. According to Figure 3-Q6, there was an obvious interaction effect between C and D. Moreover, the surface plot presents a similar behavior in the effect of C and D on the permeate flux.
Although all factors have influence on membrane permeate flux, the main impact factors were solid content and spinning temperature, while the others have only a minor effect.
3.4. Effects of Four Variables on Salt Rejection
Figure 4-K1 shows the contour and response surface plot of salt rejection as a function of solid content (A) and spinning temperature (B). The elliptical nature of the contour plot shows that the interaction between A and B was significant. It can be observed from the response surface plot that salt rejection considerably increased on increasing A, while slightly decreased on increasing B. The effect of A on salt rejection was more obvious than B. This was mainly due to the density of the membrane desalination layer increasing upon increasing A, which increased the rejection of NaCl []. This meant that a noticeable improvement of salt rejection could be expected by increasing solid content, even at a low spinning temperature.
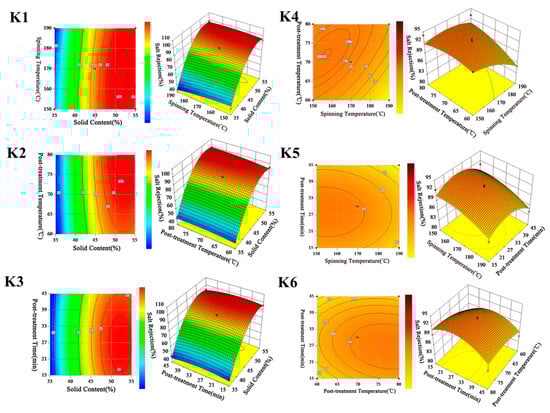
Figure 4.
Contour and 3D diagram of different preparation parameters on permeate flux and on salt rejection.
The combined effect of solid content (A) and post-treatment temperature (C) on salt rejection is shown in Figure 4-K2. The contour plot shows that the interaction between A and C was relatively significant, and the salt rejection increased slightly but remained basically unchanged with C ranging between 60 and 80 (°C). Compared with A, the increase in C results in less of an impact on salt rejection. Consequently, the optimal salt rejection needed to be further considered by increasing A to a certain value to achieve a greater separation performance.
Figure 4-K3 shows the responses of salt rejection by varying solid content (A) and post-treatment time (D). This was mainly due to the surface molecular structure of the membrane becoming tighter by increasing D, which made the desalination layer on the surface of the membrane more compact []. Furthermore, the surface plot shape of salt rejection in Figure 4-K3 was similar to that in Figure 4-K2; the increasing of A, C, and D had the same function in salt rejection. It could be concluded that although the salt rejection could be improved by an increase in A, C, or D, the increase in A was more efficient in achieving a higher value of salt rejection.
The combined effect of spinning temperature (B) and post-treatment temperature (C) on salt rejection is presented in Figure 4-K4. The contour plot shows that there was an interaction between B and C. The three-dimensional plot shows that salt rejection decreased by increasing B, and the decrease was negligible when C was high. It is indicated that the increase in C was beneficial for achieving a high level of salt rejection. As the elliptical nature of the contour plot shown in Figure 4-K5 illustrates, the interaction between B and D was significant. The most favorable condition for high salt rejection was the combination of high B with moderate D. Figure 4-K6 shows that the increase in D had the same function as decreasing C in terms of salt rejection. The result also suggests that a high salt rejection could be obtained with a moderate D, which is similar to the conclusion from Figure 4-K5.
3.5. Optimization of RO Process
Response surface models were developed to predict permeate flux and salt rejection. The optimum predicted conditions, solid content 44.024%, spinning temperature 167.1 °C, post-treatment temperature 79.37 °C, and post-treatment time 23.87 min, were determined using Design-Expert. For practical application, taking the integer portion of the optimum conditions and the three tests undertaken during the experiment, the results are presented in Table 7.
Table 7.
Optimized experimental results.
It can be seen that the relative errors between the experimental and predicted values of permeate flux and salt rejection were 5.1% and 1.37%, respectively. This shows that the model fitted by response surface could reflect the real process, visually showing the influence of preparation parameters on RO performance and obtaining the best parameters for the process. It also shows that it was feasible to use RSM to optimize the formulation of RO membranes, which was beneficial for achieving a high value of salt rejection at a considerably low cost of investment and thermal energy.
4. Conclusions
In this work, the preparation parameters for CTA hollow fiber RO membranes were optimized based on the BBD. The permeability of the membrane could be mainly decided by solid content, spinning temperature, post-treatment temperature, and post-treatment time. The regression equations between the preparation parameters and the permeability were established by RSM, and variance analysis was carried out. The corresponding contour and three-dimensional plots were obtained as analysis for the effects of each parameter on permeate flux and salt rejection. The permeate flux was mainly determined by solid content, and salt rejection was dependent on the main effects of solid content and spinning temperature. According to the regression equations, the optimal membranes’ permeate flux of 12.029 (L·m−2·h−1) and salt rejection of 90.132% were obtained under the following conditions: solid content 44%, spinning temperature 167 °C, post-treatment temperature 79 °C, and post-treatment time 23 min. The regression model can be applied to obtain the optimal formulation of RO membranes and can reasonably predict and optimize the permeability and desalination of RO membranes. In addition, the RO performance in both production and energy efficiency can be significantly improved through this optimization. These optimal parameters may provide guidance for manufacturing the hollow fiber RO membrane in the actual production process.
Supplementary Materials
The following supporting information can be downloaded at: https://www.mdpi.com/article/10.3390/polym15173569/s1, Figure S1: Schematic of RO membrane fabrication process; Figure S2: Schematic of evaluation RO membranes performance testing devices.
Author Contributions
Conceptualization, S.Y.; Software, H.X.; Investigation, C.H.; Writing—original draft, K.C.; Writing—review & editing, Y.W. All authors have read and agreed to the published version of the manuscript.
Funding
The project was supported by the Natural Science Foundation of Zhejiang Province (LY20E030009) and National Natural Science Foundation of China (Grant Nos. 51403078 and 52103035). This work is also supported by China Scholarship Council (Grant No. 201508330017).
Institutional Review Board Statement
Not applicable.
Data Availability Statement
Not applicable.
Conflicts of Interest
The authors declare no conflict of interest.
References
- Boulay, A.M.; Bare, J.; Benini, L.; Berger, M.; Lathuilliere, M.; Manzardo, A.; Margni, M.; Motoshita, M.; Nunez, M.; Pastor, A.V.; et al. The WULCA consensus characterization model for water scarcity footprints: Assessing impacts of water consumption based on available water remaining (AWARE). Int. J. Life Cycle Assess. 2018, 23, 368–378. [Google Scholar] [CrossRef]
- Ihsanullah; Abbas, A.; Al-Amer, A.M.; Laoui, T.; Al-Marri, M.J.; Nasser, M.S.; Khraisheh, M.; Atieh, M.A. Heavy metal removal from aqueous solution by advanced carbon nanotubes: Critical review of adsorption applications. Sep. Purif. Technol. 2016, 157, 141–161. [Google Scholar]
- Tahtouh, J.; Mohtar, R.; Assi, A.; Schwab, P.; Jantrania, A.; Deng, Y.; Munster, C. Impact of brackish ground water and treated wastewater on soil chemical and mineralogical properties. Sci. Total Environ. 2019, 647, 99–109. [Google Scholar] [CrossRef]
- Amy, G.; Ghaffour, N.; Li, Z.Y.; Francis, L.; Linares, R.V.; Missimer, T.; Lattemann, S. Membrane-based seawater desalination: Present and future prospects. Desalination 2017, 401, 16–21. [Google Scholar]
- Gude, V.G. Energy storage for desalination processes powered by renewable energy and waste heat sources. Appl. Energy 2015, 137, 877–898. [Google Scholar]
- Azhar, M.S.; Rizvi, G.; Dincer, I. Integration of renewable energy based multigeneration system with desalination. Desalination 2017, 404, 72–78. [Google Scholar]
- Zhang, C.Y.; He, D.; Ma, J.X.; Tang, W.W.; Waite, T.D. Faradaic reactions in capacitive deionization (CDI)—Problems and possibilities: A review. Water Res. 2018, 128, 314–330. [Google Scholar] [PubMed]
- Sano, Y.; Bai, X.H.; Amagai, S.; Nakayama, A. Effect of a porous spacer on the limiting current density in an electro-dialysis desalination. Desalination 2018, 444, 151–161. [Google Scholar]
- Deshmukh, A.; Boo, C.; Karanikola, V.; Lin, S.; Straub, A.P.; Tong, T.; Warsinger, D.M.; Elimelech, M. Membrane distillation at the water-energy nexus: Limits, opportunities, and challenges. Energy Environ. Sci. 2018, 11, 1177–1196. [Google Scholar]
- Sardari, K.; Fyfe, P.; Lincicome, D.; Wickramasinghe, S.R. Aluminum electrocoagulation followed by forward osmosis for treating hydraulic fracturing produced waters. Desalination 2018, 428, 172–181. [Google Scholar]
- Kang, D.Y.; Jones, C.W.; Nair, S. Modeling molecular transport in composite membranes with tubular fillers. J. Membr. Sci. 2011, 381, 50–63. [Google Scholar] [CrossRef]
- Ma, X.H.; Yao, Z.K.; Yang, Z.; Guo, H.; Xu, Z.; Tang, C.Y.; Elimelech, M. Nanofoaming of Polyamide Desalination Membranes to Tune Permeability and Selectivity. Environ. Sci. Technol. Lett. 2018, 5, 123–130. [Google Scholar] [CrossRef]
- Gohil, J.M.; Ray, P. A review on semi-aromatic polyamide TFC membranes prepared by interfacial polymerization: Potential for water treatment and desalination. Sep. Purif. Technol. 2017, 181, 159–182. [Google Scholar]
- Chae, H.R.; Lee, J.; Lee, C.H.; Kim, I.C.; Park, P.K. Graphene oxide-embedded thin-film composite reverse osmosis membrane with high flux, anti-biofouling, and chlorine resistance. J. Membr. Sci. 2015, 483, 128–135. [Google Scholar]
- Al-Obaidi, M.A.; Mujtaba, I.M. Steady state and dynamic modeling of spiral wound wastewater reverse osmosis process. Comput. Chem. Eng. 2016, 90, 278–299. [Google Scholar] [CrossRef]
- Brown, A.J.; Brunelli, N.A.; Eum, K.; Rashidi, F.; Johnson, J.R.; Koros, W.J.; Jones, C.W.; Nair, S. Interfacial microfluidic processing of metal-organic framework hollow fiber membranes. Science 2014, 345, 72–75. [Google Scholar] [CrossRef] [PubMed]
- Wang, Y.; Wang, Z.; Han, X.L.; Wang, J.; Wang, S. Improved flux and anti-biofouling performances of reverse osmosis membrane via surface layer-by-layer assembly. J. Membr. Sci. 2017, 539, 403–411. [Google Scholar]
- Fisk, H.; Westley, C.; Turner, N.J.; Goodacre, R. Achieving optimal SERS through enhanced experimental design. J. Raman Spectrosc. 2016, 47, 59–66. [Google Scholar] [PubMed]
- Witek-Krowiak, A.; Chojnacka, K.; Podstawczyk, D.; Dawiec, A.; Pokomeda, K. Application of response surface methodology and artificial neural network methods in modelling and optimization of biosorption process. Bioresour. Technol. 2014, 160, 150–160. [Google Scholar] [PubMed]
- Li, D.Q.; Jiang, S.H.; Cao, Z.J.; Zhou, W.; Zhou, C.B.; Zhang, L.M. A multiple response-surface method for slope reliability analysis considering spatial variability of soil properties. Eng. Geol. 2015, 187, 60–72. [Google Scholar]
- Yolmeh, M.; Najafi, M.B.H.; Farhoosh, R. Optimisation of ultrasound-assisted extraction of natural pigment from annatto seeds by response surface methodology (RSM). Food Chem. 2014, 155, 319–324. [Google Scholar] [CrossRef] [PubMed]
- Ismail, A.F.; Lai, P.Y. Effects of phase inversion and rheological factors on formation of defect-free and ultrathin-skinned asymmetric polysulfone membranes for gas separation. Sep. Purif. Technol. 2003, 33, 127–143. [Google Scholar]
- Idris, A.; Kormin, F.; Noordin, M.Y. Application of response surface methodology in describing the performance of thin film composite membrane. Sep. Purif. Technol. 2006, 49, 271–280. [Google Scholar] [CrossRef]
- Ferreira, S.L.C.; Bruns, R.E.; Ferreira, H.S.; Matos, G.D.; David, J.M.; Brandao, G.C.; da Silva, E.G.P.; Portugal, L.A.; dos Reis, P.S.; Souza, A.S.; et al. Box-Behnken design: An alternative for the optimization of analytical methods. Anal. Chim. Acta 2007, 597, 179–186. [Google Scholar] [CrossRef] [PubMed]
- Yetilmezsoy, K.; Demirel, S.; Vanderbei, R.J. Response surface modeling of Pb(II) removal from aqueous solution by Pistacia vera L.: Box-Behnken experimental design. J. Hazard. Mater. 2009, 171, 551–562. [Google Scholar] [CrossRef]
- Chen, K.; Xiao, C.; Liu, H.; Li, G.; Meng, X. Structure design on reinforced cellulose triacetate composite membrane for reverse osmosis desalination process. Desalination 2018, 441, 35–43. [Google Scholar]
- Saikia, S.; Mahnot, N.K.; Mahanta, C.L. Optimisation of phenolic extraction from Averrhoa carambola pomace by response surface methodology and its microencapsulation by spray and freeze drying. Food Chem. 2015, 171, 144–152. [Google Scholar]
- Turano, E.; Curcio, S.; De Paola, M.G.; Calabrò, V.; Iorio, G. An integrated centrifugation-ultrafiltration system in the treatment of olive mill wastewater. J. Membr. Sci. 2002, 209, 519–531. [Google Scholar] [CrossRef]
- Dereli, R.K.; van der Zee, F.P.; Ozturk, I.; van Lier, J.B. Treatment of cheese whey by a cross-flow anaerobic membrane bioreactor: Biological and filtration performance. Environ. Res. 2019, 168, 109–117. [Google Scholar]
- Li, Q.; Yu, H.; Wu, F.Y.; Song, J.; Pan, X.; Zhang, M. Fabrication of semi-aromatic polyamide/spherical mesoporous silica nanocomposite reverse osmosis membrane with superior permeability. Appl. Surf. Sci. 2016, 363, 338–345. [Google Scholar] [CrossRef]
- Zarrabi, N.; Yekavalangi, M.E.; Vatanpour, V.; Shockravi, A.; Safarpour, M. Improvement in desalination performance of thin film nanocomposite nanofiltration membrane using amine-functionalized multiwalled carbon nanotube. Desalination 2016, 394, 83–90. [Google Scholar] [CrossRef]
- Safarpour, M.; Vatanpour, V.; Khataee, A.; Esmaeili, M. Development of a novel high flux and fouling-resistant thin film composite nanofiltration membrane by embedding reduced graphene oxide/TiO2. Sep. Purif. Technol. 2015, 154, 96–107. [Google Scholar] [CrossRef]
- Chen, K.K.; Xiao, C.F.; Liu, H.L.; Ling, H.Y.; Chu, Z.Y.; Hu, Z.H. Design of robust twisted fiber bundle-reinforced cellulose triacetate hollow fiber reverse osmosis membrane with thin separation layer for seawater desalination. J. Membr. Sci. 2019, 578, 1–9. [Google Scholar]
- Mia, M.; Dhar, N.R. Response surface and neural network based predictive models of cutting temperature in hard turning. J. Adv. Res. 2016, 7, 1035–1044. [Google Scholar] [CrossRef] [PubMed]
- Muflikhun, M.A.; Chua, A.Y.; Santos, G.N.C. Statistical design analysis of silver-titanium dioxide nanocomposite materials synthesized via horizontal vapor phase growth (HVPG). Key Eng. Mater. 2017, 735, 210–214. [Google Scholar] [CrossRef]
- Rivard, G.E.; Brummel-Ziedins, K.E.; Mann, K.G.; Fan, L.; Hofer, A.; Cohen, E. Evaluation of the profile of thrombin generation during the process of whole blood clotting as assessed by thrombelastography. J. Thromb. Haemost. 2005, 3, 2039–2043. [Google Scholar] [CrossRef]
- Peng, Y.H.; Sun, L.X.; Jia, Z.; Li, L.; Alexov, E. Predicting protein-DNA binding free energy change upon missense mutations using modified MM/PBSA approach: SAMPDI webserver. Bioinformatics 2018, 34, 779–786. [Google Scholar]
- Wang, L.Y.; Huang, Z.H.; Wang, H.M.; Maldar, A.; Yi, S.; Park, J.S.; Kenesei, P.; Lilleodden, E.; Zeng, X.Q. Study of slip activity in a Mg-Y alloy by in situ high energy X-ray diffraction microscopy and elastic viscoplastic self-consistent modeling. Acta Mater. 2018, 155, 138–152. [Google Scholar]
- Henning, J.W.; Sayre, J.T.; Reichardt, C.L.; Ade, P.A.R.; Anderson, A.J.; Austermann, J.E.; Beall, J.A.; Bender, A.N.; Benson, B.A.; Bleem, L.E. Measurements of the Temperature and E-mode Polarization of the CMB from 500 Square Degrees of SPTpol Data. Astrophys. J. 2018, 852, 97. [Google Scholar]
- Lu, Q.; Sun, H.Y.; Low, B.K. Reliability analysis of ground-support interaction in circular tunnels using the response surface method. Int. J. Rock Mech. Min. Sci. 2011, 48, 1329–1343. [Google Scholar] [CrossRef]
- Parsazadeh, M.; Duan, X.L. Numerical study on the effects of fins and nanoparticles in a shell and tube phase change thermal energy storage unit. Appl. Energy 2018, 216, 142–156. [Google Scholar] [CrossRef]
- Ghosh, A.K.; Jeong, B.H.; Huang, X.F.; Hoek, E.M.V. Impacts of reaction and curing conditions on polyamide composite reverse osmosis membrane properties. J. Membr. Sci. 2008, 311, 34–45. [Google Scholar] [CrossRef]
- Choi, W.; Jeon, S.; Kwon, S.J.; Park, H.; Park, Y.I.; Nam, S.E.; Lee, P.S.; Lee, J.S.; Choi, J.; Hong, S. Thin film composite reverse osmosis membranes prepared via layered interfacial polymerization. J. Membr. Sci. 2017, 527, 121–128. [Google Scholar]
- Wang, C.; Mo, B.M.; He, Z.F.; Xie, X.; Zhao, C.X.; Zhang, L.; Shao, Q.; Guo, X.; Wujcik, E.K.; Guo, Z. Hydroxide ions transportation in polynorbornene anion exchange membrane. Polymer 2018, 138, 363–368. [Google Scholar] [CrossRef]
- Morelos-Gomez, A.; Cruz-Silva, R.; Muramatsu, H.; Ortiz-Medina, J.; Araki, T.; Fukuyo, T.; Tejima, S.; Takeuchi, K.; Hayashi, T.; Terrones, M.; et al. Effective NaCl and dye rejection of hybrid graphene oxide/graphene layered membranes. Nat. Nanotechnol. 2017, 12, 1083–1088. [Google Scholar]
- Dong, C.X.; Wang, Z.; Wu, J.H.; Wang, Y.; Wang, J.X.; Wang, S.C. A green strategy to immobilize silver nanoparticles onto reverse osmosis membrane for enhanced anti-biofouling property. Desalination 2017, 401, 32–41. [Google Scholar]
Disclaimer/Publisher’s Note: The statements, opinions and data contained in all publications are solely those of the individual author(s) and contributor(s) and not of MDPI and/or the editor(s). MDPI and/or the editor(s) disclaim responsibility for any injury to people or property resulting from any ideas, methods, instructions or products referred to in the content. |
© 2023 by the authors. Licensee MDPI, Basel, Switzerland. This article is an open access article distributed under the terms and conditions of the Creative Commons Attribution (CC BY) license (https://creativecommons.org/licenses/by/4.0/).