Article

Iron-Coordinated L-Lysine–Based Nanozymes with High Peroxidase-like Activity for Sensitive Hydrogen Peroxide and Glucose Detection

Institute of Polymer Science and Engineering, School of Chemical Engineering, Hebei University of Technology, Tianjin 300401, China
*
Authors to whom correspondence should be addressed.
Polymers 2023, 15(14), 3002; https://doi.org/10.3390/polym15143002
Submission received: 19 June 2023 / Revised: 6 July 2023 / Accepted: 7 July 2023 / Published: 10 July 2023
(This article belongs to the Special Issue Polymer Sensors: Preparation, Characterization and Applications)

Abstract

:
It is crucial to develop sensitive and accurate sensing strategies to detect H2O2 and glucose in biological systems. Herein, biocompatible iron-coordinated L-lysine–based hydrogen peroxide (H2O2)-mimetic enzymes (Lys-Fe-NPs) were prepared by precipitation polymerization in aqueous solution. The coordinated Fe2+ ion acted as centers of peroxidase-like enzymes of Lys-Fe-NPs, and the catalytic activity was evaluated via the oxidation of 3,3′,5,5′-tetramethylbenzidine (TMB) by H2O2. Therefore, a sensitive colorimetric detection sensor for H2O2 was constructed with a linear range of 1 to 200 μM and a detection limit of 0.51 μM. The same method could also be applied to highly sensitive and selective detection of glucose, with a linear range of 0.5 to 150 μM and a detection limit of 0.32 μM. In addition, an agarose-based hydrogel biosensor colorimetric was successfully implemented for visual assessment and quantitative detection of glucose. The design provided a novel platform for constructing stable and nonprotein enzyme mimics with lysine and showed great potential applications in biorelevant assays.

Graphical Abstract

1. Introduction

Hydrogen peroxide (H2O2) and glucose play important roles in living organisms as a key intermediate in environmental and biological processes and as a messenger for cellular signal transduction [1,2]. Glucose is an indispensable substance in the body and a source of energy for cellular metabolism [3]. Human physiological diseases are closely related to the concentrations of glucose and H2O2, including diabetes, stroke, blindness, renal failure, peripheral neuropathy and other diseases [4,5,6]. Therefore, the accurate detection of H2O2 and glucose is essential in many fields, including food, pharmaceutical, clinical, industrial and environmental protection applications [7].
Peroxidase is usually used to catalyze the oxidation of H2O2, causing a color change in the substrate to determine the enzyme activity and the concentrations of substrates or H2O2 [8]. In living organisms, glucose is oxidized to glucuronic acid and H2O2 by the action of glucose oxidase (GOx) [9]. Therefore, the detection of glucose can be indirectly achieved through the detection of H2O2 under corresponding conditions. Enzymes are a class of organic molecules with catalytic functions produced by living cells, and peroxidases are natural enzymes with high catalytic efficiency, substrate specificity, and mild reaction conditions [10,11,12]. Since the chemical substance of enzymes is protein, they are prone to structural changes and inactivation in non-physiological environments, such as acids, bases and heat [13]. Coupled with the high cost of their preparation and purification processes, their applications are greatly limited [14,15,16,17]. While bionic enzymes have the advantages of low cost, good stability and easy storage [18], nanomaterials with enzymatic activities are increasingly becoming a popular research topic.
Most conventional nanozymes are metal-containing nanoparticles, such as Fe3O4, MnO2, V2O5, etc., and are biologically active, mainly due to the catalytic function of transition metals on compact nanoscale surfaces [19]. In nature, the binding pocket structure of biological enzymes provides a favorable spatial microenvironment in the vicinity of the active center, which is particularly important for high catalytic efficiency [20]. These features highlight the critical importance of active site components and supportive network environments for integration and stability. In 2007, a Fe3O4-based nanozyme was reported [21], which was also the earliest nanoparticle found to have peroxidase activity. Through research, it was found that the conversion between Fe2+/Fe3+ in a large number of iron atoms on the surface of the nanozyme is the key to ensure its enzyme activity. Therefore, iron-based nanozymes have attracted widespread attention due to their excellent catalytic activity, low cost, and good stability and have been widely applied in the field of biomedicine. Some iron-based nanomimetic enzymes have been used for glucose detection, such as MIL-53(Fe) [22], Fe-N-C SAzyme [23] and Fe/NC-800 [24]. However, the preparation of nanomaterials is labor-intensive, and most of them tend to aggregate during the preparation process with encapsulated catalytic sites and reduced specific surface area [25,26], which may affect their catalytic activity. Therefore, it remains challenging to explore new approaches to prepare novel nanozymes with a high density of active sites.
Precipitation polymerization enables the efficient preparation of nanoparticles with precisely controlled size and uniform particle size distribution in a short period of time as well as the introduction of multiple functional groups, providing a novel and promising strategy for the preparation of monodisperse stable nanomaterials [27,28,29]. Herein, lysine-based nanoparticles, Lys-NPs, were prepared in one step by precipitation polymerization using N-acryloyl-l-lysine as the polymerizing monomer and ethylene glycol dimethacrylate (EGDMA) as the cross-linking agent. By controlling the contents of cross-linking agents, nanoparticles with different sizes and morphologies were obtained. Then, Fe2+ coordinates with the lysine chain in the nanoparticles (Figure 1A), and the introduction of Fe2+ imparts Lys-NPs peroxidase-like activity. Its activity was assessed by catalyzing the oxidation of 3,3′,5,5-tetramethylbenzidine (TMB) with H2O2 to produce a blue product. In addition, an agarose hydrogel glucose sensor was constructed (Figure 1B), which proved to provide rapid and easy visual assessment and quantitative detection of glucose.

2. Experiment

2.1. Materials

CuSO4•5H2O, NaOH, Na2CO3, 8-Hydroxyquinoline, ammonium persulfate (APS) and P-phthalic acid (TA) were bought from Macklin Co., Ltd. (Shanghai, China). Ethylene Glycol Dimethacrylate (EGDMA), L-Lysine hydrochloride, FeSO4•7H2O, TMB, H2O2, glucose, glucose oxidase (GOx), uric acid, galactose, fructose, L-cysteine, mannose, sucrose, chitosan, cysteine, glutathione, urea, Na2HPO4•12H2O, NaH2PO4•2H2O, acetic acid (HAc), sodium acetate (NaAc), etc., were purchased from Heowons, Chemistry Co., Ltd. (Tianjin, China). The HAc-NaAc buffer solution was prepared by HAc and NaAc, and we used Na2HPO4•12H2O and NaH2PO4-2H2O to prepare the phosphate buffer solution (PBS). All reagents purchased above were used directly without further treatment. Water used in the experiment was deionized water.

2.2. Preparation of N-Acryloyl-l-lysine

N-acryloyl-l-lysine was synthesized according to Ref [30]. Briefly, NaOH (3.66 g), Na2CO3 (4.73 g), L-Lysine hydrochloride (8.16 g) and CuSO4•H2O (5.58 g) were added to water to form a mixed solution. Subsequently, acryloyl chloride (5.0 g) was added dropwise to the mixed solution at 0 °C and stirred for 2 h at room temperature. The blue precipitate obtained by filtration was washed with water, ethanol and petroleum ether in turn, dried, and then added to a mixture of water and dichloromethane containing 8-hydroxyquinoline; the mixture was then stirred magnetically for 1 h. Purified by filtration and washing, the white solid obtained by freeze-drying was N-acryloyl-l-lysine.

2.3. Preparation of Lys-NPs and Lys-Fe-NPs

Amounts of 100 mg N-acryloyl-l-lysine, 40 mg EGDMA and 5 mg APS were added to the flask, increased to a temperature of 70 °C and reacted in an atmosphere of nitrogen for seven hours to produce a white precipitate; the resulting precipitate was centrifuged at 10,000 rpm for 5 min, then washed with ultrapure water and centrifuged, and the resulting product was dried in a freezer. Then, Lys-NPs (5 mg) and FeSO4•7H2O (5 mg) were added to the aqueous solution and reacted for 3 h. The precipitate was washed and centrifuged several times, and the yellow powder obtained after freeze-drying was Lys-Fe-NPs. The formulations for the preparation of Lys-Fe-NPs with different cross-linker contents are shown in Table 1.

2.4. Measurement of Peroxidase-like Activity of Lys-Fe-NPs

The activity assay was performed using a typical peroxidase substrate TMB [31] with the following four groups: (1) Lys-Fe-NPs (50 μL, 10 μg/mL) + TMB (100 μL, 2 mM) + H2O2 (100 μL, 2 mM); (2) TMB (100 μL, 2 mM) + H2O2 (100 μL, 2 mM); (3) Lys-Fe-NPs (50 μL, 10 μg/mL) + TMB (100 μL, 2 mM); (4) TMB (100 μL, 2 mM). Then, to each control group was added acetate buffer solution to a total volume of 650 μL. The solution was incubated at 40 °C for 5 min, and the absorbance from 400 to 750 nm was measured by a UV spectrophotometer. Similarly, UV absorption measurements of Lys-Fe-NPs with different cross-linker contents were performed in the presence of H2O2 (100 μL, 2 mM) and TMB (100 μL, 2 mM), respectively. The material concentration dependence of the catalysis activity was researched by measuring the concentration of Lys-Fe-NPs from 0–20 μg/mL. Additionally, the influence of the pH of solution was examined in different buffer solutions with pH changes from 2–10. Further, the temperature dependence of the nanoparticles in the temperature range of 25–80 °C and the catalytic activity at different substrate concentrations were also investigated.

2.5. Steady-State Kinetic Assay

Firstly, the TMB concentrations were kept constant (4 mM), and the H2O2 concentrations were changed from 0.1 mM to 4.0 mM. Sodium acetate buffer (400 μL, pH = 3.5) and Lys-Fe-NPs (50 μL, 10 μg/mL) were added to make different concentrations of mixed solutions and were incubated at 40 °C for 5 min; the absorbance of each solution was measured by UV-vis spectrophotometer [32]. Similarly, the concentrations of H2O2 were kept constant (4 mM), and the TMB concentrations (0.1–4.0 mM) were varied. The kinetic analysis with H2O2 as a substrate was studied. The absorbance was recorded at 652 nm every 60 s at ambient temperature. Then, the initial reaction rate was measured by the Beer-Lambert law [33]: c = A/(ε b), where c is the substrate concentration, A is the absorbance, ε is the molar absorption coefficient of the used colorimetric substrates (39,000 M−1 cm−1 at 652 nm for oxTMB) [34], and b is the thickness of the solution. The enzymatic parameters were determined by fitting the absorbance data to the following Michaelis–Menten equation [35]: 1/V = Km/Vmax (1/[S] + 1/Km), where V is the initial reaction rate, Vmax is the maximum reaction rate, and [S] is the substrate concentration. Km is the Michaelis–Menten constant, which represents the affinity of the enzyme towards its substrate in the catalytic reaction.

2.6. Experimental Method for the Measurement of H2O2 and Glucose

First, for experiments to detect H2O2, 400 μL of HAc-NaAc buffer solution (pH = 3.5), 50 μL of Lys-Fe-NPs solution (10 μg/mL), 100 μL of TMB solution (2 mM) and 100 μL of different concentrations of H2O2 solution (1–1000 μM) were added sequentially to the centrifuge tubes and incubated in a shaker at 40 °C for 5 min before measuring the absorbance of the reaction solution in a UV-Vis spectrophotometer. The corresponding UV-Vis spectra were recorded between 400 and 750 nm, and the standard curves were plotted and measured three times in parallel. In order to determine the selectivity of H2O2 detection, comparison experiments were carried out by replacing H2O2 with TMB and common metal ions, and the final concentrations were set as 1 mM [36].
Glucose assay was performed as follows: 100 μL of 1 mg/mL glucose oxidase aqueous solution and 100 μL of different concentrations (0.5–400 μM) of glucose PBS solutions (pH = 6.4) were mixed well and reacted for 50 min at 37 °C. Then, 400 μL of sodium acetate buffer (pH = 3.5), 50 μL of Lys-Fe-NPs (10 μg/mL) and 100 μL of TMB solution (4 mM) were added to the above mixture and incubated in a shaker at 37 °C for another 50 min. Finally, the corresponding UV-Vis spectra were recorded between 400 and 750 nm, and the standard curves were plotted and measured three times in parallel. To test the selectivity of the glucose assay [37], a control experiment was performed in which lactose, fructose, sucrose, urea, cysteine, homocysteine, bovine serum albumin (BSA) and L-glutathione (GSH) were used instead of glucose, and the final concentrations were set as 4 mM.

2.7. Preparation of Integrated Agarose-Based Hydrogel Film

Agarose (0.05 g) was dissolved in 2.4 mL of ultrapure water and heated until the agarose was totally dissolved. Lys-Fe-NPs1 (300 μL, 50 μg/mL), TMB (100 μL, 4 mM), NaAc-HAc buffer solution (200 μL, pH 3.5) and glucose oxidase solution in PBS (100 μL, 1 mg/mL, pH = 6.4) were added. Then, the mixture was stirred until uniformly mixed. The gel film was naturally cooled, and 100 μL of different concentrations of glucose solutions (0.2–3 mM) were added dropwise; the relative UV-Vis spectra were measured between 400 and 750 nm, and the standard curves were plotted.

3. Results and Discussion

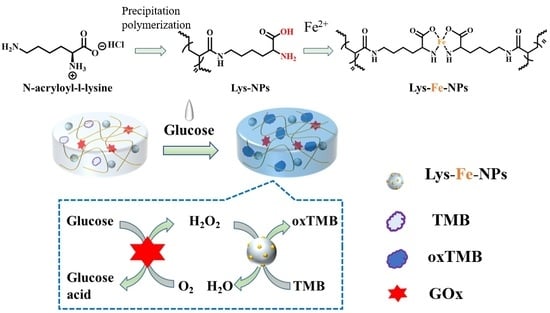
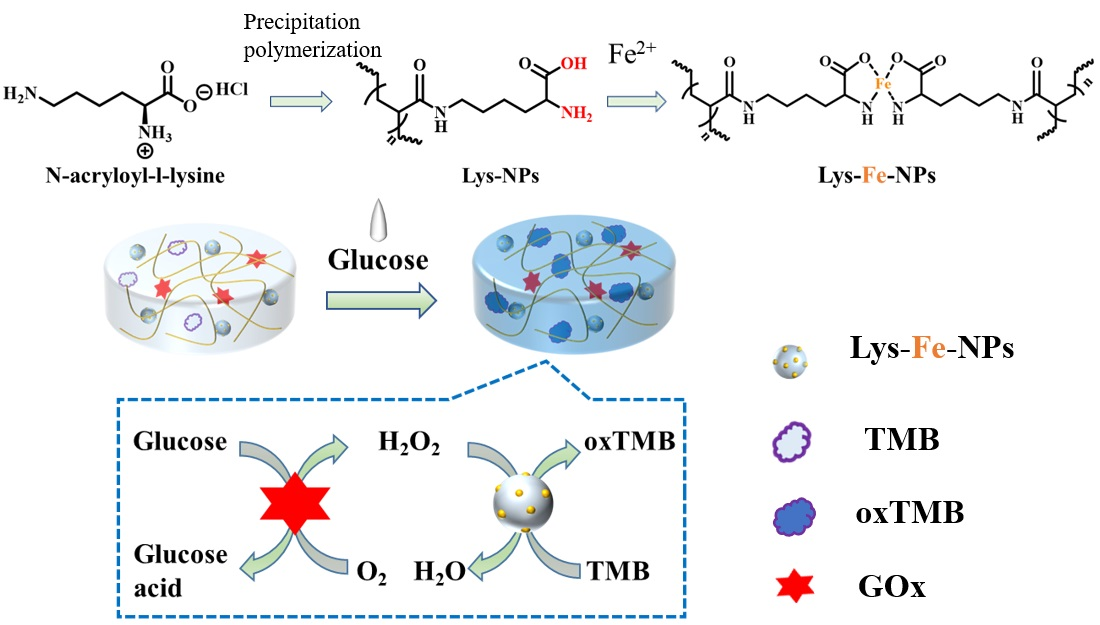
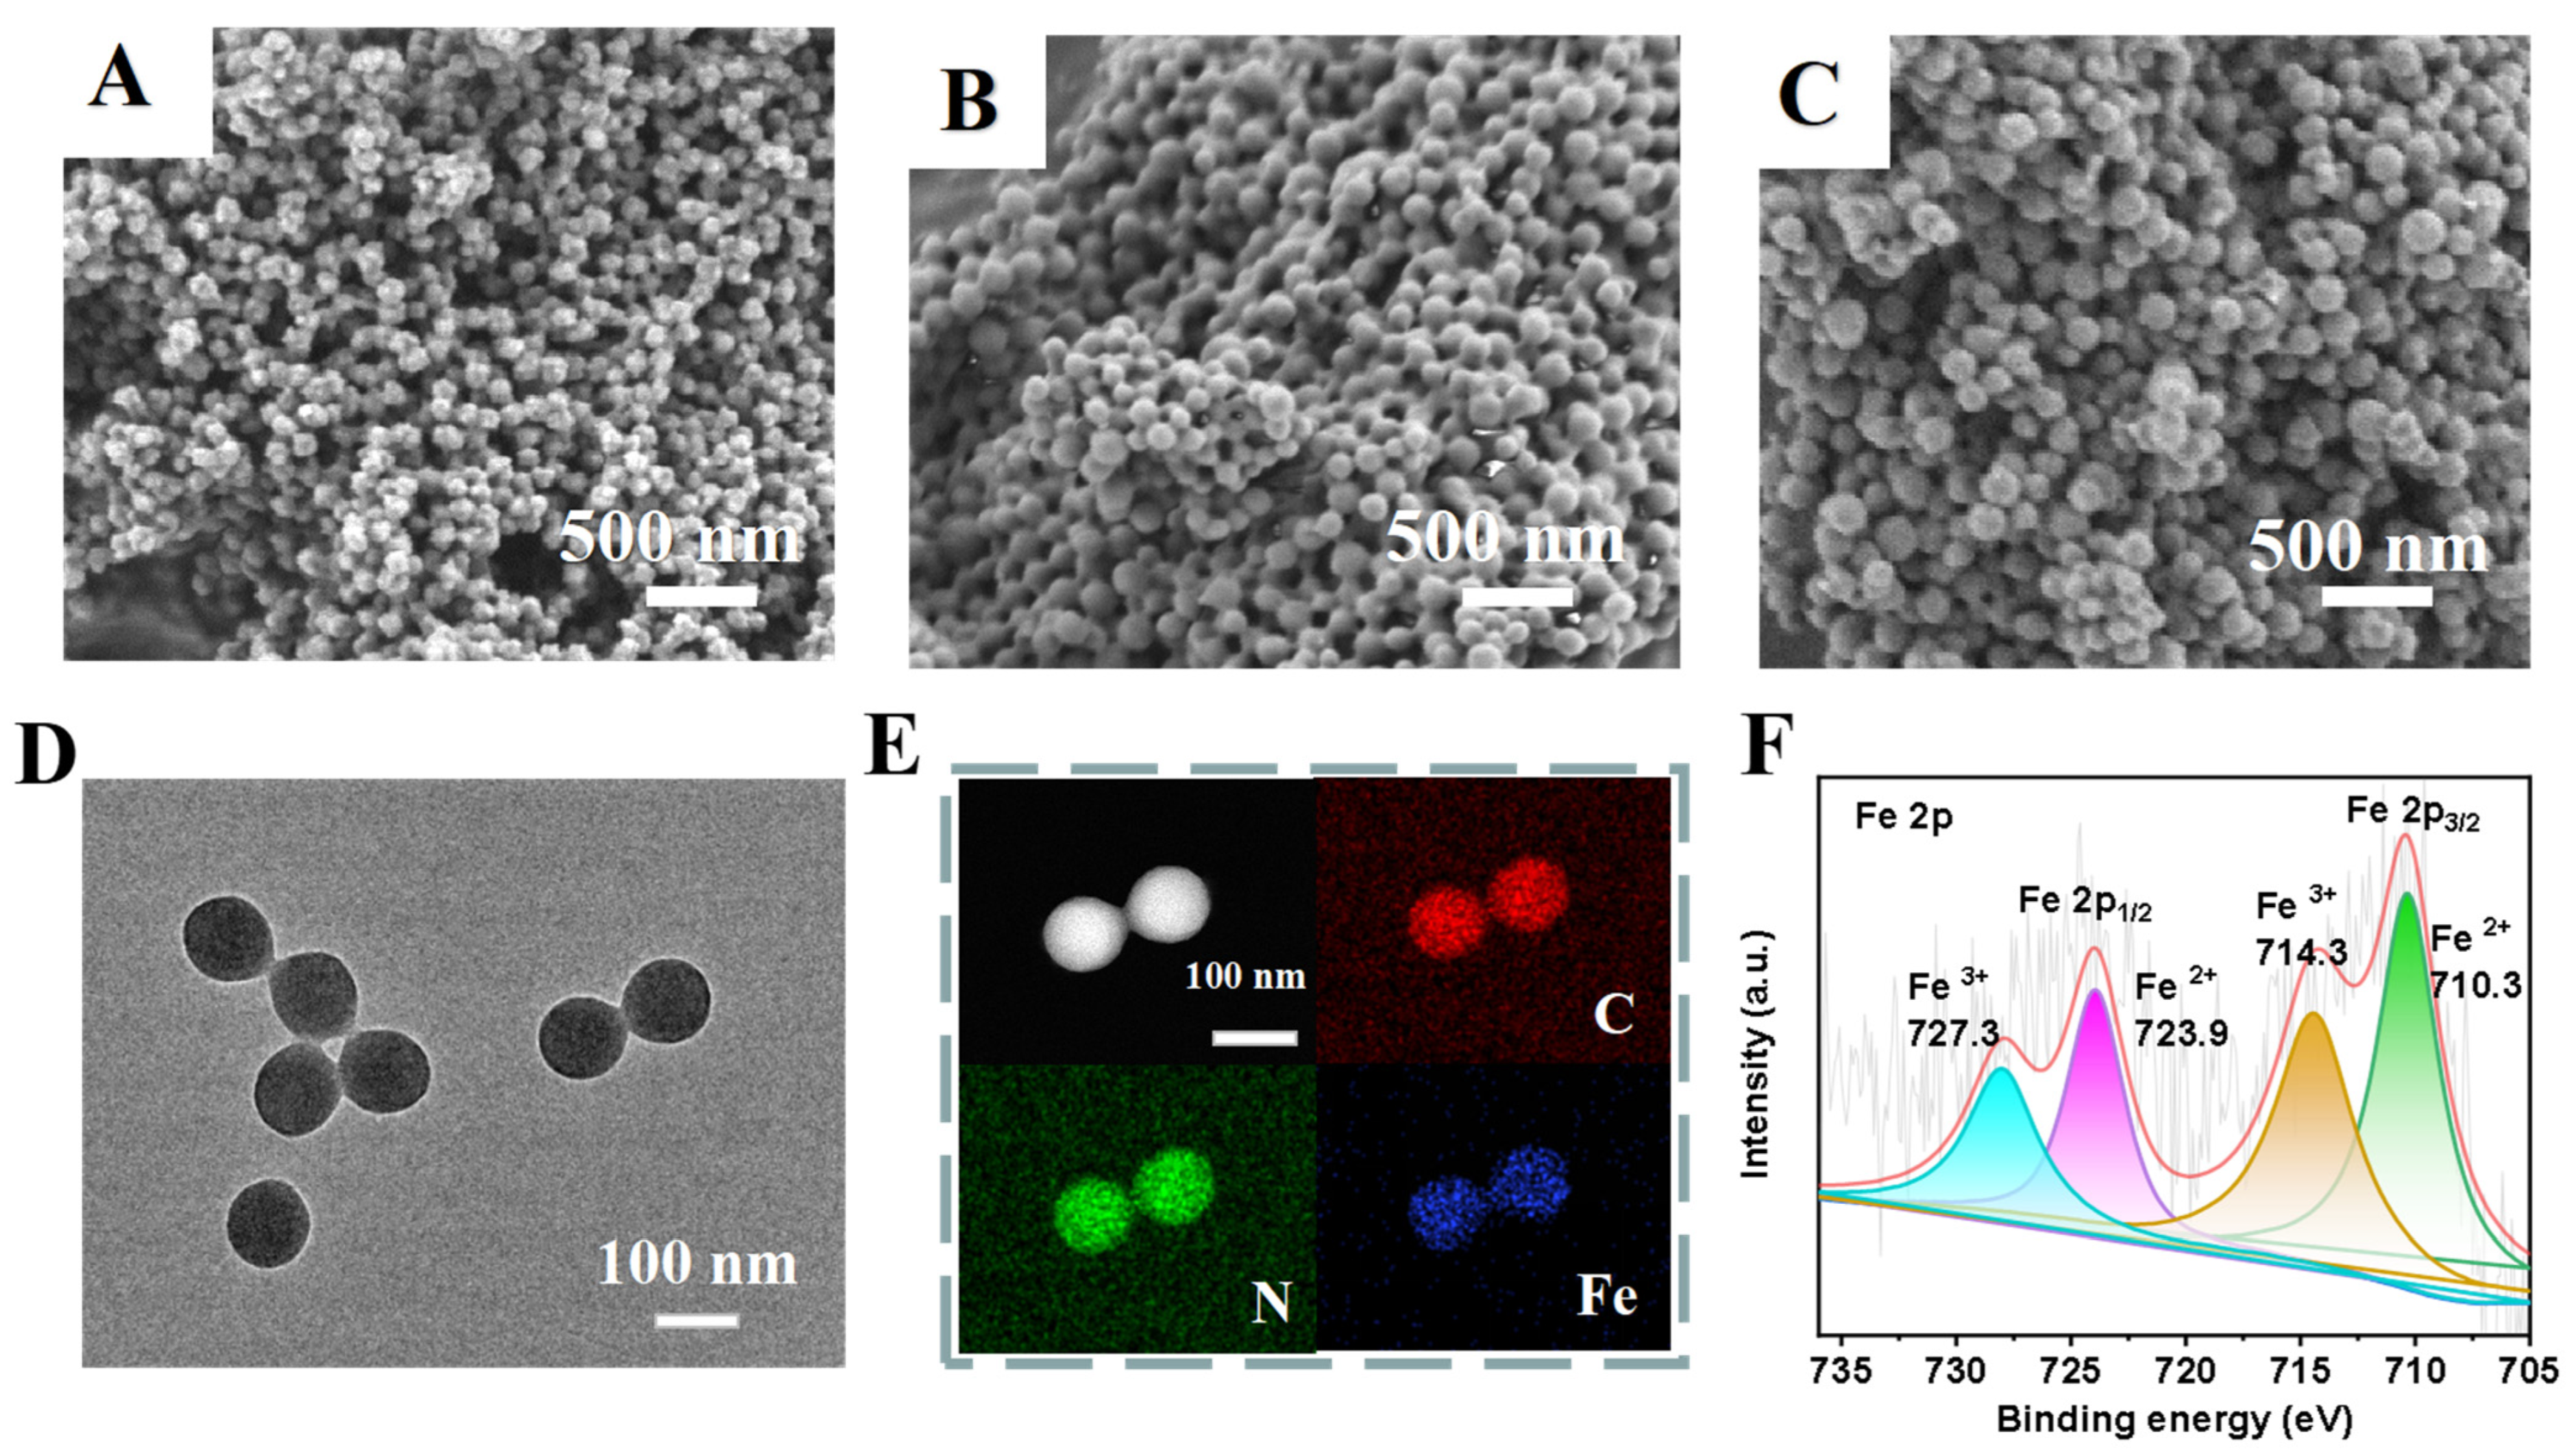
3.1. Preparation of Lys-Fe-NPs

Firstly, Lys-NPs were prepared in one step by precipitation polymerization (Figure S1) using N-acryloyl-l-lysine (Figure S2) as the polymerizing monomer and EGDMA as the cross-linking agent (Table 1). Homogeneous and dispersed spherical nanoparticles were obtained after complexation with iron, as shown in SEM images in Figure 2A–C. The size of the nanoparticles could be controlled by adjusting the amount of cross-linker EGDMA, as shown in Table 1. As the contents of the cross-linker increase, the nanoparticle size increases. The results of dynamic light scattering (DLS) showed that the diameter was slightly larger compared to that determined by SEM (Table 1), which could be accounted for by the presence of a hydrated layer of nanoparticles. Lys-NPs and their iron ion complexes (Lys-Fe-NPs) have similar particle size and size distribution (Figure S3). The energy dispersive X-ray spectroscopy (EDS) mapping images of Lys-Fe-NPs1 confirm homogeneous distributions of carbon, nitrogen and iron elements, confirming the successful complexation of iron ions with Lys-NPs (Figure 2D,E). In the FT-IR spectra, the appearance of characteristic peaks corresponding to O-Fe bonds at 602 cm−1 and the weakening of the peak at 3428.9 cm−1 further indicate the successful coordination of iron ions [30] (Figure S4). Then, the stability of the three Fe2+-complexed Lys-Fe-NPs with different contents of cross-linking agent were evaluated by detecting their size and size distribution at room temperature in PBS solution; all the nanoparticles maintained stable and monodispersed in PBS solution for as long as 7 days, verifying their superior stability and insuring the feasibility of long-term storage (Figure S5). In addition, the chemical constituents and valency states were analyzed by XPS. Figure S6 obviously showed distribution of the four typical peaks of C 1s, N 1s, O 1s and Fe 2p in Lys-Fe-NPs1, with atomic contents of 67.58%, 6.23%, 23.85% and 2.34%, respectively. Due to the ligand field and spin-orbit splittings, the peaks at 727.3 eV and 723.9 eV belong to Fe3+2p1/2 and Fe2+2p1/2, and binding energy peaks of Fe3+2p3/2 and Fe2+2p3/2 were observed at 714.3 eV, and 710.3 eV, respectively (Figure 2F) [38]. The EDS spectrum shown in Figure S7 recently confirmed the presence of C (67.69%), N (5.22%), N (24.55%) and Fe (2.54%) in Lys-Fe-NPs1, consistent with the XPS result. All the above results suggest the successful preparation of Lys-Fe-NPs1. Considering that the monodispersity of the three nanoparticles is similar, and the size of Lys-Fe-NPs1 is the smallest, Lys-Fe-NPs1 was used mainly for the following experiments.

3.2. Peroxidase-like Catalytic Activity of Lys-Fe-NPs

Owing to the presence of iron, Lys-Fe-NPs may have a catalytic role in simulating the peroxidase enzymatic activity. By catalyzing TMB in the presence of H2O2 to assess the peroxidase-like activity of Lys-Fe-NPs, when Lys-Fe-NPs1 was added to the TMB-H2O2 solution, the solution gradually became blue and had a noticeable UV characteristic absorption peak at 652 nm, which was considered as the generation of oxTMB. In contrast, in the absence of Lys-Fe-NPs1, the absorption in the wavelength range of 400–750 nm was negligible (Figure 3A). It was found that Lys-Fe-NPs2 and Lys-Fe-NPs3 showed similar peroxidase activity under the same experimental conditions by TMB UV absorption assay (Figure S8). All the above results indicate that Lys-Fe-NPs can oxidize TMB in the presence of H2O2 to turn the solution blue and have a maximum absorption at 652 nm, with good peroxidase-like activity.
The plot of absorbance at 652 nm depending on time (Figure 3B) indicated that as the concentrations of Lys-Fe-NPs1 increased, the absorbance changed and the reaction rate increased significantly. Common factors influencing enzyme activity, including the pH of the solution, the temperature during catalytic reaction, and the concentrations of substrate were then measured. The catalytic activity of peroxidase was compared for Lys-Fe-NPs1 at pH values from 2 to 10 (Figure 3C) and at different temperatures from 25 to 80 °C (Figure 3D). It was proven experimentally that the solution pH for the nanoparticle Lys-Fe-NPs1 to reach the optimal catalytic activity is 3.5 with a reaction temperature of 40 °C. The reason is that the weak acid reaction system facilitates the formation of TMB oxidation intermediates, H2O2 decomposes by its own oxidation when the temperature exceeds 40 °C, and the resulting TMB oxidation intermediate is unstable, so the catalytic activity gradually decreases. Therefore, we chose pH 3.5 and 40 °C as the standard conditions for the subsequent experiments. Subsequently, we examined the effects of different substrates as well as different substrate concentrations on the catalytic activity of Lys-Fe-NPs1, and the results obviously showed that the absorbance value at 652 nm grew gradually with increasing H2O2 or TMB concentrations (Figure 3E,F). Furthermore, no inhibition of the reaction catalyzed by Lys-Fe-NPs1 was found at H2O2 concentrations up to 4.0 mM or TMB concentrations up to 4.0 mM, indicating that Lys-Fe-NPs1 also exhibited stable catalytic activity in high concentrations of H2O2 or TMB.

3.3. Kinetic Data and Reaction Mechanism of Lys-Fe-NPs

The measurement of catalytic activity and kinetics of the peroxidase-like Lys-Fe-NPs using standardized assays was performed according to the research. Based on the above catalytic activity–dependent substrate concentration analysis, we investigated the kinetic parameters of the enzymatic reaction of Lys-Fe-NPs1 using homeostatic kinetics. A typical Michaelis–Menten curve was obtained for Lys-Fe-NPs1 in a suitable concentration range of H2O2 and TMB, and Km was determined as a measure of the affinity of the enzyme for the substrate. A low Km value represents a strong affinity, and vice versa. In the Lys-Fe-NPs1/TMB/H2O2 system, other conditions were kept unchanged, except the amount of H2O2. It was found that Km = 0.478 mM and Vmax = 4.73 × 10⁻⁸ M/s of H2O2 (Figure 4A). Other conditions were kept unchanged, but the amount of TMB was varied. As shown in Figure 4B, Km = 0.372 mM and Vmax = 4.35 × 10⁻⁸ M/s of TMB. This indicated that Lys-Fe-NPs1 had a high affinity for both H2O2 and TMB.
From Figure 4A,B, it can be observed that the trends of the initial rates of TMB and H2O2 with concentrations are linear and parallel, indicating that the catalytic process of Lys-Fe-NPs1 is also consistent with the ping-pong mechanism [39]. This means that Lys-Fe-NPs1 first bind and react with the first substrate and then release the products of the first reaction before reacting with the second substrate.
The catalytic oxidation of TMB may be due to the hydroxyl radical (•OH) that is generated by the peroxidase-assisted H2O2 decomposition [23]. We adopted typical hydroxyl radical trapping agent TA to detect the generation of hydroxyl radicals. The non-fluorescent TA combines with •OH to produce the highly fluorescent 2-hydroxyterephthalic acid, with a distinct peak at 440 nm. As shown in Figure 4C, the mixed solutions of TA and Lys-Fe-NPs1 showed no significant intensity of 2-hydroxyterephthalic acid, and mixed solutions containing TA and H2O2 appeared faintly fluorescent at 440 nm. Only in the presence of both Lys-Fe-NPs1 and H2O2 was intense fluorescence found at 440 nm. The results suggest that more •OH was produced in the system of [TA + H2O2 + Lys-Fe-NPs1]. H2O2 and Lys-Fe-NPs1 were two important factors for the formation of 2-hydroxyterephthalic acid. It has further been shown that Lys-Fe-NPs1 promotes the decomposition of H2O2 to form more •OH, while TMB binds to •OH to produce oxTMB.

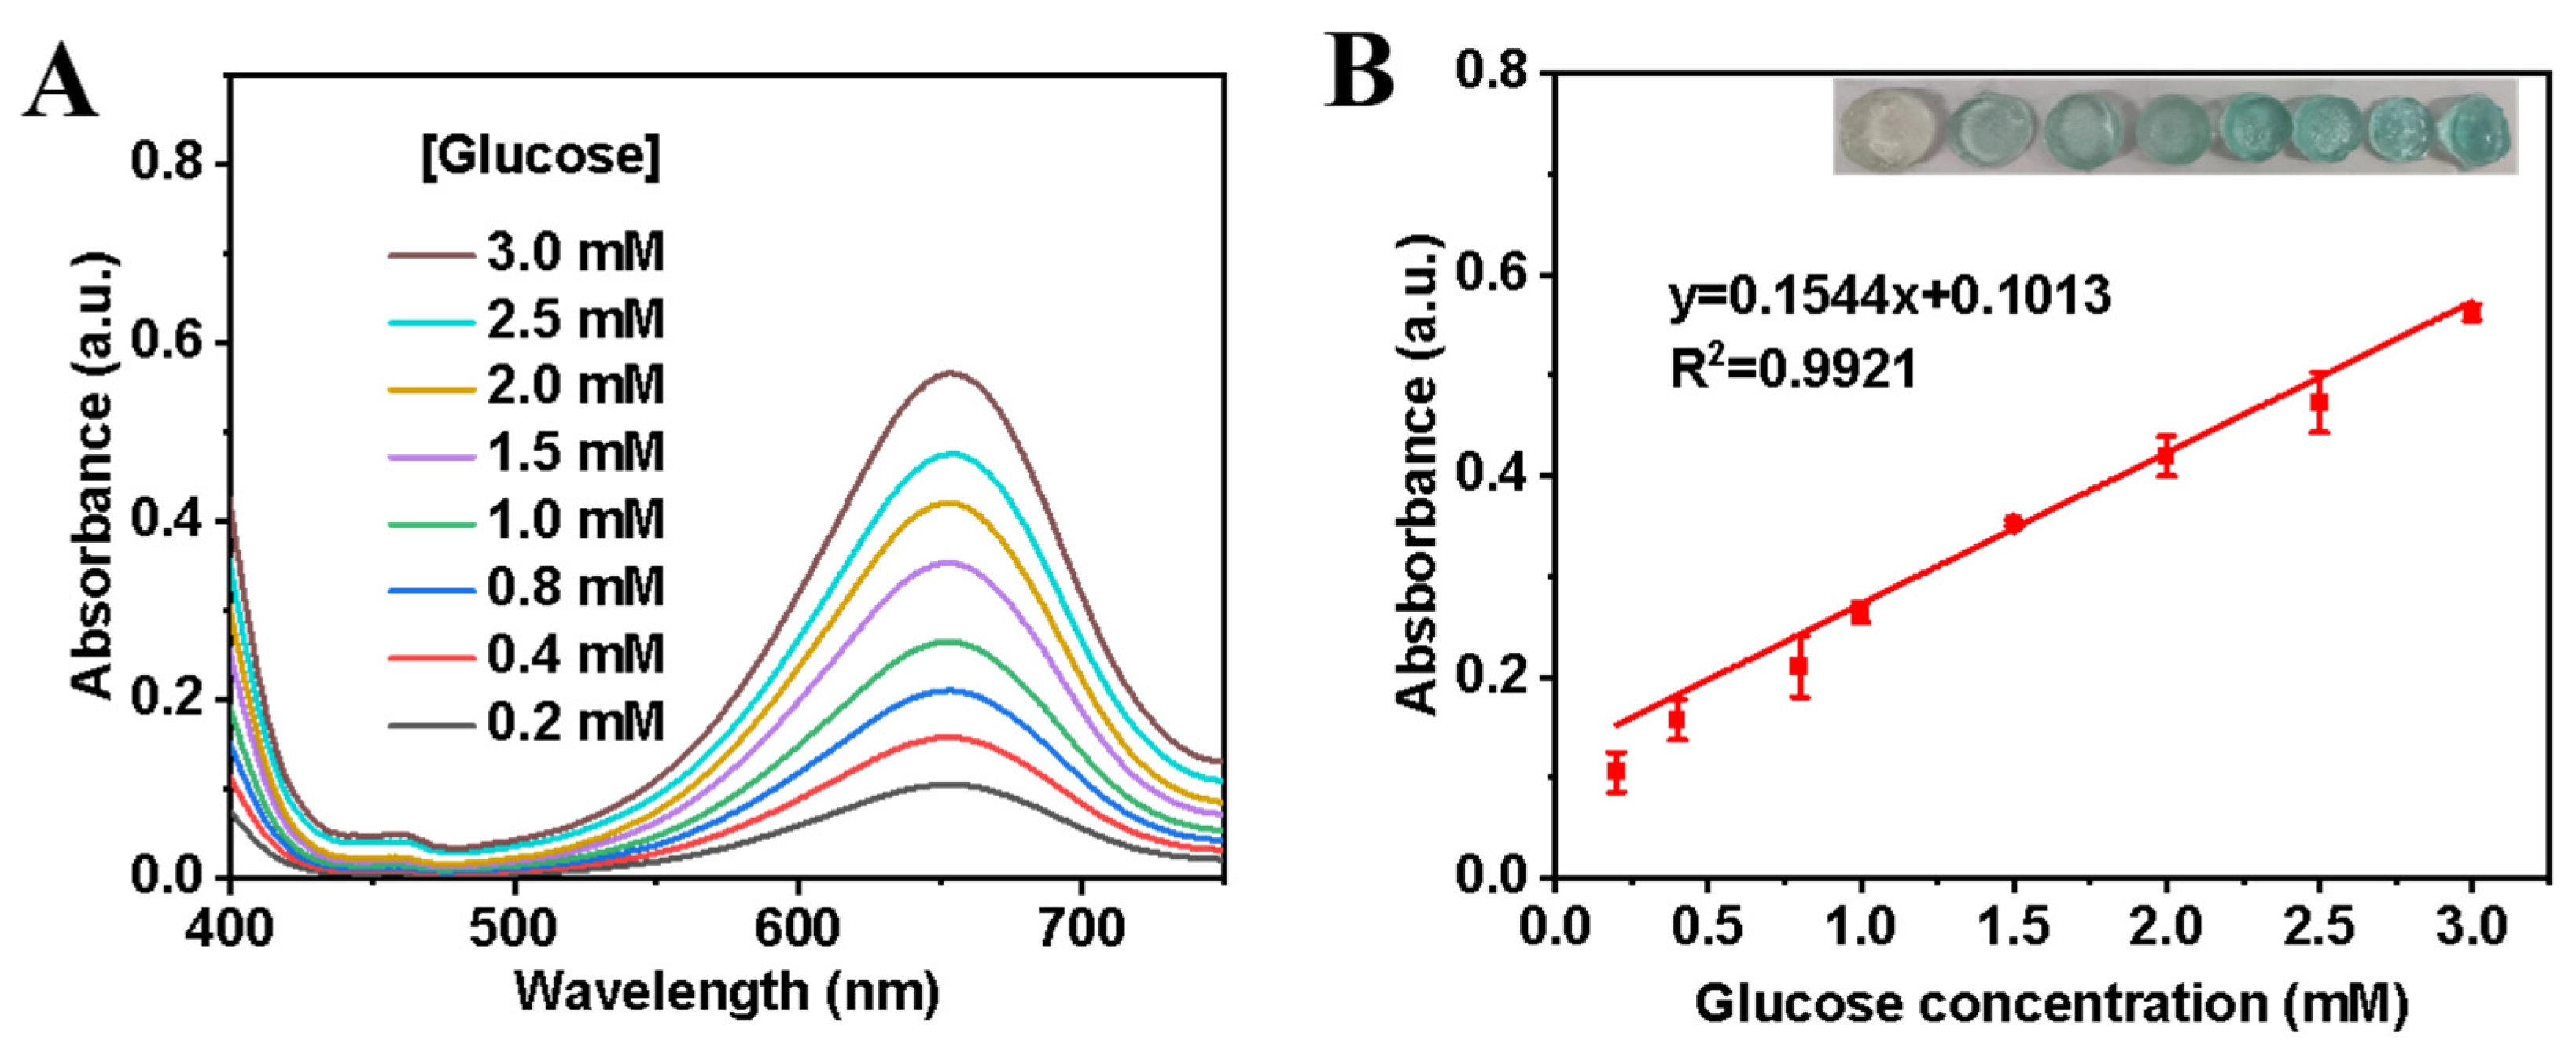
3.4. Colorimetric Assays for H2O2 and Glucose

Since the color change of oxTMB created by Lys-Fe-NPs1 was related to the concentration of H2O2, a colorimetric method for the assay of H2O2 was developed, with optimized conditions. In the Lys-Fe-NPs1/TMB/H2O2 reaction system, the concentrations of TMB and Lys-Fe-NPs1 were kept at 2 mM and 10 μg/mL, respectively. As the final H2O2 concentrations changed from 1 to 1000 μM, The color of the measured solution samples became darker, which revealed the creation of blue oxTMB (Figure 5A). The different absorbance values corresponding to different H2O2 concentrations were useful for quantification (Figure 5B), which can further illustrate the correspondence between the concentration of H2O2 and the absorbance of oxTMB. The H2O2 concentration response equation was y = 0.0019x + 0.1152; this equation had a good linear relationship (R2 = 0.9991). The linear range was from 1 to 200 μM, and the detection limit (LOD) of H2O2 was 0. 51 μM (S/N = 3).
In addition, the selectivity of Lys-Fe-NPs1 was divided into selectivity for H2O2 and selectivity for glucose by investigating the response of the Lys-Fe-NPs1-GOx-TMB system to common interfering chemicals. Compared with common metal ions and TMB at the same substrate concentration, only H2O2 caused the reaction of Lys-Fe-NPs1 (Figure 5C).
Glucose testing has raised concerns because glucose is a key indicator in the treatment of diabetes in a clinical setting. It is commonly known that in the presence of GOx, glucose is oxidized to form gluconic acid and H2O2; thus, the H2O2 concentration is linearly related to the glucose concentration. Hence, when these two different catalytic reactions are correlated in the presence of GOx and Lys-Fe-NPs1 hybrid nanomaterials, the oxTMB concentration should also be linearly related to the glucose concentration. In the Lys-Fe-NPs1-GOx-TMB reaction system, As the glucose concentration increased from 0.5 to 400 μM, the color of the examined samples became deeper (Figure 5D), which indicated the creation of blue oxTMB. The different absorbance values corresponding to different glucose concentrations were useful for quantification, which can further illustrate the correspondence between the concentration of glucose and the absorbance of oxTMB (Figure 5E). The results showed that the glucose concentration response equation was y = 0.0022x + 0.0352; this equation had a good linear relationship (R2 = 0.9993). The linear range was from 0.5 to 150 μM, and the limit of detection (LOD) of glucose was 0.32 μM (S/N = 3).
To test the selectivity of this colorimetric method, a number of possible interferents, such as lactose, fructose, sucrose, urea, cysteine and homocysteine, were used in a control experiment under the same conditions. As illustrated in Figure 5F, only glucose produced a significant color change in the solution, while the interfering chemicals mentioned above remained colorless and identical to the blank, which strongly indicates the high selectivity of Lys-Fe-NPs for glucose. Furthermore, the absorbance in the presence of the interfering molecule was essentially the same as that of glucose alone (Figure S9), which further evidenced the selectivity of the system. Therefore, the colorimetric method allows a highly selective detection of glucose, which is attributed to the specificity of GOx for glucose.

3.5. Lys-Fe-NPs-GOx-TMB Agarose-Based Hydrogel

To investigate the biological utility of the Lys-Fe-NPs-GOx-TMB colorimetric sensing system, especially for medical detection, we designed a low-cost agarose hydrogel biosensing medium containing GOx, TMB, and Lys-Fe-NPs1 for sensitive detection of glucose.
Then, we dropped different concentrations of glucose on the above hydrogel film to analyze the absorption spectra and the corresponding color changes. As demonstrated in Figure 6A,B, the hydrogel film gradually changed from colorless to blue with increasing glucose concentration from 0.2 to 3 mM, while the absorbance at 652 nm also increased. A good linear correlation was also obtained in the range of 0.2–3 mM (Figure 6B). Sensitive sensing of glucose may be attributed to multiple active sites on the structural surface of Lys-Fe-NPs1. Considering that glucose concentrations in the blood of diabetic patients and healthy individuals are 9–40 mM and 3–8 mM, respectively [40], the colorimetric sensor developed for the determination of glucose is sufficiently sensitive.

4. Conclusions

In summary, we prepared iron-coordinated lysine-based nanozymes by precipitation polymerization with homogeneous size, stability and high peroxidase-like catalytic activity, which can sensitively detect H2O2 and glucose with low detection limits of 0.51 μM and 0.32 μM, respectively. After the accurate colorimetric detection of glucose in solution by the Lys-Fe-NPs-GOx-TMB system, we developed an agarose-based hydrogel colorimetric biosensor for the successful visualization and quantitative assessment of glucose. The prepared colorimetric method for detection of H2O2 and glucose using Lys-Fe-NPs has good sensitivity and great potential applications in biological detection fields.

Supplementary Materials

The following supporting information can be downloaded at: https://www.mdpi.com/article/10.3390/polym15143002/s1.

Author Contributions

X.H. (Xiuli Hu) conceived and designed the experiments; X.H. (Xiuqing Hou) performed the experiments; X.H. (Xiuqing Hou) and M.Z. characterized part of materials; R.W. analyzed the data; X.H. (Xiuqing Hou) wrote the paper; H.Z. edited the paper; X.H. (Xiuli Hu) and X.Q. provided the fund. All authors have read and agreed to the published version of the manuscript.

Funding

This work is supported by the Central Guidance for Local Science and Technology Development Funds Projects (No. 226Z1203G).

Institutional Review Board Statement

Not applicable.

Data Availability Statement

Not applicable.

Conflicts of Interest

The authors declare no conflict of interest.

References

  1. López-Lázaro, M. Dual role of hydrogen peroxide in cancer: Possible relevance to cancer chemoprevention and therapy. Cancer Lett. 2007, 252, 1–8. [Google Scholar] [CrossRef]
  2. Wang, K.; Zhang, R.X.; Yue, X.M. Synthesis of diboronic acid-based fluorescent probes for the sensitive detection of glucose in aqueous media and biological matrices. ACS Sens. 2021, 6, 1543–1551. [Google Scholar] [CrossRef] [PubMed]
  3. Liu, J.; Shen, X.; Baimanov, D. Immobilized ferrous Ion and glucose oxidase on graphdiyne and its application on one-step glucose detection. ACS Appl. Mater. Interfaces 2019, 11, 2647–2654. [Google Scholar] [CrossRef] [PubMed]
  4. Zhao, L.P.; Zhang, F.; Ding, X.Y. Gut bacteria selectively promoted by dietary fibers alleviate type 2 diabetes. Science 2018, 359, 1151–1156. [Google Scholar] [CrossRef] [Green Version]
  5. Huang, D.; Wang, X.; Zhang, C. Sorptive removal of ionizable antibiotic sulfamethazine from aqueous solution by graphene oxide-coated biochar nanocomposites: Influencing factors and mechanism. Chemosphere 2017, 186, 414–421. [Google Scholar] [CrossRef]
  6. Bommer, C.; Heesemann, E.; Sagalova, V. he global economic burden of diabetes in adults aged 20–79 years: A cost-of-illness study. Lancet Diabetes Endocrinol. 2017, 5, 423–430. [Google Scholar] [CrossRef]
  7. Jiang, L.C.; Zhang, W.D. Electrodeposition of TiO2 nanoparticles on multiwalled carbon nanotube arrays for hydrogen peroxide sensing. Electroanalysis 2009, 21, 988–993. [Google Scholar] [CrossRef]
  8. Fan, X.; Tian, R.; Wang, T. An ultrathin iron-porphyrin based nanocapsule with high peroxidase-like activity for highly sensitive glucose detection. Nanoscale 2018, 10, 22155–22160. [Google Scholar] [CrossRef] [PubMed]
  9. Luo, W.; Zhu, C.; Su, S. Self-catalyzed, Self-limiting growth of glucose oxidase-mimicking gold nanoparticles. Acs Nano 2010, 4, 7451–7458. [Google Scholar] [CrossRef]
  10. Liu, B. Surface modification of nanozymes. Nano Res. 2017, 10, 24. [Google Scholar] [CrossRef]
  11. Fidelli, A.M.; Bahar, K.; Howarth, A.J. Green and rapid mechanosynthesis of high-porosity NU- and UiO-type metal-organic frameworks. Chem. Commun. 2018, 54, 6999–7002. [Google Scholar] [CrossRef] [Green Version]
  12. Wu, J.; Wang, X.; Quan, W. Nanomaterials with enzyme-like characteristics (nanozymes): Next-generation artificial enzymes (II). Chem. Soc. Rev. 2019, 48, 1004–1076. [Google Scholar] [CrossRef] [PubMed]
  13. Yan, X.Y. Nanozyme: A new type of artificial enzyme. Prog. Biochem. Biophys. 2018, 45, 101–104. [Google Scholar]
  14. Wang, G.; Yan, L.; Ren, H. Functional cell surface displaying of acetylcholinesterase for spectrophotometric sensing organophosphate pesticide. Sens. Actuators B Chem. 2019, 279, 483–489. [Google Scholar]
  15. Zhang, X.; Lin, S.; Liu, S. Advances in organometallic/organic nanozymes and their applications. Coord. Chem. Rev. 2020, 429, 213652. [Google Scholar] [CrossRef]
  16. Han, L.; Shi, J.; Liu, A. Novel biotemplated MnO2 1D nanozyme with controllable peroxidase-like activity and unique catalytic mechanism and its application for glucose sensing. Sens. Actuators B Chem. 2017, 252, 919–926. [Google Scholar] [CrossRef]
  17. Fan, S.Q.; Liang, B.; Xiao, X.X. Controllable display of sequential enzymes on yeast surface with enhanced biocatalytic activity toward efficient enzymatic biofuel cells. J. Am. Chem. Soc. 2020, 142, 3222–3230. [Google Scholar] [CrossRef]
  18. Hu, Y.; Dai, L.; Liu, D. Progress & prospect of metal-organic frameworks (MOFs) for enzyme immobilization (enzyme/MOFs). Renew. Sustain. Energy Rev. 2018, 91, 793–801. [Google Scholar]
  19. Johnson, L.K. Witness testimony from the Church Committee hearings on covert action, 1975. Intell. Natl. Secur. 2019, 34, 899–913. [Google Scholar] [CrossRef]
  20. Liao, J. Molecular recognition of protein kinase binding pockets for design of potent and selective kinase inhibitors. J. Med. Chem. 2007, 50, 409–424. [Google Scholar] [CrossRef] [PubMed]
  21. Gao, L.; Zhuang, J.; Nie, L. Intrinsic peroxidase-like activity of ferromagnetic nanoparticles. Nat. Nanotechnol. 2007, 2, 577–583. [Google Scholar] [CrossRef] [PubMed]
  22. Lin, T.; Qin, Y.; Huang, Y. A label-free fluorescent assay for hydrogen peroxide and glucose based on bifunctional MIL-53(Fe) nanozyme. Chem. Commun. 2018, 54, 1762–1765. [Google Scholar] [CrossRef] [PubMed]
  23. Jiao, L.; Xu, W.; Yan, H. Fe-N-C Single-Atom Nanozyme for the Intracellular Hydrogen Peroxide Detection. Anal. Chem. 2019, 91, 11994–11999. [Google Scholar] [CrossRef]
  24. Chen, Q.; Liang, C. High oxidase-mimic activity of Fe nanoparticles embedded in an N-rich porous carbon and their application for sensing of dopamine. Talanta Int. J. Pure Appl. Anal. Chem. 2018, 182, 476–483. [Google Scholar] [CrossRef]
  25. Tan, D.H.; Ma, C.; Gao, L. Metal-organic framework-derived copper nanoparticle@carbon nanocomposites as peroxidase mimics for colorimetric sensing of ascorbic acid. Chem.-A Eur. J. 2014, 20, 16377–16383. [Google Scholar] [CrossRef]
  26. Oh, J.K.; Drumright, R.; Matyjaszewski, K. The development of microgels/nanogels for drug delivery applications. Prog. Polym. 2008, 33, 448–477. [Google Scholar] [CrossRef]
  27. Jin, S.; Pan, Y.J.; Wang, C.C. Reflux Precipitation Polymerization: A New Technology for Preparation of Monodisperse Polymer Nanohydrogels. Acta Chim. Sin. 2013, 71, 1500–1504. [Google Scholar] [CrossRef] [Green Version]
  28. Kai, L.; Stöver, H. Synthesis of monodisperse poly(divinylbenzene) microspheres. J. Polym. Sci. Part A Polym. Chem. 2010, 31, 3257–3263. [Google Scholar]
  29. Wang, F.; Zhang, Y.T.; Yang, P. Fabrication of polymeric microgels using reflux-precipitation polymerization and its application for phosphoprotein enrichment. J. Mater. Chem. B 2013, 2, 2575–2582. [Google Scholar] [CrossRef] [PubMed]
  30. Qi, M.; Pan, H.; Sheng, H.D. Nanogel Multienzyme Mimics Synthesized by Biocatalytic ATRP and Metal Coordination for Bioresponsive Fluorescence Imaging. Angew. Chem. 2020, 59, 11748–11753. [Google Scholar] [CrossRef]
  31. Feng, J.; Huang, P.; Wu, F.Y. Gold-platinum bimetallic nanoclusters with enhanced peroxidase-like activity and their integrated agarose hydrogel-based sensing platform for the colorimetric analysis of glucose levels in serum. Analyst 2017, 142, 4106–4115. [Google Scholar] [CrossRef]
  32. Lian, J.J.; He, Y.L.; Li, N. Magnetic Flower-like Fe-doped CoO nanocomposites with dual enzyme-like activities for Facile and sensitive determination of H2O2 and dopamine. Inorg. Chem. 2021, 60, 1893–1901. [Google Scholar] [CrossRef] [PubMed]
  33. Chen, Q.; Liu, M.L.; Zhao, J.N. Water-dispersible silicon dots as a peroxidase mimetic for the highly-sensitive colorimetric detection of glucose. Chem. Commun. 2014, 50, 6771–6774. [Google Scholar] [CrossRef] [PubMed]
  34. Zhao, Y.; Yu, H.; Wu, J. Mixed-solvent liquid exfoliated MoS2NPs as peroxidase mimetics for colorimetric detection of H2O2 and glucose. RSC Adv. 2018, 8, 7252–7259. [Google Scholar] [CrossRef]
  35. Li, Y.Z.; Li, T.T.; Chen, W. Co4N Nanowires: Noble-metal-free peroxidase mimetic with excellent salt- and temperature-resistant abilities. ACS Appl. Mater. Interfaces 2017, 9, 29881–29888. [Google Scholar] [CrossRef]
  36. Chen, M.; Zhou, H.; Liu, X. Single Iron Site Nanozyme for Ultrasensitive Glucose Detection. Small 2020, 16, 2002343. [Google Scholar] [CrossRef]
  37. Bao, Y.W.; Hua, X.W.; Ran, H.H. Metal-doped carbon nanoparticles with intrinsic peroxidase-like activity for colorimetric detection of H2O2 and glucose. J. Mater. Chem. B 2018, 7, 296–304. [Google Scholar] [CrossRef] [PubMed]
  38. Du, L.L.; Liao, R.X.; Zhang, H.J. Redox-activity of polydopamine for ultrafast preparation of self-healing and adhesive hydrogels. Colloids Surf. B Biointerfaces 2022, 214, 112469. [Google Scholar] [CrossRef] [PubMed]
  39. Liu, X.Y.; Zhang, Q.; Li, M. Horseradish peroxidase (HRP) and glucose oxidase (GOx) based dual-enzyme system: Sustainable release of H2O2 and its effect on the desirable ping pong bibi degradation mechanism. Environ. Res. 2023, 229, 115979. [Google Scholar] [CrossRef]
  40. Yang, X.; Pehr, E.P. Double-Stranded DNA Single-Walled Carbon Nanotube Hybrids for Optical Hydrogen Peroxide and Glucose Sensing. J. Phys. Chem. C 2007, 111, 8638–8643. [Google Scholar]
Figure 1. (A) Schematic diagram of the preparation of Lys-Fe-NPs. (B) Integration of agarose-based hydrogels for colorimetric detection of glucose.
Polymers 15 03002 g001
Figure 2. SEM images of Lys-Fe-NPs with different counts of cross-linker: (A) Lys-Fe-NPs1, (B) Lys-Fe-NPs2 and (C) Lys-Fe-NPs3. (D) TEM image and (E) EDS mapping image of Lys-Fe-NPs1. (F) Fe 2p XPS spectra of Lys-Fe-NPs1.
Polymers 15 03002 g002
Figure 3. (A) UV-vis absorption spectra of solutions with different compositions; inset: corresponding pictures of the different solution samples. (B) Absorbance of the TMB-H2O2 reaction system catalyzed by different concentrations of Lys-Fe-NPs1 depending on time. (CF) Effect of various factors on the peroxide-like properties of Lys-Fe-NPs1: (C) pH of solutions, (D) temperature of reaction, (E) concentration of H2O2, (F) concentration of TMB.
Polymers 15 03002 g003
Figure 4. Kinetic assay of Lys-Fe-NPs1: (A) 4 mM TMB with varied concentrations of H2O2; inset: Lineweaver–Burk plots. (B) 4 mM H2O2 with varied concentrations of TMB; inset: Lineweaver–Burk plots. (C) Fluorescence spectra of TA + H2O2 + Lys-Fe-NPs1, TA + H2O2 and TA + Lys-Fe-NPs1 after incubation.
Polymers 15 03002 g004
Figure 5. (A) UV-vis absorption spectra of Lys-Fe-NPs1 in different H2O2 concentrations. (B) Absorbance of oxTMB for Lys-Fe-NPs1 at different H2O2 concentrations; inset: standard curve (at 652 nm). (C) The selectivity of Lys-Fe-NPs1 for H2O2 detection. (D) UV-vis absorption spectra of Lys-Fe-NPs1 in different glucose concentrations. (E) Absorbance of oxTMB for Lys-Fe-NPs1 at different glucose concentrations; inset: standard curve (at 652 nm). (F) Experiment on the specific selectivity of Lys-Fe-NPs1 for glucose detection.
Polymers 15 03002 g005
Figure 6. (A) UV-vis absorption spectra of Lys-Fe-NPs in different glucose concentrations. (B) Linear calibration curve of the absorbance at 652 nm against glucose concentrations. Inset: Agarose-based hydrogels with different glucose concentrations.
Polymers 15 03002 g006
Table 1. The DLS data of Lys-Fe-NPs with different cross-linker (EGDMA) contents.
SampleCross-Linker Content (wt%)Diameter a (nm)Diameter b (nm)PDI b
Lys-NPs4093.7108.40.193
Lys-Fe-NPs14098.6122.30.201
Lys-Fe-NPs250150.1178.90.132
Lys-Fe-NPs360173.4202.40.117
a Particle size determined by SEM, b Hydrodynamic diameter and PDI measured by DLS in PBS 7.4 at 25 °C.
Disclaimer/Publisher’s Note: The statements, opinions and data contained in all publications are solely those of the individual author(s) and contributor(s) and not of MDPI and/or the editor(s). MDPI and/or the editor(s) disclaim responsibility for any injury to people or property resulting from any ideas, methods, instructions or products referred to in the content.

