3.1. Structural and Textural Characterizations
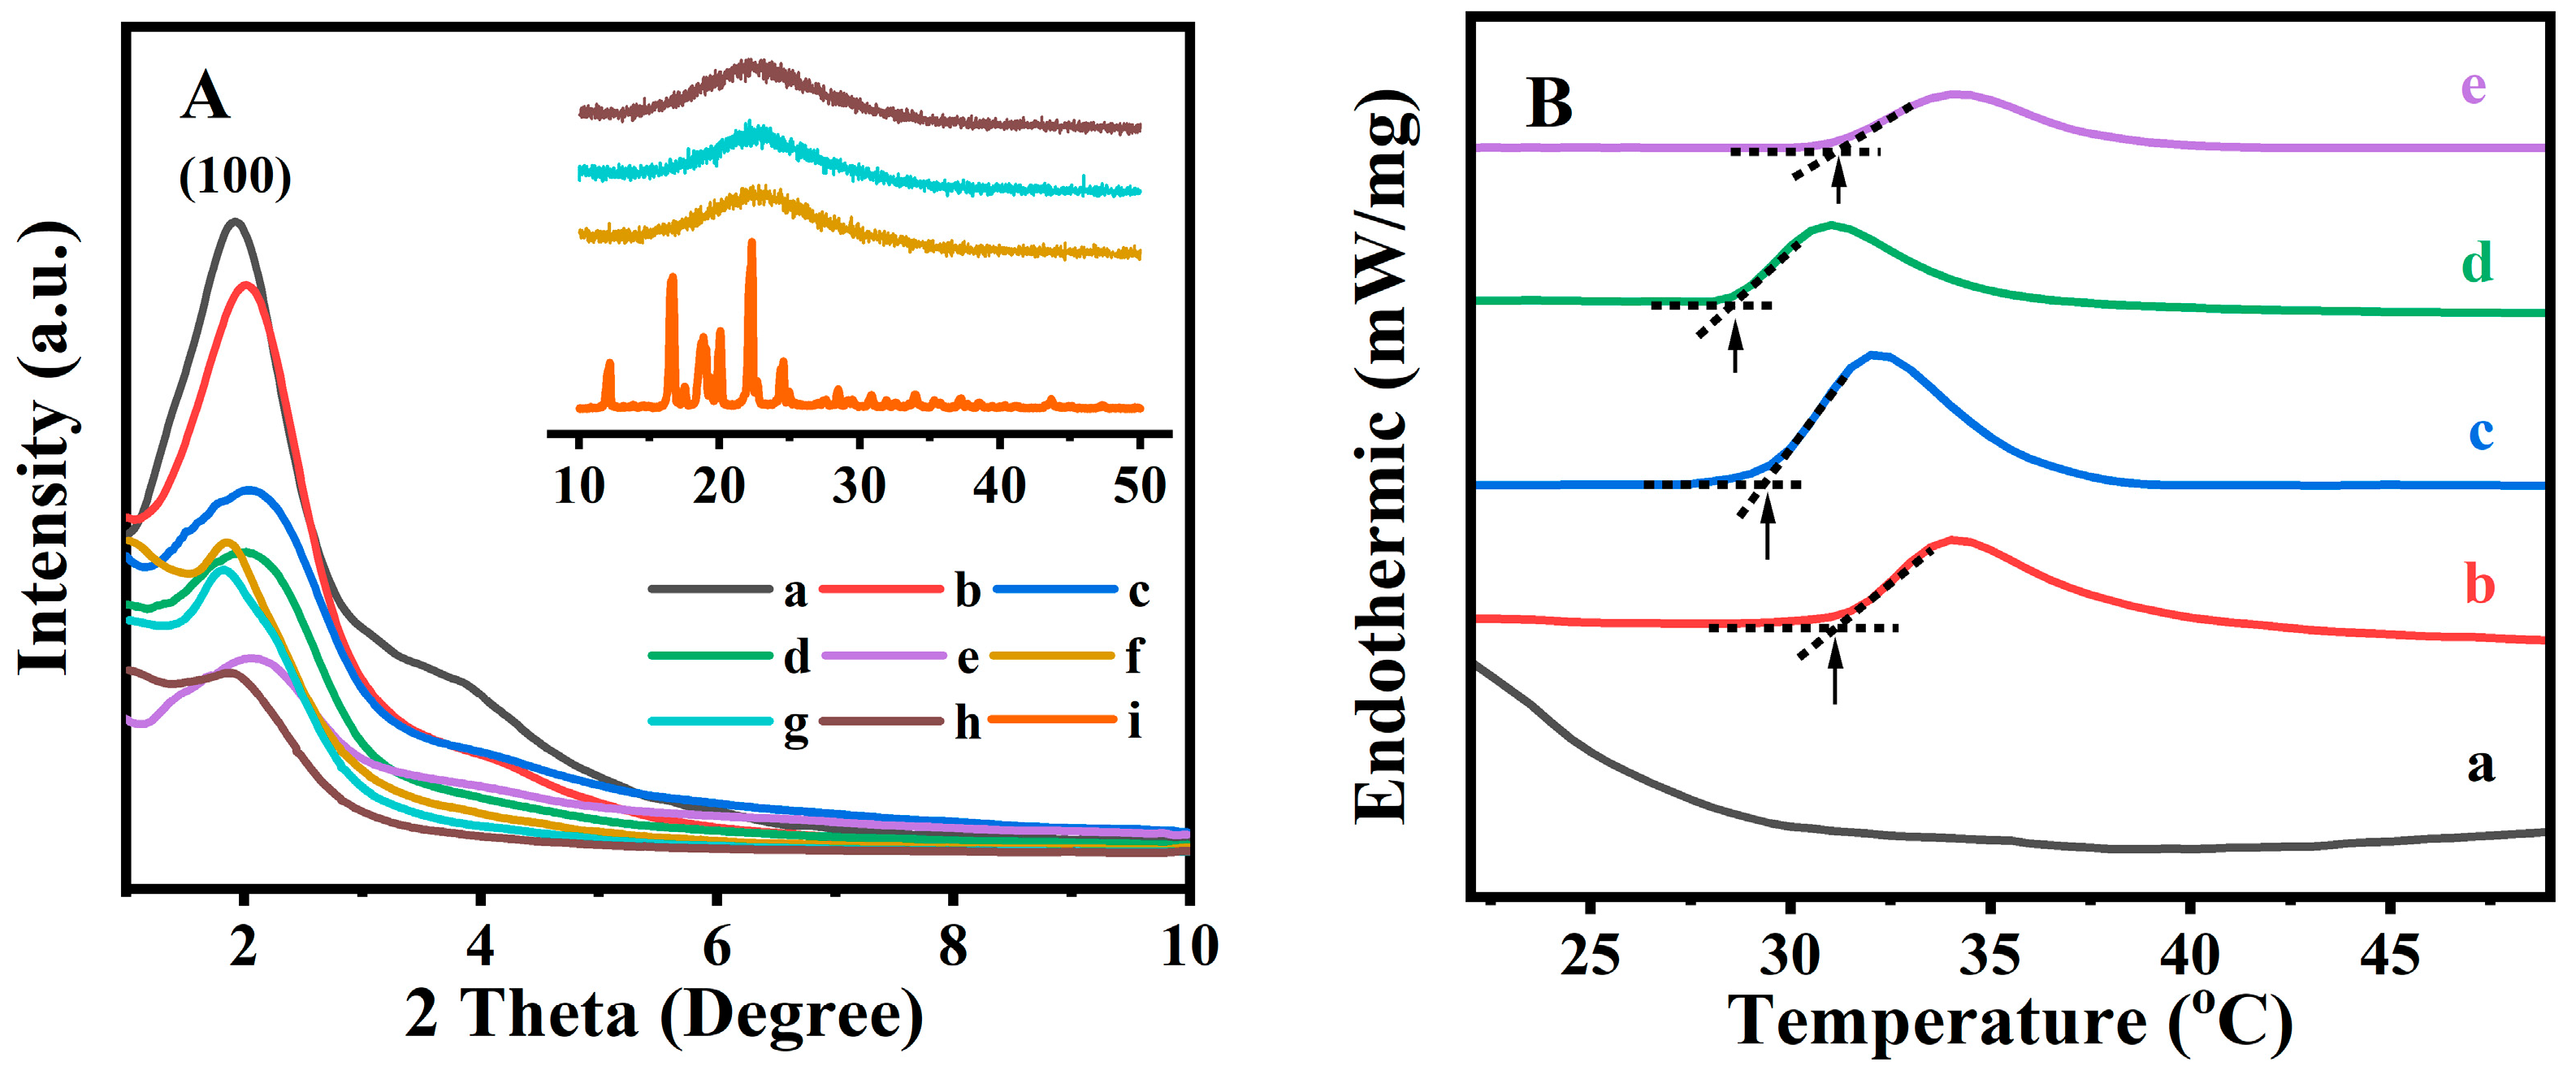
Figure 1A shows the XRD patterns for all related samples in the
2θ range of 1–10°. Their texture parameters are summarized in
Table 1. As shown in
Figure 1A (a), the XRD patterns of the BMMs presented a distinctive diffraction peak (100) at
2θ of 1.92°, indicating a characteristic of typical BMMs with ordered mesopores channels [
39]. After vinyl functionalizing by MPS, the diffraction peak of the M-BMMs (
Figure 1A (b)) moved slightly toward a larger angle region (2.01°) compared to that of BMMs (
Figure 1A (a)), and the corresponding
d values decreased from 4.5959 nm for BMMs to 4.3900 nm for M-BMMs (as shown in
Table 1), implying that the mesopore structures could remain intact after vinyl-modifying, but the interplanar spacing had shrunk [
25,
40].
Thereafter, the peak intensity of the synthesized fluorescent PAN@BMMs samples (
Figure 1A (c) to (e)) seemed to be decreased, lower than that of M-BMMs (
Figure 1A (b)), probably suggesting the successful encapsulations of the AN-dispersed polymer onto the surfaces of M-BMMs [
41]. Additionally, their peak
(100) position was also shifted to the larger angle regions, such as 2.03° for PAN@BMMs-I-0.05 (
Figure 1A (c)), 2.02° for PAN@BMMs-I-0.1 (
Figure 1A (d)), and 2.06° for PAN@BMMs-I-1 (
Figure 1A (e)), accompanied by typically lower
d(100) values, such as 4.3468, 4.3683, and 4.2835 nm (as shown in
Table 1), respectively. One of the main reasons for this was the partial introductions of PAN onto the mesoporous channels of M-BMMs.
After IBU loading, the diffraction peak
(100) position of I/PAN@BMMs moved to 1.86° for I/PAN@BMMs-I-0.05 (
Figure 1A (f)), 1.82° for I/PAN@BMMs-I-0.1 (
Figure 1A (g)), and 1.88° for I/PAN@BMMs-I-1 (
Figure 1A (h)), respectively. Accordingly, the corresponding
d(100) space values increased to 4.7440, 4.8483, and 4.6937 nm (as shown in
Table 1), respectively. These observations might be responsible for the IBU loading into the mesoporous channels.
Figure 1A (i) insert displayed a characteristic diffraction peak of the crystal IBU in wide-angle (10–50°) XRD patterns. Nevertheless, I/PAN@BMMs (inset of
Figure 1A (f) to (h)) displayed a wide diffraction peak in the 2-theta range of 20–30°, indicating the homogeneous distribution of the loaded IBU. Additionally, similar XRD patterns (
Figure S3A (a) to (d)) were obtained for other PAN-coated and drug-loaded samples synthesized via the two-step and physical mixing methods. The characteristic diffraction peak
(100) position moved from 2.02 and 2.06° for PNA@BMMs-II-0.1 and PNA@BMMs-mix-0.1 to 1.87 and 1.96° for IBU-loaded samples (I/PNA@BMMs-II-0.1 and I/PNA@BMMs-mix-0.1), and the corresponding
d(100) values increased from 4.3683 and 4.2835 nm to 4.7187 and 4.5021 nm. These observations further proved the drug loading and that the PAN copolymers were successfully coated onto the surfaces of the BMM cores. These speculations could be further supported by the N
2 sorption isotherms.
Figure S3B,C illustrated N
2 adsorption–desorption isotherms and the corresponding pore size distribution profiles of all related samples. As shown in
Figure S3B, the isotherms of M-BMMs (
Figure S3B (b)) and PAN@BMMs (
Figure S3B (c) to (h)) were apparently identified as type IV isotherms with H1 type hysteresis loops, similar to a typical feature of BMMs (
Figure S3B (a)), implying the presence of the uniform mesopores [
42]. Meanwhile, BMMs (
Figure S3B (a)) exhibited the bimodal mesopore distributions: the first one was centered at 3.12 nm, and the broader second one was about 40.1 nm. The specific surface area of the M-BMMs (
Figure S3B (b)) decreased slightly from 1132.8 m
2/g (BMMs) to 1123.9 m
2/g at a mean pore size of around 3.13 nm and 36.0 nm. These results manifested that the mesoporous structures of M-BMMs modified by organic groups on the outer surface of BMMs remained intact, similar to our previous report [
28].
Meanwhile, the specific surface area and cumulative pore volume were found to be 1123.9 m
2/g and 1.82 cm
3/g for M-BMMs (
Figure S3B (b)), almost the same as the measurements for BMMs, which were 1132.8 m
2/g and 1.89 cm
3/g (
Figure S3B (a)), but decreased to 722.9 m
2/g and 1.13 cm
3/g for PAN@BMMs-I-0.05 (
Figure S3B (c)), 738.6 m
2/g and 0.86 cm
3/g for PAN@BMMs-I-0.1 (
Figure S3B (d)), and 799.4 m
2/g and 0.87 cm
3/g for PAN@BMMs-I-1 (
Figure S3B (e)), respectively. These results suggested that on the hand, the vinyl groups were successfully grafted onto the outer surfaces of the BMMs, but on the other hand, the PAN shell coated on the outer surfaces of BMMs impedes the N
2 adsorption, resulting in a decrease in the adsorption amount and surface areas [
11]. Correspondingly, the small pore diameter was observed to slightly decrease from 3.13 for M-BMMs to 2.42−2.92 nm for PAN@BMMs. As expected, the core–shell structured PAN@BMMs with the retained mesoporosity had enough drug loading for a stimulus-responsive release carrier. Subsequently, after IBU loading, their surface areas abruptly declined to around 601.0 m
2/g for I/PAN@BMMs-I-0.05 (
Figure S3B (f)), 616.5 m
2/g for I/PAN@BMMs-I-0.1 (
Figure S3B (g)), and 778.0 m
2/g for I/PAN@BMMs-I-1 (
Figure S3B (h)), respectively. In particular, the small mesopore size decreased accordingly. These phenomena further confirmed the successful IBU encapsulating inside the mesoporous channels of BMM cores. The N
2 sorption isotherms of PAN@BMMs-II-0.1 (
Figure S3C (a) and (c)) and PAN@BMMs-mix-0.1 (
Figure S3C (b) and (d)) also presented similar results.
In order to determine the temperature response of the PAN@BMMs, their DSC profiles were measured after swelling at room temperature for 24 h. As can be seen in
Figure 1B (a), no endothermic peak appeared in the DSC curve of pure BMMs, suggesting that the core of hybrid materials does not possess thermal responsiveness. However, after coating the fluorescent PAN on the outer surfaces of the BMM cores, the LCST was 31.1 °C for PAN@BMMs-I-0.1 (
Figure 1B (b)) and 29.3 °C for I/PAN@BMMs-I-0.1 (
Figure 1B (c)), almost same as the LCST (32 °C) of pure PNIPAM in the reported literature [
43]. As shown in
Figure 1B (d) and (e), the LCST of PAN@BMMs-I-0.05 and PAN@BMMs-I-1 varied at 28.5 °C and 31.3 °C, implying that the AN doping slightly affected the LCST of PAN@BMMs.
On the basis of the calculations derived from the NETZSCH software, the enthalpy change (Δ
H) values exhibited a decreasing trend, 0.87 J/g for PAN@BMMs-I-0.05, 0.50 J/g for PAN@BMMs-I-0.1, and 0.13 J/g for PAN@BMMs-I-1, along with an increasing AN content in the P(NIPAM-co-AA) matrix. As reported by Gao et al. [
44], various lengths of alkyl chains in the AA derivative influenced the balance between hydrophobicity and hydrophilicity in polymer networks.
To verify the characteristic functional groups in the prepared composites, the related samples after vinyl modifying and PAN coating were analyzed using FT-IR spectra. As illustrated in
Figure S4A (a), for pure BMMs, the bands at 1080 cm
−1 and 802 cm
−1 were both attributed to the stretching vibration of Si–O–Si, and the absorption band at 956 cm
−1 was ascribed to the vibration features of Si–OH [
45]. Comparably, for M-BMMs (
Figure S4A (b)), the weak bands appeared at 1714 cm
−1 (v–C=O), 1635 cm
−1 (v–C=C), 2894, and 2930 cm
−1 (v–CH
2); 2985 cm
−1 (v–CH
3) could be explained by the vinyl functionalization on the surface of BMMs [
46].
Afterward, taking the obtained PAN@BMMs-I-0.1 as an example to compare with either the pure BMMs or M-BMMs, as presented in
Figure S4A (e), the additional characteristic bands located at 1645 cm
−1, 1547 cm
−1, and 1460 cm
−1 could be attributed to the C=O, N–H, and C–N stretching vibrations, respectively, which should belong to the amide group [
47]. Moreover, the acromion peaks near 1716 cm
−1 were attributed to the C=O stretching vibrations of the carboxylic acid groups [
48]. Noticeably, these regions appeared similar to those of the P(NIPAM-co-AA) (
Figure S4A (c)), indicating the successful encapsulation of the copolymer onto the vinyl-modified surfaces of the mesoporous BMMs. The typical vibrational absorption peaks of the aromatic ring [
49] were observed at 780 cm
−1 and 760 cm
−1 for PAN@BMMs-I-0.1 (
Figure S4A (e)), which aligned well with the infrared spectrum of AN (
Figure S4A (d)). Subsequently, the I/PAN@BMMs-I-0.1 (
Figure S4A (f)) exhibited characteristic absorption peaks at 1720 cm
−1, assigned to the C=O stretching vibration of IBU molecules (
Figure S4A (g)), which ensured the incorporation of IBU. In PAN@BMMs-I-0.05 (
Figure S4B (a)), PAN@BMMs-I-1 (
Figure S4B (b)), PAN@BMMs-II-0.1 (
Figure S4B (c)), and PAN@BMMs-mix-0.1 (
Figure S4B (d)), similar results were also observed. The characteristic peaks appeared at 1645, 1547, and 1460 cm
−1 for amide groups in the PAN shell, 1716 cm
−1 for the carboxylic acid, and 780 and 760 cm
−1 for aromatic rings, originating from the NIPAA, AA, and AN components, respectively. These observations further proved that the luminescent groups were doped into the polymer shell of PAN@BMMs.
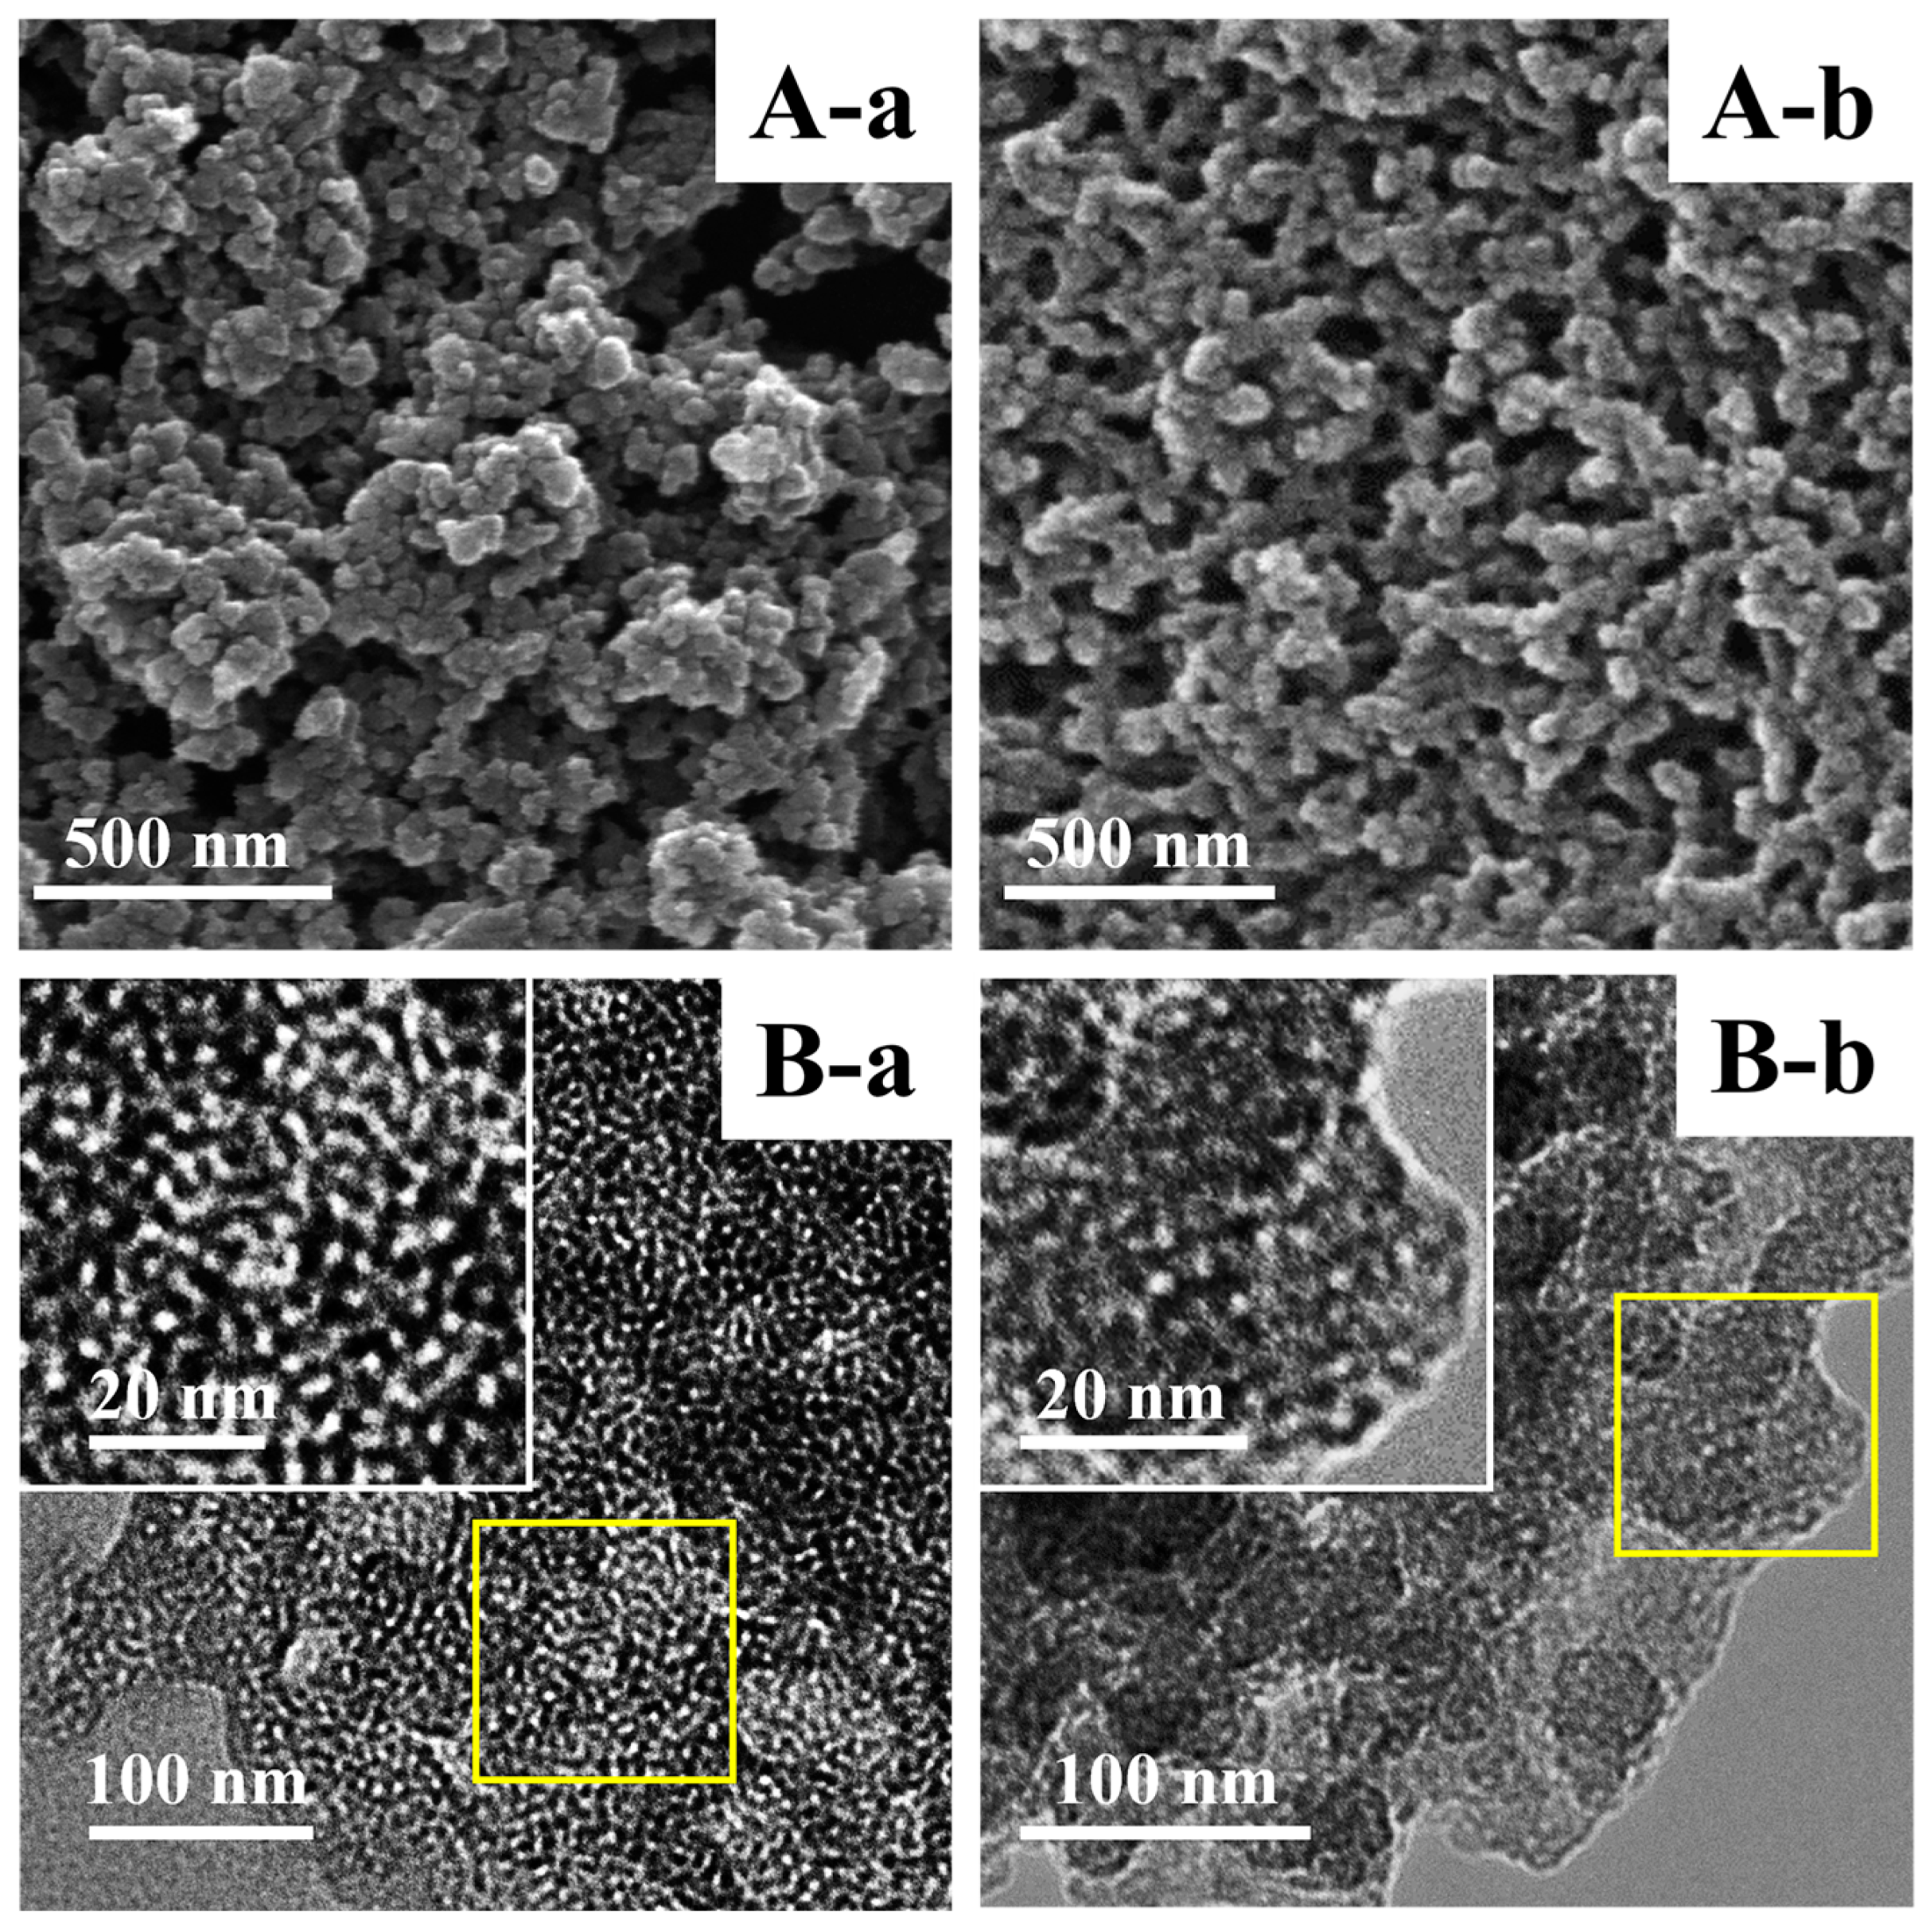
Figure 2A,B show the SEM and TEM images of representative samples. As depicted in the SEM (
Figure 2A (a)) and TEM (
Figure 2B (a)) images, M-BMMs exhibited almost-spherical morphologies at a size of 30–50 nm with uniform and worm-like mesopores (around 3 nm), well in agreement with our previous observation of parent BMMs [
33]. Noticeably, the cross-linking phenomena obviously appeared in the typical PAN@BMMs-I-0.1 (
Figure 2A,B (b)), further verifying that the PAN polymer was coated on the outer surfaces of BMMs. In particular, the corresponding inset images (as shown in
Figure 2B (a) and (b)) showed the details of the pore structures of the BMM core and PAN shell features. As can be seen, the mesopore channels of PAN@BMMs-I-0.1 (
Figure 2B (b) insert) became indistinct as compared with those of M-BMMs (
Figure 2B (a) insert), indirectly confirming that the outer surfaces of the BMM core were covered by a PAN shell.
XPS characterization was used to analyze the elemental compositions of the prepared hybrid composites and their chemical states. As shown in
Figure S5A, the XPS survey spectra of P(NIPAM-co-AA)@BMMs (
Figure S5A (a)) and PAN@BMMs-I-0.1 (
Figure S5A (b)) presented the appearances of O, N, C, and Si elements, showing the surface compositions in the prepared hybrid nanocomposites. In detail,
Figure S5B showed the N1s spectra of P(NIPAM-co-AA)@BMMs (
Figure S5B (a)) and PAN@BMMs-I-0.1 (
Figure S5B (b)), in which the peaks located at 399.7 and 402.1 eV were ascribed to the C–N and N–H bonds [
6], respectively. Meanwhile,
Figure S5C presented their C1s spectra: the peak centered at 284.6 eV was ascribed to the C–C and C–H bonds in AA and NIPAM [
50], and the peaks appearing at 286.2 and 287.5 eV were attributed to the C–N bonds in NIPAM and the C=O bonds in AA and NIPAM, respectively. Additionally, the chemical compositions of these samples were further analyzed based on the binding energy regions of C1s, N1s, O1s, and Si in the XPS spectra. The results showed that the atomic ratio of Si was 12.56% in P(NIPAM-co-AA)@BMMs and 26.60% in PAN@BMMs-I-0.1, which was derived from BMMs. Meanwhile, the atomic ratios of C and N were 45.45% and 6.89% in P(NIPAM-co-AA)@BMMs and 14.31% and 1.90% in PAN@BMMs-I-0.1, respectively. Obviously, these C and N elements originated from P(NIPAM-co-AA) or the PAN shell. Based on the abovementioned descriptions, the XPS characterizations clearly indicated that the P(NIPAM-co-AA) copolymer or the PAN shell was successfully coated onto the surfaces of BMM core.
3.2. Fluorescence Performances and Fractal Features
To evaluate the aggregation state of the fluorescent AN dispersed in hybrid nanoparticles, its fluorescent property was explored under various conditions.
Figure S6 exhibited the emission spectra of AN at a concentration of 2 × 10
−3 mol/L in different solvents. As can be seen, the intense emission of AN in PE, 1,4-Dioxane, EtOH, MeCN, and DMSO was observed at 466 nm (
Figure S6 (a)), 504 nm (
Figure S6 (b)), 531 nm (
Figure S6 (c)), 538 nm (
Figure S6 (d)), and 535 nm (
Figure S6 (e)), respectively. Its fluorescence emission wavelength red shifted and the fluorescence intensity decreased rapidly as the solvent polarity increased, as follows: 69 nm for PE, 41 nm for 1,4-Dioxane, 14 nm for EtOH, 7 nm for MeCN, and 10 nm for DMSO. The emission wavelength (
λem = 466 nm) in PE was the shortest, while the fluorescence intensity in PE was almost 100 times that in DMSO, indicating its fluorescence
λem was strongly related to the solvents used [
49,
51]. Therefore, it was speculated that the presence of AN in PE was close to a monomeric state; therefore, PE was selected as a good solvent without background interference in the wavelength range of 465–545 nm for further investigating the fluorophore dispersity.
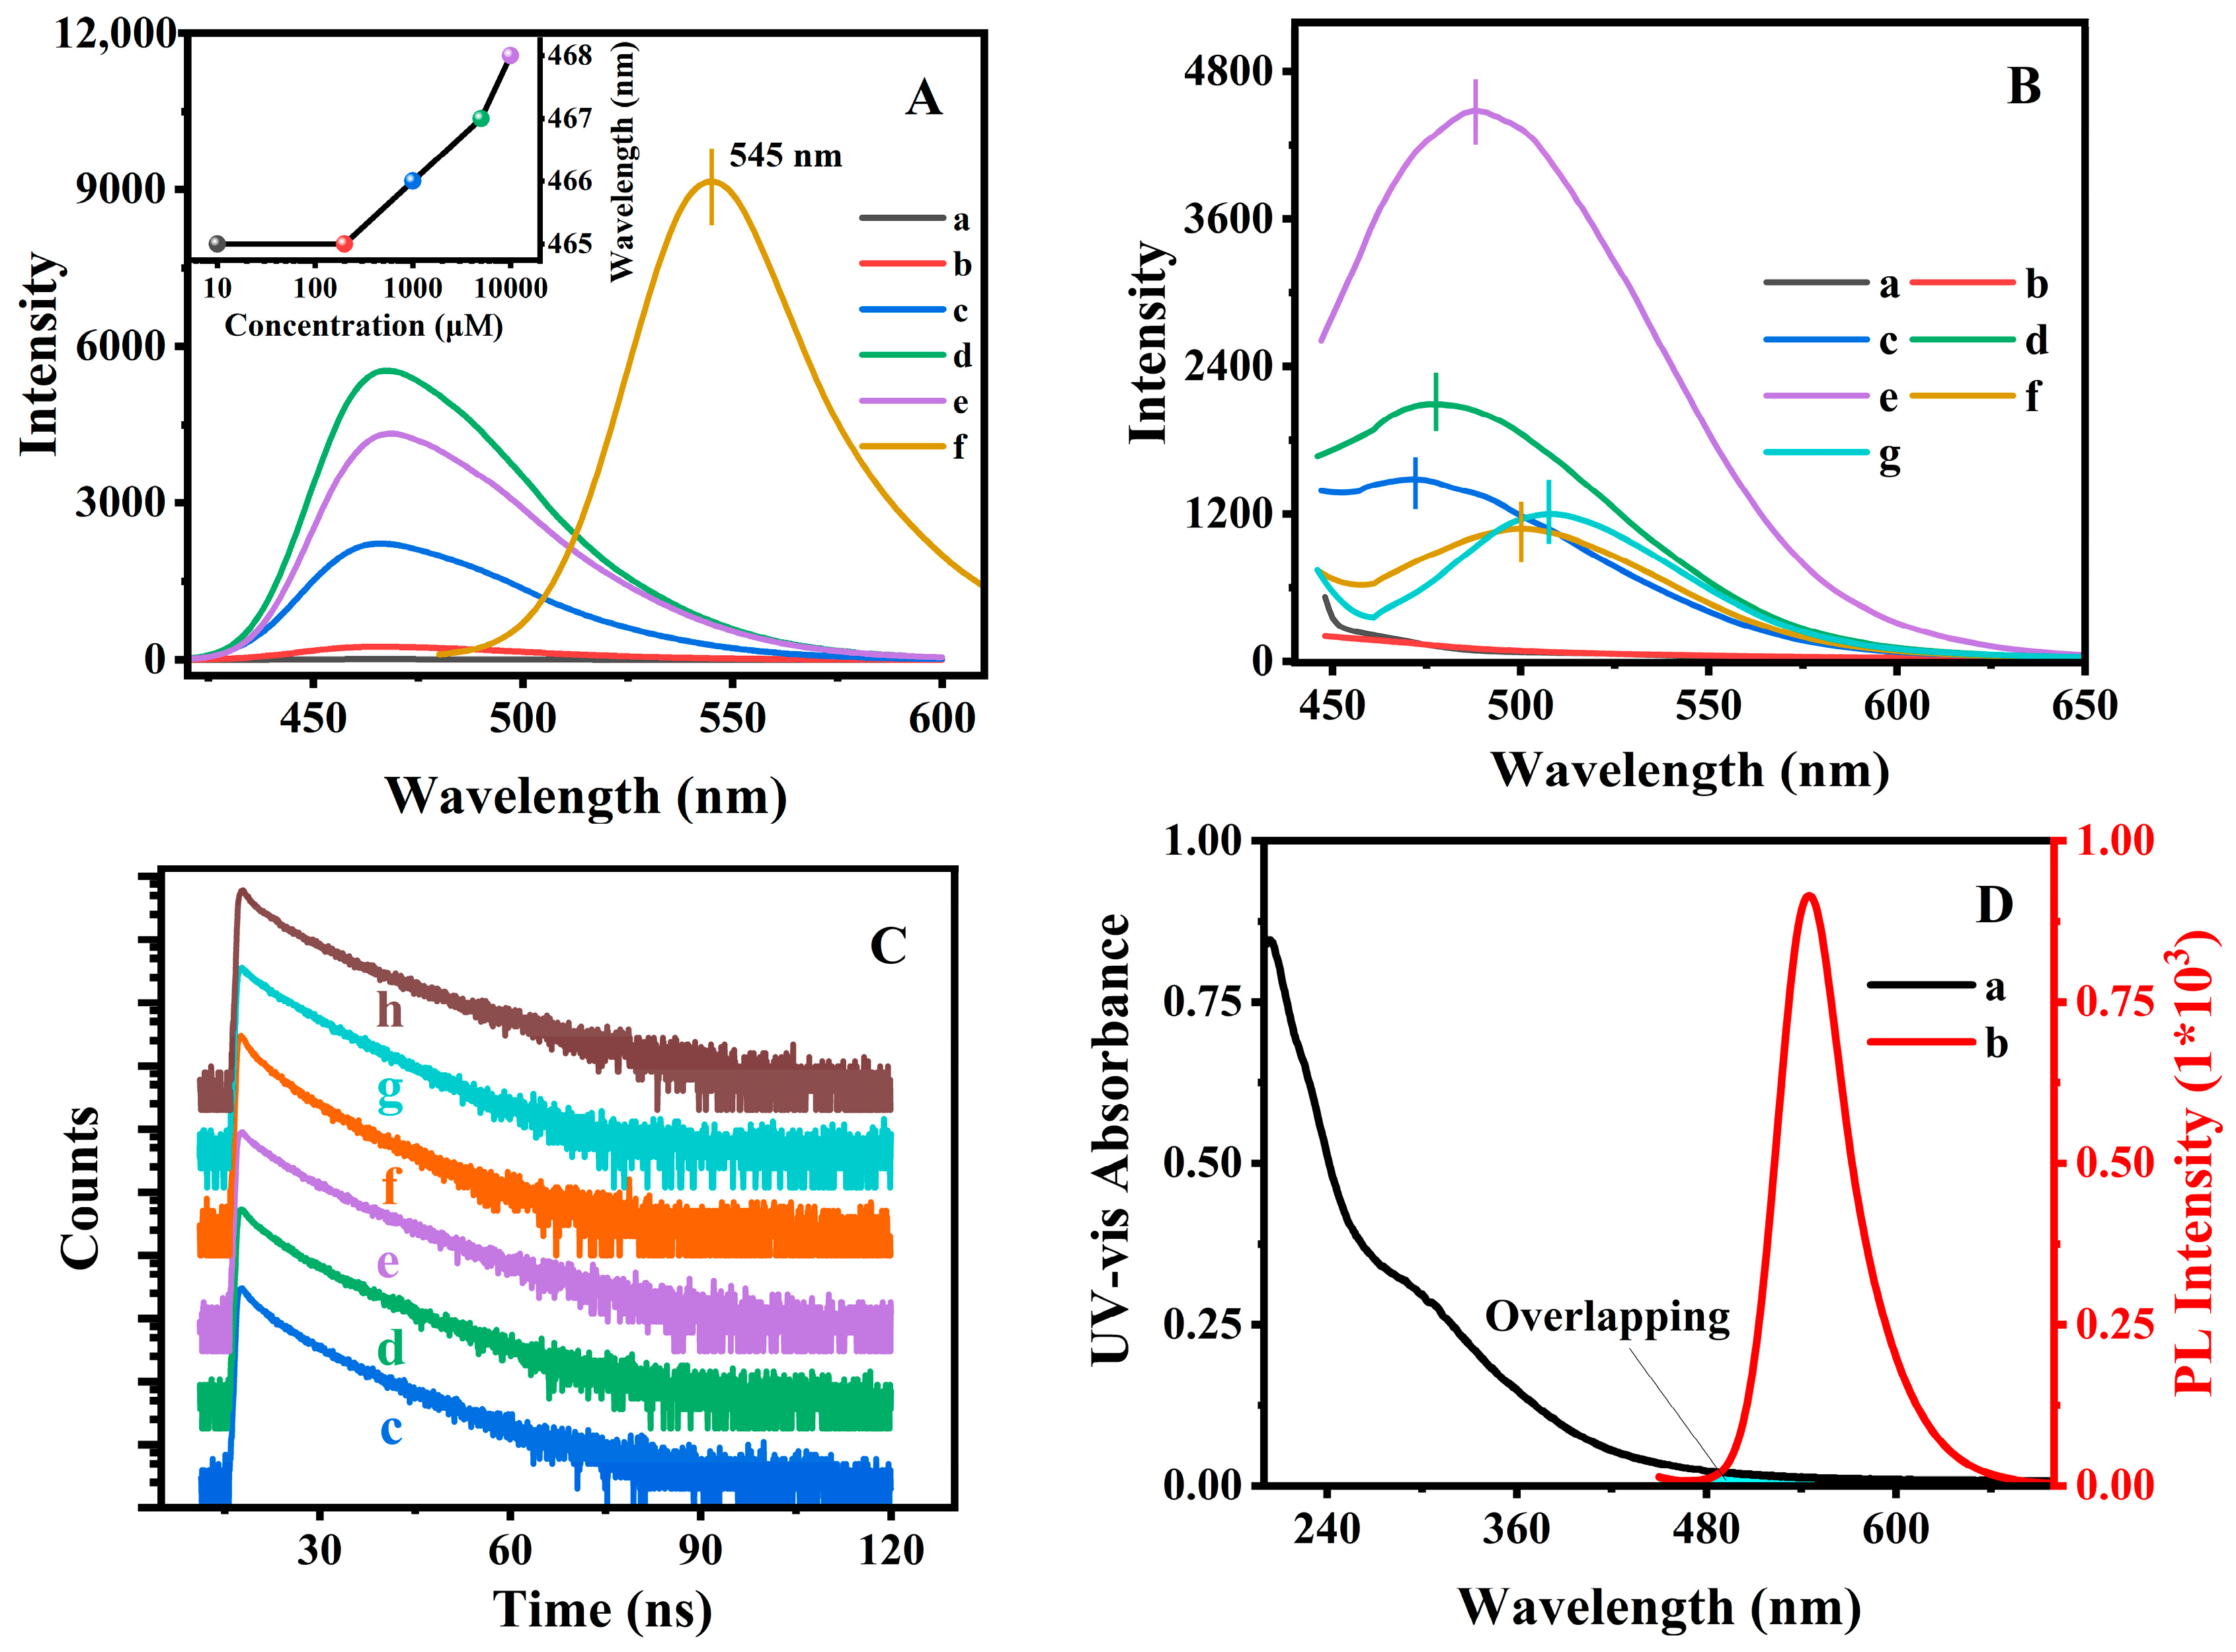
Figure 3A (a) to (e) showed the fluorescence emission spectrum of AN in PE solvent at various concentrations, and the variations of the emission wavelength was plotted in the inset image. As can be seen, the maximum emission wavelength slightly increased from 465 to 468 nm with the concentration ranging from 1 × 10
−5 to 1 × 10
−2 mol/L, but the solid AN (
Figure 3A (f)) exhibited an emitting fluorescence at 545 nm. These observations suggested that the blue emission at 465 nm and the other emission at 545 nm were associated with the monodisperse and aggregated states of AN. However, the mechanism of the solvent-dependent fluorescence emission profiles (as shown in
Figure S6) was different from that of the concentration-dependent fluorescence emission profiles (as shown in
Figure 3A) in the monomeric and aggregated states of the used AN.
Experimentally, we tentatively assigned the state of fluorescent AN by the emission wavelength and three different degrees of dispersion exhibited: full aggregation (545 nm), intermediate (465 nm to 545 nm), and completely dispersion (465 nm), which was similar to the method that reported by Wang et al. [
52], where the macro-dispersion of inorganic fillers in organic–inorganic composites was preliminary discussed by using fluorescent imaging.
Figure 3B presents the fluorescence spectra of the synthesized PAN@BMMs. It can be seen in
Figure 3B (a) and (b) that no emission appeared over the range of 450–650 nm in the fluorescent spectra for the obtained M-BMMs and P(NIPAM-co-AA). In contrast, the intense fluorescent emissions of PAN@BMMs-I-0.1, PAN@BMMs-II-0.1, and PAN@BMMs-mix-0.1 were detected at 476 nm (
Figure 3B (d)), 499 nm (
Figure 3B (f)), and 508 nm (
Figure 3B (g)). As compared with 545 nm of AN solid (
Figure 3A (f)), PAN@BMMs-I-0.1 prepared by a “one-pot” method had significantly blue shifted (69 nm), indicating that the AN distributed on the surfaces was close to the homogeneous monomer state, and no visible tendency to form aggregates was observed. Meanwhile, the maximum emission wavelength (508 nm) of the physically mixed PAN@BMMs-mix-0.1 (
Figure 3B (g)) was closer to the 545 nm of the AN-aggregate solid (
Figure 3A (f)). Notably, the decrease in the fluorescent intensity of PAN@BMMs-mix-0.1, as compared to that of the PAN@BMMs-I-0.1, should be related to the washing out of the physically adsorbed AN in the process of removing CTAB. Consequently, the stability of AN binding to PAN@BMMs during the swelling or releasing process was also discussed.
Obviously, the dispersity of AN on the PAN networks obtained via a one-pot approach was better than that obtained via the two-step or physically mixed methods; therefore, the one-pot method was selected to further demonstrate the effects of the dispersed AN amount on its fluorescent performance.
Figure 3B (c) to (e) shows the fluorescent spectra of PAN@BMMs doped with an AN amount of 0.05, 0.1, and 1% via the one-pot method. As can be seen, the maximum emission wavelength was red-shifted from 471 nm for PAN@BMMs-I-0.05 (
Figure 3B (c)) to 476 nm for PAN@BMMs-I-0.1 (
Figure 3B (d)), which was accompanied by a further redshift to 488 nm for PAN@BMMs-I-1 (
Figure 3B (e)) when the doped-AN amount increased up to 1.0%, which should be assigned to the intermediate dispersions of AN according to the abovementioned aggregative distribution of AN. Compared with the AN aggregated state (545 nm, as shown in
Figure 3A (f)), the blue shift (74 nm for PAN@BMMs-I-0.05, as shown in
Figure 3B (c); 69 nm for PAN@BMMs-I-0.1, as shown in
Figure 3B (d); and 57 nm for PAN@BMMs-I-1, as shown in
Figure 3B (e)) seemed to be weaker with the increase of the NA-doping amount, meaning that the lower content of the doped AN was conductive to transformations from the aggregation state into the monodispersed state. As expected, the increase in the AN-doped amount from 0.05 to 1% should be useful in promoting the fluorescent intensity of PAN@BMMs. In addition, these spatial dispersion states of AN doped in PAN@BMMs were further depicted via the fractal demonstrations.
TGA profiles were applied to illustrate the doping of AN in the network of polymers. As shown in
Figure S7, the weight loss at 30–200 °C in all related PAN@BMMs was associated with the removal of the physically adsorbed and chemically adsorbed water inside the mesoporous channels [
53]. For M-BMMs (
Figure S7 (b)), the weight loss of about 5.7 wt% at the range of 200–850 °C was mainly attributed to the decomposition of organic functional groups, while that of pure BMMs was 3.2 wt% (
Figure S7 (a)); consequently, the calculated MPS-modified content was 2.5 wt%.
Thereafter, the weight loss of the AN-doped samples was observed in the temperature range of 200–850 °C, showing 36.6 wt% for PAN@BMMs-I-0.05 (
Figure S7 (d)), 38.2 wt% for PAN@BMMs-I-0.1 (
Figure S7 (e)), 39.6 wt% for PAN@BMMs-I-1 (
Figure S7 (f)), 37.3 wt% for PAN@BMMs-II-0.1 (
Figure S7 (g)), and 34.7 wt% for PAN@BMMs-mix-0.1 (
Figure S7 (h)). As presented in
Figure S7 (c) and (i), the P(NIPAM-co-AA) and AN were almost completely pyrolyzed at 500 °C and underwent about 96.9 wt% and 99.2 wt% weight loss. These phenomena further proved the successful encapsulation of P(NIPAM-co-AA) doped with different AN aggregations. The weight loss should be proportional to the amount of the coated PAN. However, when the feeding amounts (0.05–1%) of the AN doped in PAN@BMMs were 0.05–1%, the weight loss remained almost constant, showing 38.4 wt% for PAN@BMMs-I-0.05 (
Figure S7 (d)) and 38.6 wt% for PAN@BMMs-I-1 (
Figure S7 (f)). These results indicated that the effect of the AN doped in PAN@BMMs on the PAN shell attached to the surfaces of the BMMs core was unobvious.
Furthermore, the fluorescence decay lifetimes were measured to elucidate the underlying luminous mechanism of the fluorophores.
Figure 3C showed the time-resolved fluorescence decay curves of prepared PAN@BMMs samples; the two-exponential fitting lifetime results are listed in
Table S1 of the ESI section. The results presented that the AN (
Figure 3C (h)) displayed a two-lifetime (
τ1 = 3.78 ns,
τ2 = 12.27 ns). Similar results were also demonstrated by Duhamel et al. [
54]; the probable reason for this was the presence of the monomers (~3.3 ns) and excimers (~10 ns) in doped AN. In particular, the appearances of the excimers were generated by conjugations between the excited naphthalene ring and the ground-state naphthalene ring [
54]. These phenomena were well elucidated above by the fluorescence spectra of AN at various concentrations in PE (
Figure 3A), in which the fluorescence emission wavelength of solid AN (545 nm) was clearly red shifted with respect to that of the AN monomer (465 nm). Accordingly, the longer lifetime (
τ2 = 12.27 ns) presented as the formed AN excimer; the other was attributed to the AN monomers with a short lifetime of 3.78 ns. The pre-exponential factors reflected the amount of AN monomers relative to the excimers.
Comparably, the fluorescence decays of hybrid PAN@BMMs also presented double decay lifetimes, showing 3.59 ns and 10.62 ns for PAN@BMMs-I-0.1 (
Figure 3C (d)), 2.64 ns and 8.56 ns for PAN@BMMs-II-0.1 (
Figure 3C (f)), and 3.53 ns and 9.00 ns for PAN@BMMs-mix-0.1 (
Figure 3C (g)). Obviously, both of the lifetimes of doped-AN PAN@BMMs were shorter than those of AN (
Figure 3C (h)), indicating the occurrence of quenching. On the basis of experiments by Hwang et al. [
55], the variations in the long lifetime of the excimers might be a consequence of the electron-absorbing groups (–COOH and –CONH–) in the PAN copolymers [
55]. The pre-exponential factors of the excimers (
B2) prepared using the two-step (
B2 = 59.96) and mixing methods (
B2 = 75.88) were higher than those obtained by the one-pot process (
B2 = 59.48). These results suggest that the AN molecules were more likely to agglomerate in the PAN@BMMs prepared using two-step and mixing methods, thus promoting the formation of excimers, but more evenly dispersed in the PAN@BMMs prepared by the one-pot process.
Meanwhile, the lifetimes of PAN@BMMs-I-n gradually prolonged with the increase of the doped AN, showing 3.35 ns and 10.50 ns for PN A@BMMs-I-0.05 (
Figure 3C (c)), 3.59 ns and 10.62 ns for PAN@BMMs-I-0.1 (
Figure 3C (d)), and 3.89 ns and 10.92 ns for PAN@BMMs-I-1 (
Figure 3C (e)). The pre-exponential factor (
B2) of AN excimers was increased from 60.23 for PNA@BMMs-I-0.05 to 63.83 for PAN@BMMs-I-1, verifying that the serious aggregation of the doped AN led to the appearance of a large number of excimers. Therefore, these fluorescence lifetime results further showed that the fluorescence performances were closely associated with their various dispersion behaviors.
As illustrated in
Figure 3D, the absorption spectrum of P(NIPAM-co-AA)@BMMs (
Figure 3D (a)) presented partial overlapping with the emission band of AN (
Figure 3D (b)), suggesting resonance energy transfer from AN to P(NIPAM-co-AA)@BMMs. The excited AN is conductive to provoke an electron donor–acceptor interaction between the unbound electron pair of the nitrogen atom at the C-4 position toward the electron-accepting 1,8-dicarboxylic groups [
24]. This intramolecular electron charge transfer easily results in a decrease in the fluorescence lifetime of the hybrid composites.
In order to elucidate the microscopic dispersion state of AN in PAN@BMMs, the fractal analysis theory was introduced based on SAXS patterns.
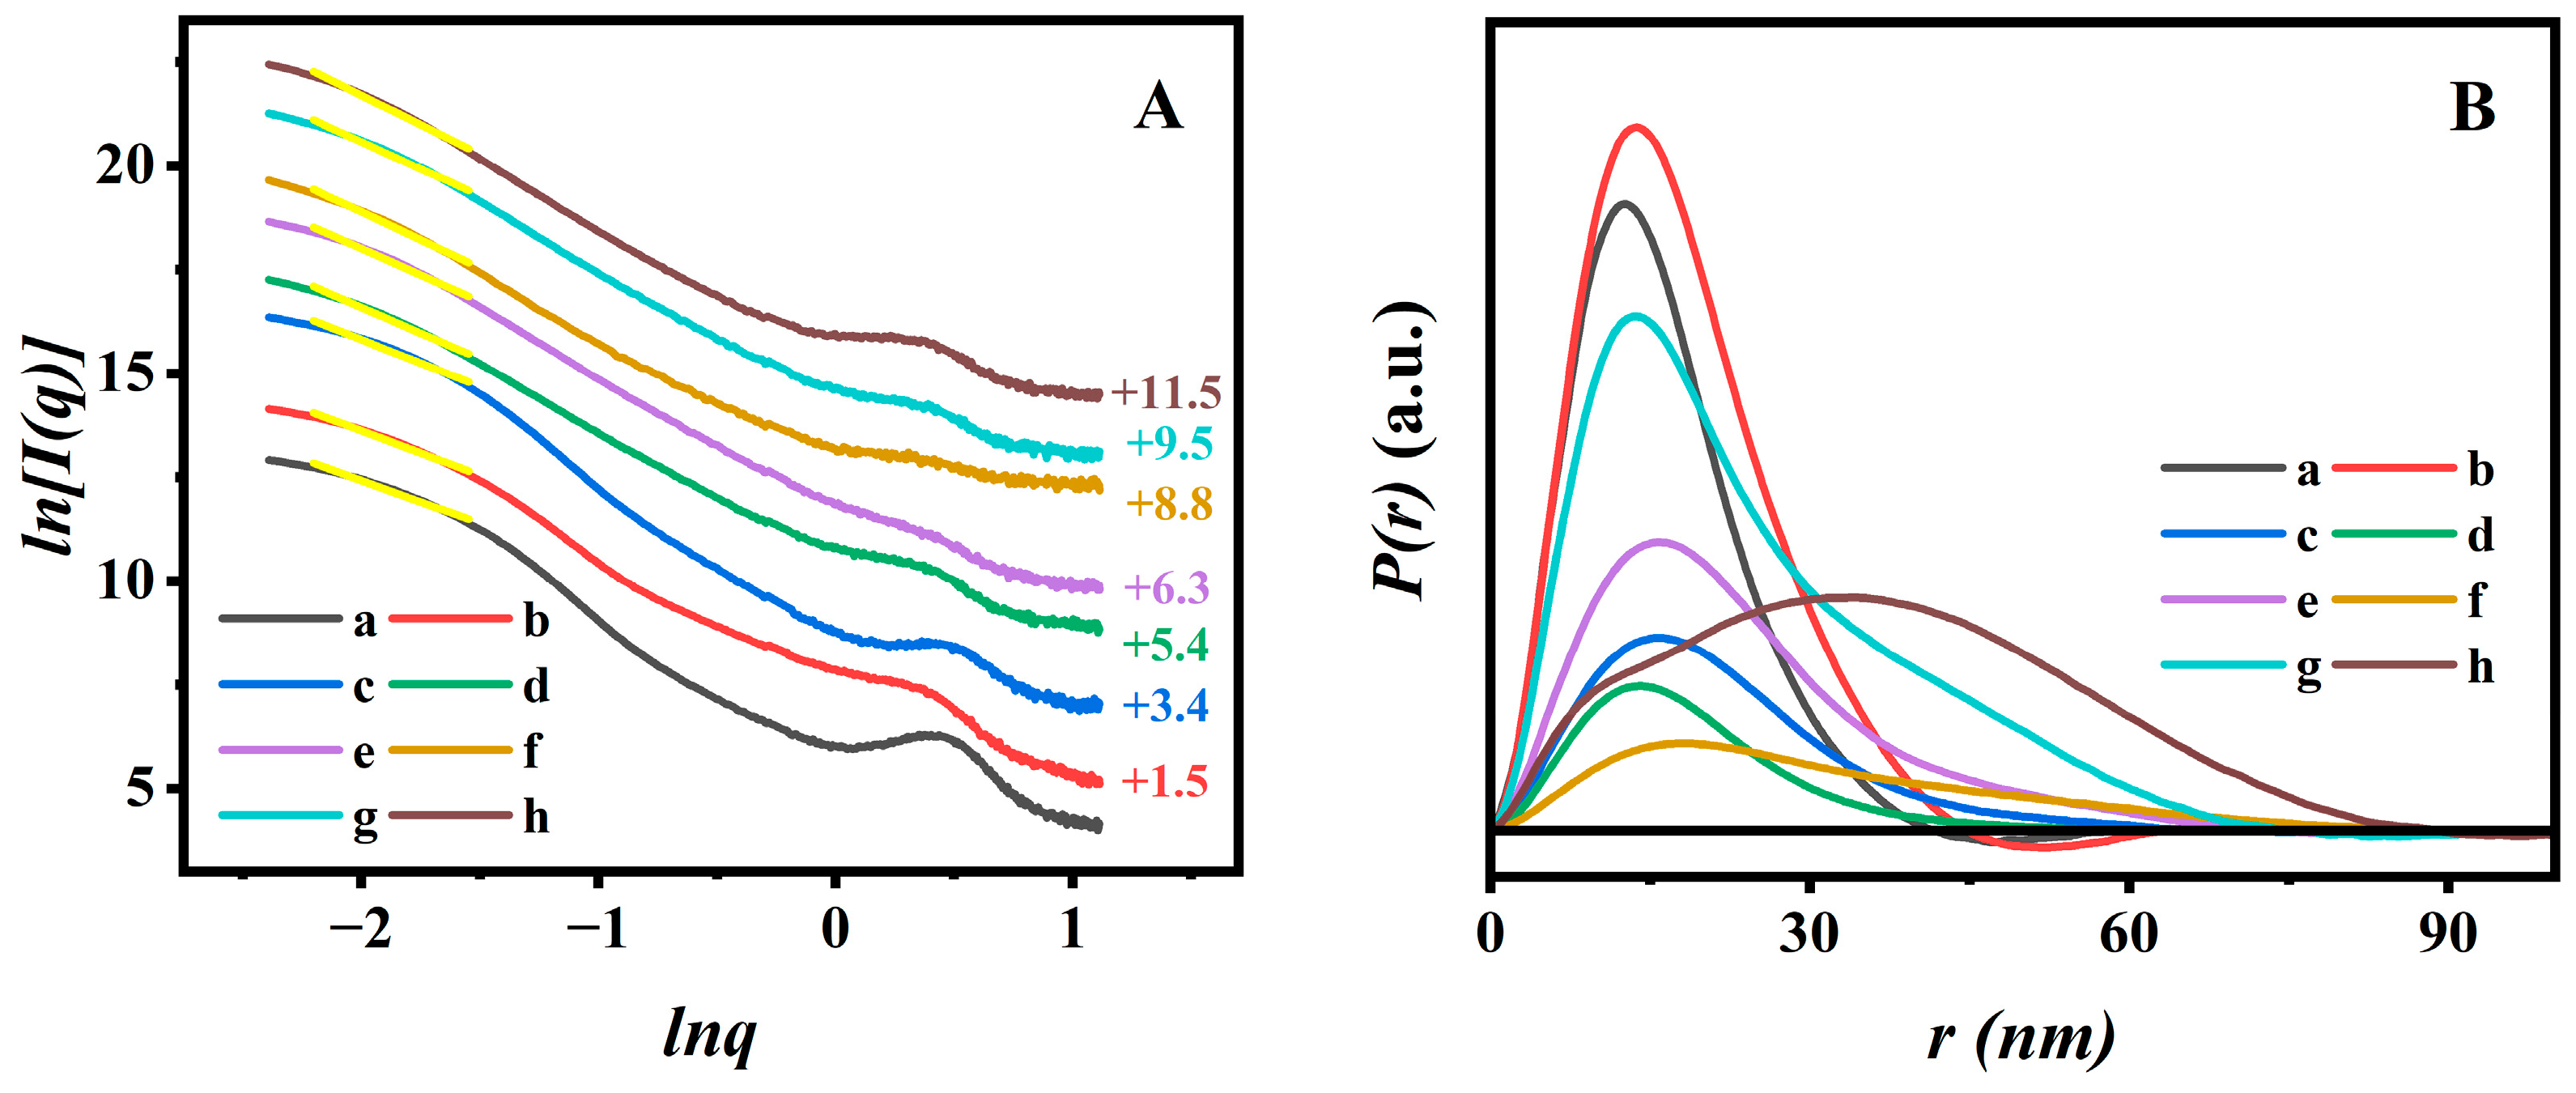
Figure 4A displays the fractal characteristics of all BMM-based samples; corresponding PDDF curves are presented in
Figure 4B. As can be seen in
Figure 4A, the slope of each curve (yellow straight line) was obtained with a linear fit using the least square method in low-
q regions (region), and thus the following fractal dimension (
dm or
ds) values were determined by power-law decay. We noticed that the slope values of all related samples were between two and three in the low-
q region (−2.20 <
lnq < −1.52); their behaviors possessed the
dm characteristics, corresponding their
dm values ranging between two and three, implying that the PAN@BMMs were indicative of loose and porous structures.
As shown in
Figure 4A (a) and (b), the
dm values slightly increased after vinyl modification from 2.06 (±0.04) for pure BMMs (
Figure 4A (a)) to 2.14 (±0.03) for M-BMMs (
Figure 4A (b)), indicating that the structure of the M-BMMs tended to be compact, which was responsible for the formation of the Si-O-Si structure. These results were also evident from the pore size distributions (
Figure S3B (a,b)). Additionally, the fractal structure of polymer-coated P(NIPAM-co-AA)@BMMs (
Figure 4A (c)) was more compact than that of M-BMMs, according to larger
dm value (2.39 (±0.04)) of P(NIPAM-co-AA)@BMMs than that of M-BMMs (2.14 (±0.04)). Therefore, these results indicated that the P(NIPAM-co-AA) was successfully grafted onto the surface of M-BMMs.
The
dm value of the obtained PAN@BMMs-I-0.1 (
Figure 4A (e)) was about 2.53 (±0.04), which was smaller than the
dm values of 2.61 (±0.04) for PAN@BMMs-II-0.1 (
Figure 4A (g)) and 2.82 (±0.04) for PAN@BMMs-mix-0.1 (
Figure 4A (h)). These variations of fractal features may be related to different dispersion states of fluorescent molecules that vary by doping method. Meanwhile, the
dmax value slightly increased from 2.48 (±0.04) for PAN@BMMs-I-0.05 (
Figure 4A (d)) to 2.70 for PAN@BMMs-I-1 (
Figure 4A (f)), indicating that the introducing of a larger AN cluster onto the PAN shell in PAN@BMMs tended towards the densification evolution.
The PDDF profiles revealed the largest particle size (
dmax) via the intersection between the curves and the horizontal axis [
56]. As shown in
Figure 4B, the
dmax value was about 41.7 nm for pure BMMs (
Figure 4B (a)) and 44.7 nm for M-BMMs (
Figure 4B (b)), experiencing little change during the vinyl modification. However, the detectable differences were observed after PAN coating: the
dmax value was increased to 67.5 nm for P(NIPAM-co-AA)@BMMs (
Figure 4B (c)), 70.3 nm for PAN@BMMs-I-0.05 (
Figure 4B (d)), 72.6 nm for PAN@BMMs-I-0.1 (
Figure 4B (e)), 93.1 nm for PAN@BMMs-I-1 (
Figure 4B (f)), 74.7 nm for PAN@BMMs-II-0.1 (
Figure 4B (g)), and 88.9 nm for PAN@BMMs-mix-0.1 (
Figure 4B (h)), seeming to be a steadily increasing tendency.
Additionally, most BMM-based samples displayed a bell-shaped profile, implying the appearances of the ellipsoid-shape nanoparticles [
57]. However, it is worth noting that the shape of the physical-mixing sample (PAN@BMMs-mix-0.1) was significantly different from those of the one-pot and two-step process samples.
Figure 4B (h) exhibited bimodal distribution, probably indicating the presence of two substances. In this regard, we could speculate that the overwhelming majority of AN molecules were successfully doped into the inner-polymer chain prepared by the one-pot or two-step methods rather than mixed onto the outer-surface of the BMMs. Consequently, the PAN@BMMs-mix-0.1 was used as a reference sample for the following investigation of fluorescence stability and AN-dispersion behaviors.
3.3. The Dispersion State of AN in PAN@BMMs during Swelling–Shrinking Process
Considering the influences of the temperature- and pH-responsive performance on the monodisperse of fluorescent AN during the swelling–shrinking process, the sensitivity of the resultant PAN@BMMs was systematically investigated using the
Dh values measured using the DLS method in PBS at pH values of 2.0 and 7.4 at 25 °C and 37 °C. In particular, the particle size distribution of pure BMMs (
Figure S8) showed that the average
Dh value was around 196 nm. In addition, the variation of mean
Dh values with different swelling and shrinking times was obtained in
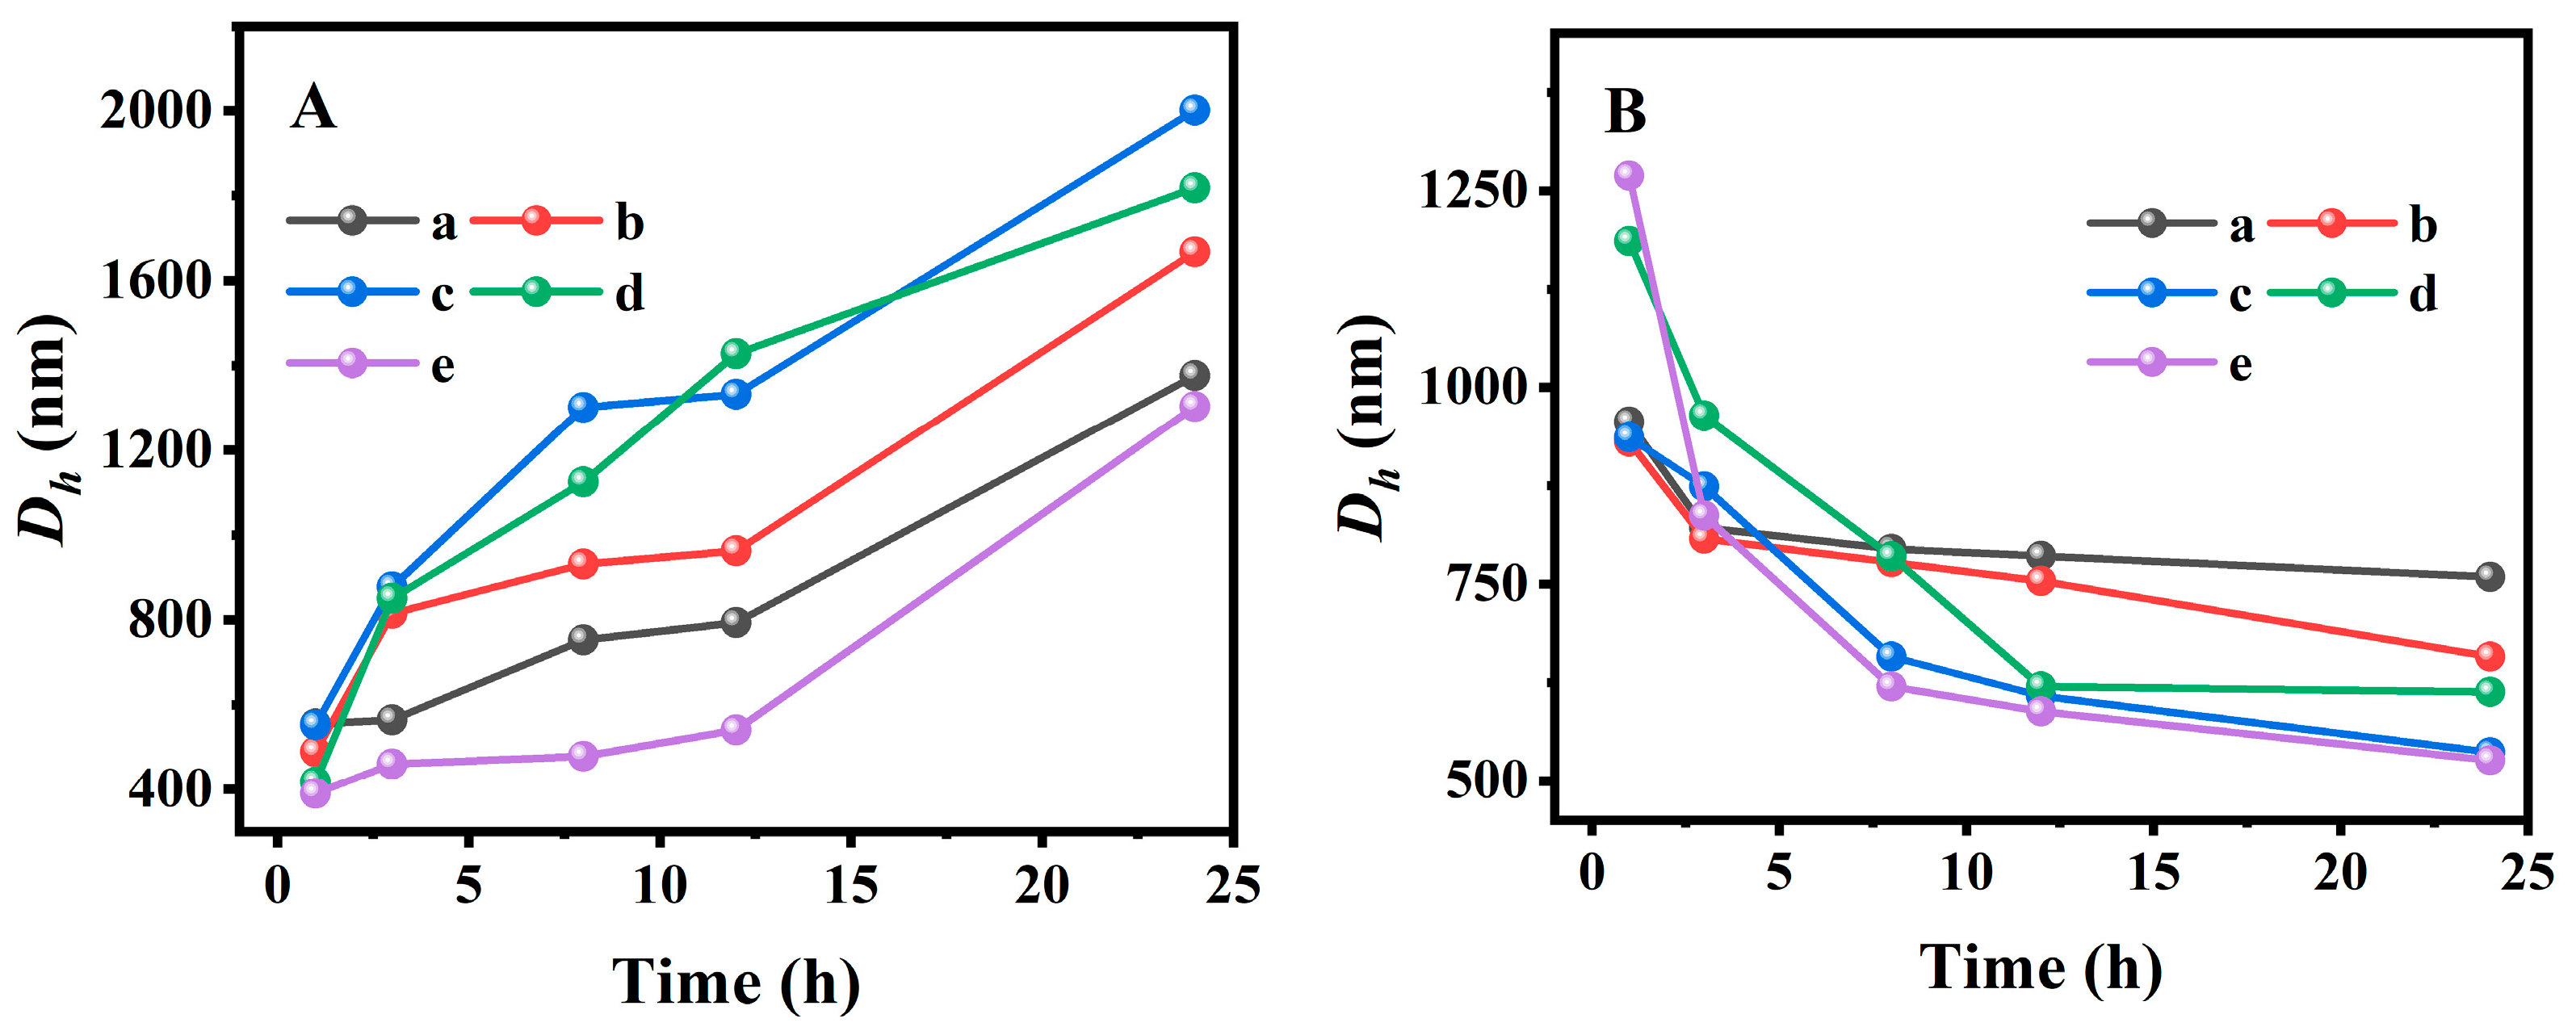
Figure 5A,B. As can be seen, the mean
Dh value of PAN@BMMs-I-n increased with the prolonging of swelling time under pH 7.4 at 25 °C (
Figure 5A) but decreased abruptly in pH 2.0 at 37 °C (
Figure 5B). For example, the
Dh value of PAN@BMMs-I-0.1 was 490 nm for 1 h, 815 nm for 3 h, 931 nm for 8 h, 963 nm for 12 h, and eventually 1668 nm for 24 h at pH 7.4 at 25 °C (
Figure 5A (b)) but 931 nm for 1 h, 808 nm for 3 h, 778 nm for 8 h, 754 nm for 12 h, and 658 nm for 24 h at pH 2.0 at 37 °C (
Figure 5B (b)). Similar trends were also present in PAN@BMMs-I-0.05 (
Figure 5A (a) and B (a)), PAN@BMMs-I-1 (
Figure 5AB (c)), PAN@BMMs-II-1 (
Figure 5AB (d)), and PAN@BMMs-mix-0.1 (
Figure 5AB (e)). The
Dh values of the swollen PAN@BMMs in pH 7.4 at 25 °C were up to 1377 nm for PAN@BMMs-I-0.05 (
Figure 5A (a)), 2001 nm for PAN@BMMs-I-1 (
Figure 5A (c)), 1819 nm for PAN@BMMs-II-0.1 (
Figure 5A (d)), and 1304 nm for PAN@BMMs-mix-0.1 (
Figure 5A (e)), while their shrunken
Dh values in pH 2.0 at 37 °C were 759 nm (
Figure 5B (a)), 536 nm (
Figure 5B (c)), 613 nm (
Figure 5B (d)), and 526 nm (
Figure 5B (e)). In essence, the swelling behavior was due to the electrostatic repulsive forces among –COO
– originating from the deprotonation of the –COOH groups in PAN chains when the pH was above the
pKa of PAA (4.8), whereas below it, the intra-molecular hydrogen bonding between the polymer crosslinking networks was formed due to the protonated –COOH groups [
58], resulting in the shrinking of the P(NIPAM-co-AA) at pH 2.0. This swelling–shrinking feature was one of the hallmark characteristics of the lesion microenvironment, endowing PAN@BMMs as nanocarriers with great potential in controlled release for drug delivery.
Meanwhile, the fluorescent emission spectra of the swollen PAN@BMMs (S) and the swelling filtered solution (L) over time were obtained, which is important for fluorescent stability and intensity during the drug administration or swelling of the drug carrier.
As illustrated in
Figure S9B (a), with the prolonged swelling time in pH 7.4 at 25 °C, a slightly decreased intensity at 488 nm was observed in the fluorescent spectrum of the PAN@BMMs-I-0.1 (S) but this was much stronger than that of the filtrate (L) at 465 nm. Interestingly, a slight blue shift from 488 to 485 nm appeared in the emission spectrum of the filtrate (L) compared with that of the solid samples. On the basis of the AN-monodisperse experiment results (as shown in
Figure 3A), these observations implied that the doped AN almost existed as a multimer in PAN@BMMs-I-0.1 during the swelling process, whereas solely small amounts of AN in the filtrate presented close to the monomeric state (465 nm).
Similarly, the fluorescence intensity at 483 nm for PAN@BMMs-I-0.05 (
Figure S9A (a)), at 495 nm for PAN@BMMs-I-1 (
Figure S9C (a)), and at 505 nm for PAN@BMMs-II-0.1 (
Figure S9D (a)) also slightly decreased in pH 7.4 at 25 °C, accompanied by an unobvious intensity increase at 485 nm for the solution. Notably, the fluorescence intensity at 508 nm for the physically mixed PAN@BMMs-mix-0.1 (
Figure S9E (a)) decreased, and there was a pronounced redshift to 542 nm in the filtrate (L), being closer to that of the AN-aggregated state (at 545 nm, as shown in
Figure 3A). The most probably reason for this is that the physically adsorbed AN in PAN@BMMs-mix-0.1 is dissolved into the filtrated solution.
However, at pH 2.0 and 37 °C, the fluorescence intensity at 490 nm for PAN@BMMs-I-0.1 (S) was significantly reduced (
Figure S9B (b)), and the gradual increase in fluorescence intensity at 486 nm for filtrates (L) was more evident than that of the swollen samples at pH 7.4 and 25 °C (
Figure S9B (a)). This was probably due to the swelling of the PAN shell occurring under weak bases, leading to its network opening and causing the diffusion of AN into the solvent. When the acidic conditions and higher temperatures caused the dual pH- and temperature-responsive PAN shell to shrink, more fluorescent NA diffused to the solution, and the wavelength of the PAN@BMMs-I-0.1 (L) red shifted from 486 nm for 1 h towards 488 nm for 24 h (
Figure S9B (b)).
Similarly, the solid PAN@BMMs-I-0.05 (
Figure S9A (b)), PAN@BMMs-I-1 (
Figure S9C (b)), and PAN@BMMs-II-0.1 (
Figure S9D (b)) presented stable fluorescence intensity at 483, 497, and 507 nm, accompanied by blue-shifted emissions of their filtrate at 481, 488, and 486 nm. In comparison, these blueshift phenomena cannot be detected over the PAN@BMMs-mix-0.1; the wavelengths of its filtrate were redshifted towards 524 nm (
Figure S9E (b)), verifying occurrences of the aggregated clusters of NA in the filtrated solvent. This observation clearly interpreted the weak physical adsorption between AN and P(NIPAM-co-AA) in PAN@BMMs-mix-0.1. Therefore, we could speculate that the AN doped in PAN@BMMs were actually incorporated into the networks of the PAN shell through intermolecular hydrogen bonding between the –NH
2 of AN and the –CONH–, –COOH of P(NIPAM-co-AA).
More specifically, the corresponding microstructure evolutions for monitoring the uniformity of AN dispersion have been successfully evaluated based on the SAXS patterns. The fractal dimension and the
dmax values of the related samples in the swelling (pH 7.4 at 25 °C) and shrinking (pH 2.0 at 37 °C) durations are presented in
Figure 6.
The results showed that all samples retained the typical
dm features during the swelling or shrinking processes, implying that the networks of PAN@BMMs were indicative of loose and porous structures [
59]. In detail, we observed that the
Dm values of PAN@BMMs-I-0.1 (
Figure 6A) significantly decreased from 2.74 (±0.04) for 1 h to 2.52 (±0.04) for 3 h, 2.47 (±0.04) for 8 h, 2.39 (±0.04) for 12 h, and 2.24 (±0.04) for 24 h at pH 7.4 and 25 °C, indicating that the coated-PAN shell in PAN@BMMs-I-0.1 gradually evolved into a loose structure during the swelling process. Similar results were also present in other samples: the
dm values of PAN@BMMs-I-0.05 (
Figure S10A), PAN@BMMs-I-1 (
Figure S10C), PAN@BMMs-II-0.1 (
Figure 6C), and PAN@BMMs-mix-0.1 (
Figure 6E) showed the reduced tendencies of 2.53–2.20, 2.81–2.46, 2.85–2.27, and 2.87–2.38, respectively. When their shrinking was conducted at pH 2.0 and 37 °C, the
Dm value of PAN@BMMs-I-0.1 (
Figure 6B) gradually increased from 2.36 (±0.04) for the initial 1 h to 2.48 (±0.04) for 3 h, 2.53 (±0.04) for 8 h, 2.58 (±0.04) for 12 h, and then achieved 2.63 (±0.04) until 24 h, showing a progressively densified microstructure. The same phenomenon of an increased tendency was also found in the PAN@BMMs-I-0.05 (
Figure S10B), PAN@BMMs-I-1 (
Figure S10D), PAN@BMMs-II-0.1 (
Figure 6D), and PAN@BMMs-mix-0.1 (
Figure 6F), with
dm values of 2.30–2.59, 2.53–2.80, 2.48–2.71, and 2.43–2.78. Obviously, these results were attributed to the swelling (or shrinking) behaviors of the PAN shell under a weakly alkaline (acid) medium of pH 7.4 (or 2.0) at 25 (or 37) °C [
60].
Additionally, the swelling–shrinking process of the PAN shell was accompanied by a dramatic
dmax values change. As can be seen in
Figure 6 (insert), the PDDF curves of the swollen or shrunken PAN@BMMs displayed a bell-shaped profile, implying the appearances of the ellipsoid-shaped morphologies. As shown in
Figure 6A (insert), the
dmax values of PAN@BMMs-I-0.1 at pH 7.4 and 25 °C were about 76.4 nm after swelling for 1 h, 77.1 nm for 3 h, 87.4 nm for 8 h, 88.9 nm for 12 h, and even up to 91.3 nm for 24 h, respectively. Obviously, a significant shift of the particle to a larger size occurred with an increase in swelling time. In addition, under pH 2.0 at 37 °C (
Figure 6B (insert)), its
dmax values decreased to 80.9 nm for 1 h, 76.5 nm for 3 h, 71.7 nm for 8 h, 67.9 nm for 12 h, and 65.4 nm for 24 h.
As shown in
Figure S10 (insert), similar results were also obtained in PAN@BMMs-I-0.05 (
Figure S9A,B (insert)), PAN@BMMs-I-1 (
Figure S9C,D (insert)), and PAN@BMMs-II-0.1 (
Figure 6C,D (insert)) in which, in pH 7.4 at 25 °C, their
dmax values were 49.8 to 80.8 nm for PAN@BMMs-I-0.05, 51.7 to 84.1 nm for PAN@BMMs-I-1, and 42.6 to 78.7 nm for PAN@BMMs-II-0.1. Comparatively, after immersion in an acidic (pH 2.0) environment at 37 °C, their
dmax values decreased from 66.8 nm to 33.4 nm for PAN@BMMs-I-0.05, from 68.6 nm to 59.3 nm for PAN@BMMs-I-1, and from 65.3 nm to 51.3 nm for PAN@BMMs-II-0.1. Whereas, as illustrated in the PDDF profiles of the reference PAN@BMMs-mix-0.1, over swollen or shrunken time it exhibited unsymmetrical curves, representing the microstructure inhomogeneity that was possibly caused by the formation of the doped AN aggregates. The
dmax value varied from 74.6 to 90.1 nm in pH 7.4 at 25 °C (
Figure 6E (insert)) and then conversely from 89.5 to 75.6 nm in pH 2.0 at 37 °C (
Figure 6F (insert)). These results were consistent with those of the DLS analysis, evidently verifying the pH- and temperature-responsive behaviors of PAN@BMMs, which could be conducive to controlled drug releasing.
3.4. Fluorescent Properties and Fractal Evolution during Drug Loading and Release
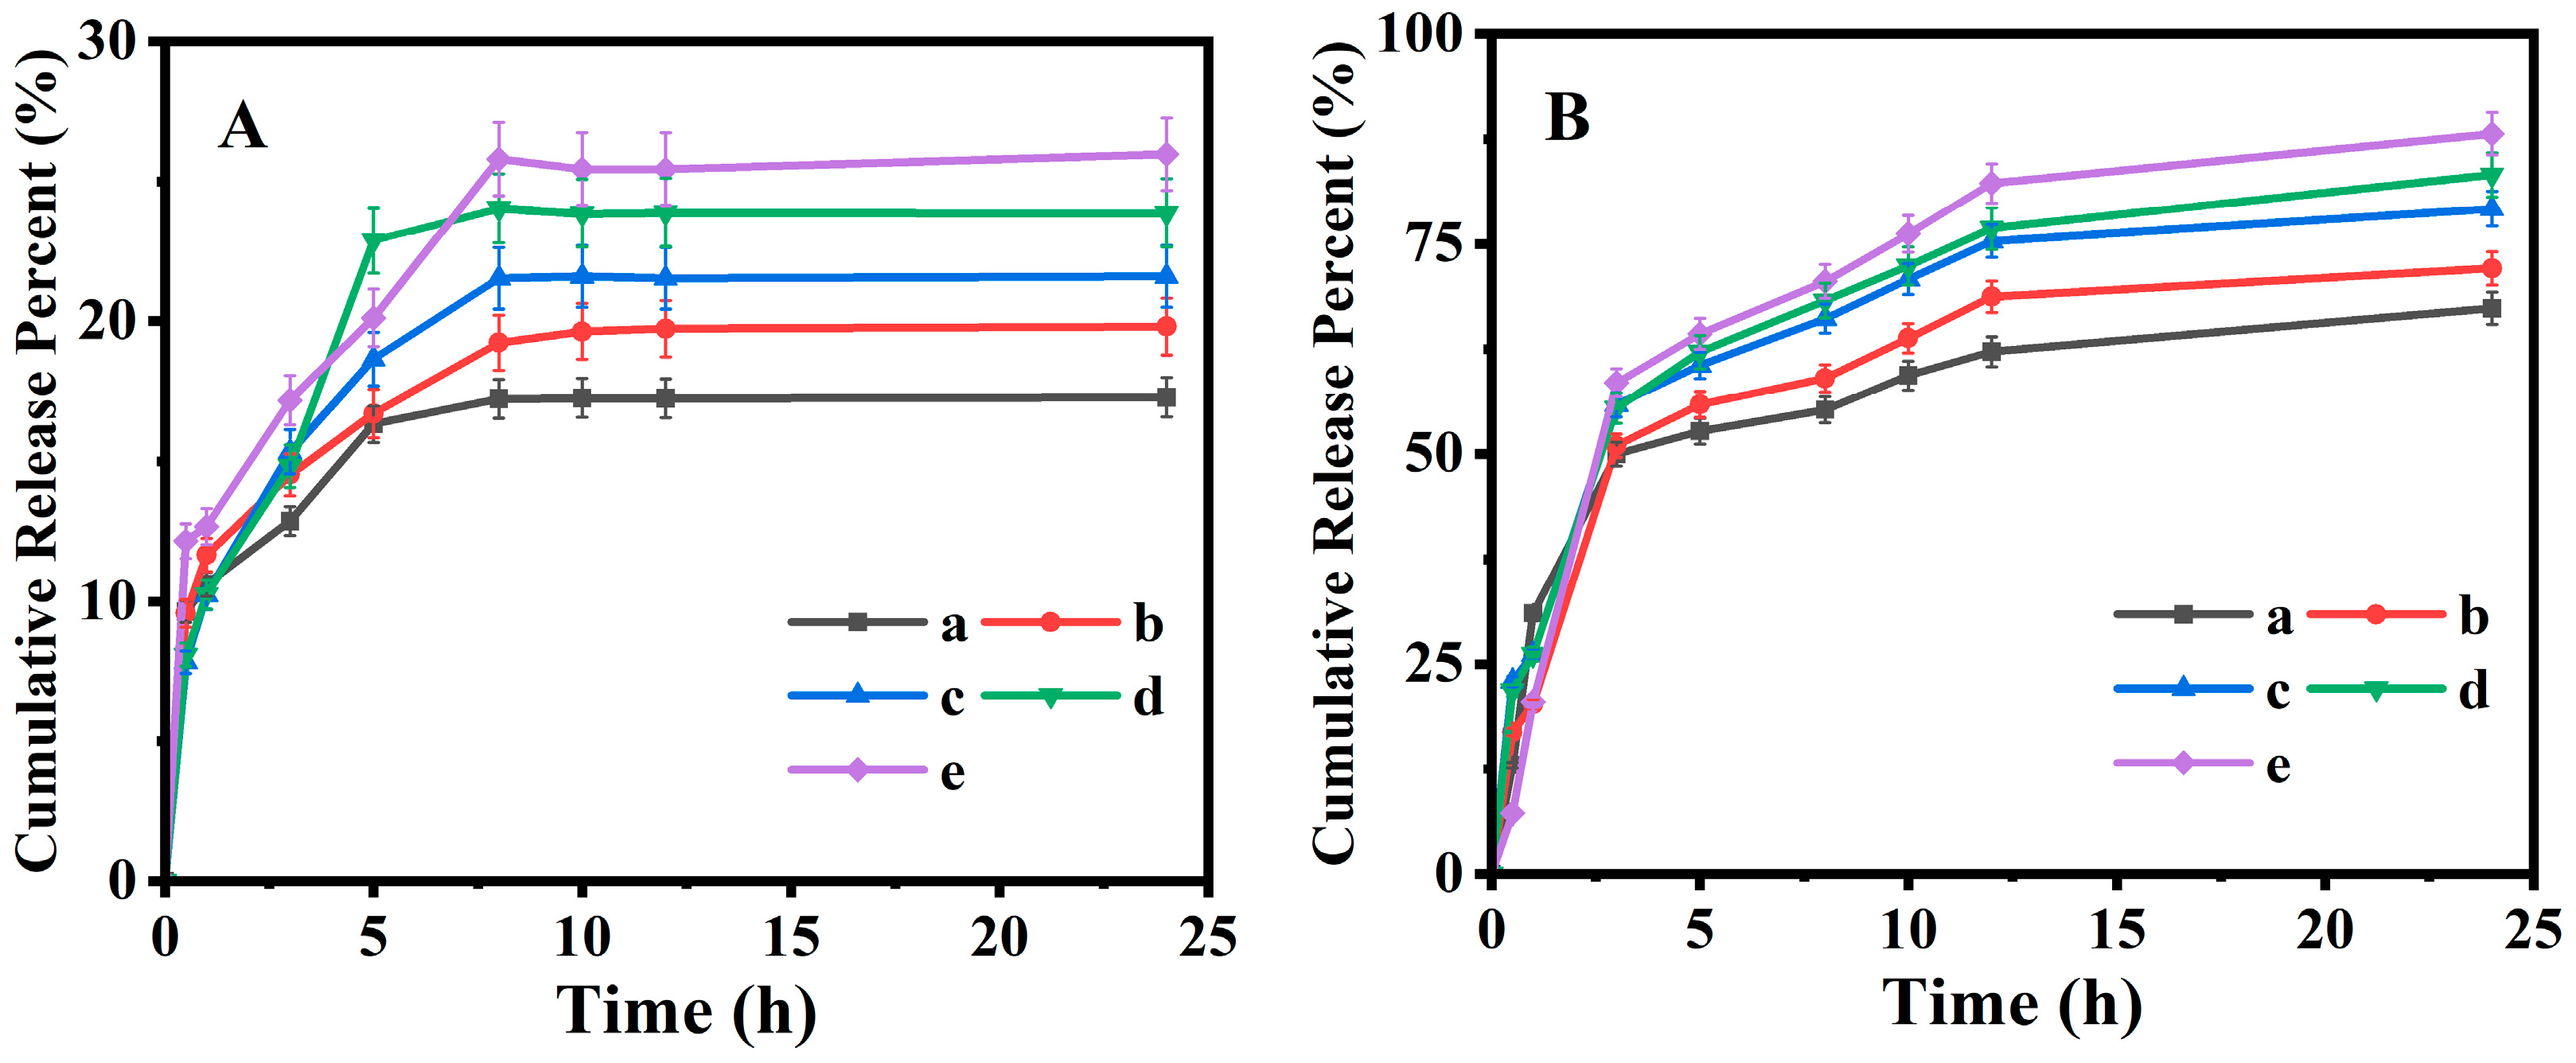
The HPLC measurements indicated that the PAN@BMMs-I-0.05, -0.1, -1, PAN@BMMs-II-0.1, and PAN@BMMs-mix-0.1 can be IBU loaded with the LC% of 12.8, 11.3, 8.3, 15.9, and 12.9%, respectively, suggesting that the IBU can be embedded into the cores of BMMs in PAN@BMMs. Subsequently, the temperature- and pH-responsive releases of IBU from I/PAN@BMMs were investigated in the simulated PBS fluids at pH 7.4 25 °C and pH 2.0 at 37 °C. As shown in
Figure 7A, only about 17.3, 19.8, 21.6, 23.9, and 26.0% of IBU was released from I/PAN@BMMs-I-0.05 (
Figure 7A (a)), I/PAN@BMMs-I-0.1 (
Figure 7A (b)), I/PAN@BMMs-I-1 (
Figure 7A (c)), I/PAN@BMMs-II-0.1 (
Figure 7A (d)), and I/PAN@BMMs-mix-0.1 (
Figure 7A (e)) over 24 h under the conditions of pH 2.0 at 37 °C. Notably, almost no initial burst release was observed. By contrast, a fast and large amount of IBU was released in pH 7.4 at 25 °C (
Figure 7B); the cumulative release percent reached about 67.4% for I/PAN@BMMs-I-0.05 (
Figure 7B (a)), 72.1% for I/PAN@BMMs-I-0.1 (
Figure 7B (b)), 79.2% for I/PAN@BMMs-I-1 (
Figure 7B (c)), 83.2% for I/PAN@BMMs-II-0.1 (
Figure 7B (d)), and 88.1% for I/PAN@BMMs-mix-0.1 (
Figure 7B (e)) after 24 h.
At pH 7.4 at 25 °C, the swelling behavior of the PAN shell in PAN@BMMs was conductive to opening the pores, resulting from the electrostatic repulsion of the deprotonated carboxyl group in PAN [
61], and thereby leading to the ease of diffusion of the loaded drug from the opened pore channels and a higher release amount. In contrast, in pH 2.0 at 37 °C, the PAN shell was shrunken due to the formation of hydrogen binding among carboxyl groups and the hydrophobicity among the hydrophobic groups (–CH(CH
3)
2) at the temperature above the LCST of PNIPAM [
62]. These similar observations were confirmed by the fact that the hydrodynamic diameter of the PAN@BMMs in pH 7.4 at 25 °C was larger than that in pH 2.0 at 37 °C. Consequently, the shrinking of the PAN shell in PAN@BMMs could be modulated in acidic PBS (pH = 2.0) at 37 °C, which effectively encapsulated the mesopores of BMM core, preventing IBU from diffusing through the mesoporous channels.
Thereafter, the photoluminescence spectra of the IBU-released samples were also investigated at pH 7.4 at 25 °C and pH 2.0 at 37 °C. As shown in
Figure S11B (a), the fluorescence intensity at 485 nm for I/PAN@BMMs-I-0.1 (S) slightly decreased with the extension of the release time at pH 7.4 at 25 °C, but it was stronger than that of the filtrated solutions (L) located at 482 nm. Interestingly, the peak intensity of all filtrated solutions was shifted to a shorter wavelength region compared with that of the I/PAN@BMMs-I-0.1 solid, suggesting that the doped AN existed as a monomer state in the filtrates. Meanwhile, in pH 2.0 at 37 °C (
Figure S11B (b)), the fluorescence intensity at 486 nm for solid I/PAN@BMMs-I-0.1 (S) decreased relatively to the prolonged release time; in contrast, the emission peak of filtrates (L) was enhanced and further redshifted to 492 nm. The reason for this may be related to the higher extrusion of doped AN from the shrunken PAN networks. Fortunately, the overall PL intensity of filtrates (L) was much lower than that of I/PAN@BMMs-I-0.1 (S). Similar results were also observed in other I/PAN@BMMs, as shown in
Figure S10A,C–E. These results indicated that the PAN@BMMs maintain a good fluorescent stability during the IBU release process, which is especially beneficial for monitoring or tracking the drug delivery to function as a luminescent probe.
The fractal evolutions of the pore microstructure in PAN@BMMs occurred during the IBU loading and controlled release from PAN@BMMs carriers. Taking PAN@BMMs-I-0.1 as an example, its fractal features and PDDF curves were both introduced to further describe the IBU loading and releasing performances. According to the abovementioned low-q region of swollen PAN@BMMs (−2.20 < lnq < −1.52), all samples presented a typical fractal feature with a good correlation R2 (> 0.99).
Figure 8A presented the time-dependent fluorescent spectra of the solid sample and the corresponding filtered solution. The peak (475 nm) intensity of the solution (L) gradually increased over loading time up to 48 h (
Figure 8A-L), whereas a slightly decreased intensity of the peak (465 nm) was observed for I/PAN@BMMs-I-0.1 solid (
Figure 8A) due to NA leaching from the PAN shell. Additionally,
Figure 8A (insert) presented the IBU-loading capacity of PAN@BMMs-I-0.1, showing 7.9% for 1 h, 9.6% for 5 h, 10.4% for 12 h, and up to 11.3% for 48 h.
As shown in
Figure 8B, the
dm value of PAN@BMMs-I-0.1 increased from 2.88 (±0.02) for 1 h (
Figure 8B (a)) to 2.93 (±0.02) for 5 h (
Figure 8B (b)). Interestingly, when the IBU-loading amount increased to 11.3%, its fractal features were transformed from
dm to
ds, the corresponding
ds values were 2.93 (±0.02) for 12 h (
Figure 8B (c)), 2.55 (±0.04) for 24 h (
Figure 8B (d)), and 2.49 (±0.04) for 48 h (
Figure 8B (e)), implying variations from loose to dense structures with a rough surface along with a decrease in their mean mesopore size and volume (as shown in
Figure S3B). These observations indicated that IBU was indeed loaded into the mesoporous channels of PAN@BMMs-I-0.1, in agreement with Varga’s report [
63]. Additionally, as the drug-loading time increased, the PDDF curves (
Figure 8B (insert)) showed that the
dmax value of the particle increased from 51.3 nm at 1 h to 58.0 nm at 5 h, 61.1 nm at 12 h, 75.4 nm at 24 h, and 76.5 h at 48 h, suggesting the successful encapsulation of IBU to the BMM core.
However, the fractal features of I/PAN@BMMs-I-0.1 were conversely transformed from
ds to
dm during IBU releasing. As can be seen in
Figure 8C, the
ds (the value of 2.68 (±0.04) for 1 h (
Figure 8C (a)) and 2.92 (±0.04) for 3 h (
Figure 8C (b))) reconverted to
dm, and then the
dm value decreased to 2.80 (±0.04) at 8 h (
Figure 8C (c)) and 2.75 (±0.04) at 12h (
Figure 8C (d)) during the prolonged IBU releasing and reached 2.69 (±0.04) at 24 h (
Figure 8C (e)) when the releasing percent was 19.8% at equilibrium time under pH 2.0 at 37 °C, gradually showing the loose microstructures. The corresponding
dmax value (
Figure 8C (insert)) of the I/PAN@BMMs-I-0.1 particles decreased from 77.6 nm for 1 h to 64.2 nm for 3 h, 58.6 nm for 8 h, 49.7 nm for 12 h, and 39.0 nm for 24 h. One of the main reasons for this was the shrinking of the soft PAN shell, rather than variations in the static rigid BMM core. These results suggested that the drug was released from the mesopore channels of the BMM core.
Identically, with the drug released in pH 7.4 at 25 °C,
Figure 8D also showed that the
ds (value of 2.81 (±0.05) for 1 h (
Figure 8D (a))) shifted to
dm (value of 2.92 (±0.04) for 3 h (
Figure 8D (b))), and the
dm value decreased to 2.80 (±0.04) for 8 h (
Figure 8D (c)) and 2.72 (±0.04) for 12 h (
Figure 8D (d)). However, the
dm value reached 2.59 (±0.04) at 24 h (
Figure 8D (e)) when the IBU-releasing percent was 72.1% at equilibrium time under pH 7.4 at 25 °C, lower than that (2.69 (±0.04)) in pH 2.0 at 37 °C (
Figure 8C), which may be owing to the significant amounts of IBU released from the mesoporous channels.
Additionally, the
dmax values (
Figure 8D (insert)) of the drug-released I/PAN@BMMs-I-0.1 were increased from 59.9 nm at 1 h to 65.7 nm at 3 h, 66.1 nm at 8 h, 77.7 nm at 12 h, and 78.2 nm at 24 h, which are higher than those in pH 2.0 at 37 °C. The possible reason for this was that the drug diffusing from the mesoporous channels of the BMM core resulted in the uptake of water during the swelling of the PAN shell in pH 7.4 at 25 °C.

