
Mechanical Behavior of GFRP Laminates Exposed to Thermal and Moist Environmental Conditions: Experimental and Model Assessment

Abstract
:
1. Introduction
2. Test Program
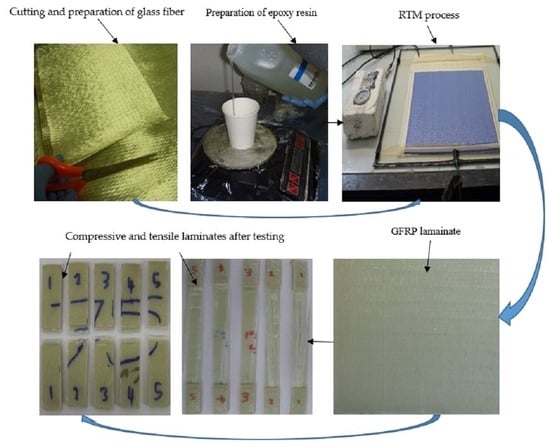
2.1. Materials
2.2. Laminate Preparation and Testing Methods
2.3. Weibull Statistical Distribution
3. Experimental Results and Discussion
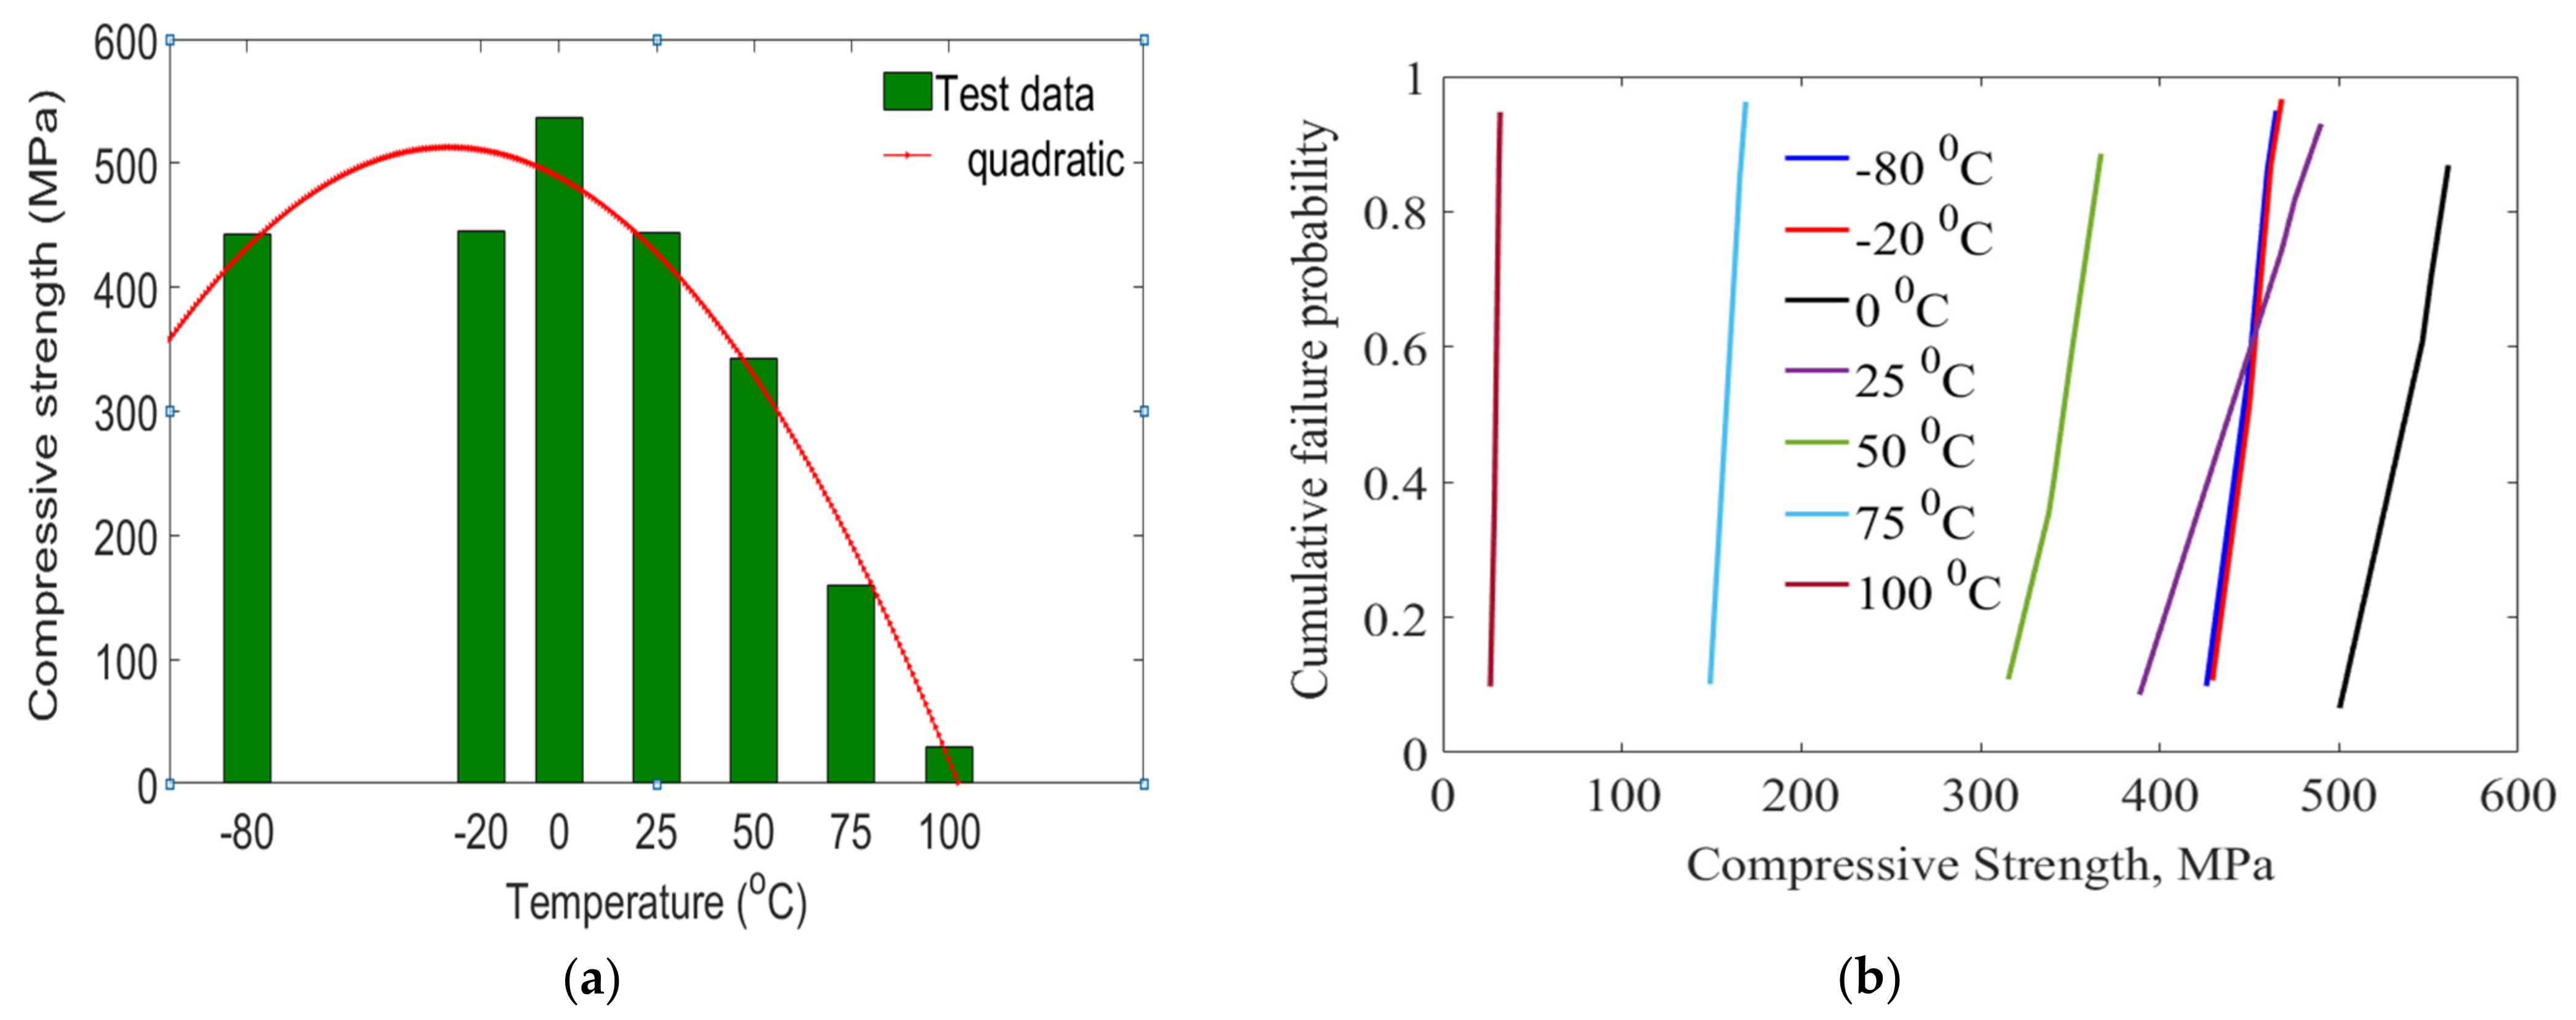
3.1. Compressive Tests
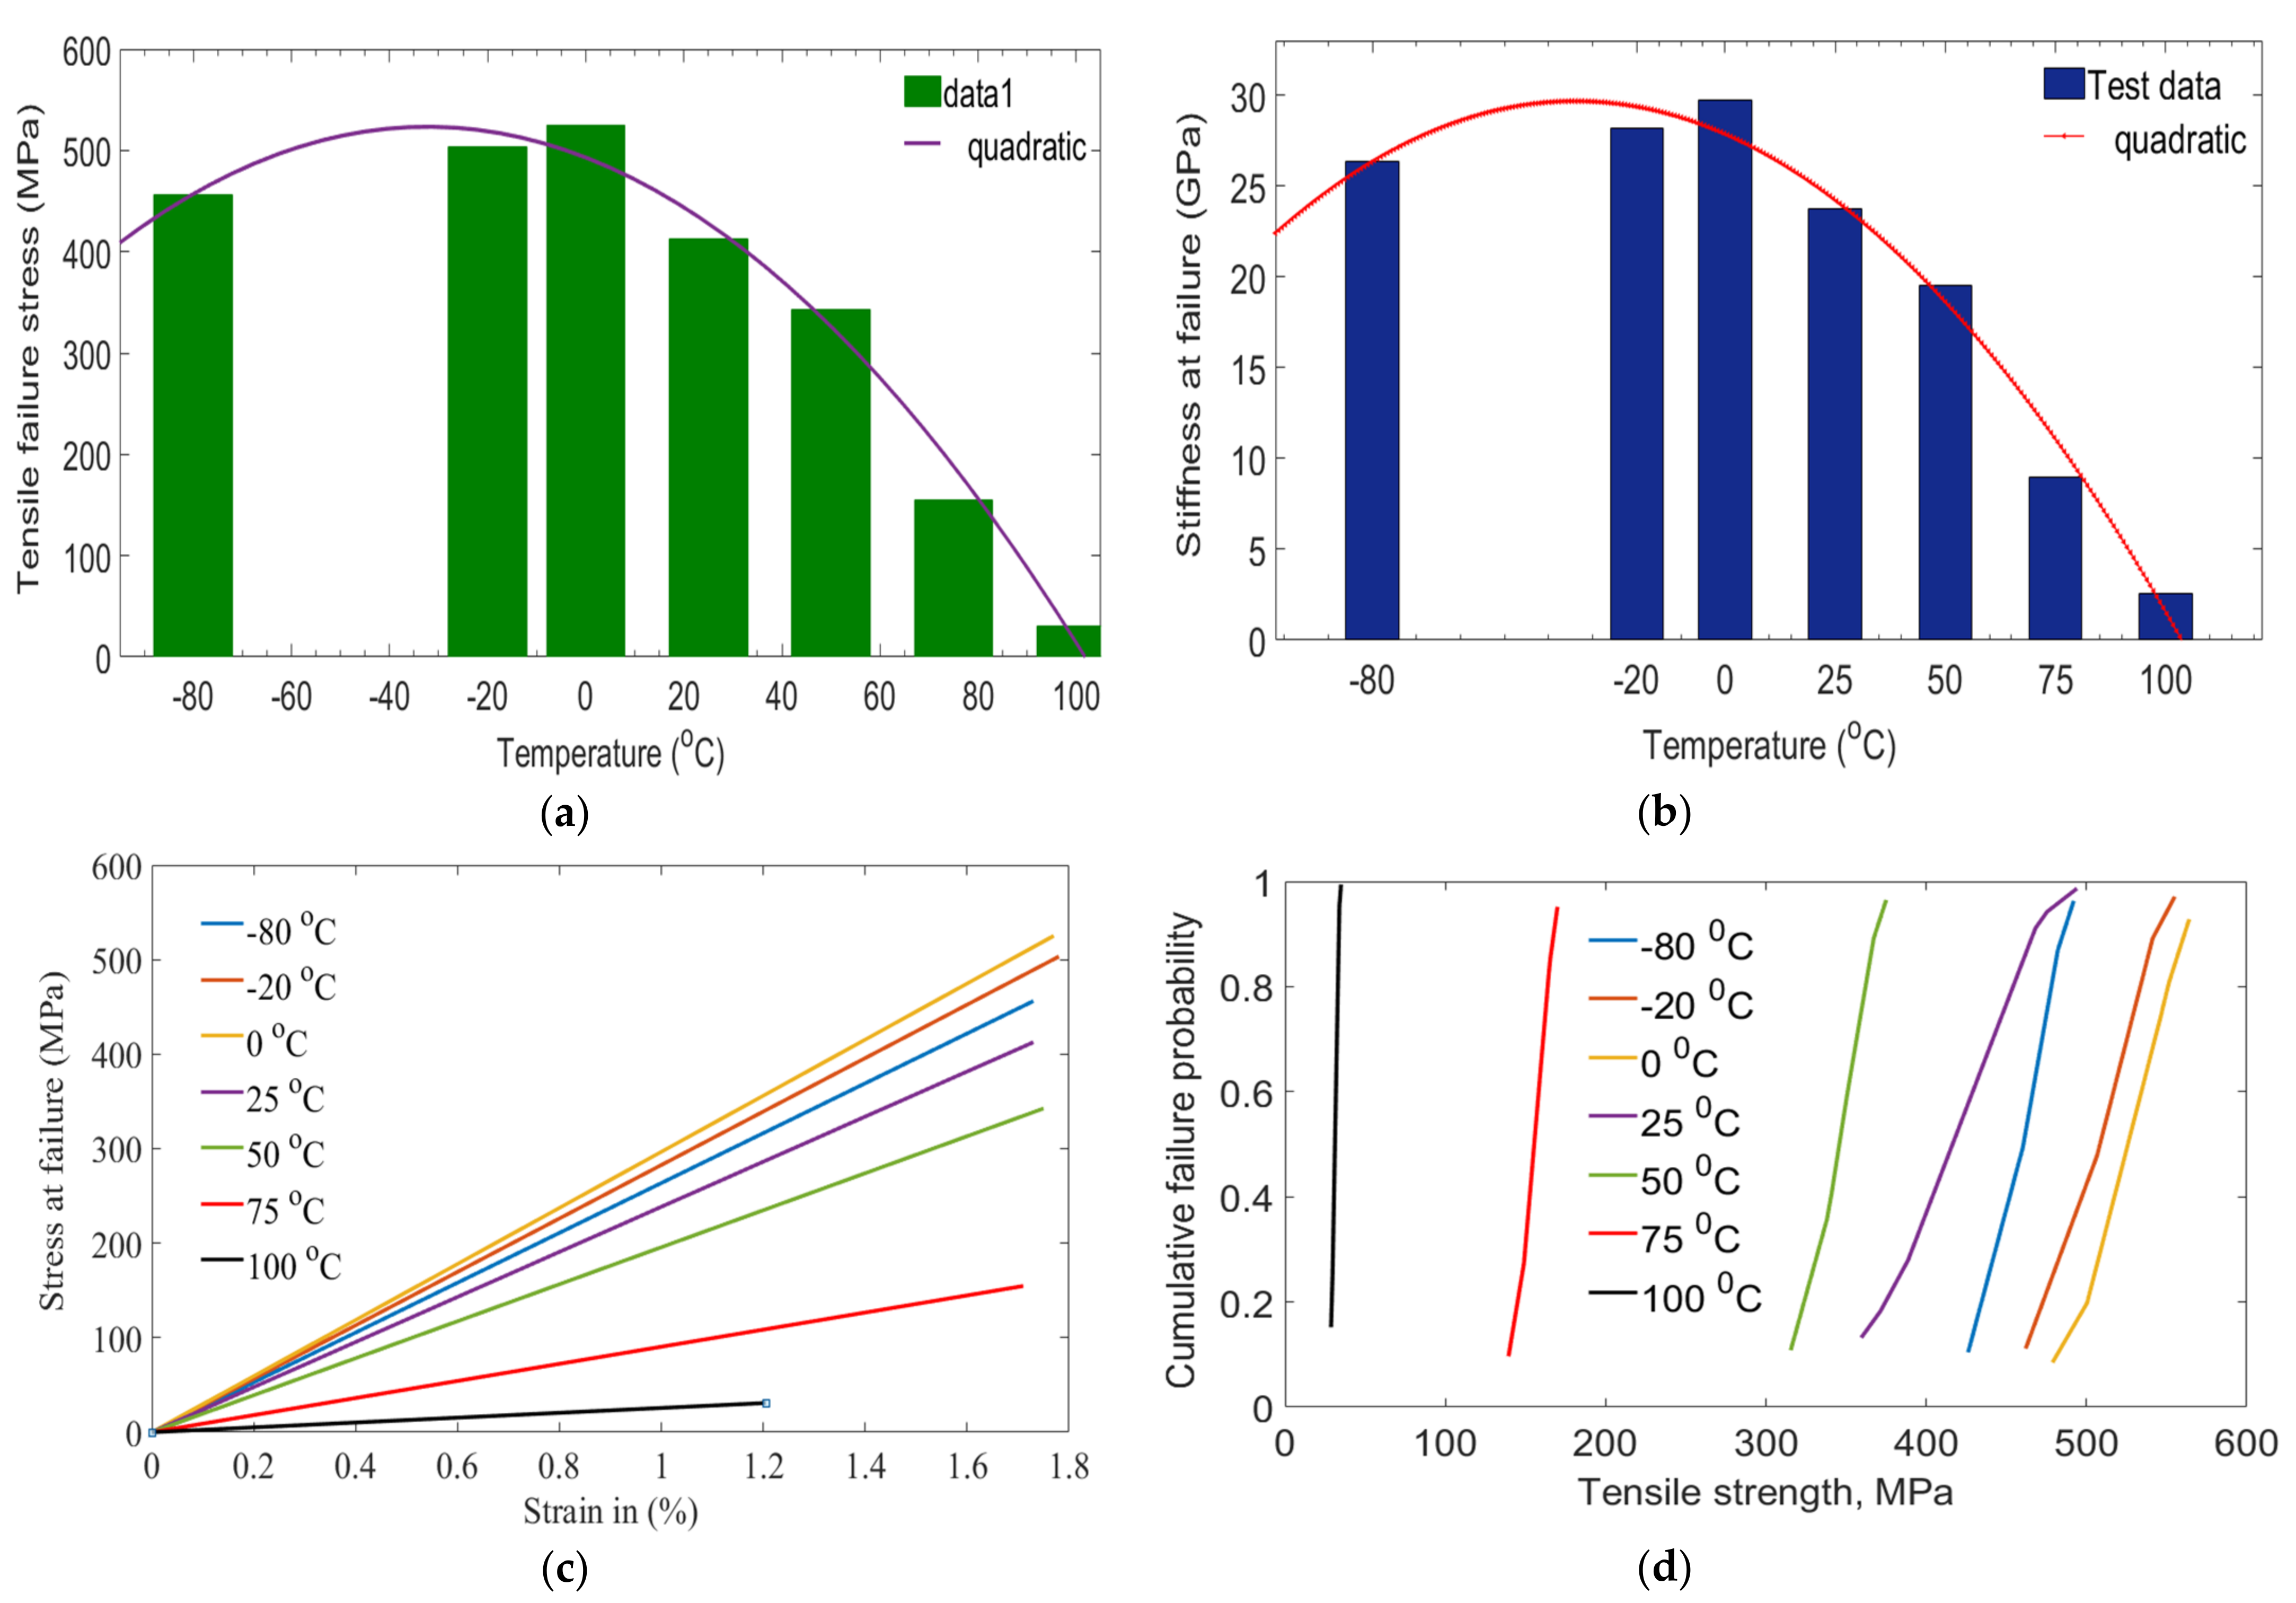
3.2. Tensile Tests
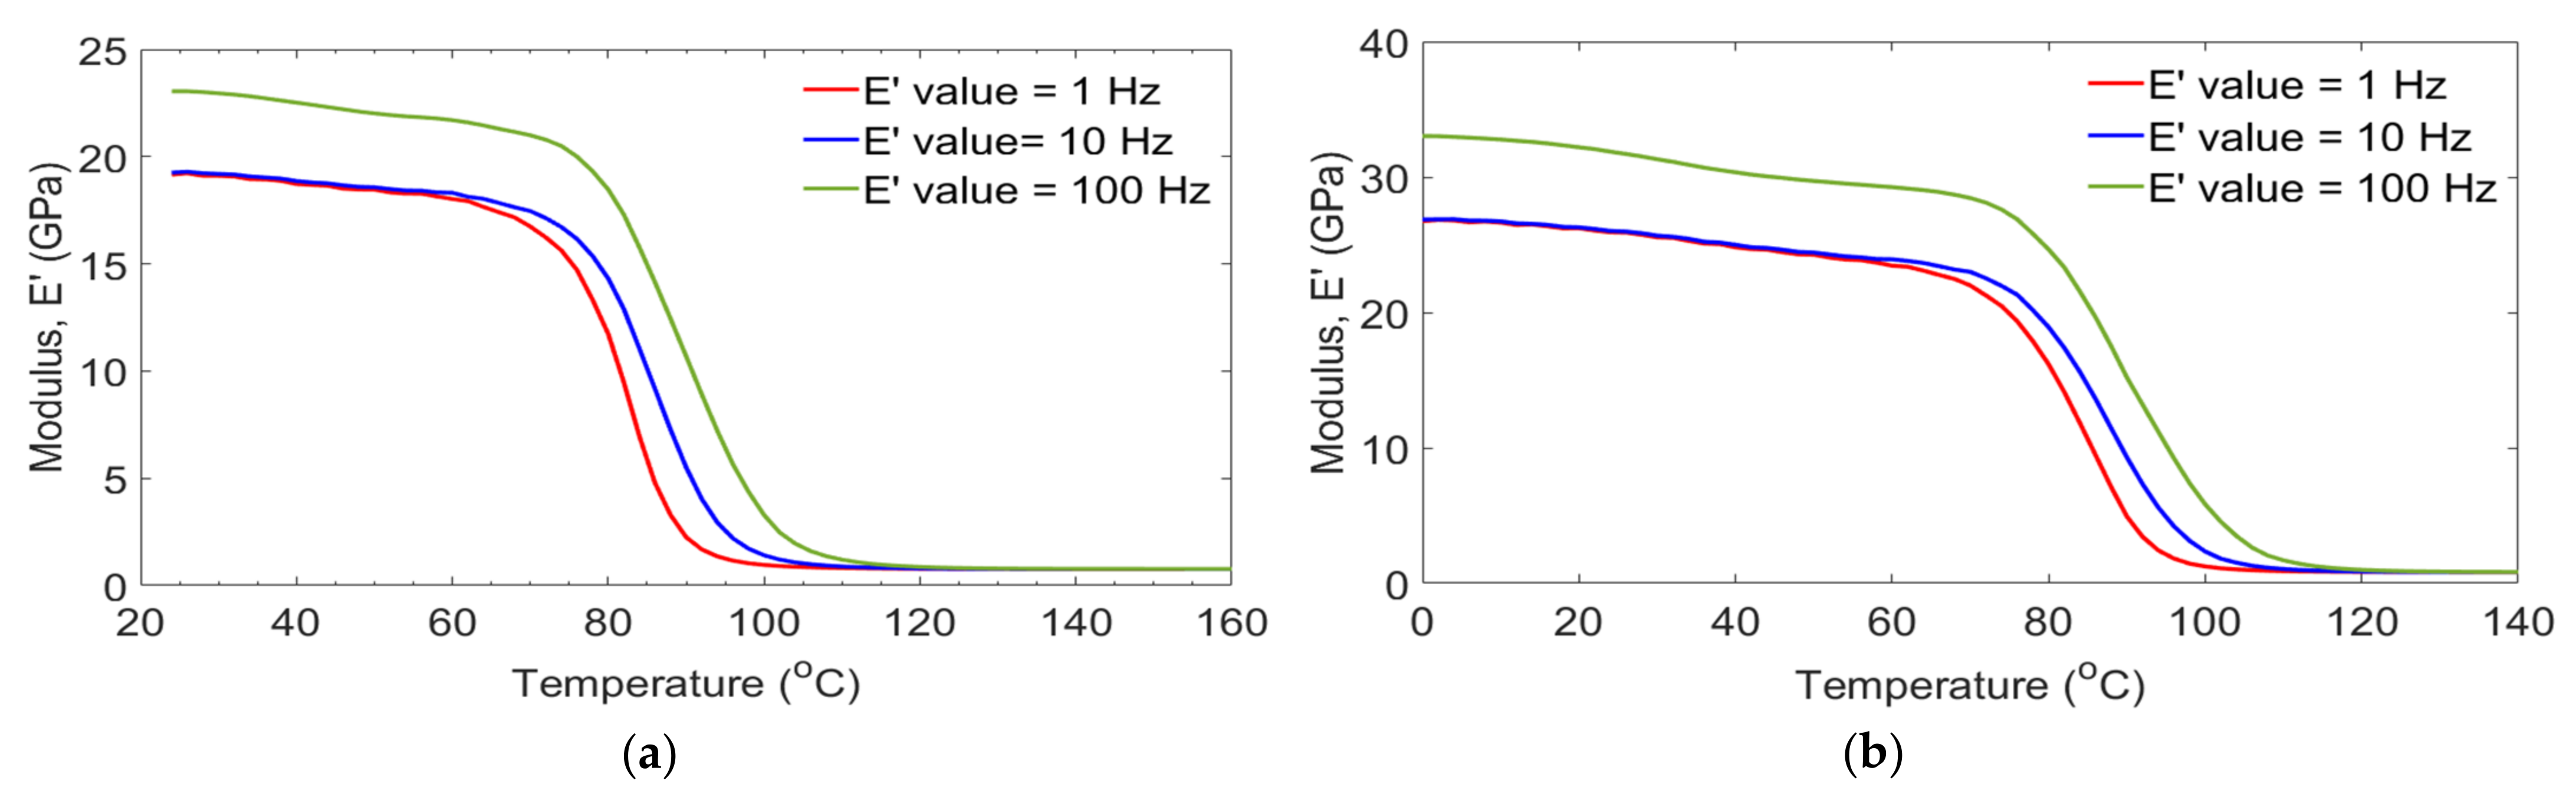
3.3. DMA Tests
4. Statistical Analyses
Analysis of Variance (ANOVA)
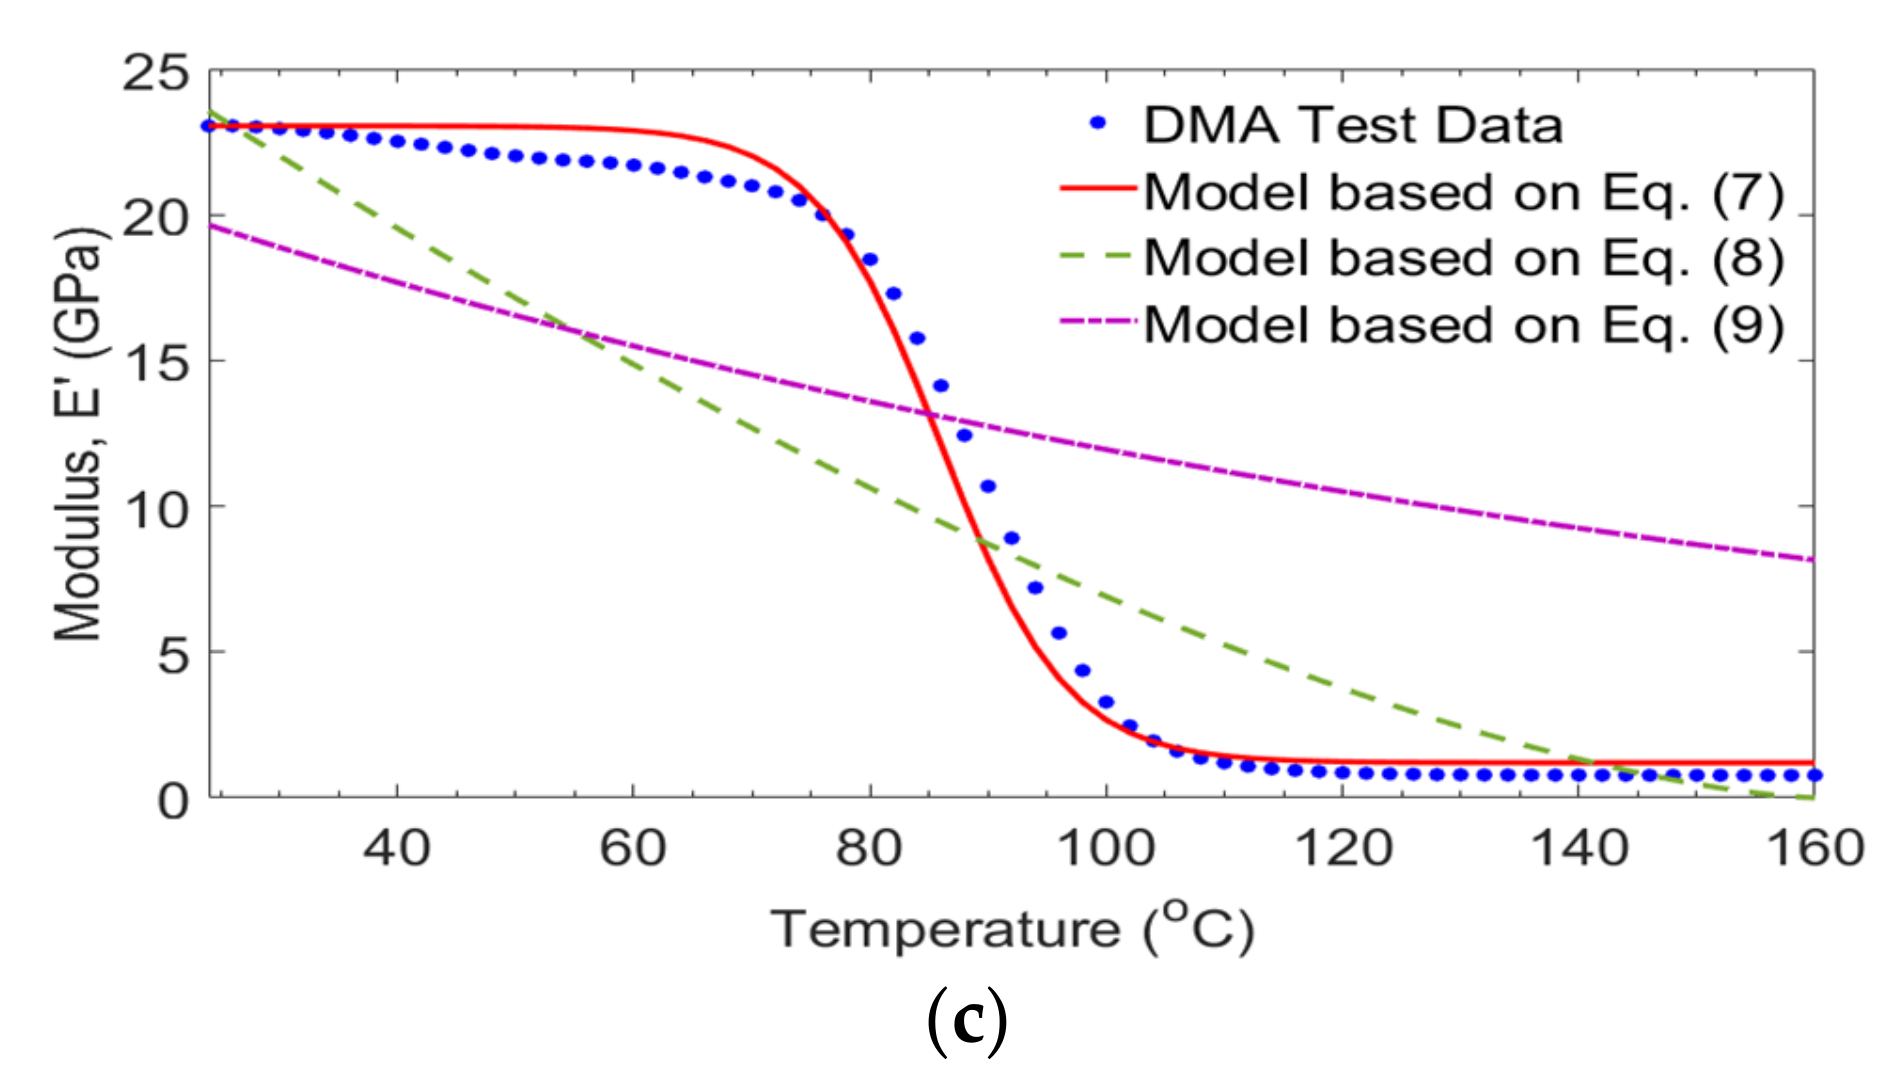
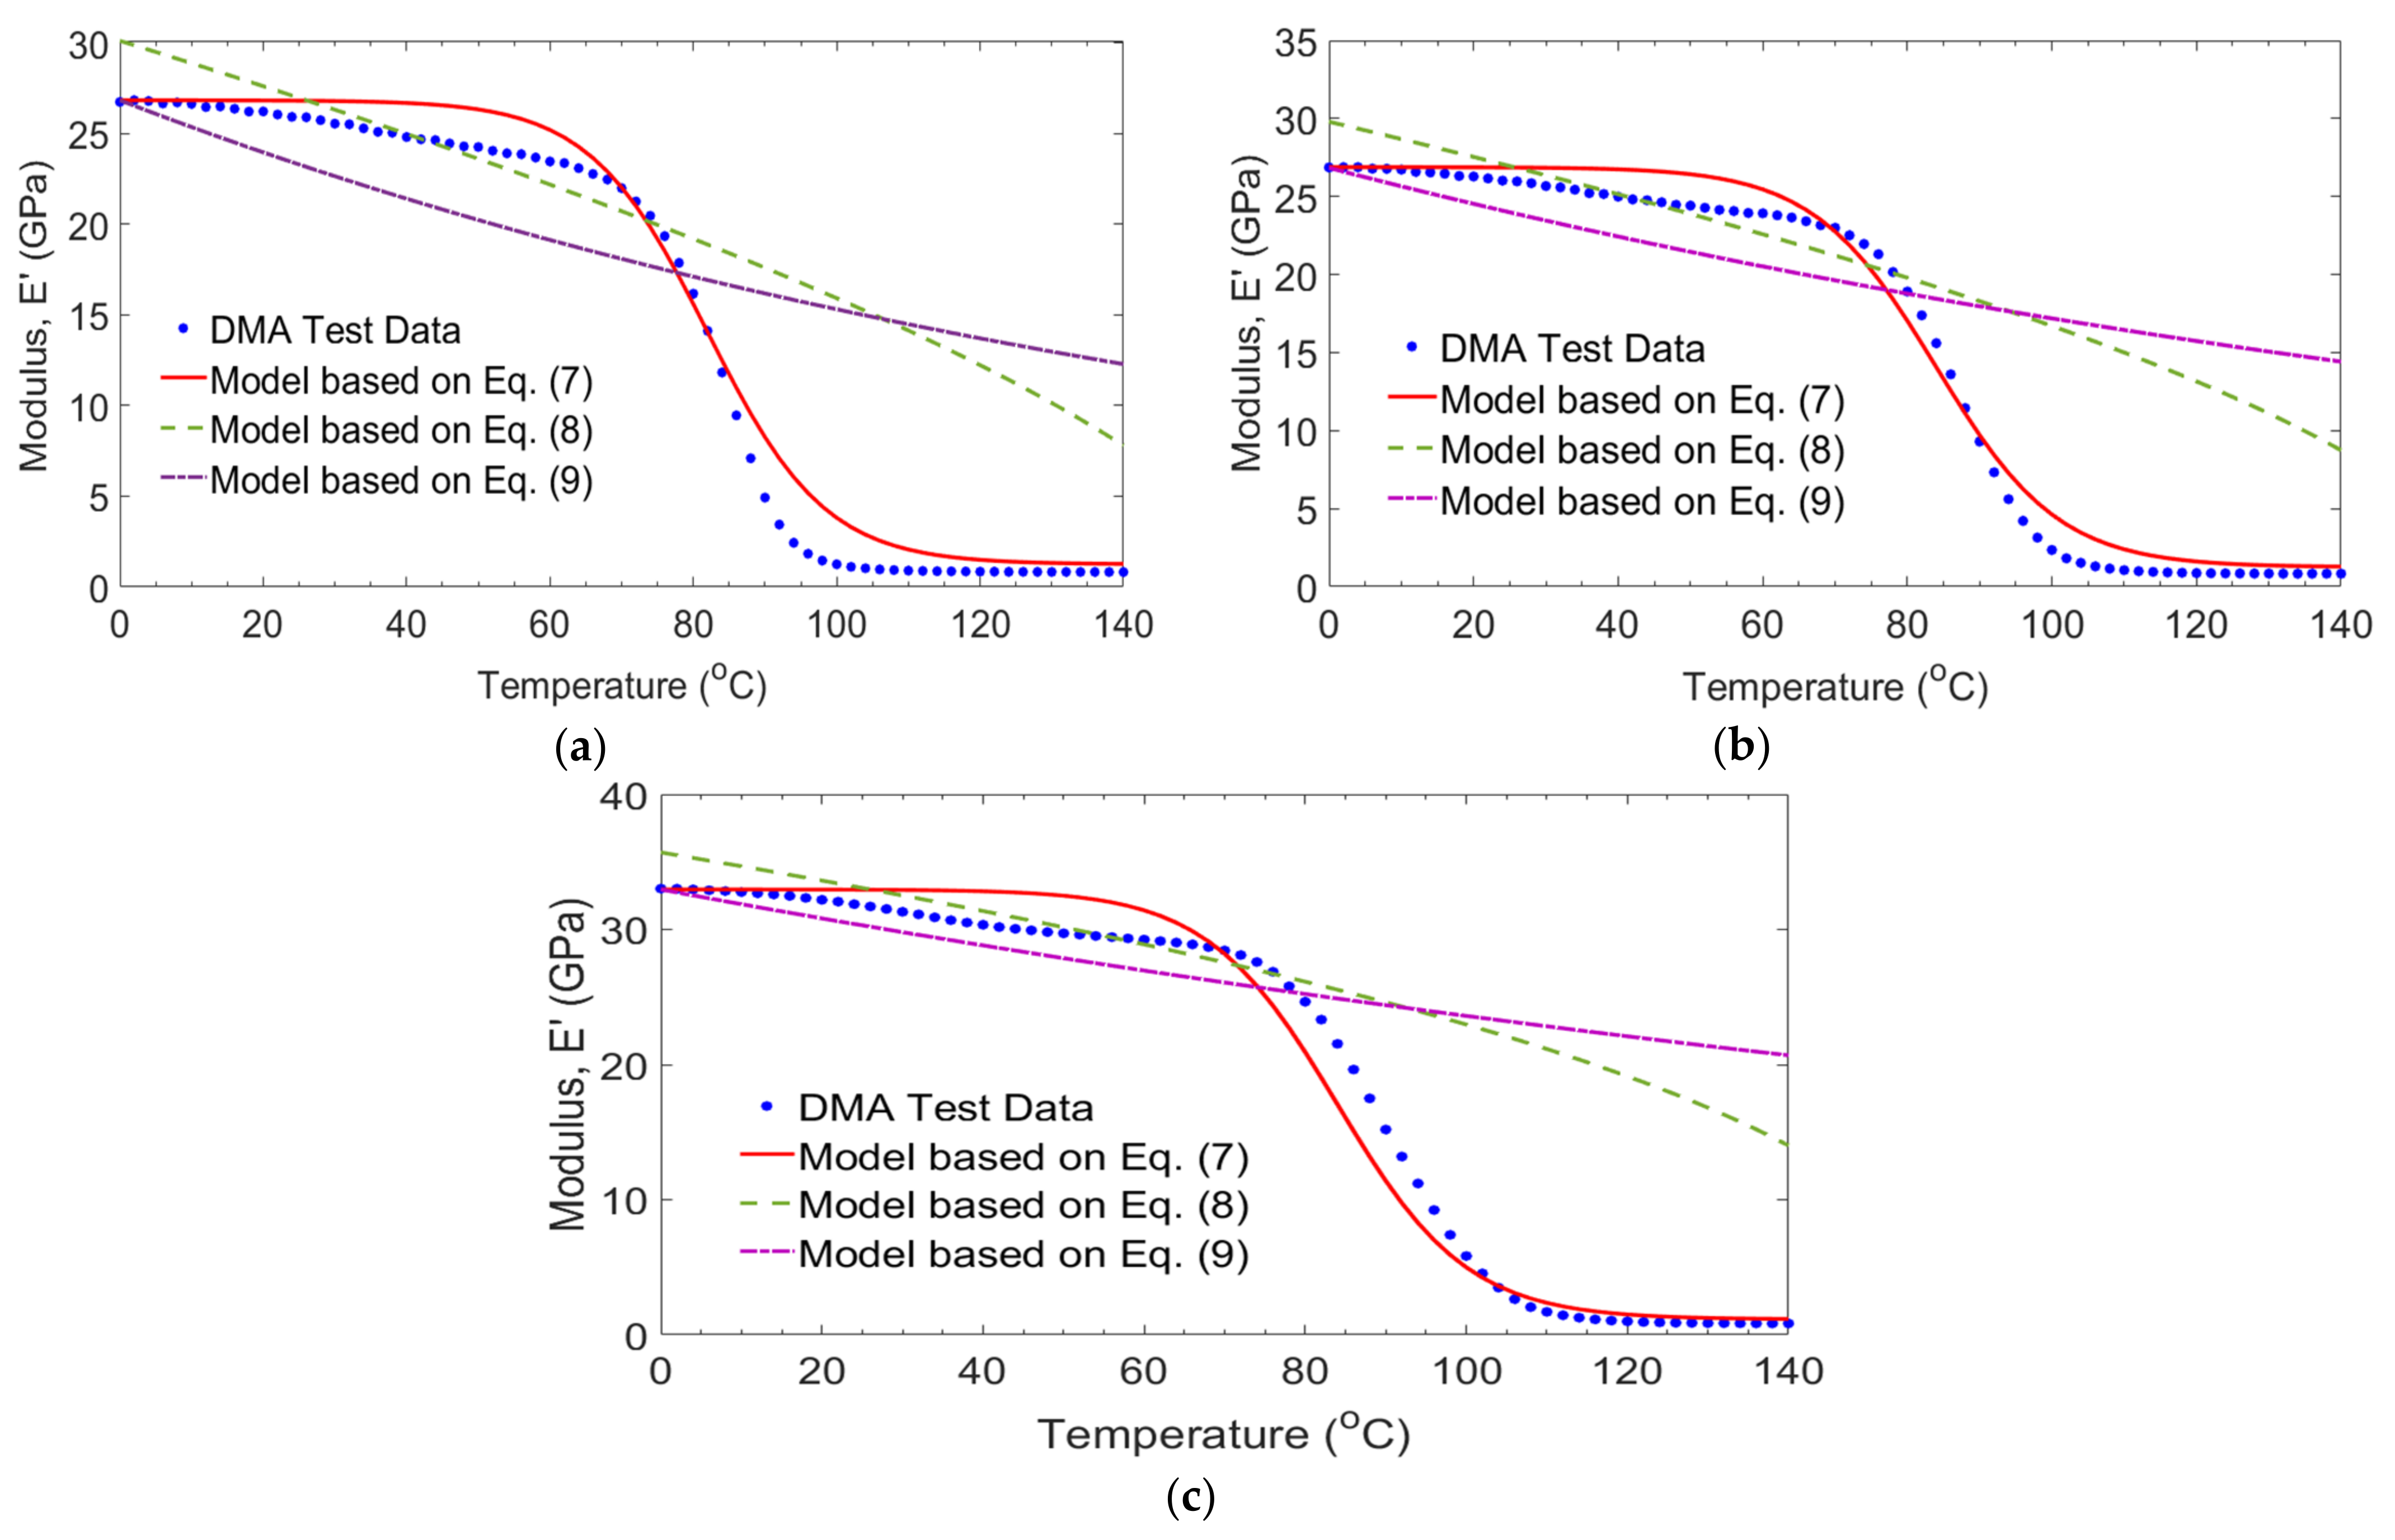
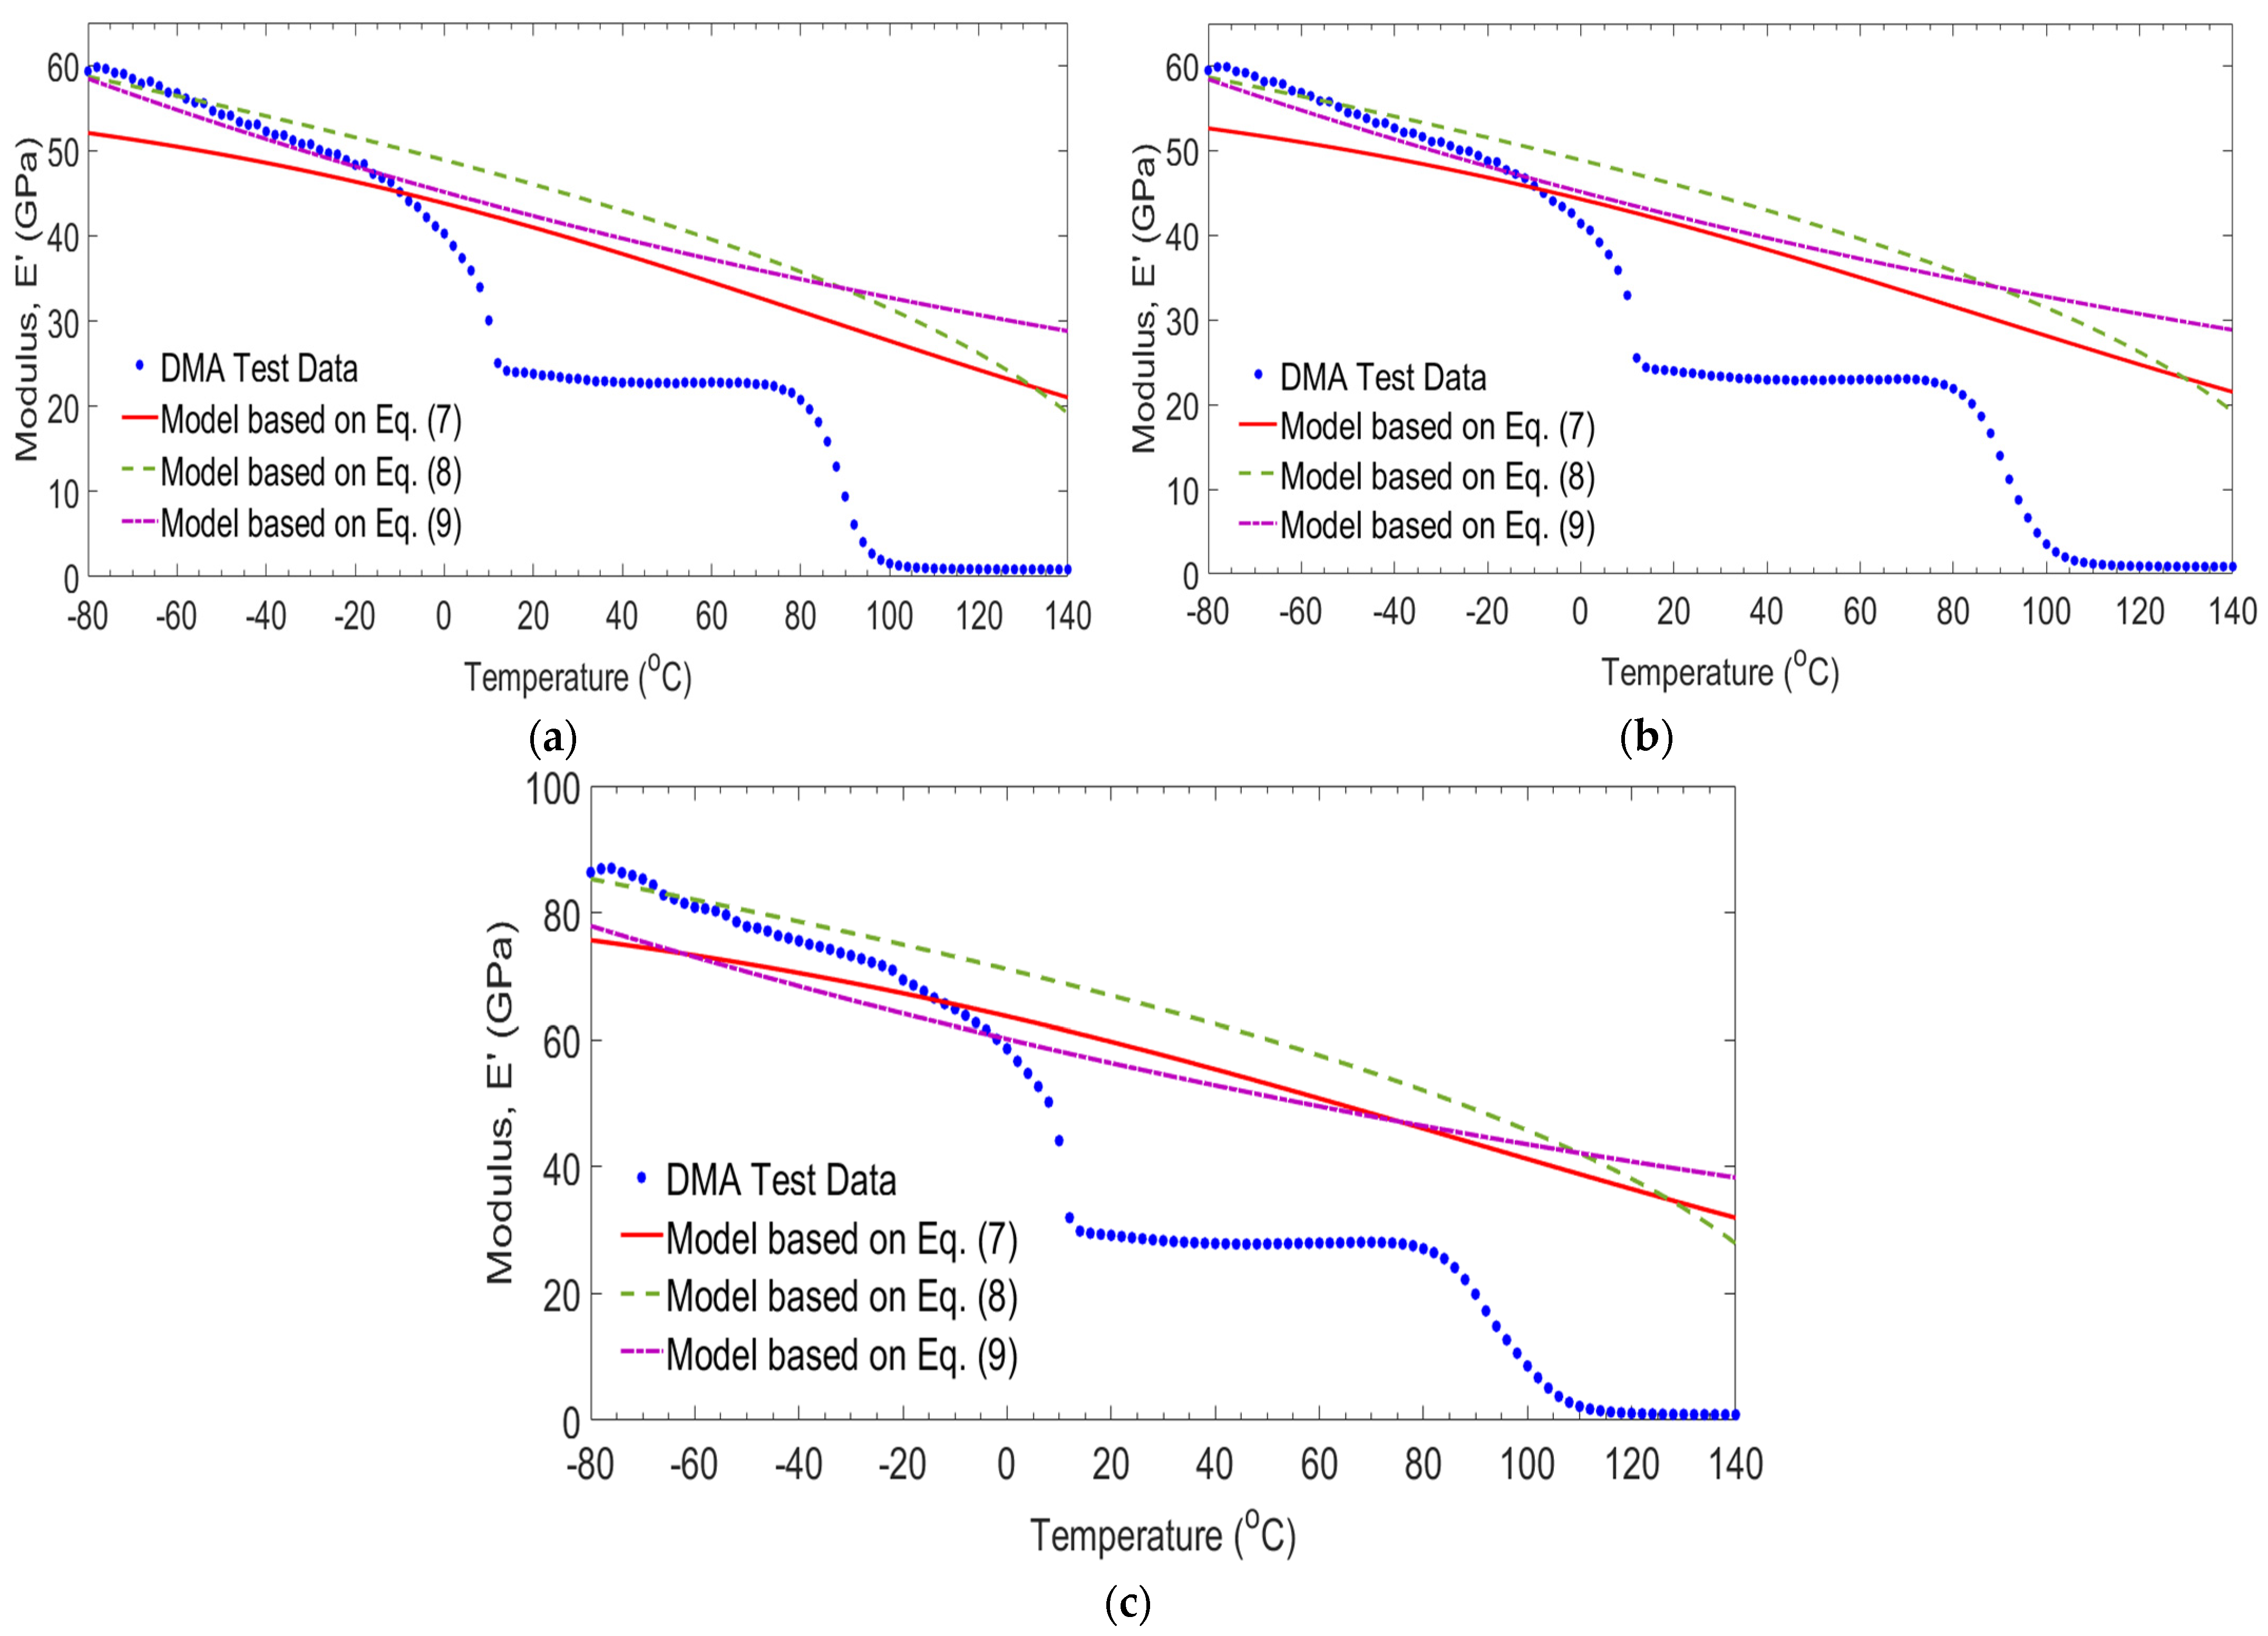
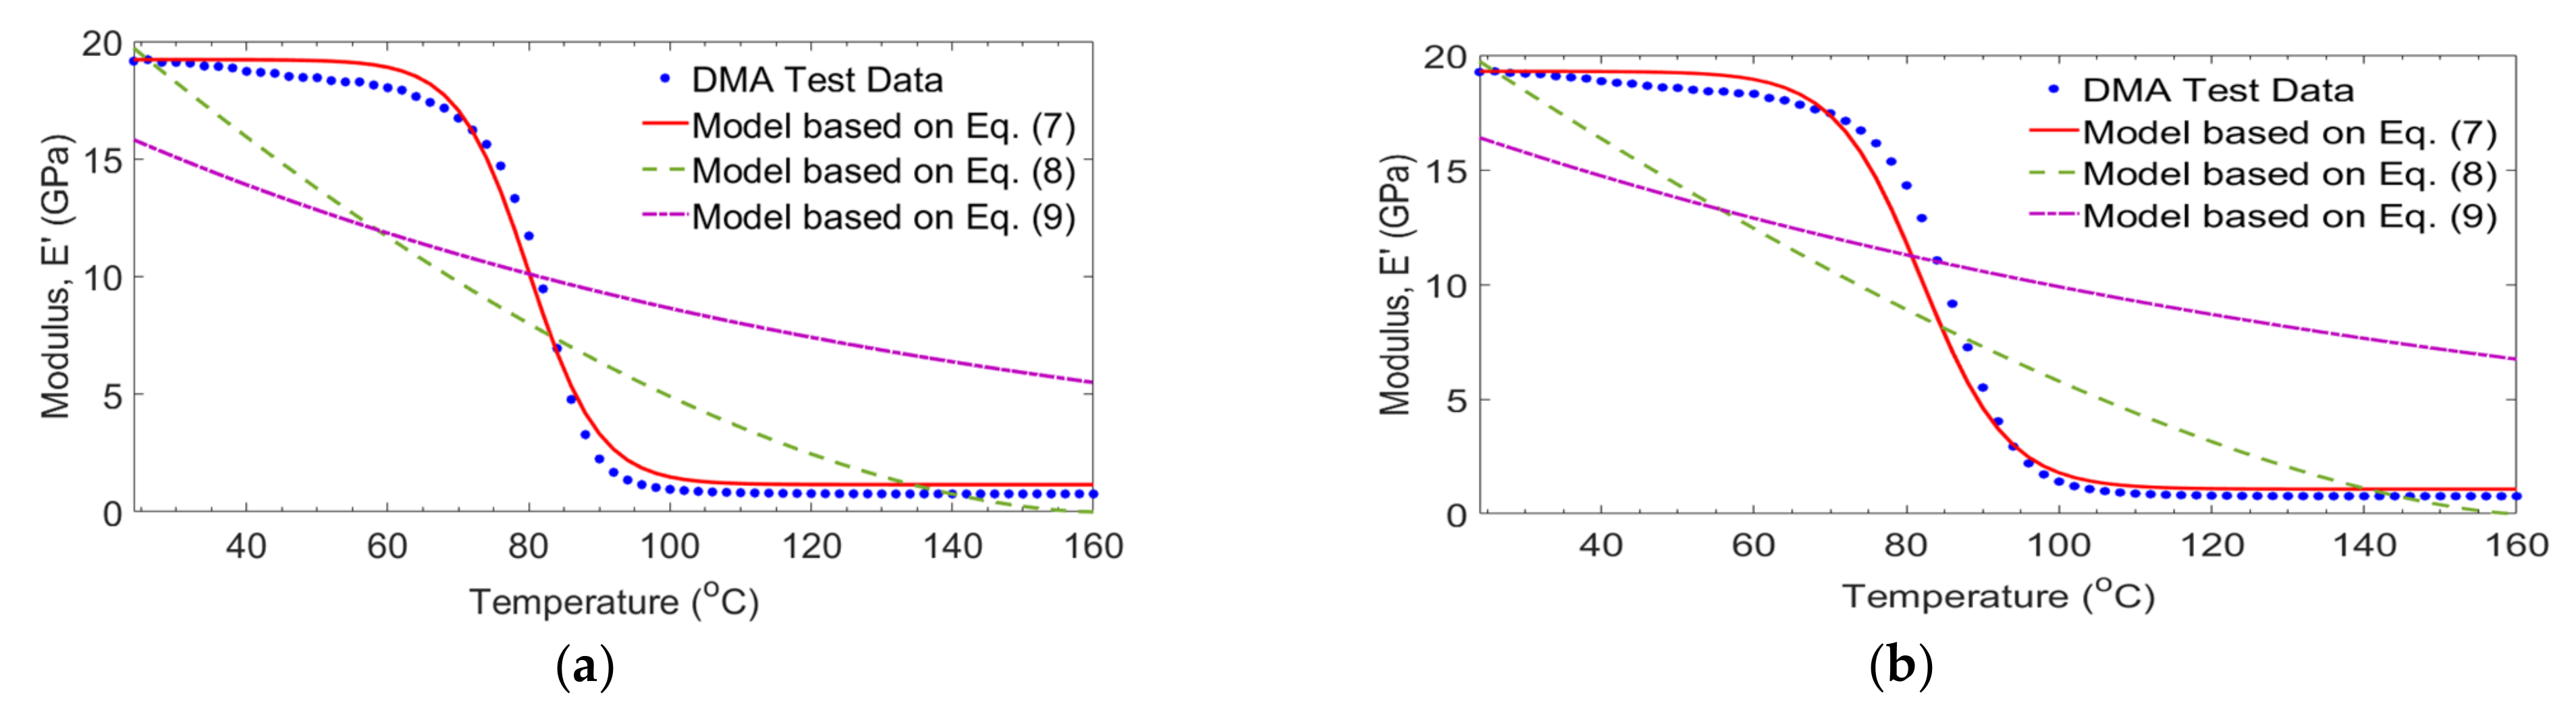
5. Comparison between the Prediction Models and Experimental Results
Proposed Empirical Models for Experimental Results
6. Conclusions
- 1.
- Temperatures ranging from −80 °C to 50 °C, which were below the glass transition temperature of unidirectional GFRP laminates, did not significantly affect the compressive strength, tensile strength, and stiffness properties. This indicated that temperatures below Tg of GFRP laminates slightly affect their mechanical performances. In this case, long splitting and lateral failure mode have occurred. The load transfer capacity of the epoxy resin to the fiber was strong.
- 2.
- At a testing temperature of 75 °C, which was near to Tg of GFRP laminates, the compressive strength, tensile strength, and stiffness properties were decreased due to softening of the epoxy matrix, which was weak to transfer the load to the fibers. In this case, long splitting types of failure mode have occurred.
- 3.
- At a testing temperature of 100 °C, which was above the Tg of GFRP laminates, the compressive strength, tensile strength, and stiffness properties were decreased significantly due to the damaging of the fiber/matrix interface. In this case, the load-carrying capacity of the fiber was reduced severely.
- 4.
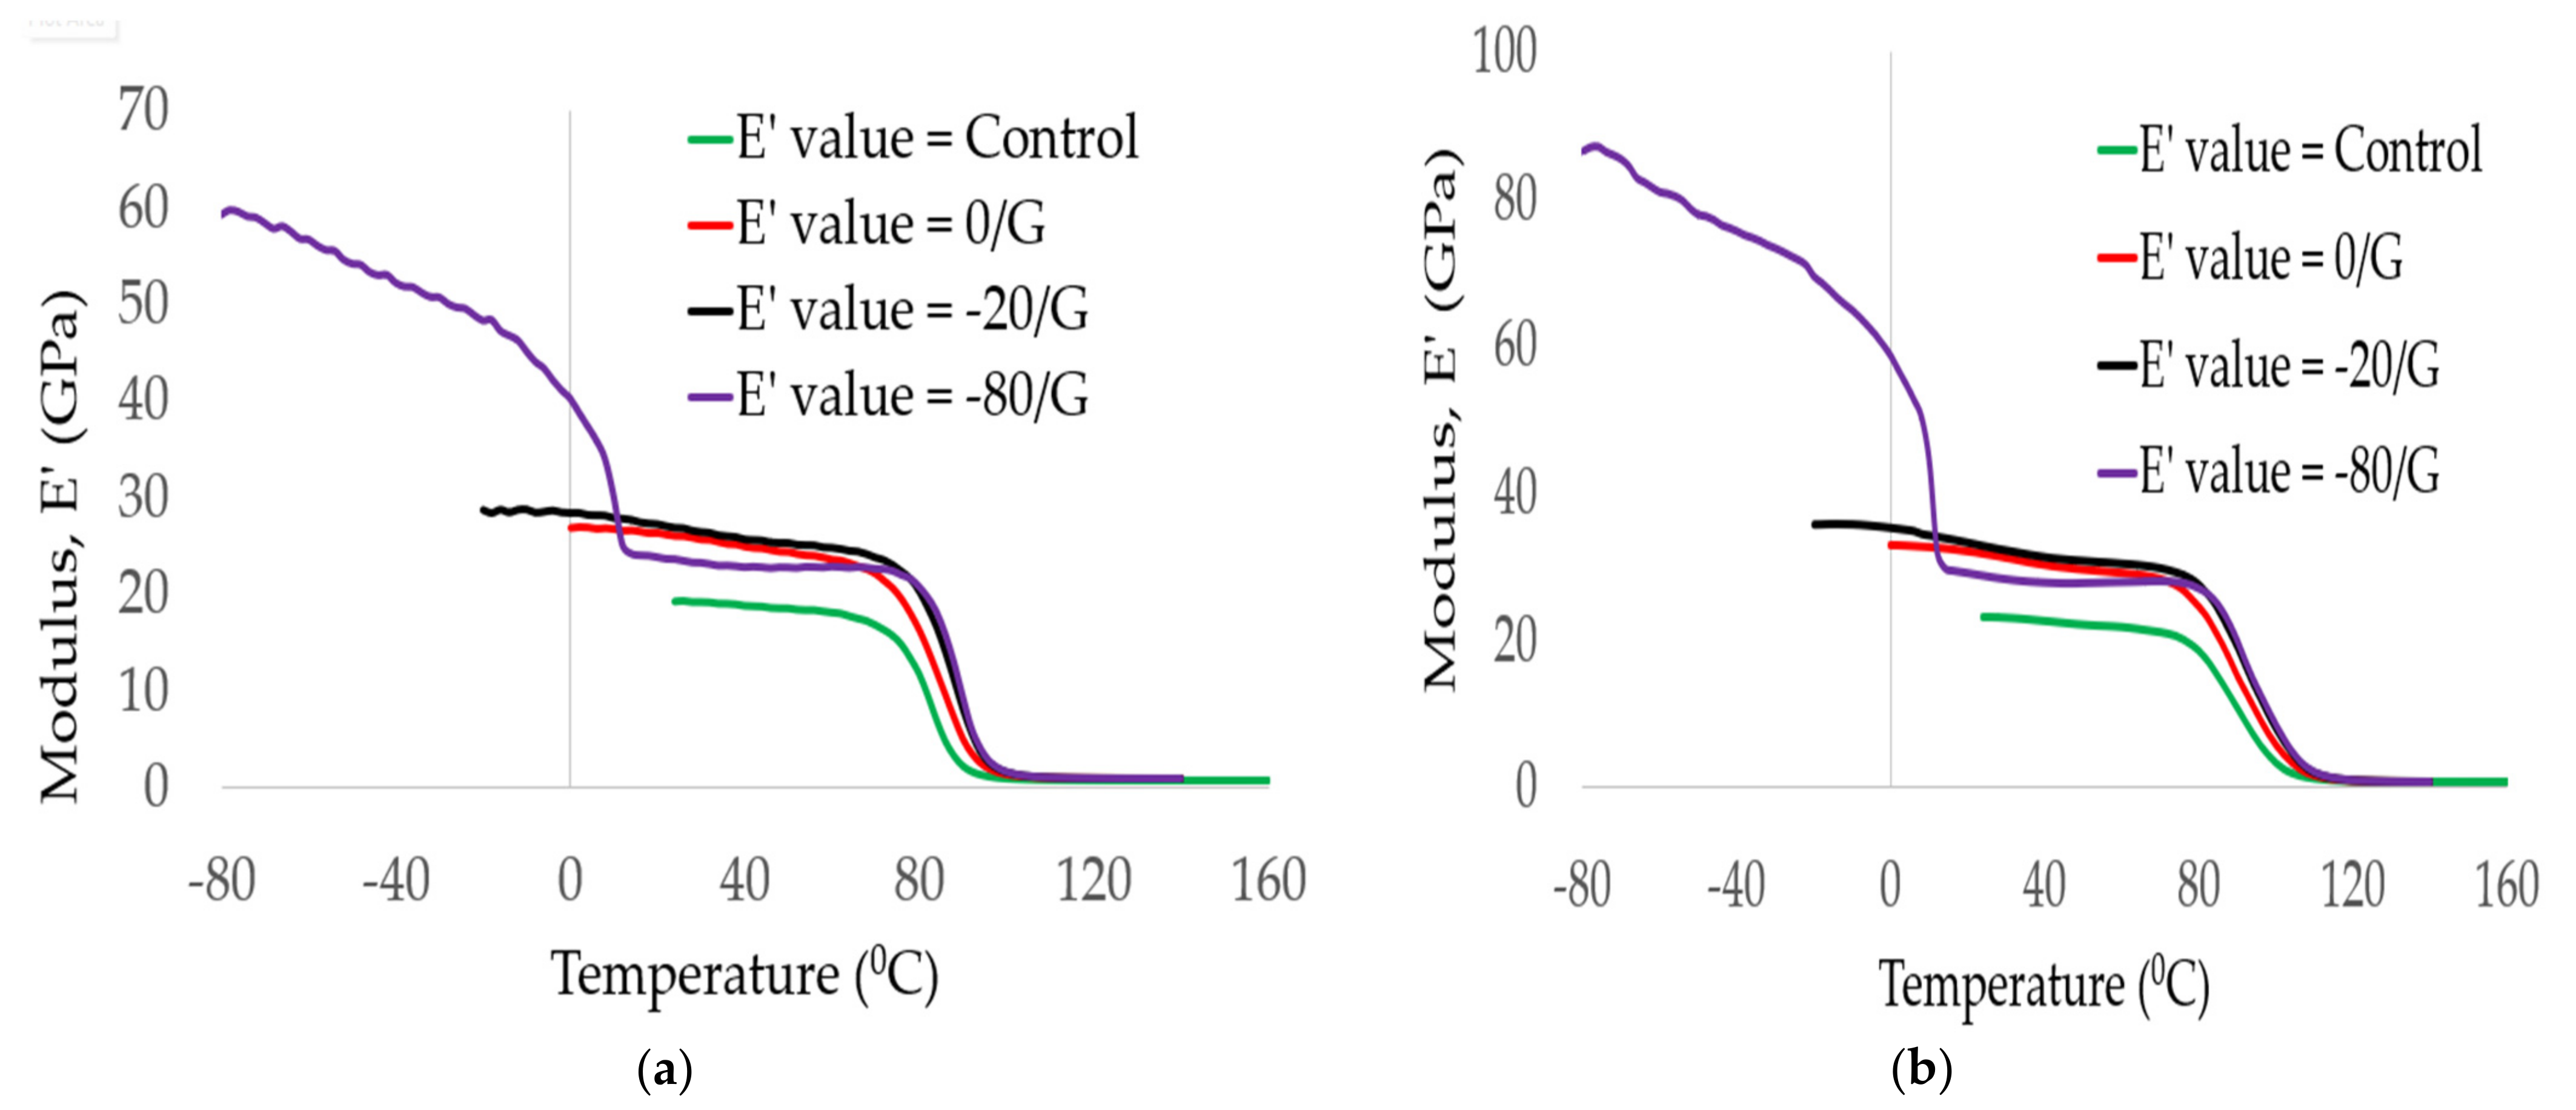
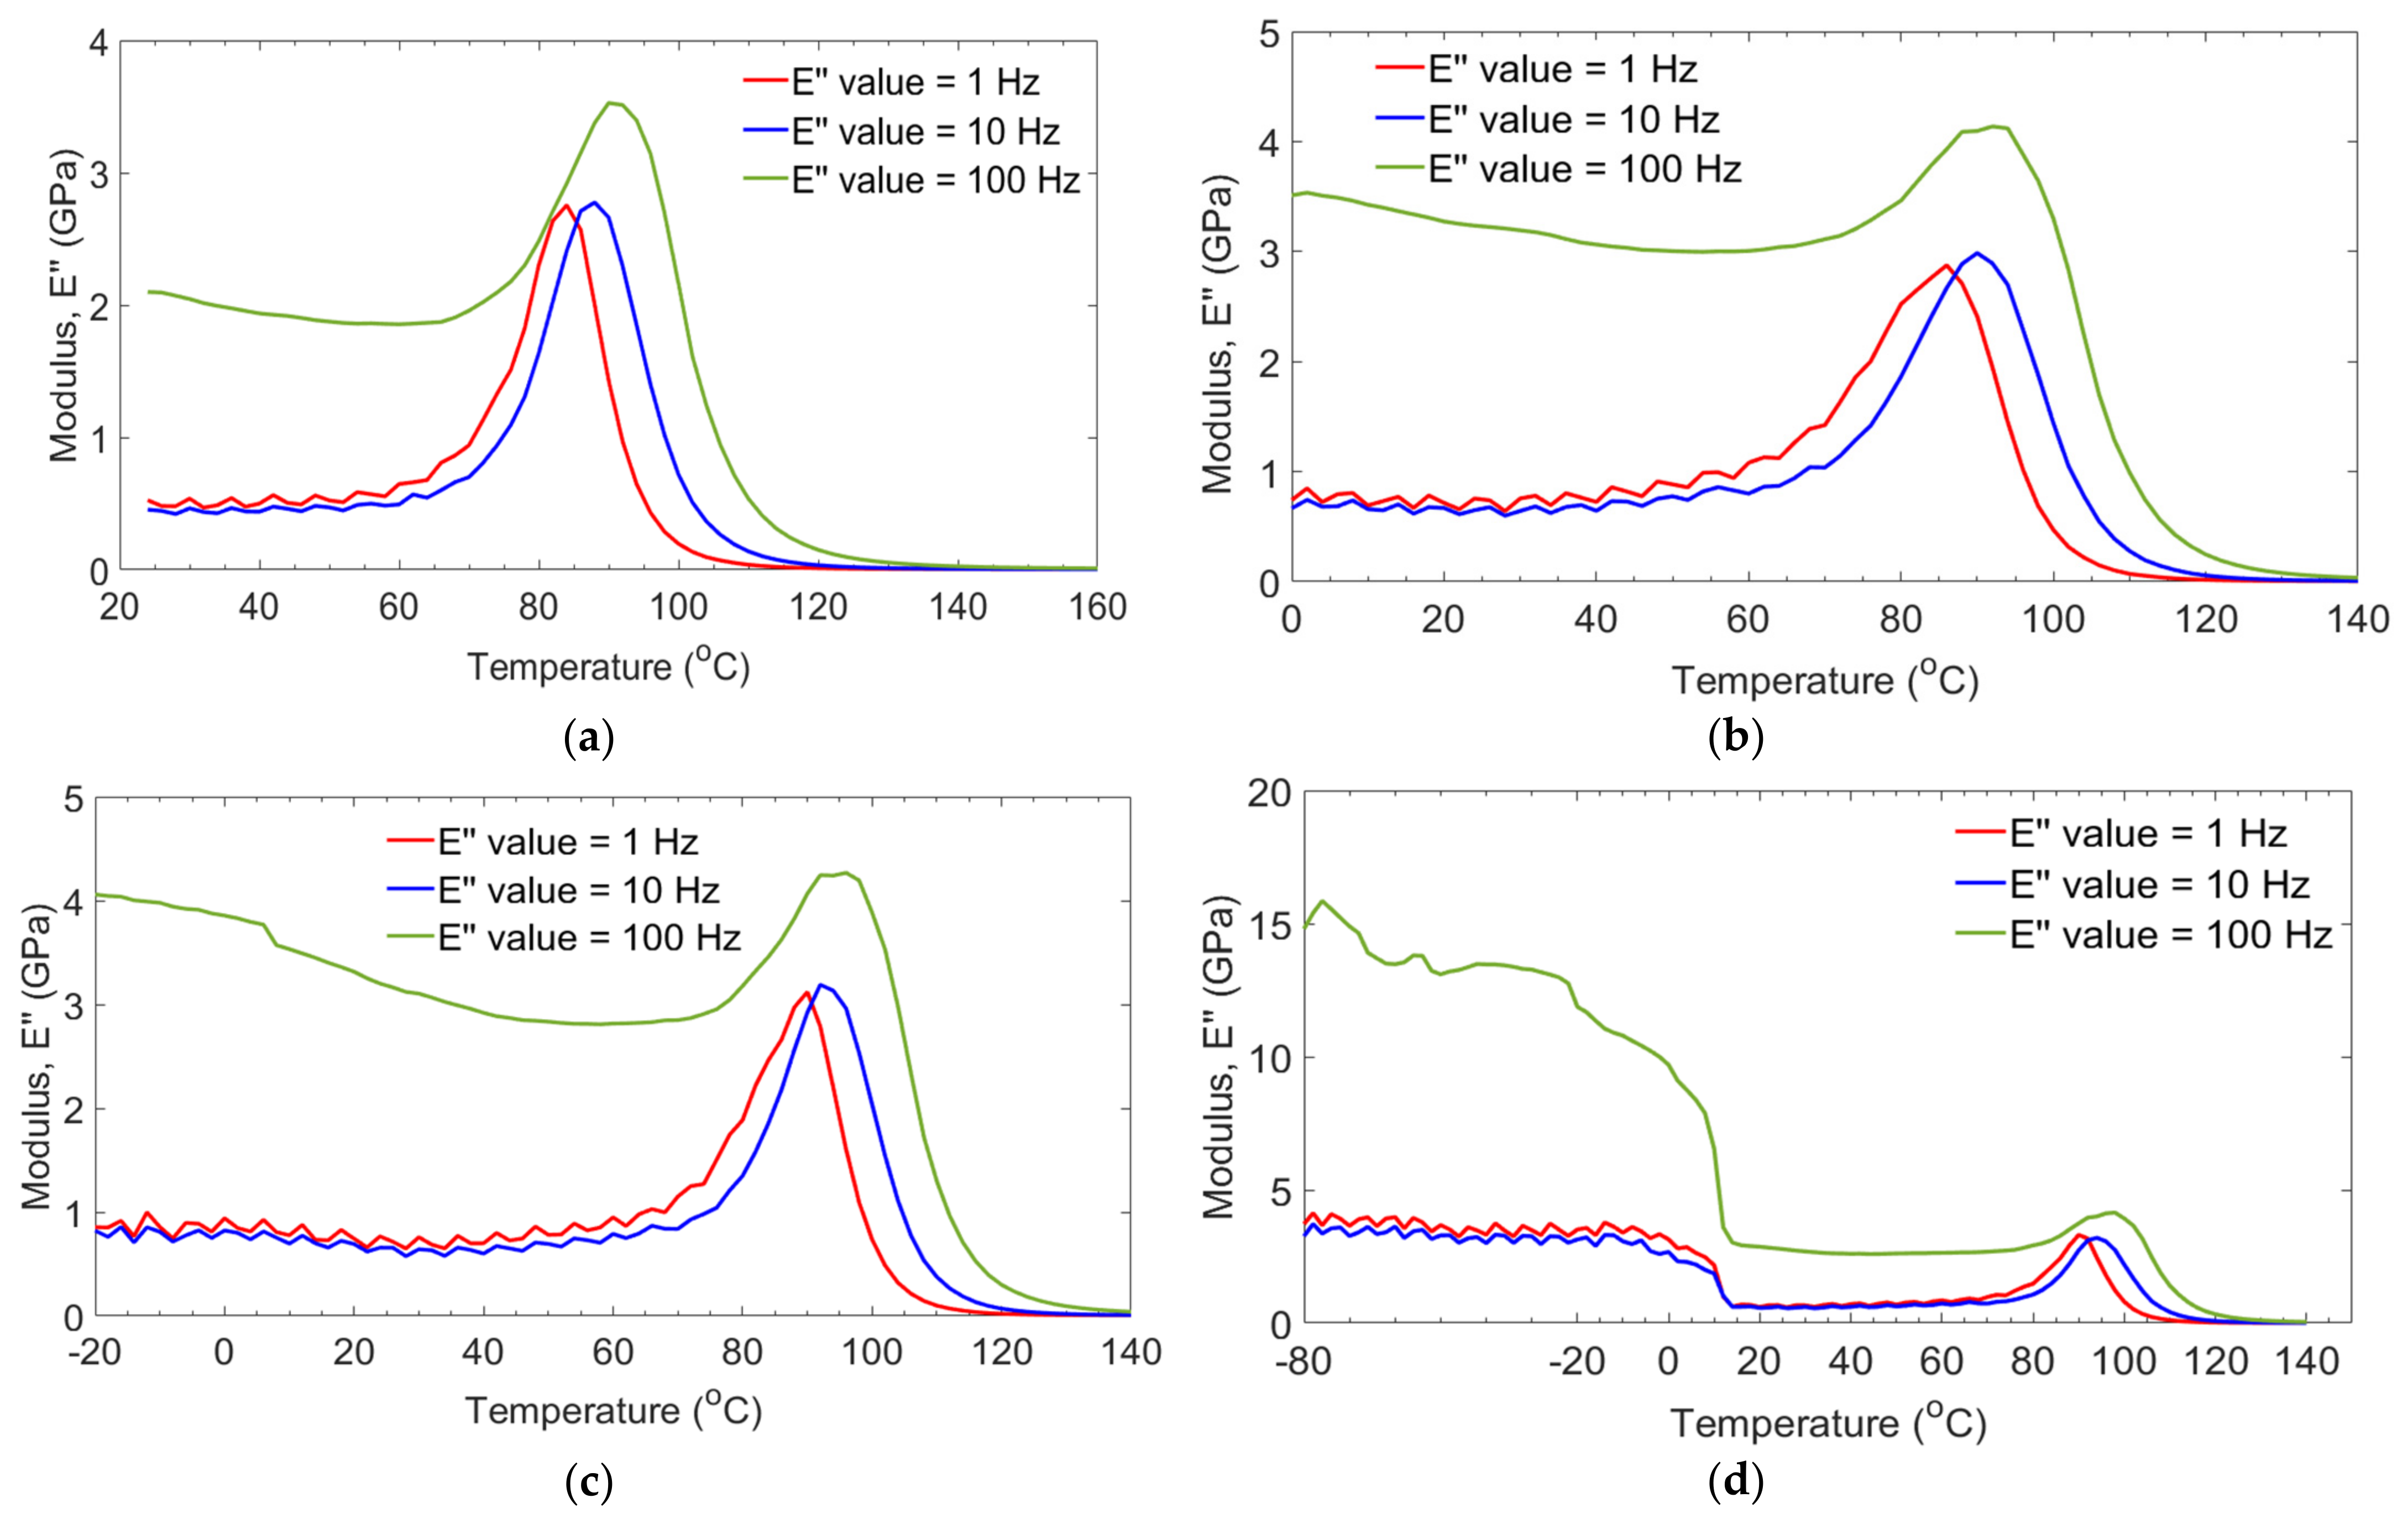
- The storage modulus of all groups of laminates decreased as the temperature increased. It happened due to the higher mobilization on the rubbery region of the epoxy resin, which lost their closed packing arrangements. The highest storage modulus values on −80/G laminate were observed on the first phase of the glassy region at 100 Hz. This first Tg occurred due to the prolonged absorption of moisture, which acts as a plasticizer for the laminates to reduce their bonds and hardness.
Author Contributions
Funding
Institutional Review Board Statement
Informed Consent Statement
Data Availability Statement
Acknowledgments
Conflicts of Interest
References
- Frigione, M.; Lettieri, M. Durability issues and challenges for material advancements in FRP employed in the construction industry. Polymers 2018, 10, 247. [Google Scholar] [CrossRef] [Green Version]
- Schutte, C.L. Environmental durability of glass-fibre composites. Mater. Sci. Eng. 1994, 13, 265–323. [Google Scholar] [CrossRef]
- Kim, B.H.; Park, Y.; You, Y.; Moon, C. Durability of GFRP Composite Exposed to Various Environmental Conditions. KSCE J. Civ. Eng. 2006, 10, 291–295. [Google Scholar] [CrossRef]
- Xu, Y.; Sun, X.; Shen, R.; Wang, Z.; Wang, Q. Thermal behavior and smoke characteristics of glass/epoxy laminate and its foam core sandwich composite. J. Therm. Anal. Calorim. 2020, 141, 1173–1182. [Google Scholar] [CrossRef]
- Scaffaro, R.; Bartolo, A.; Dintcheva, N. Matrix and filler recycling of carbon and flass fiber-reinforced polymer composites: A review. Polymers 2021, 13, 3817. [Google Scholar] [CrossRef]
- Bank, L.C.; Gentry, T.R.; Barkatt, A. Accelerated test methods to determine the long-term behavior of FRP composite structures: Environmental effects. J. Reinf. Plast. Compos. 1995, 14, 559–587. [Google Scholar] [CrossRef]
- Spagnuolo, S.; Meda, A.; Rinaldi, Z.; Nanni, A. Residual behavior of glass FRP bars subjected to high temperatures. Compos. Struct. 2018, 203, 886–893. [Google Scholar] [CrossRef]
- Bazli, M.; Abolfazli, M. Mechanical properties of fibre reinforced polymers under elevated temperatures: An overview. Polymers 2020, 12, 2600. [Google Scholar] [CrossRef]
- Robert, M.; Benmokrane, B. Behavior of GFRP Reinforcing Bars Subjected to Extreme Temperatures. J. Compos. Constr. 2010, 14, 353–360. [Google Scholar] [CrossRef]
- Ellyin, F.; Rohrbacher, C. Effect of aqueous environment and temperature on glass-fibre epoxy resin composites. J. Reinf. Plast. Compos. 2000, 19, 1405–1427. [Google Scholar] [CrossRef]
- Lundgren, J.; Gudmundson, P. Moisture absorption in glass- fibre/epoxy laminates with transverse matrix cracks. Compos. Sci. Technol. 1999, 59, 1983–1991. [Google Scholar] [CrossRef]
- Jafari, A.; Bazli, M.; Ashrafi, H.; Oskouei, A.V.; Azhari, S.; Zhao, X.L.; Gholipour, H. Effect of fibers configuration and thickness on tensile behavior of GFRP laminates subjected to elevated temperatures. Constr. Build. Mater. 2019, 202, 189–207. [Google Scholar] [CrossRef]
- Wong, P.M.H.; Davies, J.M.; Wang, Y.C. An experimental and numerical study of the behavior of glass fibre reinforced plastics (GRP) short columns at elevated temperatures. Compos. Struct. 2004, 63, 33–43. [Google Scholar] [CrossRef]
- Aklilu, G.; Adali, S.; Bright, G. Temperature effect on mechanical properties of carbon, glass and hybrid polymer composite specimens. Int. J. Eng. Res. Africa 2018, 39, 119–138. [Google Scholar] [CrossRef]
- Cadieu, L.; Kopp, J.B.; Jumel, J.; Bega, J.; Froustey, C. Temperature effect on the mechanical properties and damage mechanisms of a glass/thermoplastic laminate. J. Compos. Mater. 2019, 54, 2271–2282. [Google Scholar] [CrossRef]
- Ray, B.C. Effects of crosshead velocity and sub-zero temperature on mechanical behaviour of hygrothermally conditioned glass fibre reinforced epoxy composites. J. Compos. Mater. 2004, 379, 39–44. [Google Scholar] [CrossRef]
- Jiang, X.; Kolstein, H.; Bijlaard, F.; Qiang, X. Effects of hygrothermal aging on glass-fibre reinforced polymer laminates and adhesive of FRP composite bridge: Moisture diffusion characteristics. Compos. Part. A 2014, 57, 49–58. [Google Scholar] [CrossRef]
- Correia, J.R.; Gomes, M.M.; Pires, J.M.; Branco, F.A. Mechanical behaviour of pultruded glass fibre reinforced polymer composites at elevated temperature: Experiments and model assessment. Compos. Struct. 2013, 98, 303–313. [Google Scholar] [CrossRef]
- Rajak, D.; Wagh, P.; Linul, E. Manufacturing technologies of carbon/glass fiber-reinforced polymer composites and their properties: A review. Polymers 2021, 13, 3721. [Google Scholar] [CrossRef] [PubMed]
- Quinn, J.A. Composites, Design Manual; James Quinn Associates Ltd.: Liverpool, UK, 2000. [Google Scholar]
- ASTM D 3039; Standard Test Method for Tensile Properties of Polymer Matrix Composite Materials. ASTM International: West Conshohocken, PA, USA, 2002.
- ASTM D 3171; Standard Test Methods for Constituent Content of Composite Materials. ASTM International: West Conshohocken, PA, USA, 2000.
- Bai, Y.; Keller, T.; Vallée, T. Modeling of stiffness of FRP composites under elevated and high temperatures. Compos. Sci. Technol. 2008, 68, 3099–3106. [Google Scholar] [CrossRef]
- Ou, Y.; Zhu, D. Tensile behavior of glass fiber reinforced composite at different strain rates and temperatures. Constr. Build. Mater. 2015, 96, 648–656. [Google Scholar] [CrossRef]
- Lu, Z.; Xian, G.; Li, H. Effects of elevated temperatures on the mechanical properties of basalt fibers and BFRP plates. Constr. Build. Mater. 2015, 127, 1029–1036. [Google Scholar] [CrossRef]
- Jawaid, M.; Khalil, H.P.S.A.; Alattas, O.S. Woven hybrid biocomposites: Dynamic mechanical and thermal properties. Compos. Part A Appl. Sci. Manuf. 2012, 43, 288–293. [Google Scholar] [CrossRef]
- Korolev, A.; Mishnev, M.; Vatin, N.; Ignatova, A. Prolonged thermal relaxation of the thermosetting polymers. Polymers 2021, 13, 4104. [Google Scholar] [CrossRef] [PubMed]
- Li, H.; Xiao, R. Glass transition behavior of wet polymers. Materials 2021, 14, 730. [Google Scholar] [CrossRef]
- Bazli, M.; Ashraf, H.; Jafari, A.; Zhao, X.; Raman, S.; Bai, Y. Effect of Fibers Configuration and Thickness on Tensile Behavior of GFRP Laminates Exposed to Harsh Environment. Polymers 2019, 11, 1401. [Google Scholar] [CrossRef] [PubMed] [Green Version]
- Gibson, A.G.; Wu, Y.S.; Evans, J.T. Laminate theory analysis of composites under load in fire. J. Compos. Mater. 2006, 40, 639–658. [Google Scholar] [CrossRef]
- Gu, P.; Asaro, R.J. Structural buckling of polymer matrix composites due to reduced stiffness from fire damage. Compos. Struct. 2005, 69, 65–75. [Google Scholar] [CrossRef]
- Mahieux, C.A.; Reifsnider, K.L. Property modeling across transition temperatures in polymers: Application to thermoplastic systems. J. Mater. Sci. 2002, 7, 911–920. [Google Scholar] [CrossRef]
- Bai, Y.; Keller, T. Modeling of Strength Degradation for Fiber-reinforced Polymer Composites in Fire. J Mater. Sci. 2009, 43, 2371–2384. [Google Scholar] [CrossRef]


| Materials | Stiffness [GPa] | Tensile Strength [MPa] | Density [kg/m3] | Poisson’s Ratio |
|---|---|---|---|---|
| E-glass | 72.5 | 2350 | 2570 | 0.25 |
| Epoxy resin | 3.3 | 69.9 | 1020 | 0.36 |
| Designation of GFRP Laminates | Values | R Values | Compressive Strength (MPa) | Standard Deviation and Coefficient of Variation | |
|---|---|---|---|---|---|
| −80/G | 451.93 | 38.37 | 97.91% | 443.19 | (24.15, 5.45%) |
| −20/G | 453.74 | 39.50 | 97.78% | 445.68 | (23.07, 5.18%) |
| 0/G | 547.78 | 29.69 | 97.85% | 536.77 | (24.36, 4.54%) |
| 25/G | 458.36 | 14.65 | 98.16% | 444.04 | (48.08, 10.83%) |
| 50/G | 352.83 | 19.36 | 98.04% | 342.52 | (18.92, 5.52%) |
| 75/G | 161.82 | 27.40 | 97.78% | 159.77 | (9.24, 5.78%) |
| 100/G | 30.12 | 17.85 | 98.14% | 29.10 | (2.02, 6.94%) |
| Designation of GFRP Laminates | Values | R Values | Tensile Strength (MPa) | Standard Deviation and Coefficient of Variation (Tensile) | Tensile Modulus (GPa) | Standard Deviation and Coefficient of Variation (Modulus) | |
|---|---|---|---|---|---|---|---|
| −80/G | 467.79 | 23.65 | 97.94% | 456.16 | (28.22, 6.19%) | 26.36 | (1.09, 4.14%) |
| −20/G | 518.40 | 18.56 | 98.04% | 503.25 | (39.71, 7.89%) | 28.17 | (1.95, 6.92%) |
| 0/G | 538.24 | 20.69 | 98.01% | 525.16 | (33.45, 6.37%) | 29.73 | (1.78, 5.99%) |
| 25/G | 431.16 | 10.75 | 98.35% | 412.60 | (55.01, 3.33%) | 23.73 | (2.33, 9.81%) |
| 50/G | 352.51 | 19.53 | 98.07% | 342.52 | (18.92, 5.52%) | 19.51 | (1.06, 5.43%) |
| 75/G | 159.35 | 17.16 | 98.09% | 154.69 | (12.64, 8.17%) | 9.00 | (0.53, 5.89%) |
| 100/G | 31.89 | 17.61 | 98.01% | 30.95 | (2.28, 7.37%) | 2.58 | (0.29, 1.24%) |
| Glass/Epoxy Laminates | (GPa) | (°C) | (°C) | |||||
|---|---|---|---|---|---|---|---|---|
| GE (1 Hz) | 19.22 | 11.73 | 0.54 | 2.76 | 0.635 | 90 | 80 | 84 |
| GE (10 Hz) | 19.29 | 12.89 | 0.45 | 2.78 | 0.636 | 96 | 82 | 88 |
| GE (100 Hz) | 23.05 | 15.76 | 2.09 | 3.53 | 0.658 | 100 | 84 | 90 |
| 0/G (1 Hz) | 26.84 | 14.12 | 0.85 | 2.88 | 0.596 | 94 | 82 | 86 |
| 0/G (10 Hz) | 26.88 | 15.60 | 0.74 | 2.99 | 0.613 | 98 | 84 | 90 |
| 0/G (100 Hz) | 33.02 | 21.54 | 3.52 | 4.14 | 0.645 | 106 | 84 | 92 |
| −20/G (1 Hz) | 28.74 | 18.57 | 0.92 | 2.97 | 0.639 | 96 | 82 | 88 |
| −20/G (10 Hz) | 28.82 | 17.41 | 0.82 | 3.19 | 0.632 | 102 | 86 | 92 |
| −20/G (100 Hz) | 35.89 | 23.20 | 4.06 | 4.27 | 0.660 | 106 | 86 | 96 |
| −80/G (1 Hz) | 59.78 | 15.87 | 4.13 | 3.31 | 0.659 | 96 | 86 | 90 |
| −80/G (10 Hz) | 59.88 | 18.60 | 3.72 | 3.20 | 0.645 | 102 | 86 | 94 |
| −80/G (100 Hz) | 87.00 | 22.20 | 15.85 | 4.15 | 0.662 | 108 | 88 | 98 |
| Source of Variation | SS | df | MS | F | p-Value | F Crit |
|---|---|---|---|---|---|---|
| Between Groups | 1,002,600.17 | 6 | 167,100.03 | 512.11 | 2.45 | |
| Within Groups | 9136.4 | 28 | 326.3 | |||
| Total | 1,011,736.57 | 34 |
| Source of Variation | SS | df | MS | F | p-Value | F Crit |
|---|---|---|---|---|---|---|
| Between Groups | 1,047,489.77 | 6 | 174,581.63 | 209.08 | 2.44 | |
| Within Groups | 23,379.2 | 28 | 834.97 | |||
| Total | 1,070,868.97 | 34 |
| Frequency | Coefficient | GE (control) | 0/G | −20/G | −80/G |
|---|---|---|---|---|---|
| 1 Hz | Pu (GPa) | 19.22 | 26.84 | 28.79 | 59.00 |
| Pr (GPa) | 1.16 | 1.25 | 1.15 | 1.17 | |
| k | 0.1 | 0.061 | 0.062 | 0.004 | |
| T’ | 80 | 82 | 82 | 86 | |
| R | 0.9982 | 0.9959 | 0.9911 | 0.9761 | |
| 10 Hz | Pu (GPa) | 19.29 | 26.88 | 28.87 | 59.88 |
| Pr (GPa) | 1.08 | 1.25 | 1.17 | 1.21 | |
| k | 0.089 | 0.059 | 0.072 | 0.0059 | |
| T’ | 82 | 84 | 86 | 86 | |
| R | 0.9953 | 0.9956 | 0.9934 | 0.9718 | |
| 100 Hz | Pu (GPa) | 23.05 | 32.96 | 35.89 | 87.00 |
| Pr (GPa) | 1.20 | 1.14 | 1.15 | 1.19 | |
| k | 0.094 | 0.062 | 0.060 | 0.0056 | |
| T′ | 86 | 84 | 86 | 88 | |
| R | 0.9960 | 0.9904 | 0.9871 | 0.9625 |
Publisher’s Note: MDPI stays neutral with regard to jurisdictional claims in published maps and institutional affiliations. |
© 2022 by the authors. Licensee MDPI, Basel, Switzerland. This article is an open access article distributed under the terms and conditions of the Creative Commons Attribution (CC BY) license (https://creativecommons.org/licenses/by/4.0/).
Share and Cite
Tefera, G.; Adali, S.; Bright, G. Mechanical Behavior of GFRP Laminates Exposed to Thermal and Moist Environmental Conditions: Experimental and Model Assessment. Polymers 2022, 14, 1523. https://doi.org/10.3390/polym14081523
Tefera G, Adali S, Bright G. Mechanical Behavior of GFRP Laminates Exposed to Thermal and Moist Environmental Conditions: Experimental and Model Assessment. Polymers. 2022; 14(8):1523. https://doi.org/10.3390/polym14081523
Chicago/Turabian StyleTefera, Getahun, Sarp Adali, and Glen Bright. 2022. "Mechanical Behavior of GFRP Laminates Exposed to Thermal and Moist Environmental Conditions: Experimental and Model Assessment" Polymers 14, no. 8: 1523. https://doi.org/10.3390/polym14081523
APA StyleTefera, G., Adali, S., & Bright, G. (2022). Mechanical Behavior of GFRP Laminates Exposed to Thermal and Moist Environmental Conditions: Experimental and Model Assessment. Polymers, 14(8), 1523. https://doi.org/10.3390/polym14081523