
Effect of Hybridization and Ply Waviness on the Flexural Strength of Polymer Composites: An Experimental and Numerical Study


Abstract
:
1. Introduction
2. Experimental Methodology
2.1. Materials and Design of Experiments
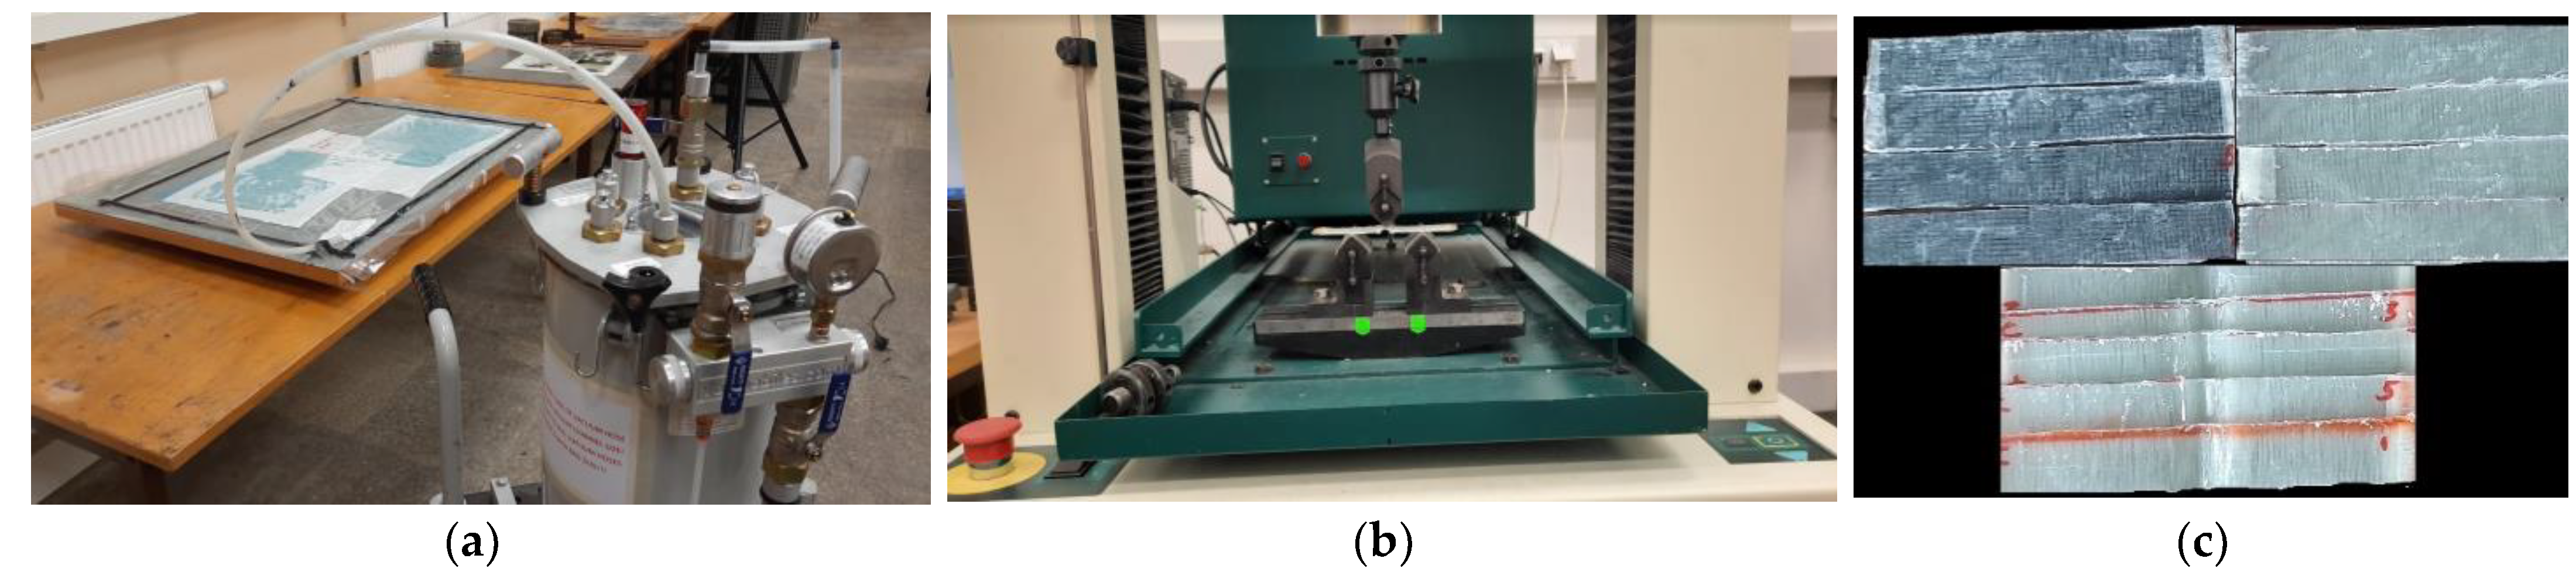
2.2. Fabrication of Fibre/Resin Laminate Composites and the Flexural Test
2.3. Determination of Ductility of Specimens Subjected to Flexural Loading
2.4. Numerical Analysis of the Flexural Behaviour of All the Architectures Currently Studied
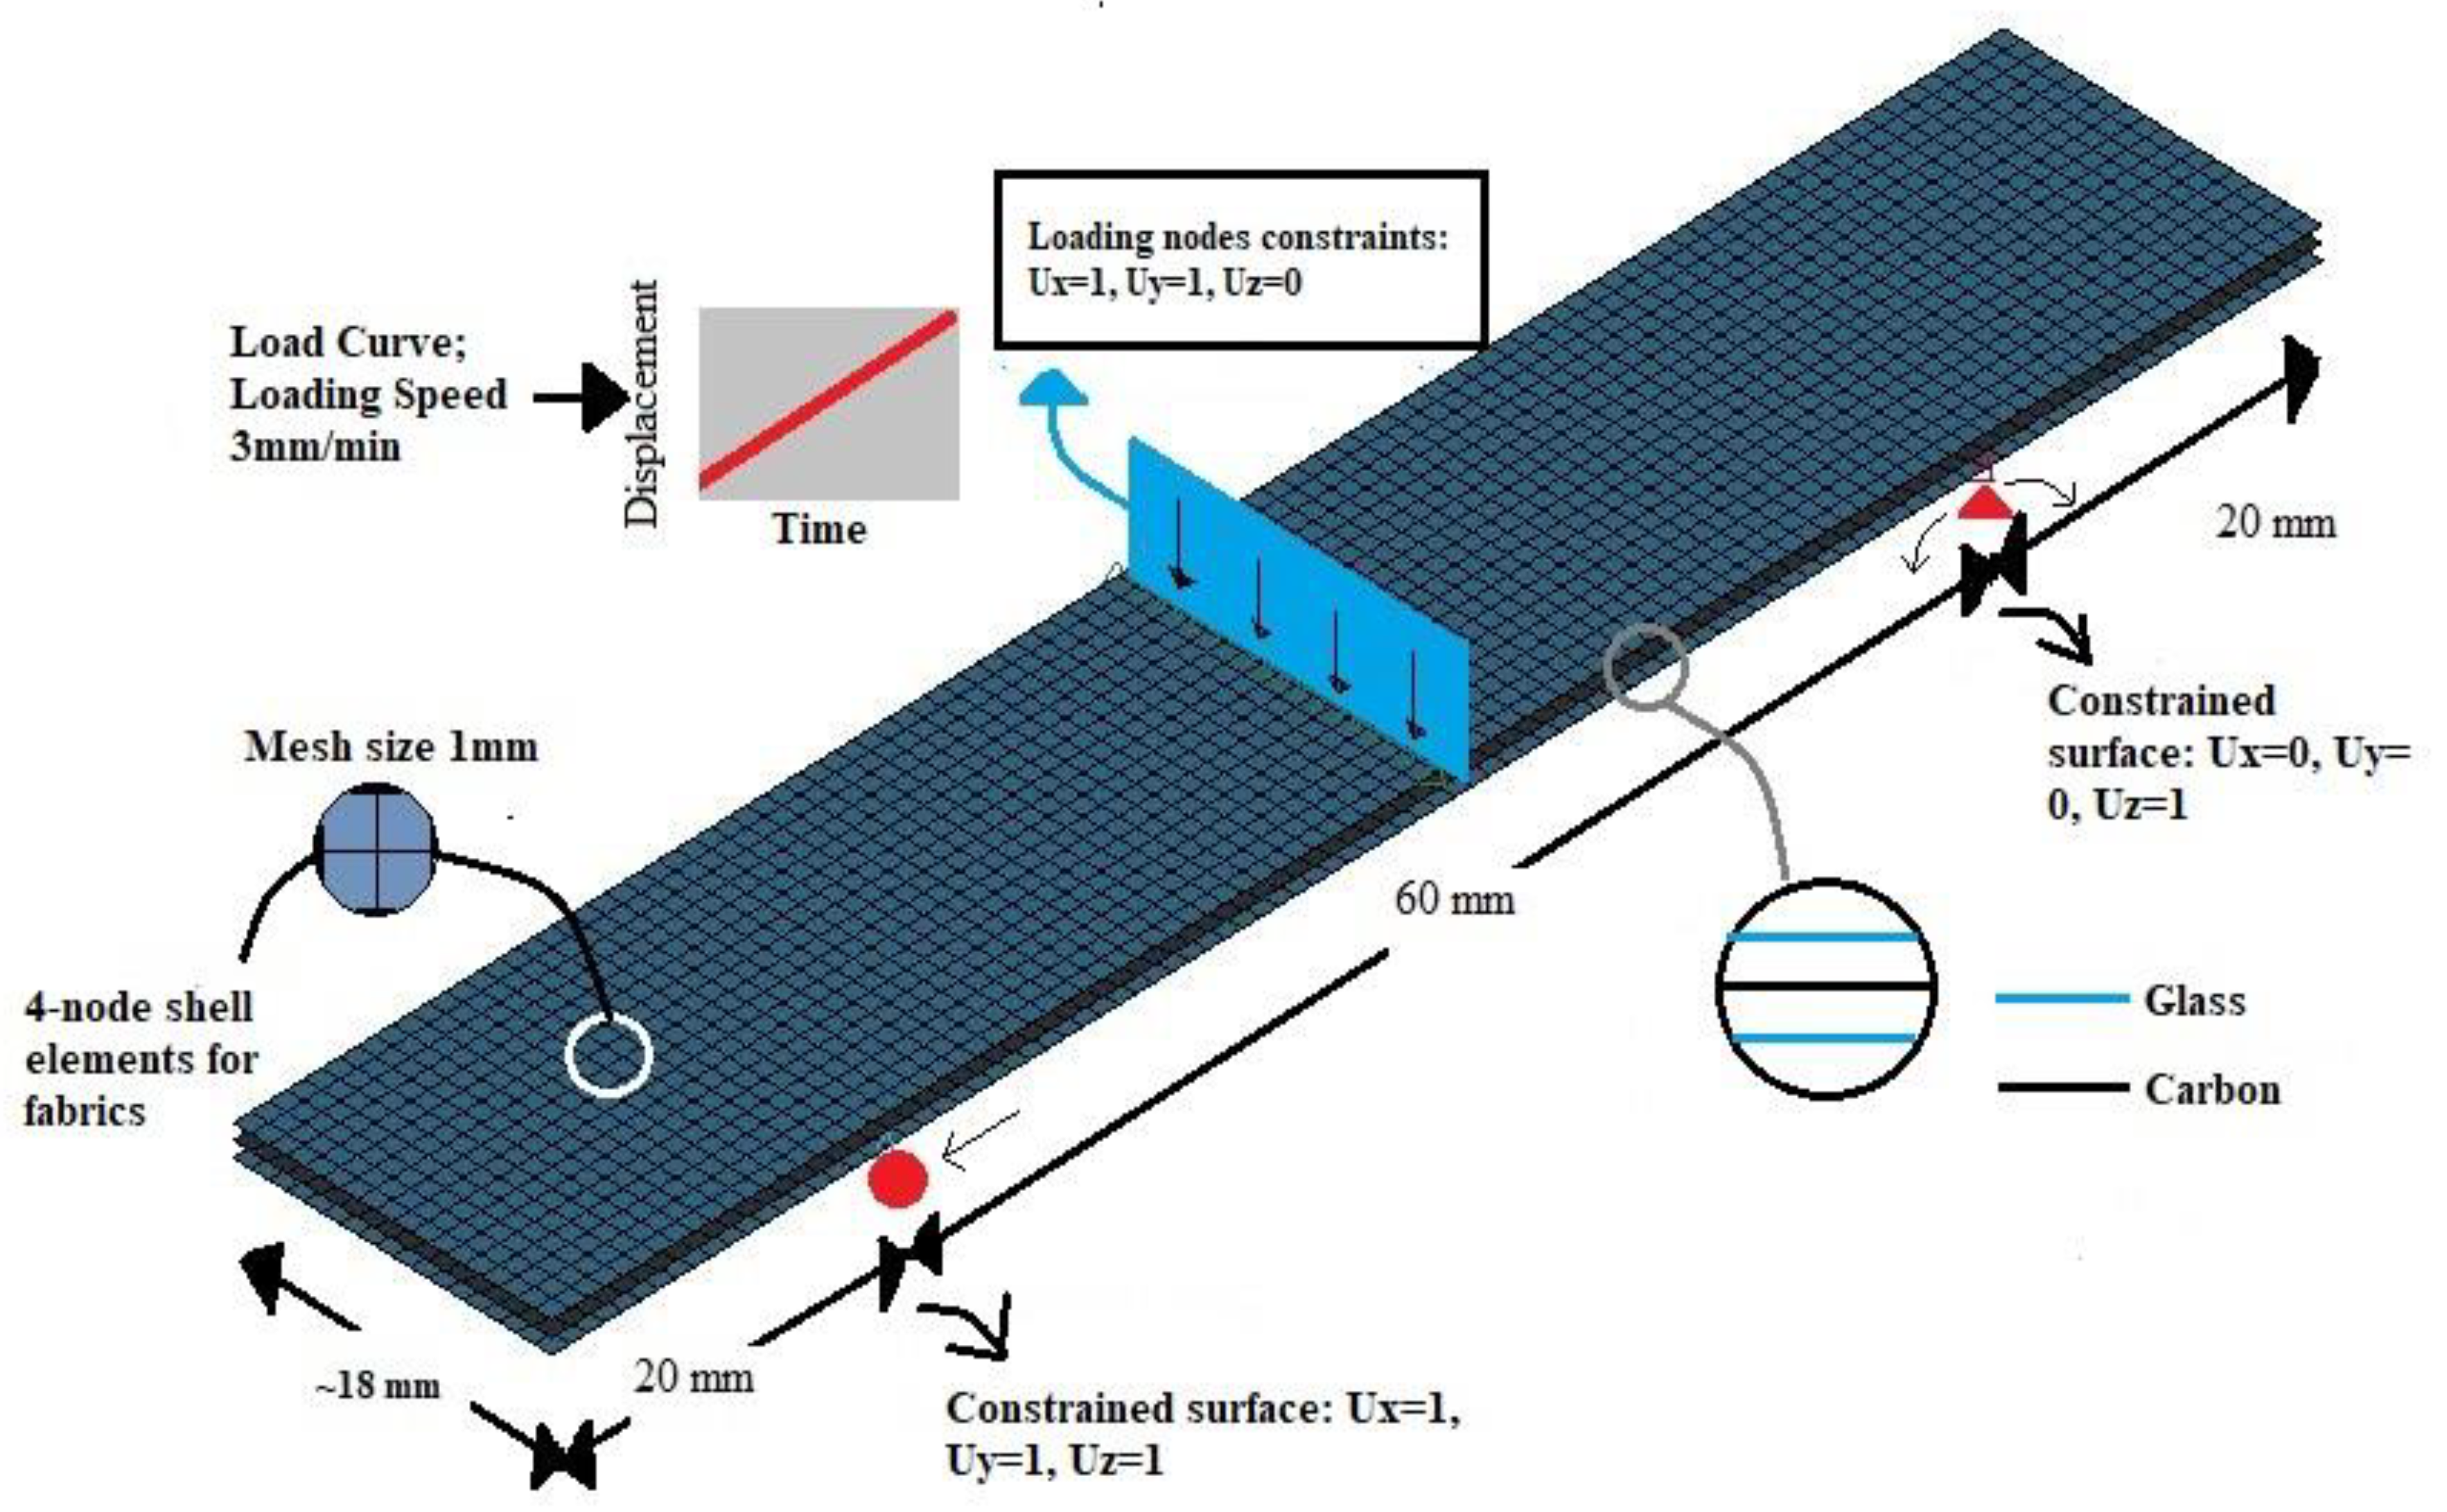
- The composite plies were modelled using 4 Node Shell formulation, available in the LS DYNA Shape Mesher library. The mesh size (mesh type: square) was kept constant at 1 mm throughout the modelling. The size of the specimens was as per the ISO standard mentioned in Section 3.2. The number of layers in the model is as per Table 1. Regarding the boundary conditions, the specimens were constrained as a pin and roller [54] support. This implies a completely constrained motion in the z-direction and free in the y-direction (along the width), while in the x-direction (along the length), the specimens were fixed at one end and were allowed a translation motion at the other end.
- On defining the loading conditions, initially, a set of nodes on which the load would be applied were defined using the Boundary_SPC_SET option. Later, the loading curve was defined based on the actual experimental loading conditions, and the curve was assigned to the nodes through the option Boundary_Prescribed_Motion_Set.
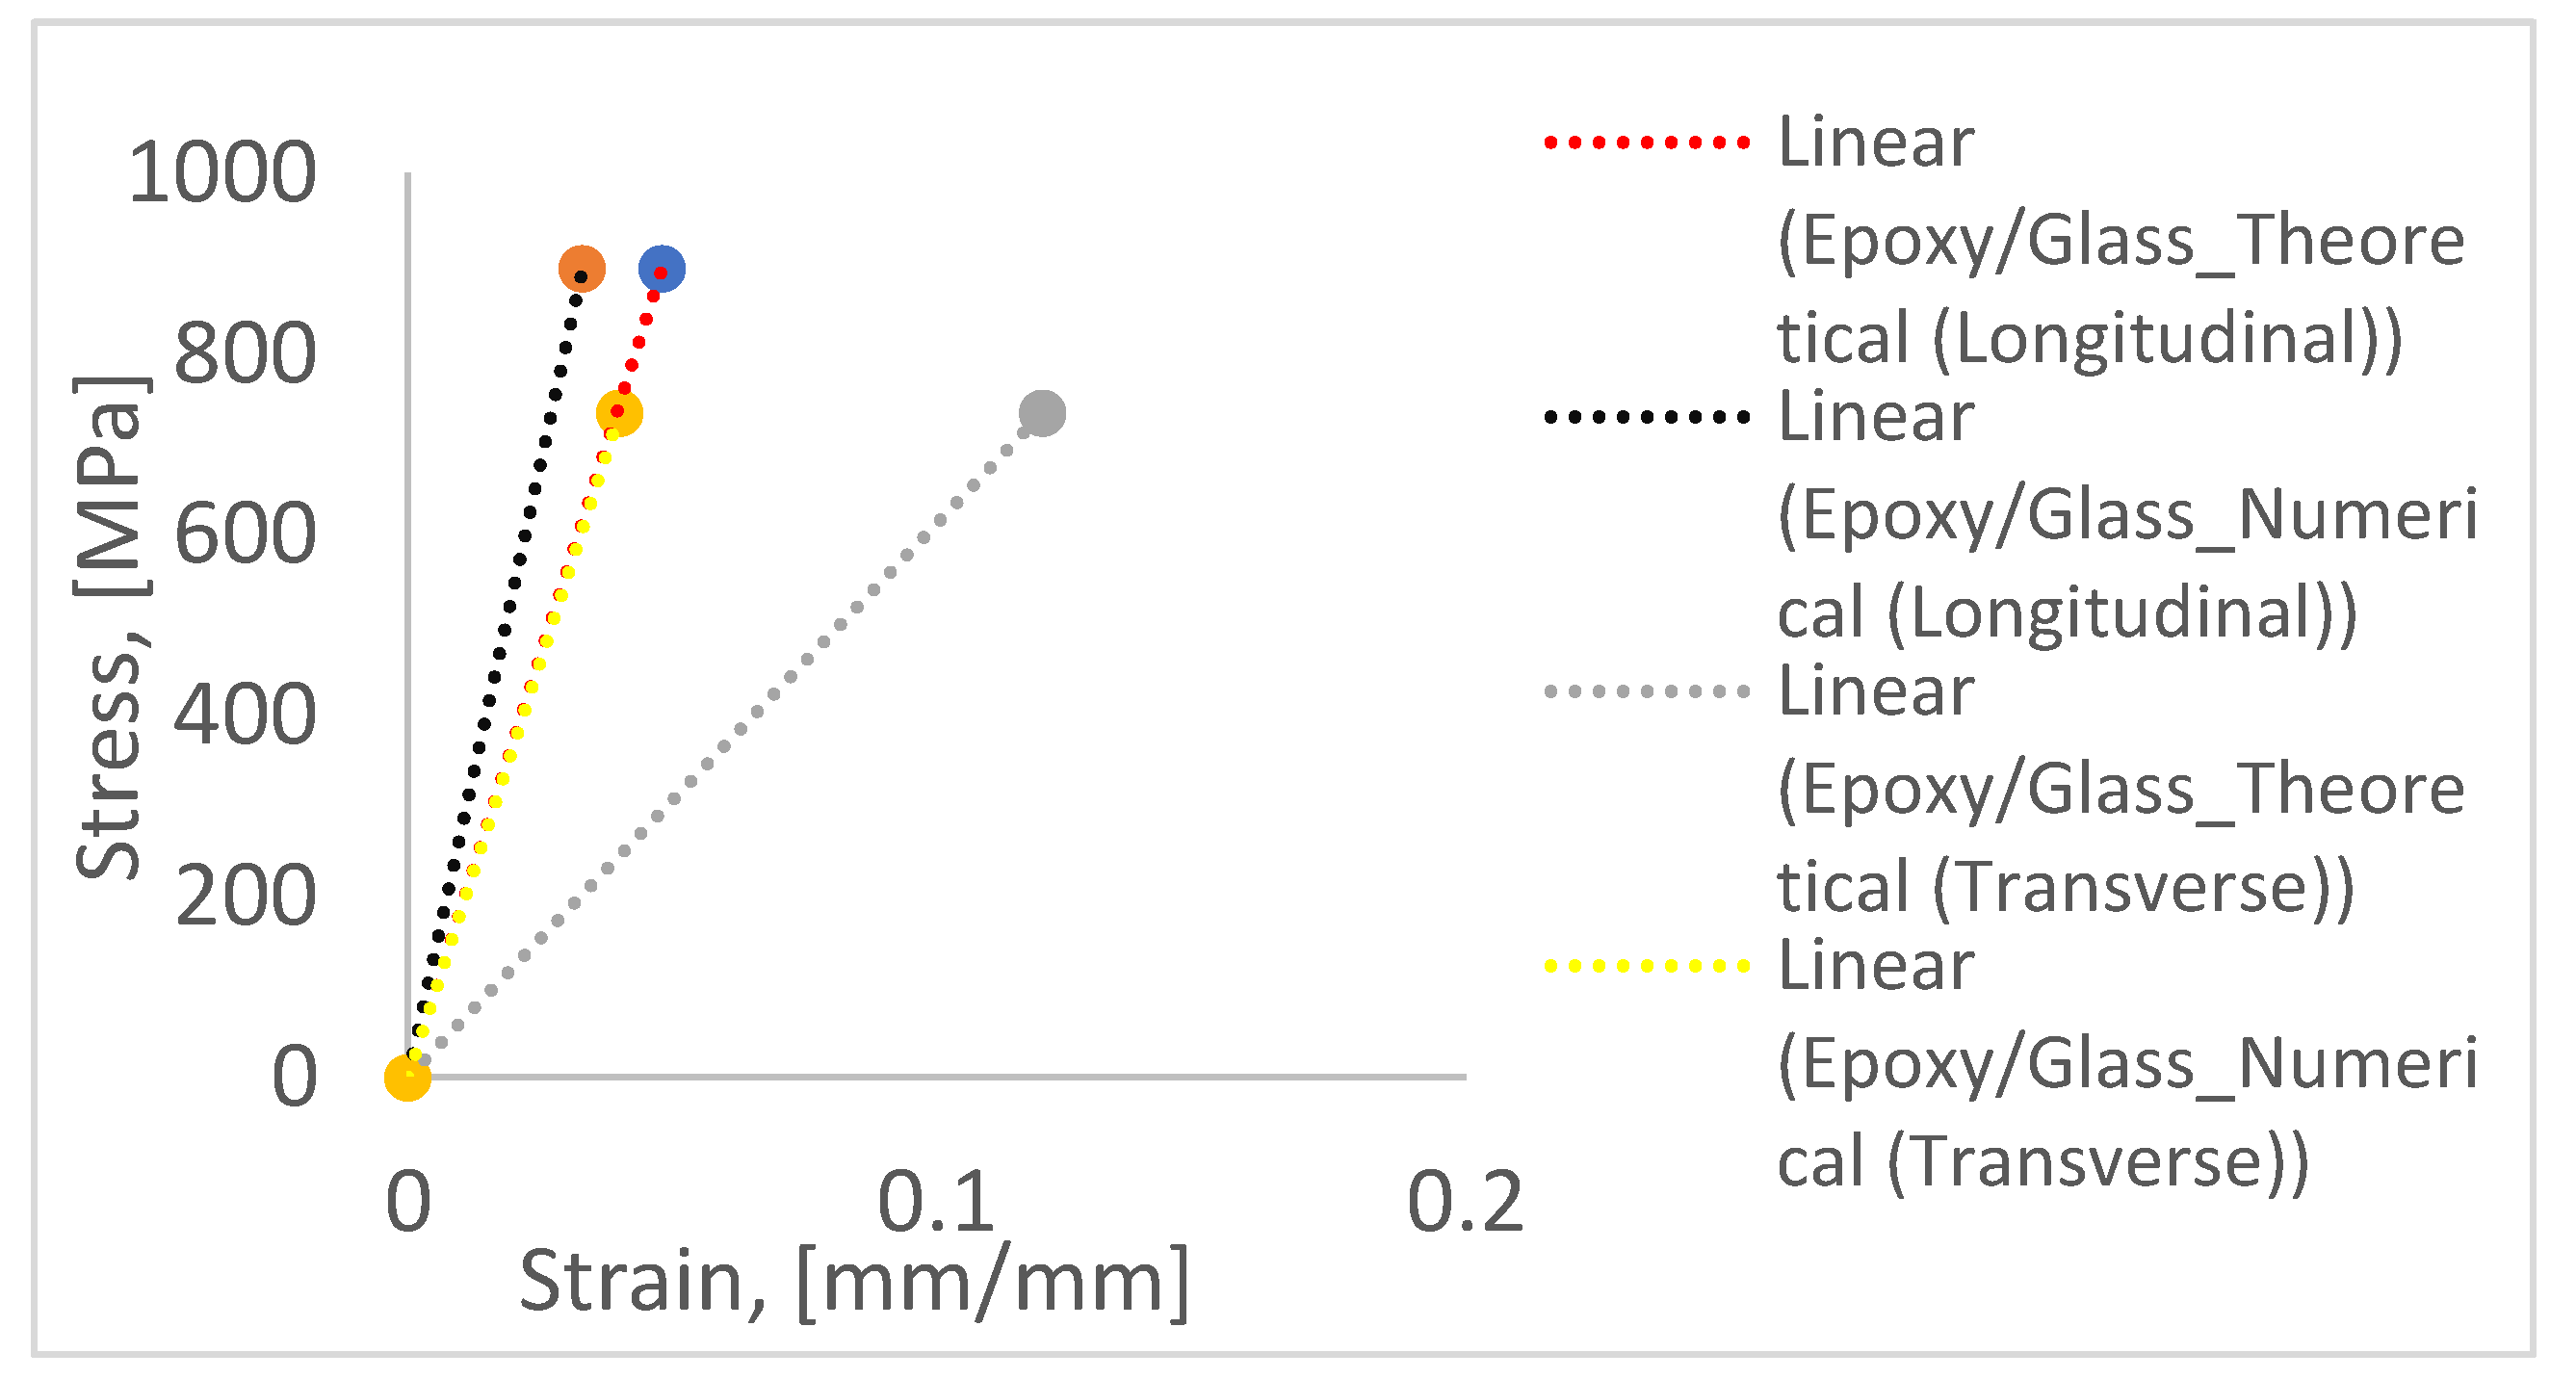
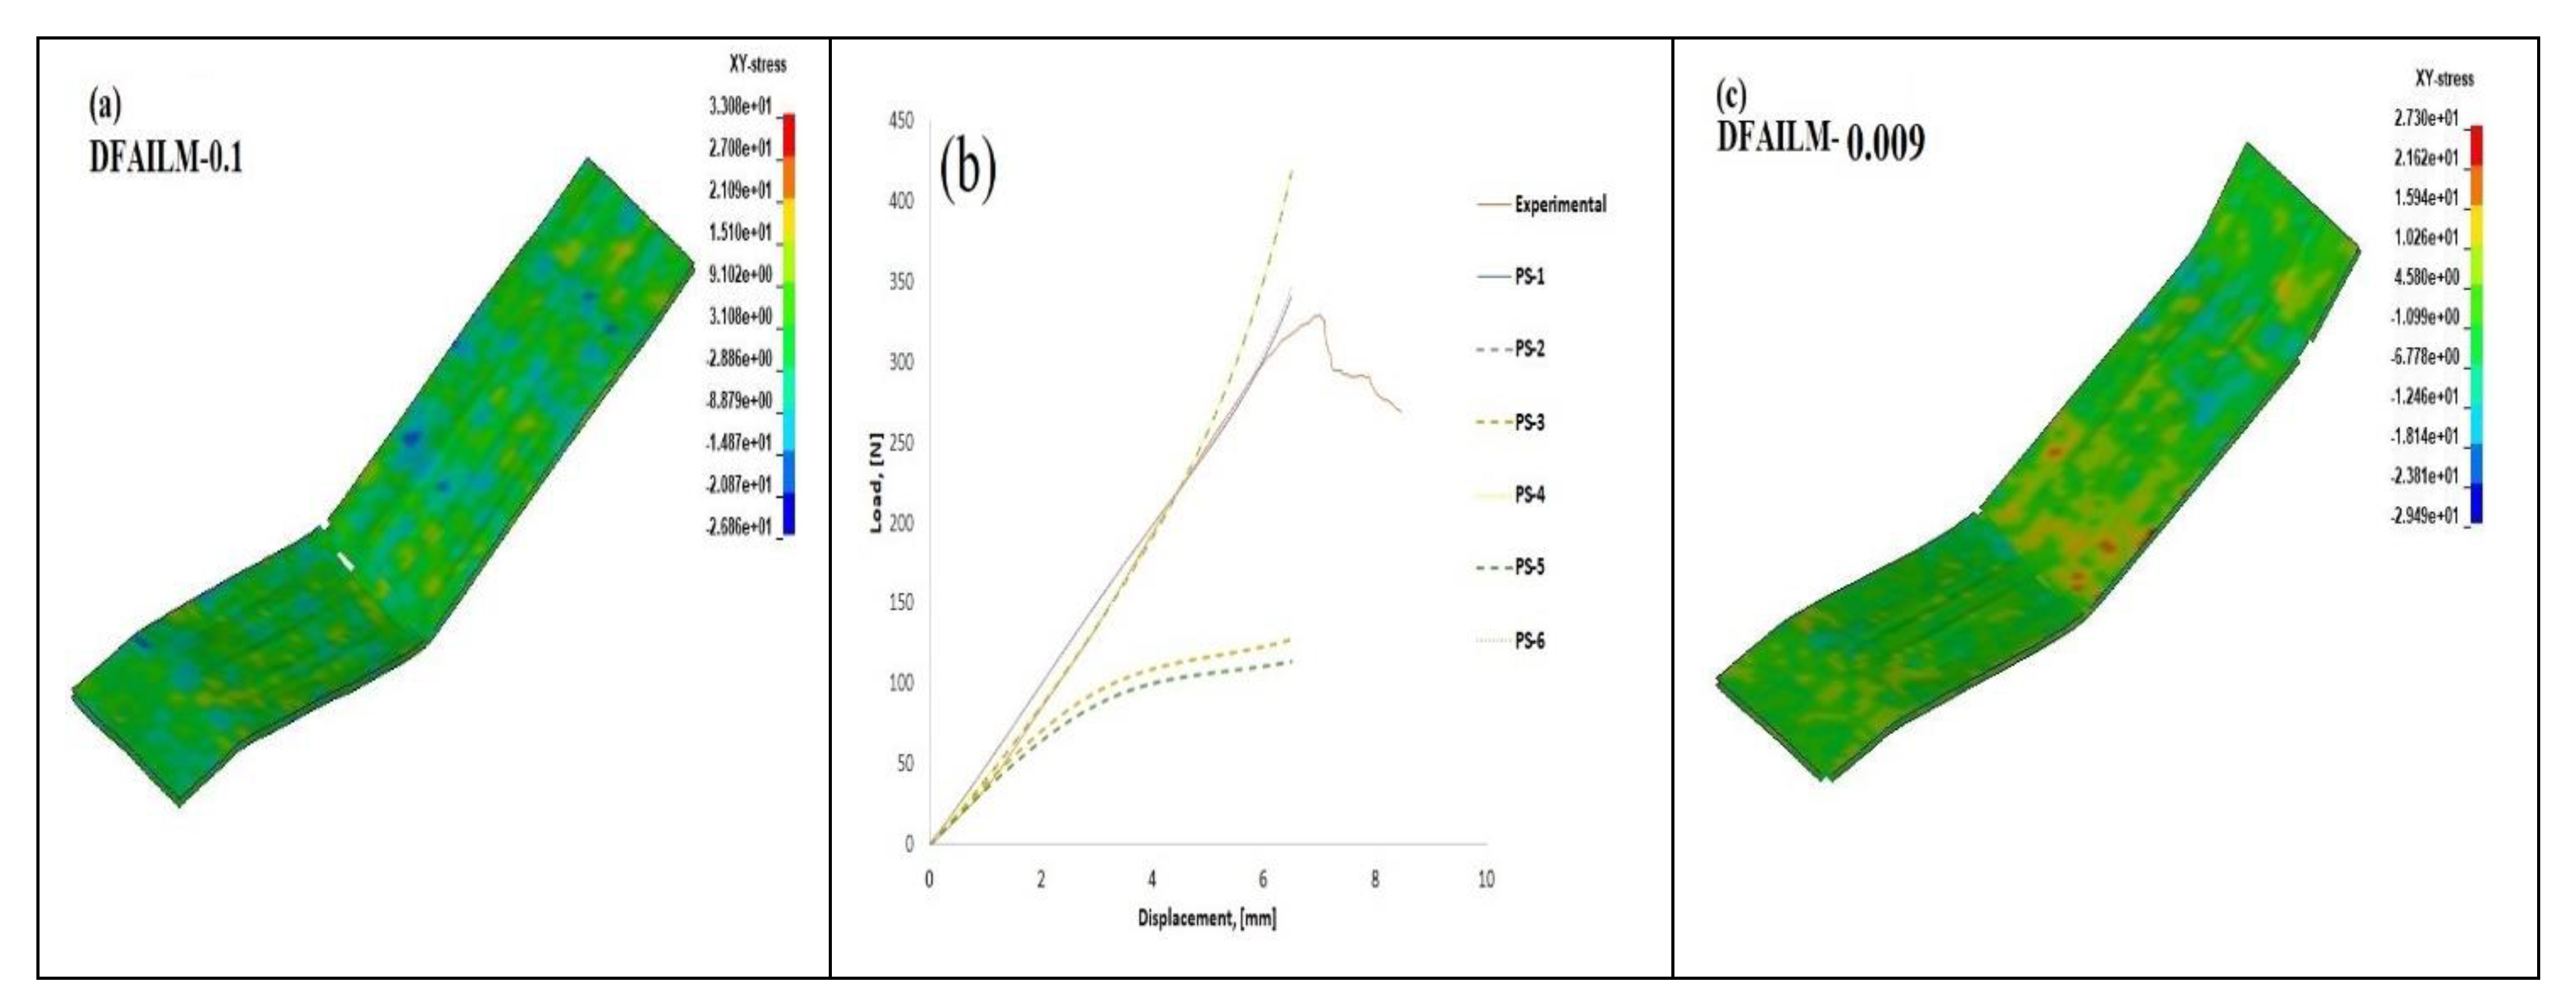
- The composite failure was modelled using the material model MAT 54, which is a progressive failure model that uses the Chang–Chang failure criterion [55]. The model takes in 21 parameters that should be defined, 15 of which are physically based and 6 of which are numerical parameters. Among the 15 physical parameters, 10 are material constants; these are elaborated in Table 2. The remaining 5 parameters are tensile and compressive failure strain in fibre directions, the matrix and shear failure strains, and the effective failure strain. The 6numerical parameters were set at their default values. By conducting a parametric, study it was inferred that only DFAILT and DFAILM (DFAILT-Max strain for fibre tension, DFAILM-Max strain for matrix straining in tension and compression) needed to be adjusted. These terms and their explanations can be found in [51]. Adjusting the above two parameters helps simulate the tension/compression within the matrix between layers and the tension of fibres along the bottom of the specimen [51].
3. Results and Discussion
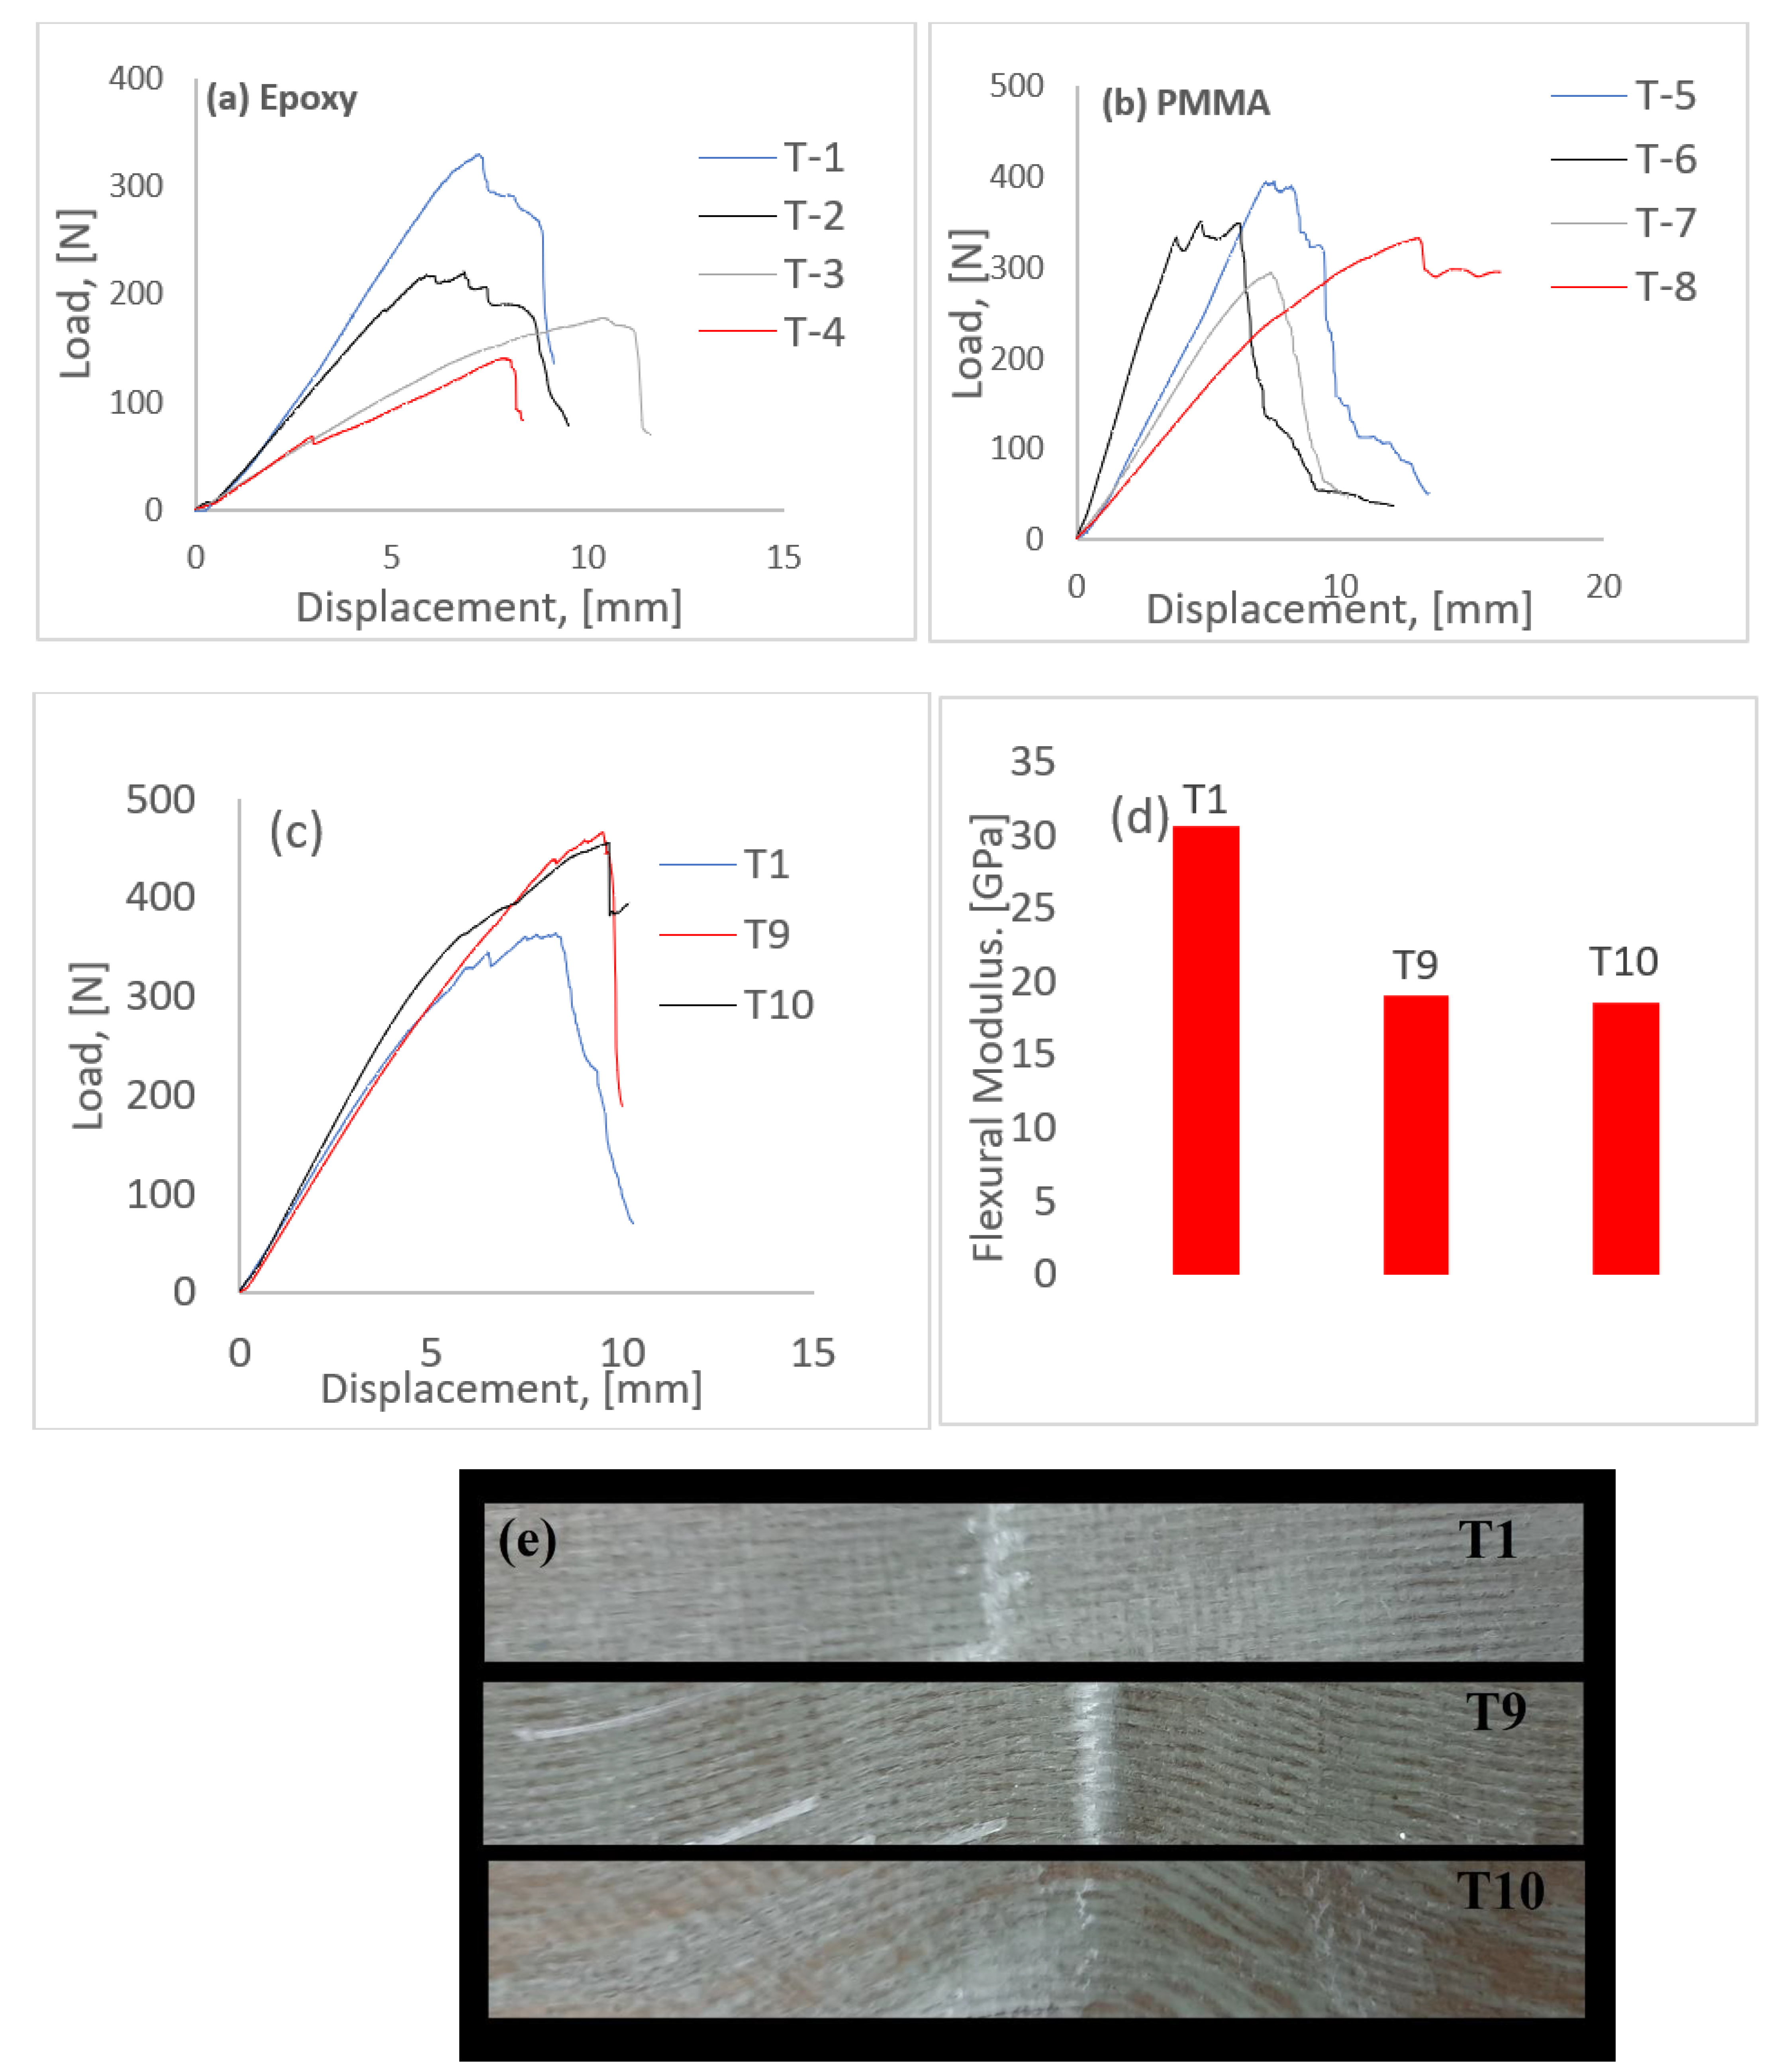
3.1. Flexural Characteristics of Composite Specimens: Pure, Hybrid, and with Waviness
3.2. Energy Absorption and Estimation of Ductility Index of Samples under Flexure
3.3. Analysis of Damage in the Composite Architecture Subjected to External Loading
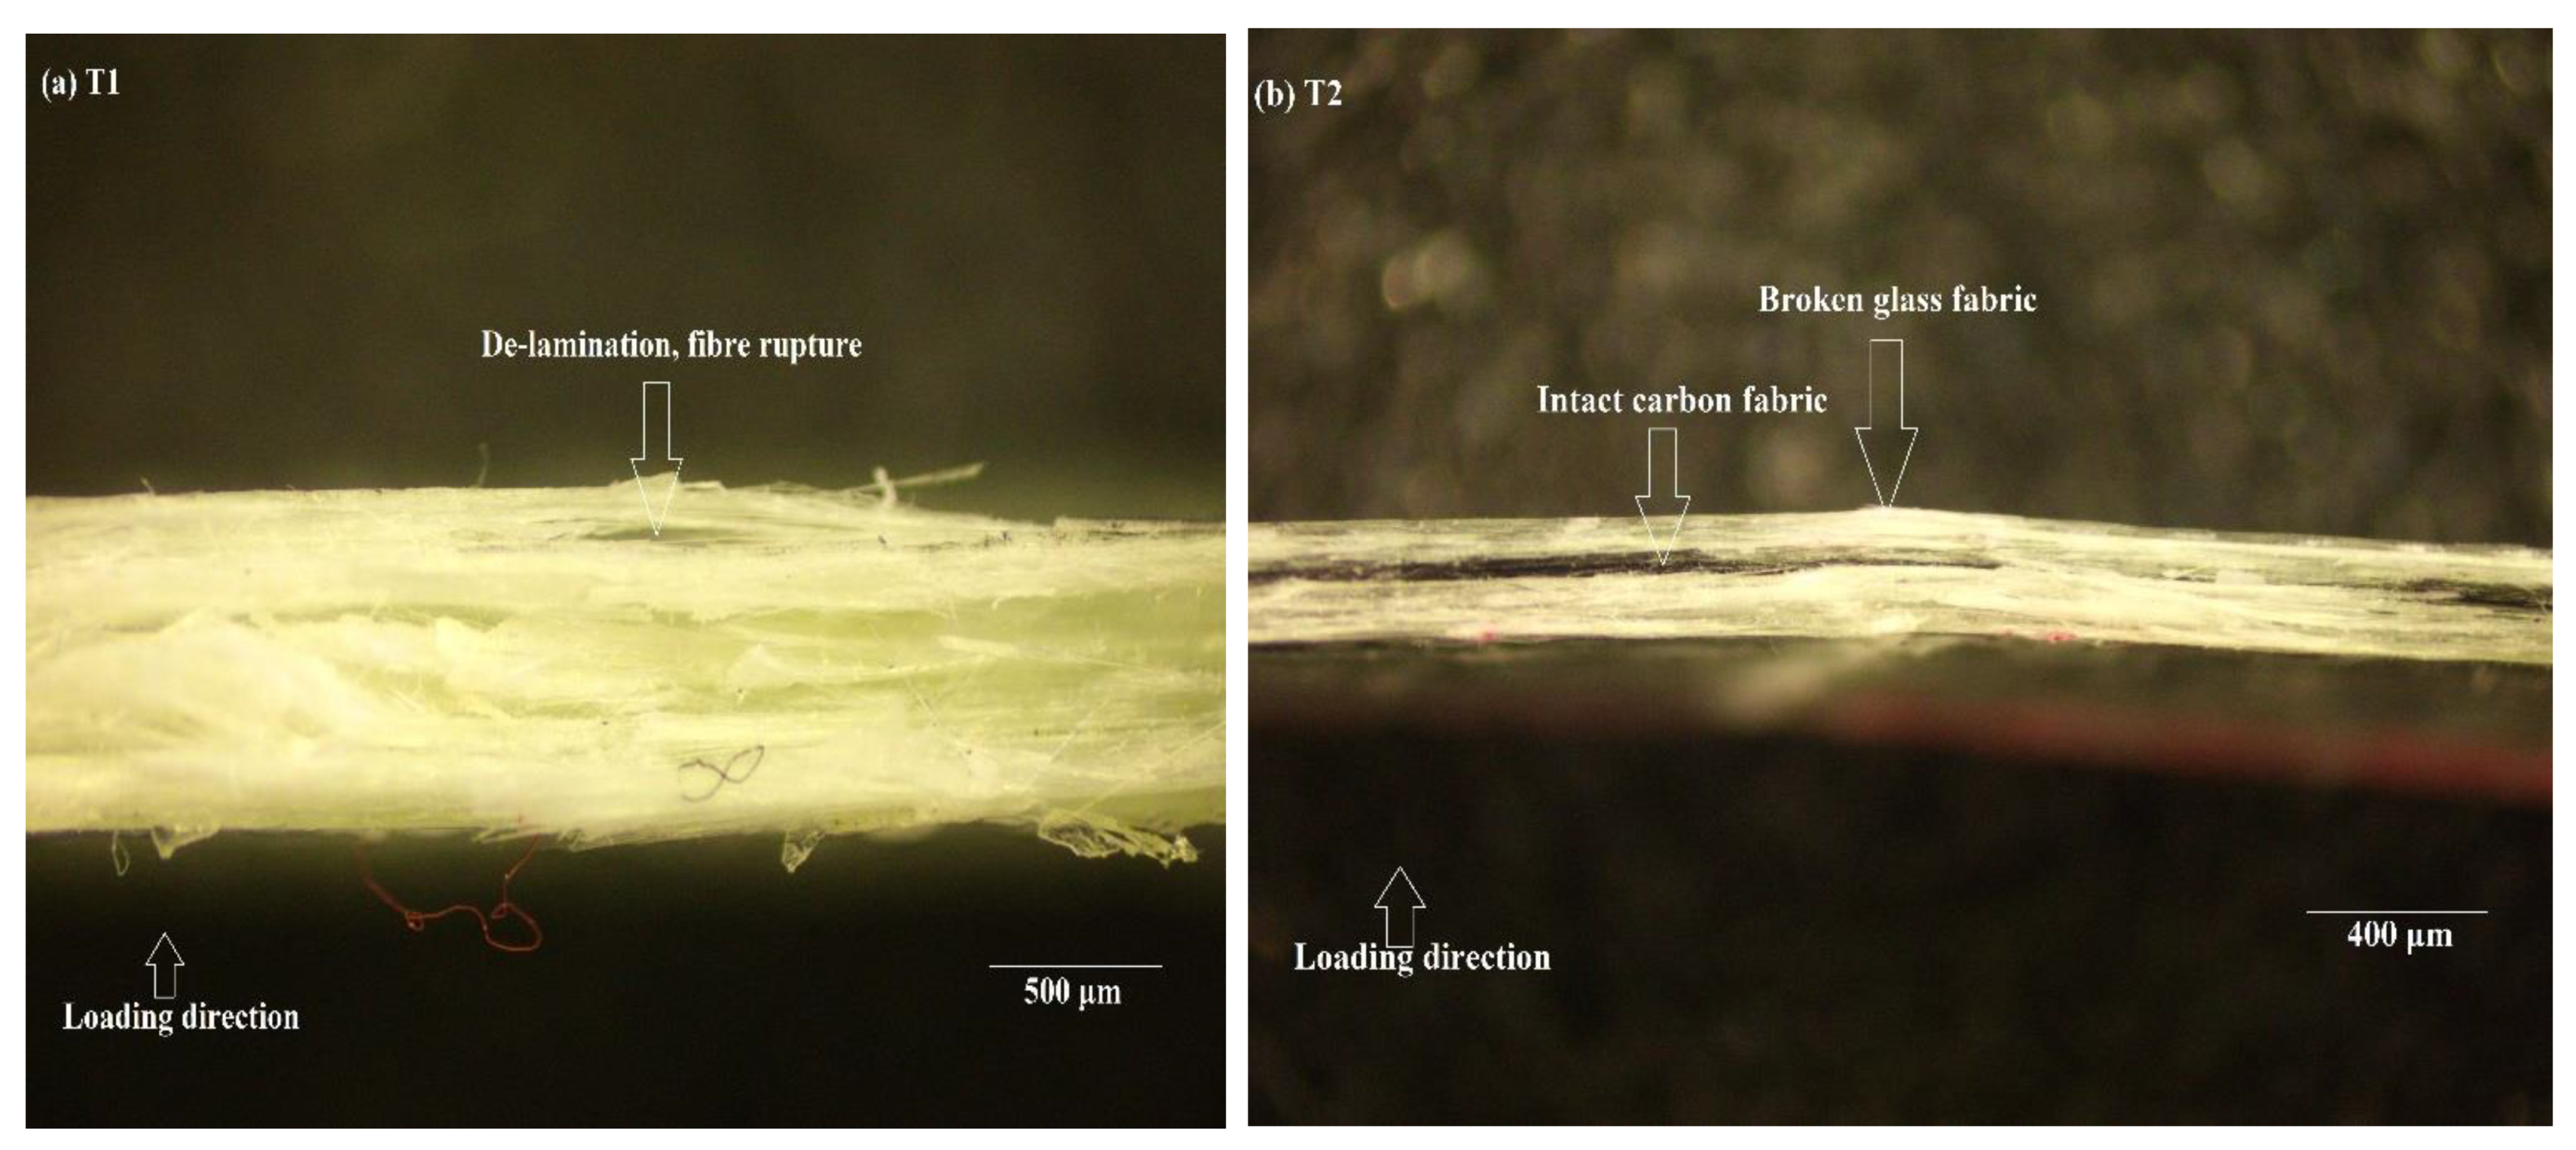
3.3.1. Epoxy Resin
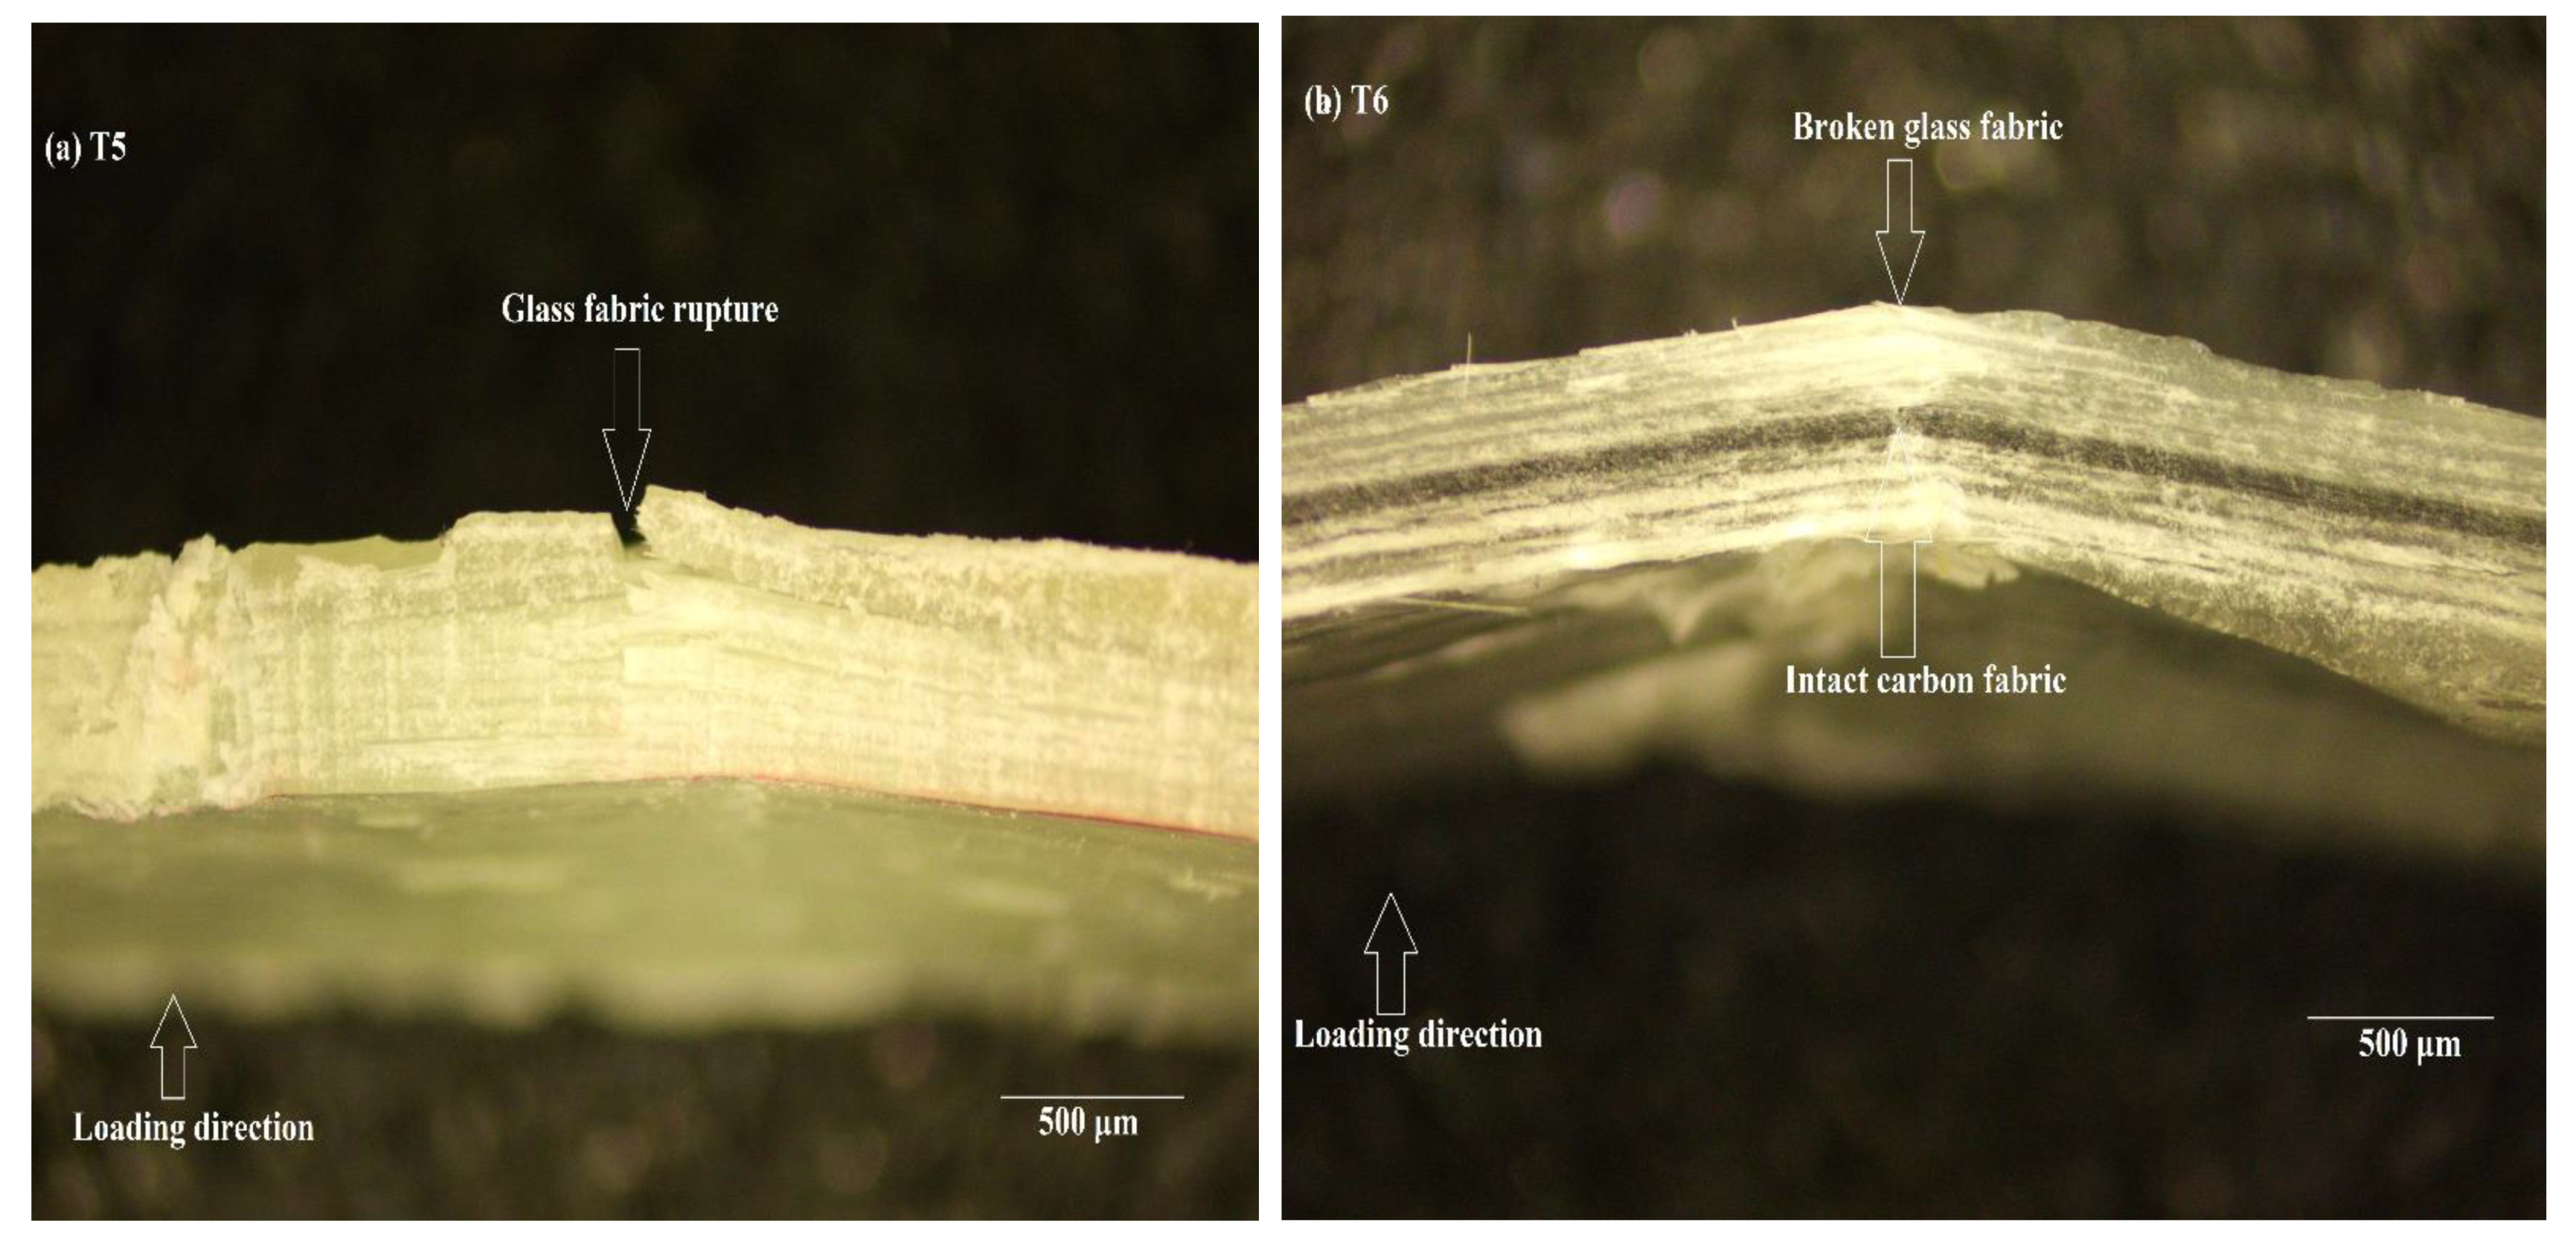
3.3.2. PMMA Resin
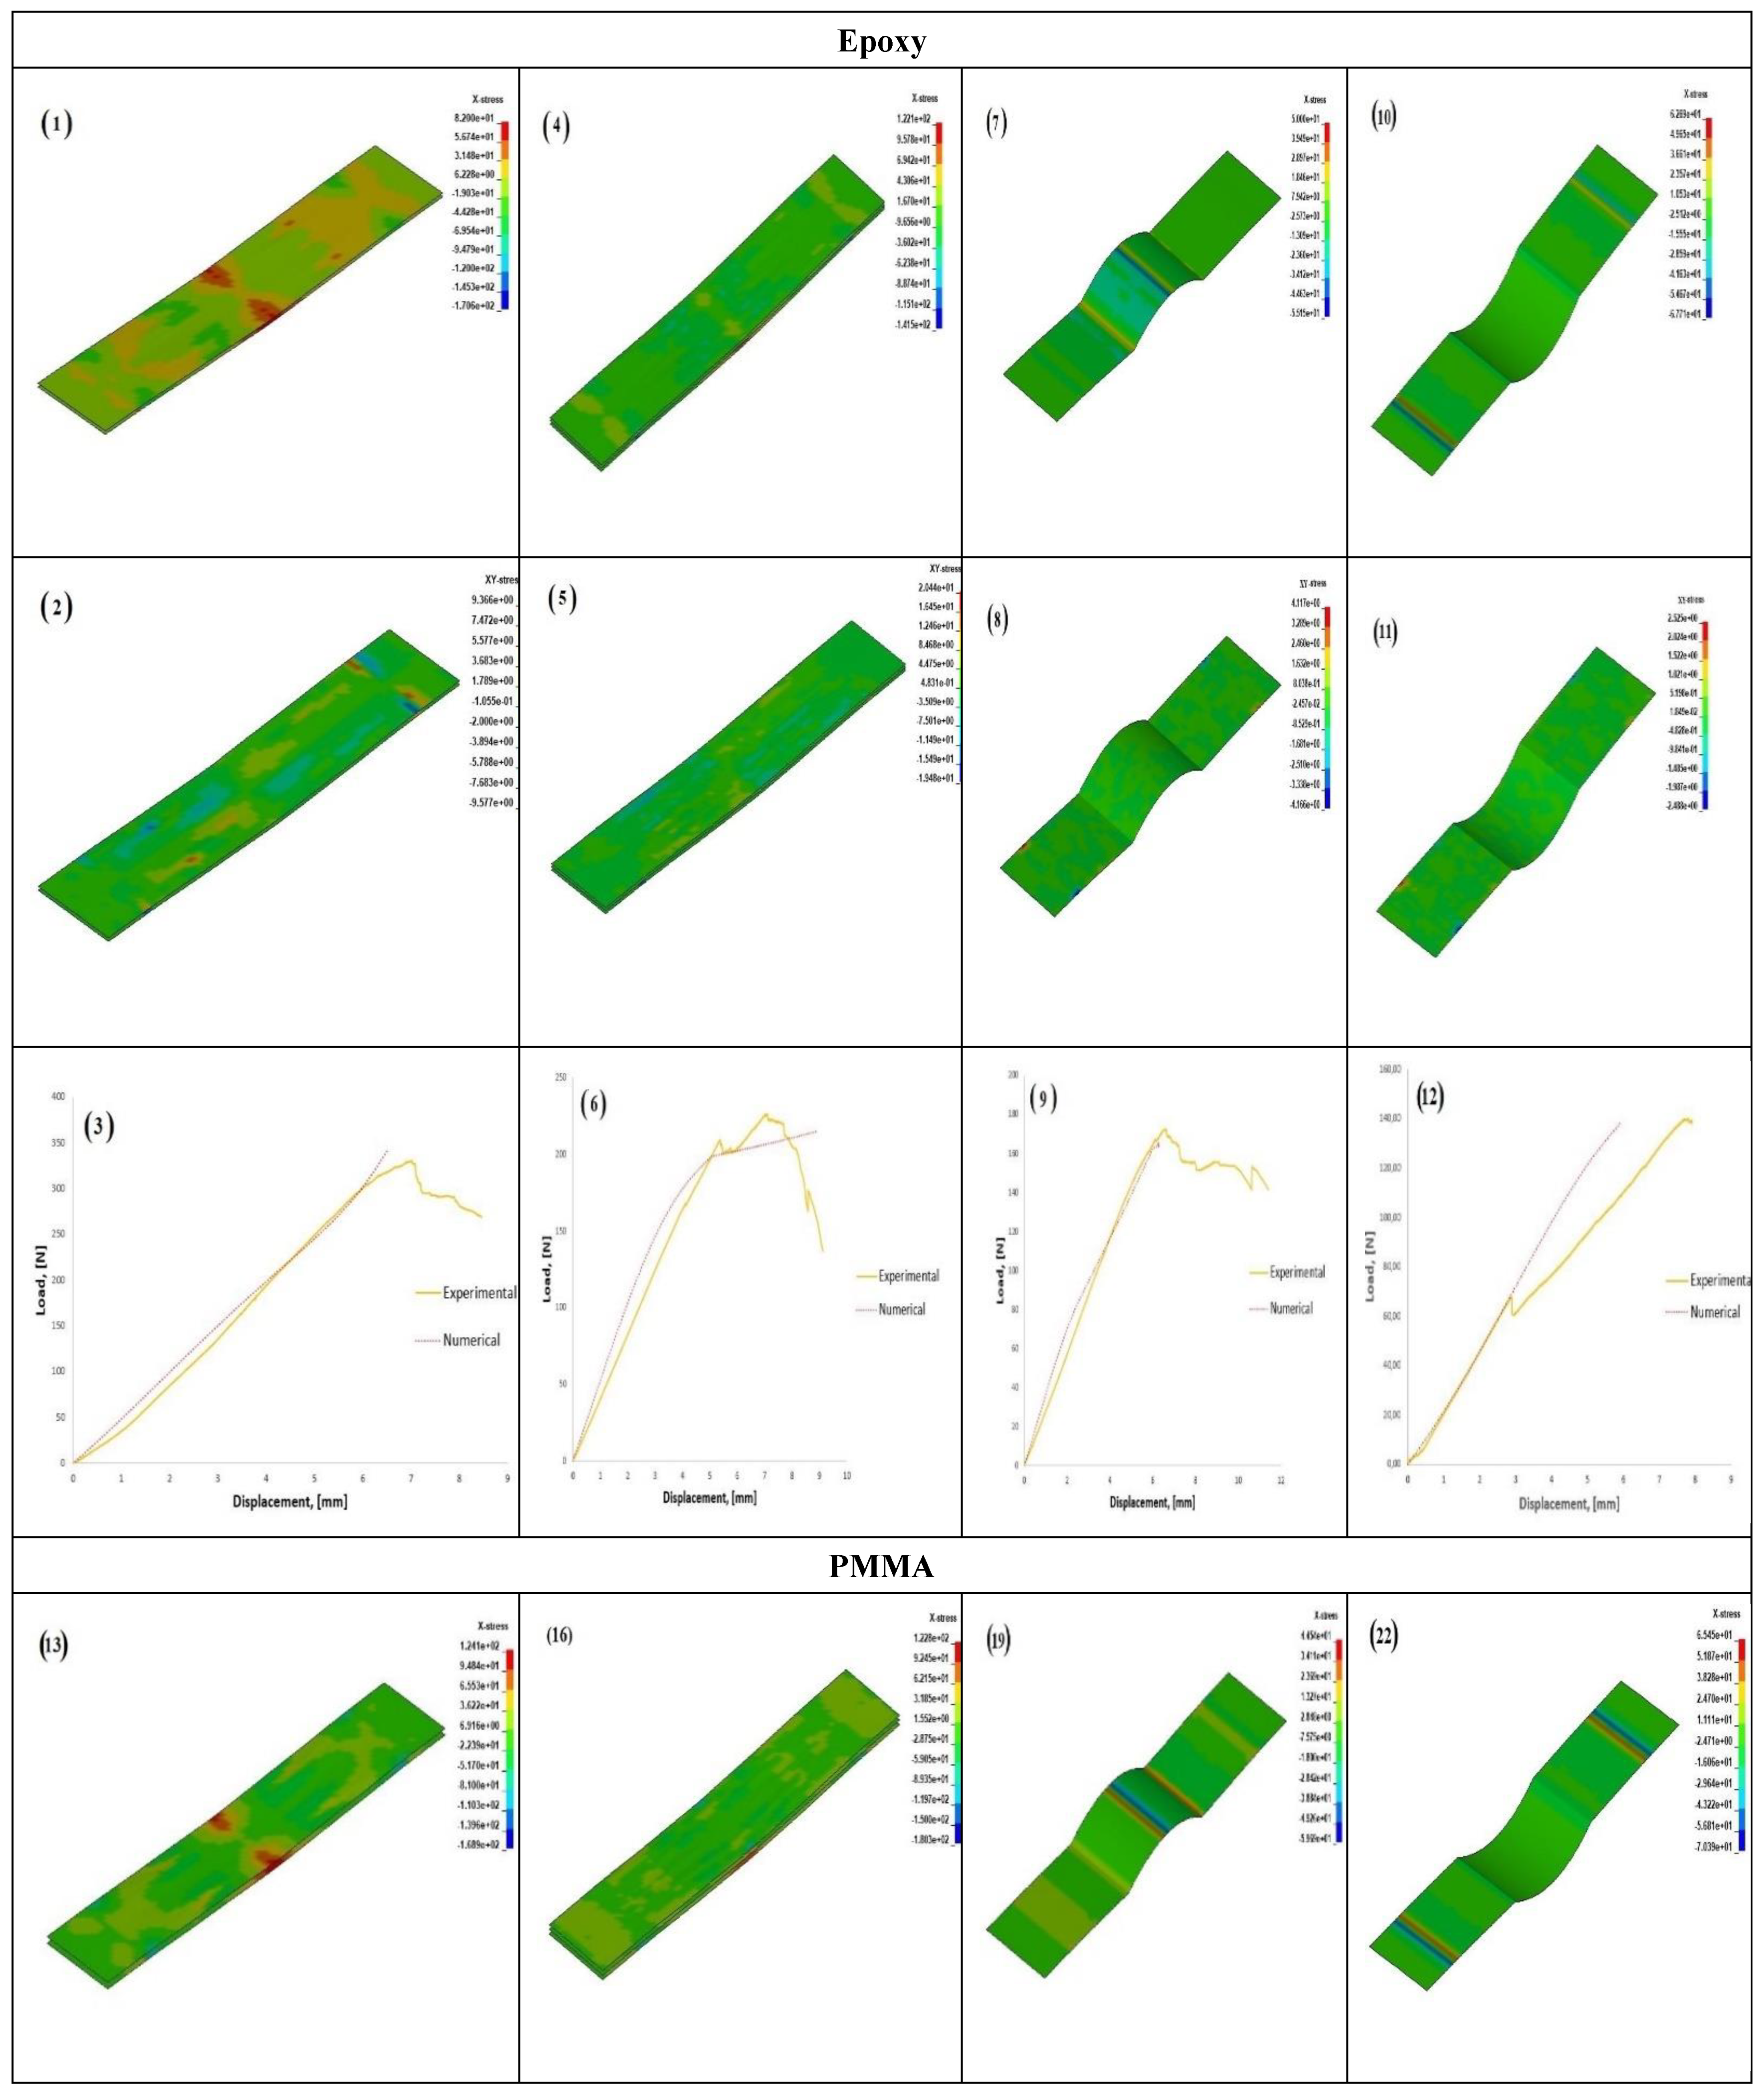
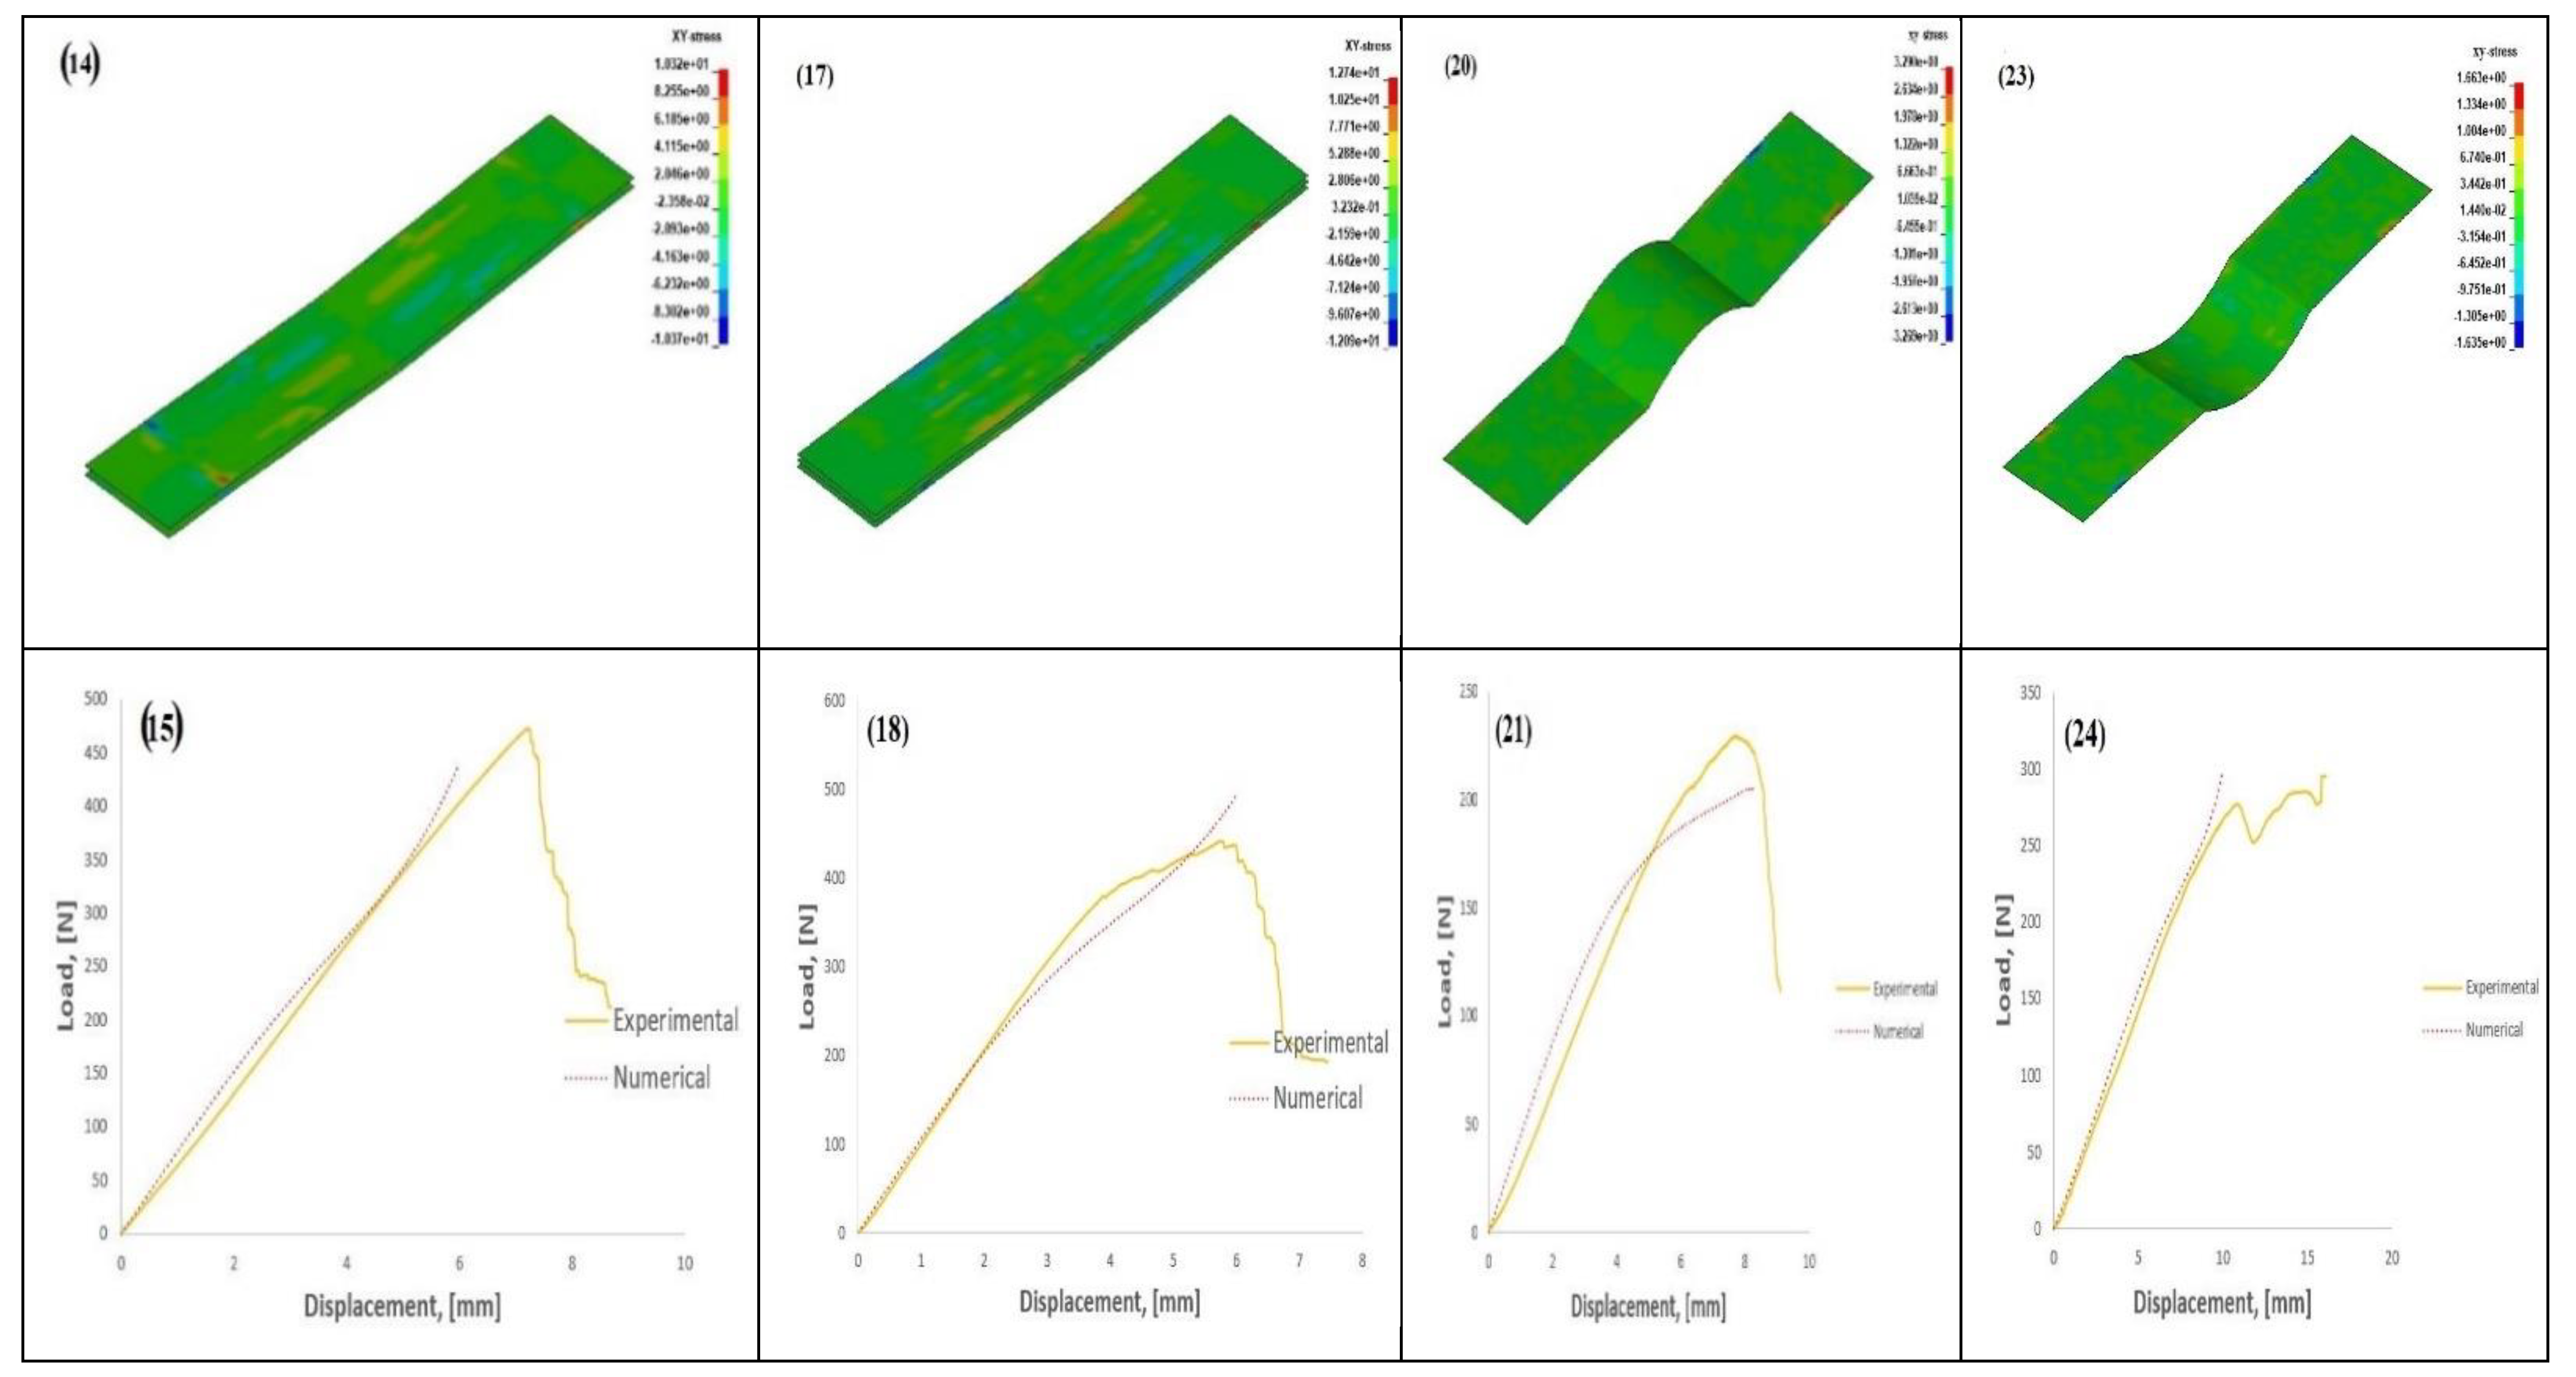
3.4. Numerical Results
Sensitivity of the Model to Different Modelling Parameters
4. Conclusions
- -
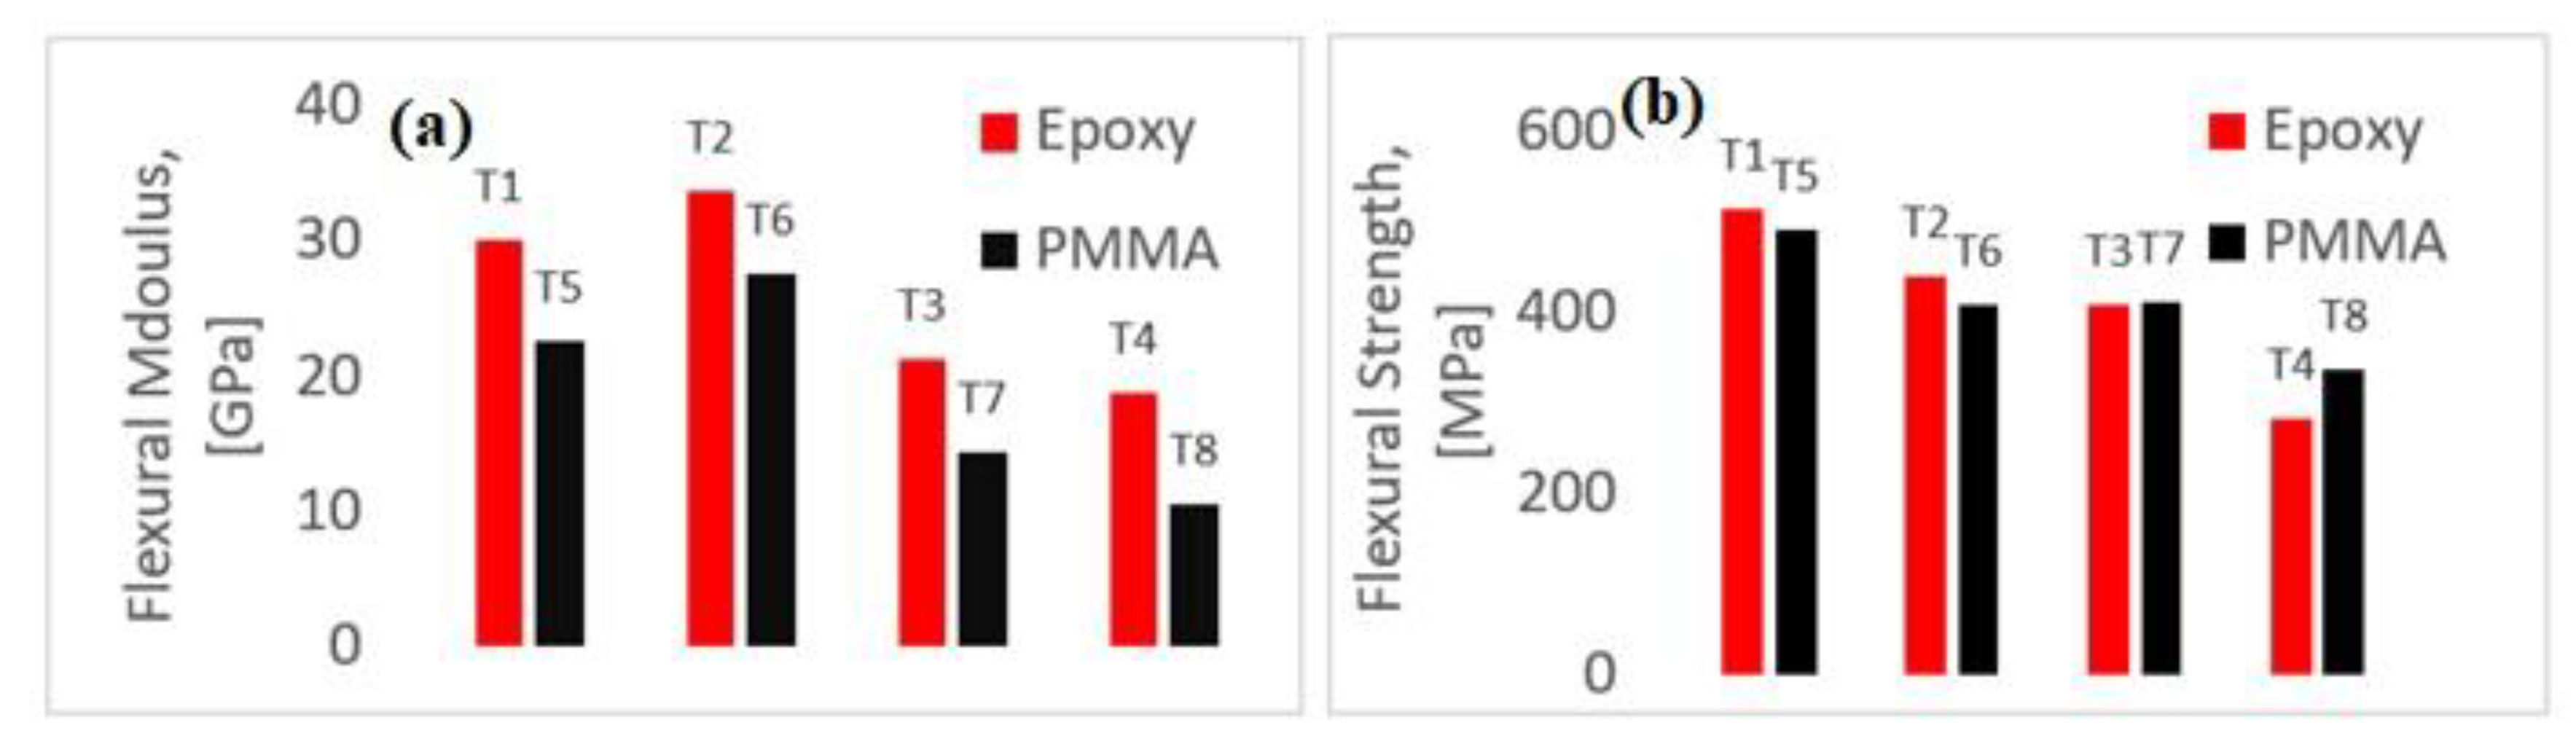
- PMMA was found to have similar flexural strength to that of epoxy, though the flexural modulus was found to be lower. Hybridising the architecture did not alter the modulus, but a drop in strength was observed in the case of epoxy specimens. In the case of PMMA, hybridisation increased the modulus, but the increase was not significant, and the strength did not change significantly. Thus, from a strength perspective, PMMA could be a good alternative for epoxy, thus making composites more recyclable.
- -
- The presence of waviness was found to be detrimental in both epoxy and PMMA specimens; in the case of the former, there was severe reduction in strength and modulus. However, the presence of in-plane waviness was found to increase the load significantly; thus, waviness could have some positive effects on composites.
- -
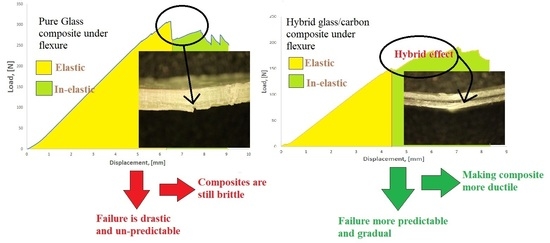
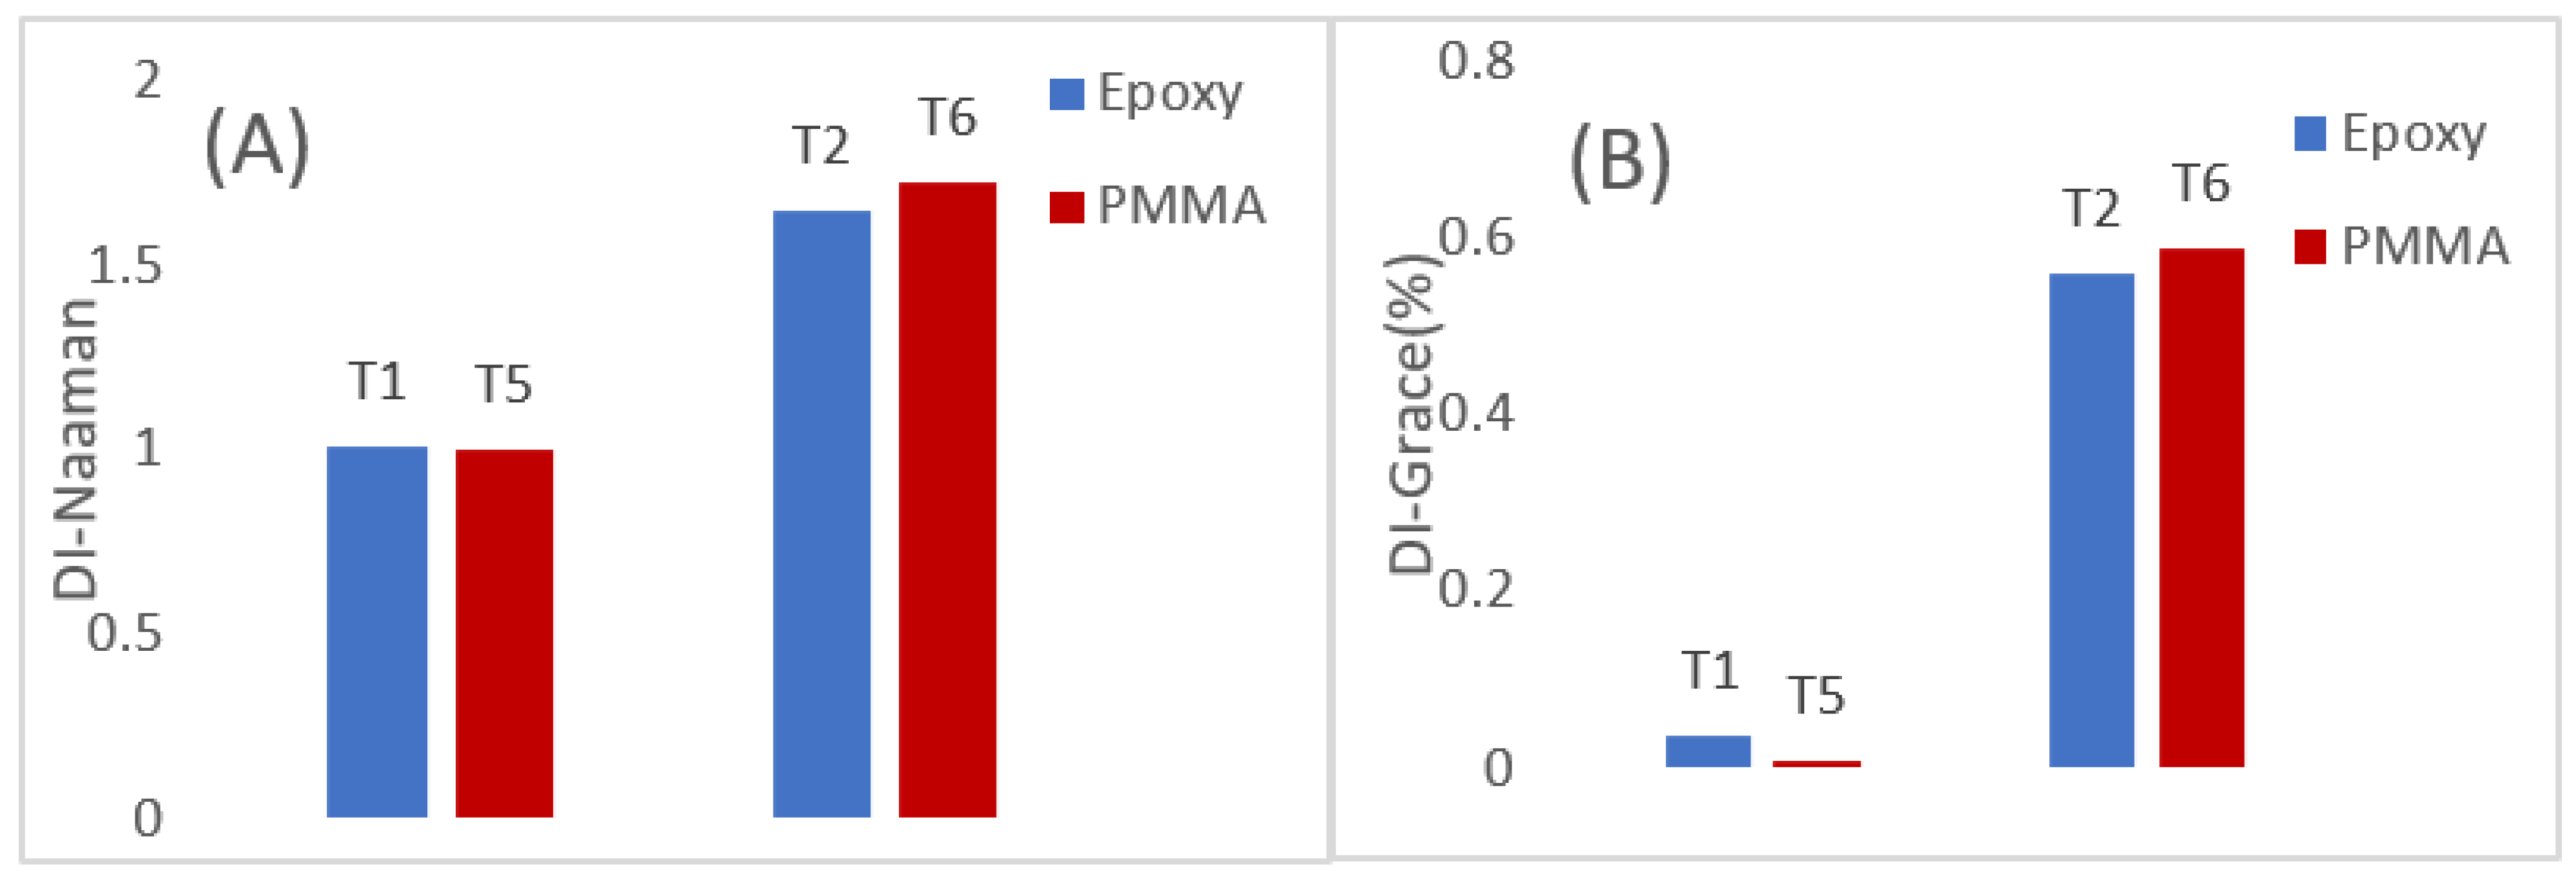
- Hybridisation introduces ductility into composites, and this can be quantified using an energy-based model. Thus, it was observed that hybridised specimens (T2 and T6) exhibited higher ductility when compared to their purer counterparts. A level of 60% ductility was seen in T2 and T6, while in T1 and T5, it was abysmally low.
- -
- The hybrid effect was further studied using an optical microscope, and it was observed that the carbon fabric was still intact, without failure. The hybrid effect was introduced by a controlled failure of first the glass fabrics and subsequently the carbon. Bending–stiffness mismatch was another reason for this observation, though this must be studied further using the classical laminate theory.
- -
- Numerical models were built on LS DYNA using the material model MAT 54, available in the LS DYNA MAT library. The modelling approach selected was found to predict the flexural behaviour similar to experiments. Tensile strain-to-failure (DFAILT) and matrix strain-to-failure (DFAILM) was seen to influence the modelling outcome proportionately, and hence a parametric study was conducted to establish the correct values of DFAILT and DFAILM.
Author Contributions
Funding
Institutional Review Board Statement
Informed Consent Statement
Data Availability Statement
Conflicts of Interest
References
- Adewale, G.A.; Damilola, V.O.; Joshua, O.I.; Akorede, S.A. A review of coir fibre reinforced polymer composites. Compos. B Eng. 2019, 176, 107305. [Google Scholar] [CrossRef]
- Sharath, P.S.; Samy, Y.; Paulius, G.; Vidas, M. High-performance fibreglass/epoxy reinforced by functionalised CNTs for vehicles applications with less fuel consumption and greenhouse gas emissions. Polym. Test. 2020, 86, 106480. [Google Scholar] [CrossRef]
- Samuli, K.; Povl, B.; Essi, S.; Olli, S. Influence of specimen type and reinforcement on measured tension-tension fatigue life of unidirectional GFRP laminates. Int. J. Fatig. 2016, 85, 114–129. [Google Scholar] [CrossRef] [Green Version]
- Guillermo, I.; Meisam, J.; Mohamad, F.; Juan, M.; Michael, R.W. Gradual failure in high-performance uni-directional thin-ply carbon/glass hybrid composites under bending. Compos. Struct. 2021, 271, 114128. [Google Scholar] [CrossRef]
- Hayashi, T. Development of new material properties by hybrid composition. 1st Report. Fukugo Zair. Compos. Mater. 1972, 1, 18–20. [Google Scholar]
- Summerscales, J.; Short, D. Carbon fibre and glass fibre hybrid reinforced plastics. Composites 1978, 9, 157–166. [Google Scholar] [CrossRef]
- Manders, P.W.; Bader, M.G. The strength of hybrid glass/carbon fibre composites-Part 1 Failure strain enhancement and failure mode. J. Mater. Sci. 1981, 16, 2233–2245. [Google Scholar] [CrossRef]
- Gergely, C.; Michael, R.W. Demonstration of pseudo-ductility in high performance glass-epoxy composites by hybridisation with thin-ply carbon prepeg. Compos. Part A Appl. Sci. Manuf. 2013, 52, 23–30. [Google Scholar]
- Yentl, S.; Larissa, G.; Ignaas, V. Fibre hybridisation in polymer composites: A review. Compos. A 2014, 67, 181–200. [Google Scholar]
- Gergely, C.; Meisam, J.; Michael, R.W.; Tibor, C. Design and characterisation of high performance, pseudo-ductile all-carbon/epoxy unidirectional hybrid composites. Compos. Part B Eng. 2017, 111, 348–356. [Google Scholar]
- Yentl, S.; Ignaas, V.; Larissa, G. Recent Advances in fibre-hybrid composites: Material selection, opportunities and applications. Int. Mater. Rev. 2019, 64, 181–215. [Google Scholar]
- Putu, S.; Mohamad, F.; Gergely.; Marco, L.; Michael, R.W. Fatigue behaviour of pseudo-ductile unidirectional thin-ply carbon/epoxyglass/epoxy hybrid composites. Compos. Struct. 2019, 224, 110996. [Google Scholar]
- Meisam, J.; Gergely, C.; Michael, R.W. Numerical modelling of the damage modes in UD thin carbon/glass hybrid laminates. Compos. Sci. Technol. 2014, 94, 39–47. [Google Scholar]
- Yentl, S.; Ignaas, V.; Larissa, G. A review of input data and modelling assumptions in longitudinal strength models for unidirectional fibre-reinforced composites. Compos. Struct. 2016, 150, 153–172. [Google Scholar]
- Gergely, C.; Meisam, J.; Michael, R.W. Design and characterisation of advanced pseudo-ductile unidirectional thin-ply carbon/epoxy-glass/epoxy hybrid composites. Compos. Struct. 2016, 143, 362–370. [Google Scholar]
- Michael, R.W.; Gergely, C.; Yentl, S.; Meisam, J.; Larissa, G.; Ignaas, V. Hybrid effects in thin ply carbon/glass unidirectional laminates: Accurate experimental determination and prediction. Compos. A 2016, 88, 131–139. [Google Scholar]
- Guerrero, J.M.; Mayugo, J.A.; Costa, J.; Turon, A. A 3D Progressive failure model for predicting pseudo-ductility in hybrid unidirectional composites materials under fibre tensile loading. Compos. Part A Appl. Sci. Manuf. 2018, 107, 579–591. [Google Scholar] [CrossRef]
- Sangwook, S.; Ran, Y.K.; Kazumasa, K.; Stephen, W.T. Experimental studies of thin-ply laminated composites. Compos. Sci. Technol. 2007, 67, 996–1008. [Google Scholar]
- Tomohiro, Y.; Akiko, K.; Akinori, Y.; Toshi, O.; Takahira, A. Damage characterisation in thin-ply composite laminates under out-of-plane transverse loadings. Compos. Struct. 2010, 93, 49–57. [Google Scholar]
- Hiroshi, S.; Mitsuhiro, M.; Kazumasa, K.; Manato, K.; Hiroki, T.; Mototsugo, T.; Isao, K. Effect of ply-thickness on impact damage morphology in CFRP laminates. J. Reinf. Plast. Compos. 2011, 30, 1097–1106. [Google Scholar]
- Amacher, R.; Cugnoni, J.; Botsis, J.; Sorensen, L.; Smith, W.; Dransfeld, C. Thin ply composites: Experimental characterisation and modelling of size-effects. Compos. Sci. Technol. 2014, 101, 121–132. [Google Scholar]
- Joel, G. Thin-ply composite laminates: A review. Compos. Struct. 2020, 236, 111920. [Google Scholar]
- Subadra, S.P.; Griskevicius, P. Sustainability of polymer composites and its critical role in revolutionising wind power for green future. Sustain. Technol. Green Econ. 2021, 1, 1–7. [Google Scholar] [CrossRef]
- Heoung-Jae, C.; Jai-Yoon, S.; Isaac, M.D. Effects of material and geometric nonlinearities on the tensile and compressive behaviour of composite materials with fibre waviness. Compos. Sci. Technol. 2001, 61, 125–134. [Google Scholar]
- Hsiao, H.M.; Isaac, M.D. Elastic properties of composites with fibre waviness. Compos. Part A Appl. Sci. Manuf. 1996, 27, 931–941. [Google Scholar] [CrossRef]
- Shi-Chang, W.; Isaac, M.D. Wave propagation in composite material with fibre waviness. Ultrasonics 1995, 33, 3–10. [Google Scholar]
- Travis, A.B.; John, W.G., Jr.; Mark, A.L. Influence of ply waviness on the stiffness and strength reduction on composite laminates. J. Thermoplast. Compos. Mater. 1992, 5, 344–369. [Google Scholar]
- Hsiao, H.M.; Isaac, M.D. Effect of fibre waviness on stiffness and strength reduction of unidirectional composites under compressive loading. Compos. Sci. Technol. 1996, 56, 581–593. [Google Scholar] [CrossRef]
- Chan, W.S.; Wang, J.S. Influence of fibre waviness on the structural response of composite laminates. J. Thermoplast. Compos. Mater. 1994, 7, 243–260. [Google Scholar] [CrossRef]
- Mark, R.G.; Ghodrat, K. Localised fibre waviness and implications for failure in unidirectional composites. J. Compos. Mater. 2005, 36, 1225–1244. [Google Scholar]
- Karami, G.; Garnich, M. Micromechanical study of thermoplastic behaviour of composites with periodic fibre waviness. Compos. Part B Eng. 2005, 36, 241–248. [Google Scholar] [CrossRef]
- Jumahat, A.; Soutis, C.; Jones, F.R.; Hodzic, A. Fracture mechanism and failure analysis of carbon fibre/toughened epoxy composites subjected to compressive loading. Compos. Struct. 2010, 92, 295–305. [Google Scholar] [CrossRef] [Green Version]
- Karami, G.; Garnich, M. Effective moduli and failure considerations for composites with periodic fibre waviness. Compos. Struct. 2005, 67, 461–475. [Google Scholar] [CrossRef]
- Potter, K.; Khan, B.; Wisnom, M.; Bell, T.; Stevens, J. Variability, fibre waviness and misalignment in the determination of the properties of composite materials and structures. Compos. Part A Appl. Sci. Manuf. 2008, 39, 1343–1354. [Google Scholar] [CrossRef]
- Travis, A.B.; John, W.G., Jr.; Mark, A.L. Influence of ply waviness with nonlinear shear on the stiffness and strength reduction of composite. J. Thermoplast. Compos. Mater. 1994, 7, 76–90. [Google Scholar]
- Alves, M.P.; Cimini, C.A., Jr.; Ha, S.K. Fibre waviness and its effect on the mechanical performance of fibre reinforced polymer composites: An enhanced review. Compos. Part A 2021, 149, 106526. [Google Scholar] [CrossRef]
- Heoung-Jae, C.; Jai-Yoon, S. Non-linear behaviours of thick composites with fibre waviness under pure bending. Mater. Sci. Res. Int. 1999, 48, 243–260. [Google Scholar]
- Michael, R.W. Effect of fibre waviness on the relationship between compressive and flexural strengths of unidirectional composites. J. Compos. Mater. 1994, 28, 66–76. [Google Scholar]
- Rai, H.G.; Rogers, C.W.; Crane, D.A. Mechanics of curved fibre composites. J. Reinf. Plast. Compos. 1992, 11, 552–566. [Google Scholar] [CrossRef]
- James, W.G.; Christis, G.P.; Balaguru, P.N. Flexural response of inorganic hybrid composites with E-Glass and carbon fibres. J. Eng. Mater. Technol. 2010, 132, 021005. [Google Scholar]
- Ary Subagia, I.D.G.; Yonjig, K.; Leonard, D.T.; Cheol, S.K.; Ho, K.S. Effect of stacking sequence in the flexural properties of hybrid composites reinforced with carbon and basalt fibres. Compos. B Eng. 2014, 58, 251–258. [Google Scholar] [CrossRef]
- Mehdi, K.; Chensong, D.; Ian, J.D. Multi-objective analysis for optimal and robust design of unidirectional glass/carbon fibre reinforced hybrid epoxy composites under flexural loading. Compos. Part B Eng. 2016, 84, 130–139. [Google Scholar]
- Mehdi, K.; Chensong, D.; Ian, J.D. Effect of matrix voids, fibre misalignment and thickness variation on multi-objective robust optimization of carbon/glass fibre-reinforced hybrid composites under flexural loading. Compos. B 2017, 123, 136–147. [Google Scholar]
- Maragoni, L.; Modenato, G.; De Rossi, N.; Vescovi, L.; Quaresimin, M. Effect of fibre waviness on the comprssive fatigue behaviour of woven carbon/epoxy laminates. Compos. Part B 2002, 199, 108282. [Google Scholar] [CrossRef]
- Allison, B.D.; Evans, J.L. Effect of fibre waviness on the bending behaviour of S-glass/epoxy composites. Mater. Des. 2012, 36, 316–322. [Google Scholar] [CrossRef]
- Andreas, A.; Philipp, G.; Klaus, D. Strength prediction of ply waviness in composite materials considering matrix dominated effect. Compos. Struct. 2015, 127, 51–59. [Google Scholar]
- Sharath, P.S.; Paulius, G.; Samy, Y. Low velocity impact and pseudo-ductile behaviour of carbon/glass/epoxy and carbon/glass/PMMA hybrid composite laminates for aircraft application at service temperature. Polym. Test. 2020, 89, 106711. [Google Scholar]
- Ahmed, G. Ductility of externally prestressed continuous concrete beans. KSCE J. Civ. Eng. 2014, 18, 595–606. [Google Scholar]
- Naaman, A.E.; Jeong, S.M. Structural ductility of concrete beams prestressed with FRP tendons. In Proceedings of the Second International RILEM Symposium (FRPRCS-2), Ghent, Belgium, 23–25 August 1995; pp. 379–401. [Google Scholar]
- Grace, N.F.; Soliman, A.K.; Abdel-Sayed, G.; Saleh, K.R. Behaviour and ductility of simple and continuous FRP reinforced beams. J. Compos. Constr. 1998, 2, 186–194. [Google Scholar] [CrossRef]
- Paolo, F.; Bonnie, W.; Francesco, D.; Mostafa, R.; Mark, H.; Alan, B. LS-DYNA MAT54 modelling of the axial crushing of a composite tape sinusoidal specimen. Compos. Part A 2011, 42, 1809–1825. [Google Scholar]
- Egle, R.; Panagiotis, K.; Guillermo, R. Model parameter sensitivity and benchmarking of the explicit dynamic solver of LS-DYNA for structural analysis in case of fire. Fire Saf. J. 2017, 90, 123–138. [Google Scholar]
- Antoniou, A.; Mikkelsen, L.P.; Goutianos, S.; Bagemiel, O.; Gebauer, I.; Flindt, R.; Sayer, F. Influence of the glass non-crimp fabric intrinsic undulation on the stiffness of the composite ply: A micromechanical approach. IOP Conf. Ser. Mater. Sci. Eng. 2020, 942, 012017. [Google Scholar] [CrossRef]
- Zein, S.; Neaz Sheikh, M.; Alex, M.R.; Abheek, B. Numerical investigation on the flexural behaviour of GFRP-RC beams under monotonic loads. Structures 2019, 20, 255–267. [Google Scholar]
- LS-DYNA Keyword User’S Manual, version 971; Livermore Software Technology Corporation: Livermore, CA, USA, 2006.
- Jun, Z.; Jihui, W.; Aiqing, N.; Wantao, G.; Xiang, L.; Yibo, W. A multi-parameter model for stiffness prediction of composite laminates with out-of-plane waviness. Compos. Struct. 2018, 185, 327–337. [Google Scholar]
- Dahsin, L. Impact-induced delamination-A view of bending stiffness mismatching. J. Compos. Mater. 1988, 22, 674. [Google Scholar]
- Robert, M.J. Mechanics of Composite Materials, 2nd ed.; Taylor & Francis Inc.: Philadelphia, PA, USA, 1999; pp. 121–184. [Google Scholar]
- 3B-Fibreglass SPRL, Technical Data Sheet for SE 2020 Direct Roving. Available online: https://www.3b-fibreglass.com/sites/default/files/products-data-sheets/TDS-SE-2020-DR-for-Epoxy-Resins-2015-sans-trame-LR.pdf (accessed on 19 June 2020).


| Specimen Code | Symbol | Architecture | Fabric | Fibre Orientation | Resin |
|---|---|---|---|---|---|
| T-1 | Glass  Carbon  |  | Glass | Uni-directional | Epoxy |
| T-2 |  | Glass and Carbon | Uni-directional | Epoxy | |
| T-3/T-9 | | Glass | Uni-directional | Epoxy | |
| T-4/T-10 | | Glass | Uni-directional | Epoxy | |
| T-5 | | Glass | Uni-directional | PMMA | |
| T-6 | | Glass and Carbon | Uni-directional | PMMA | |
| T-7 | | Glass | Uni-directional | PMMA | |
| T-8 | | Glass | Uni-directional | PMMA |
| Resin Material | Property | Value | Units |
|---|---|---|---|
| Epoxy (Bisphenol A) | Viscosity at 25 °C | 710 | mPas |
| Density at 25 °C | 1.15 | g/cm3 | |
| Epoxy (Bisphenol A) | Viscosity at 25 °C | 14 | mPas |
| Density at 25 °C | 0.94 | g/cm3 | |
| PMMA | Viscosity at 20 °C | 500 | mPas |
| Density at 20 °C | 1 | g/cm3 |
| Resin Type | E1 (GPa) | E2 (GPa) | G12/G13 (GPa) | (MPa) | (MPa) | (MPa) | (MPa) | (MPa) | |
|---|---|---|---|---|---|---|---|---|---|
| Epoxy/Glass | 32.4 | 8.1 | 2.6 | 0.22 | 680 | 600 | 35 | 37 | 35 |
| Epoxy/Carbon | 63 | 40 | 9 | 0.16 | 709 | 473 | 501 | 146 | 199 |
| PMMA/Glass | 23.16 | 2.1 | 2.62 | 0.38 | 325 | 246 | 16 | 42 | 128 |
| PMMA/Carbon | 47 | 3 | 1.8 | 0.13 | 1300 | 882 | 15 | 40 | 120 |
| Specimen Code | T-1 | T-2 | T-3 | T-4 | T-5 | T-6 | T-7 | T-8 |
|---|---|---|---|---|---|---|---|---|
| Experimental Load (N) | 329.60 | 226.25 | 172.40 | 139.95 | 428.21 | 440.50 | 230.00 | 295.20 |
| Numerical Load (N) | 341.34 | 229.78 | 165.92 | 138.38 | 439.94 | 492.21 | 205.47 | 296.44 |
| Material | Young’s Modulus (GPa) | Tensile Strength (MPa) |
|---|---|---|
| Epoxy | 3.2 | 70 |
| Glass Fabric | 81.0 | 2200 |
| Parametric Study (PS) | DFAILT | DFAILM |
|---|---|---|
| 1 | 0.033 | 0.04 |
| 2 | 0.048 | 0.04 |
| 3 | 0.009 | 0.04 |
| 4 | 0.1 | 0.04 |
| 5 | 0.033 | 0.009 |
| 6 | 0.033 | 0.1 |
Publisher’s Note: MDPI stays neutral with regard to jurisdictional claims in published maps and institutional affiliations. |
© 2022 by the authors. Licensee MDPI, Basel, Switzerland. This article is an open access article distributed under the terms and conditions of the Creative Commons Attribution (CC BY) license (https://creativecommons.org/licenses/by/4.0/).
Share and Cite
Subadra, S.P.; Griskevicius, P. Effect of Hybridization and Ply Waviness on the Flexural Strength of Polymer Composites: An Experimental and Numerical Study. Polymers 2022, 14, 1360. https://doi.org/10.3390/polym14071360
Subadra SP, Griskevicius P. Effect of Hybridization and Ply Waviness on the Flexural Strength of Polymer Composites: An Experimental and Numerical Study. Polymers. 2022; 14(7):1360. https://doi.org/10.3390/polym14071360
Chicago/Turabian StyleSubadra, Sharath P., and Paulius Griskevicius. 2022. "Effect of Hybridization and Ply Waviness on the Flexural Strength of Polymer Composites: An Experimental and Numerical Study" Polymers 14, no. 7: 1360. https://doi.org/10.3390/polym14071360
APA StyleSubadra, S. P., & Griskevicius, P. (2022). Effect of Hybridization and Ply Waviness on the Flexural Strength of Polymer Composites: An Experimental and Numerical Study. Polymers, 14(7), 1360. https://doi.org/10.3390/polym14071360