
Effect of Additives and Print Orientation on the Properties of Laser Sintering-Printed Polyamide 12 Components


Abstract
:1. Introduction
2. Materials and Methods
2.1. Materials
2.2. Analysis of Powders
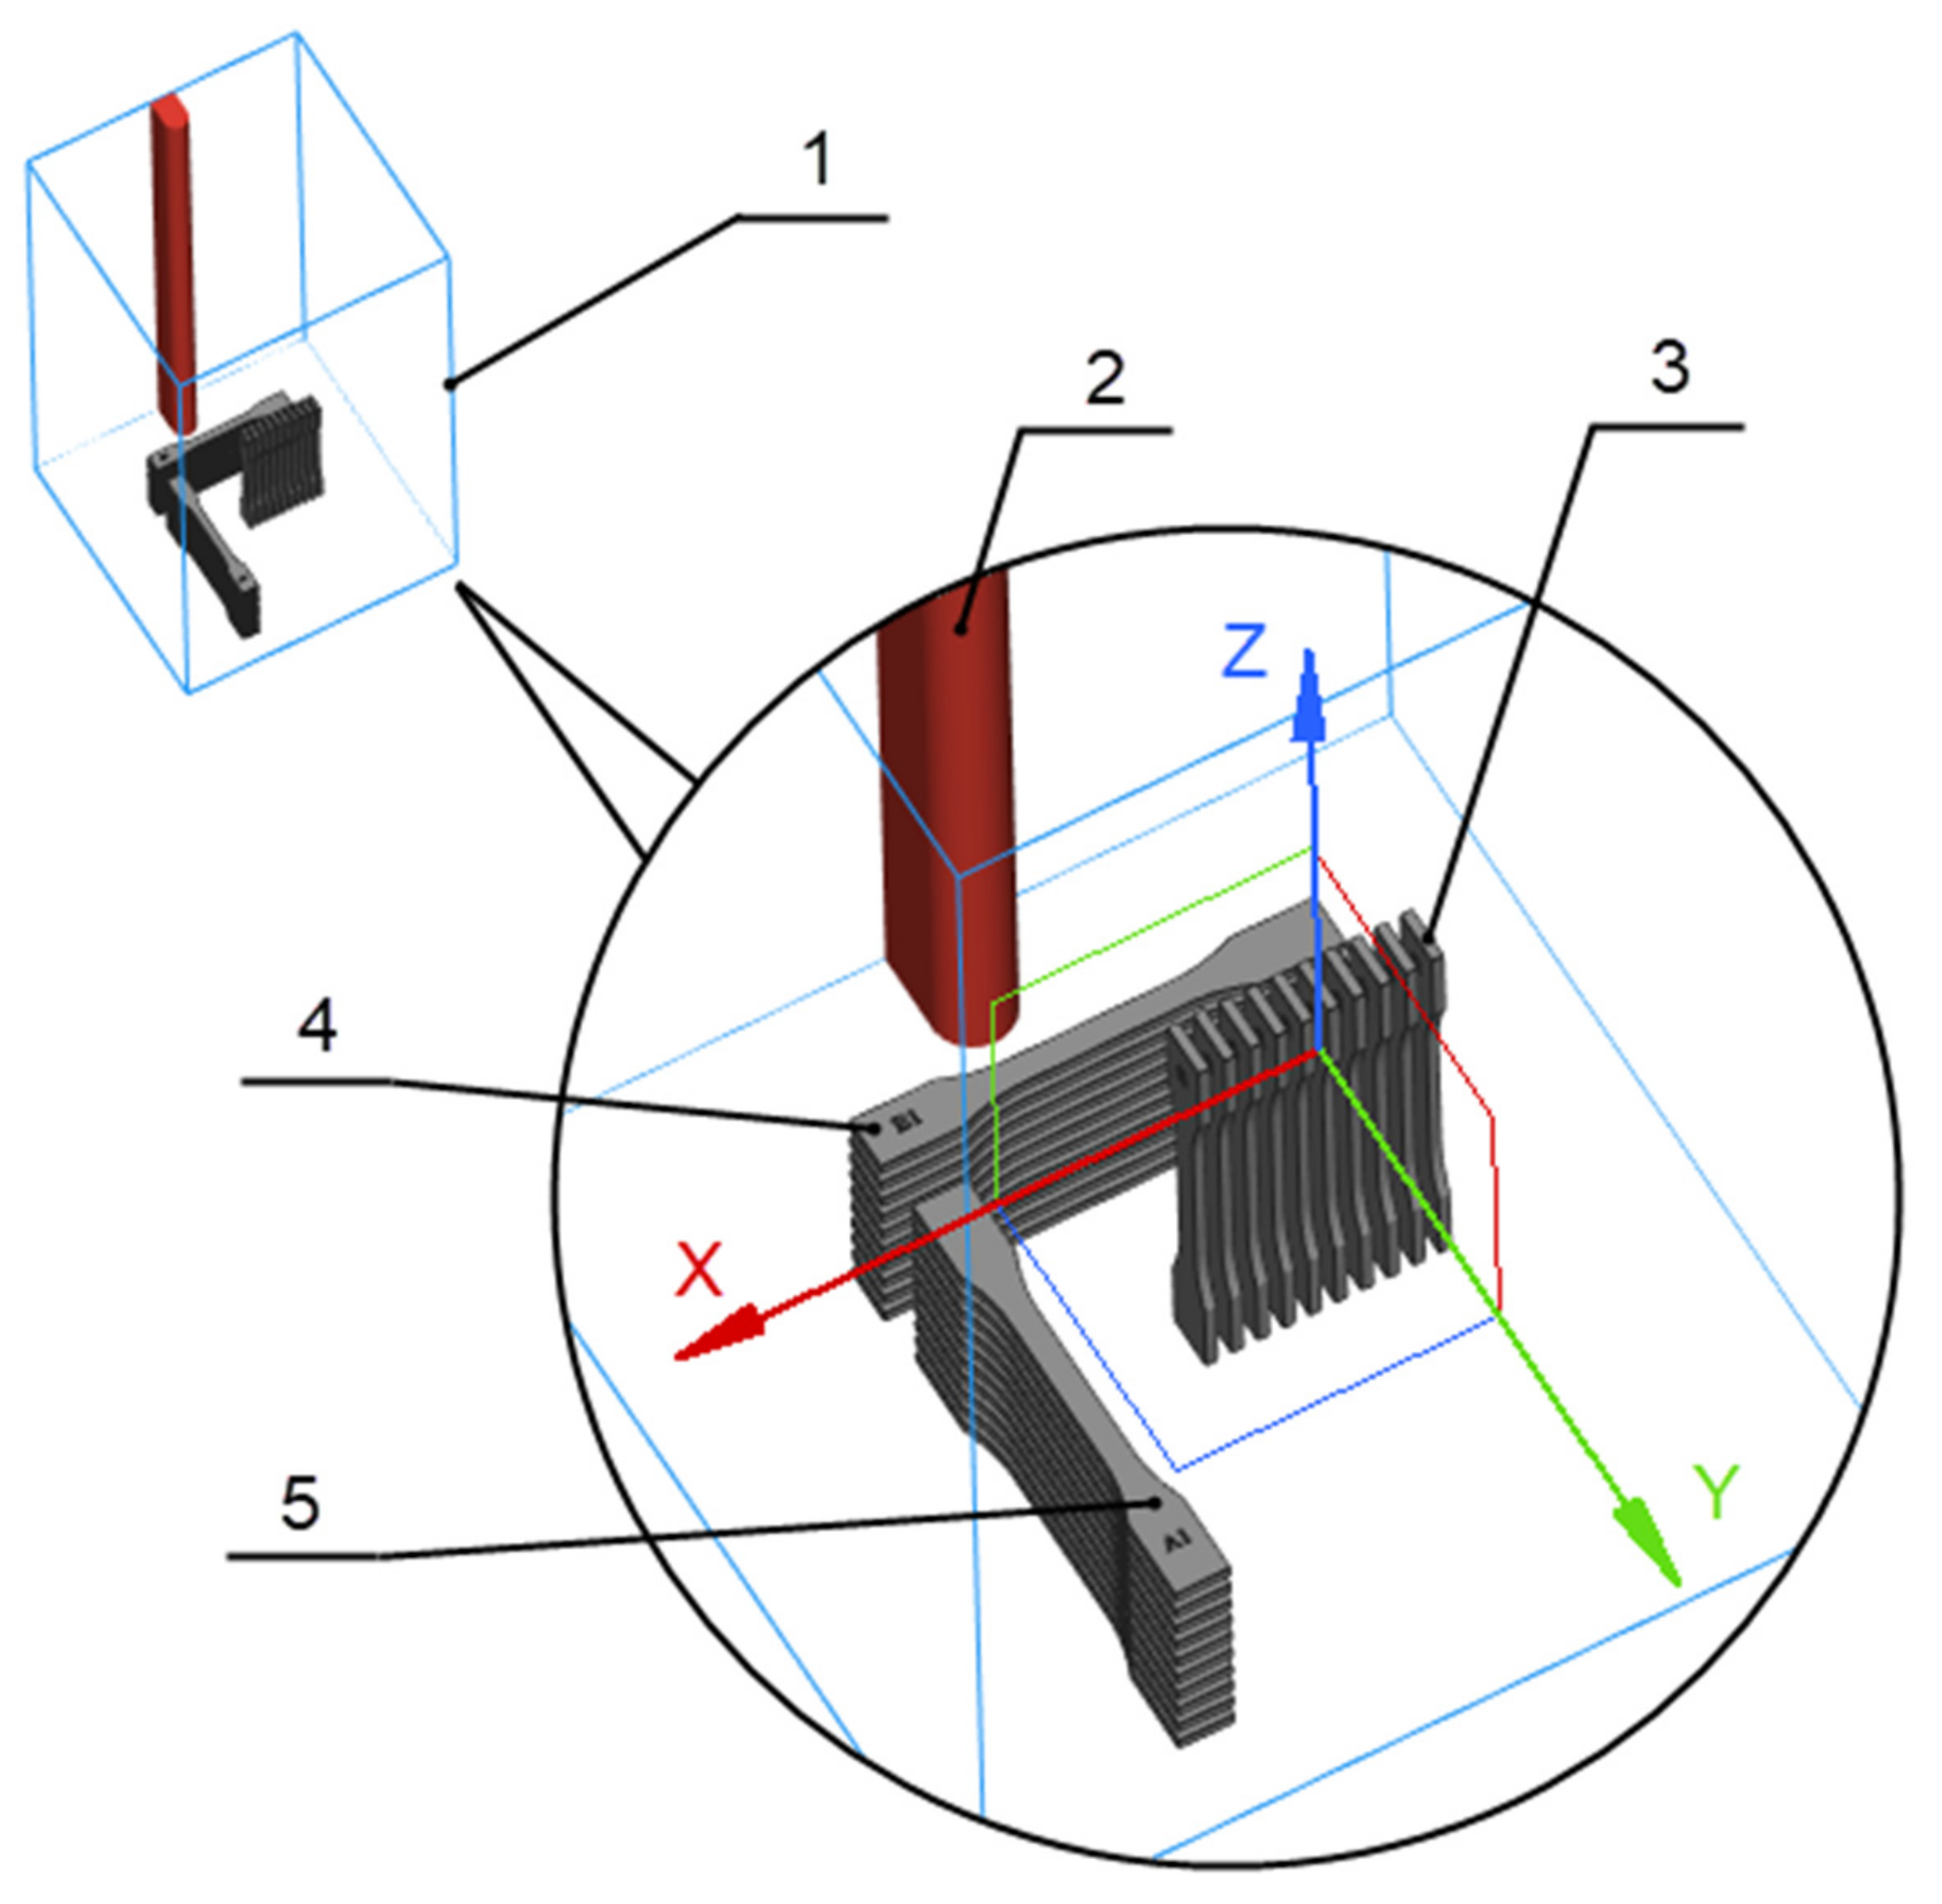
2.3. Preparation of 3D Samples
2.4. Analysis of 3D Samples
3. Results
3.1. Analysis of Powders
3.2. Analysis of 3D Samples
4. Conclusions
Author Contributions
Funding
Institutional Review Board Statement
Informed Consent Statement
Data Availability Statement
Conflicts of Interest
References
- Pagac, M.; Hajnys, J.; Ma, Q.-P.; Jancar, L.; Jansa, J.; Stefek, P.; Mesicek, J. A Review of Vat Photopolymerization Technology: Materials, Applications, Challenges, and Future Trends of 3D Printing. Polymers 2021, 13, 598. [Google Scholar] [CrossRef] [PubMed]
- Ngo, T.D.; Kashani, A.; Imbalzano, G.; Nguyen, K.T.Q.; Hui, D. Additive manufacturing (3D printing): A review of materials, methods, applications and challenges. Compos. Part B Eng. 2018, 143, 172–196. [Google Scholar] [CrossRef]
- Tomanik, M.; Żmudzińska, M.; Wojtków, M. Mechanical and Structural Evaluation of the PA12 Desktop Selective Laser Sintering Printed Parts Regarding Printing Strategy. 3D Print. Addit. Manuf. 2021, 8, 271–279. [Google Scholar] [CrossRef]
- Salmoria, G.V.; Ahrens, C.H.; Klauss, P.; Paggi, R.A.; Oliveira, R.G.; Lago, A. Rapid manufacturing of polyethylene parts with controlled pore size gradients using selective laser sintering. Mater. Res. 2007, 10, 211–214. [Google Scholar] [CrossRef] [Green Version]
- Bai, J.; Zhang, B.; Song, J.; Bi, G.; Wang, P.; Wei, J. The effect of processing conditions on the mechanical properties of polyethylene produced by selective laser sintering. Polym. Test. 2016, 52, 89–93. [Google Scholar] [CrossRef]
- Rimell, J.T.; Marquis, P.M. Selective laser sintering of ultra high molecular weight polyethylene for clinical applications. J. Biomed. Mater. Res. Off. J. Soc. Biomater. Jpn. Soc. Biomater. Aust. Soc. Biomater. Korean Soc. Biomater. 2000, 53, 414–420. [Google Scholar] [CrossRef]
- Tan, W.S.; Chua, C.K.; Chong, T.H.; Fane, A.G.; Jia, A. 3D printing by selective laser sintering of polypropylene feed channel spacers for spiral wound membrane modules for the water industry. Virtual Phys. Prototyp. 2016, 11, 151–158. [Google Scholar] [CrossRef]
- Zhu, W.; Yan, C.; Shi, Y.; Wen, S.; Han, C.; Cai, C.; Liu, J.; Shi, Y. Study on the selective laser sintering of a low-isotacticity polypropylene powder. Rapid Prototyp. J. 2016, 22, 621–629. [Google Scholar] [CrossRef]
- Zhu, W.; Yan, C.; Shi, Y.; Wen, S.; Liu, J.; Shi, Y. Investigation into mechanical and microstructural properties of polypropylene manufactured by selective laser sintering in comparison with injection molding counterparts. Mater. Des. 2015, 82, 37–45. [Google Scholar] [CrossRef]
- Verbelen, L.; Dadbakhsh, S.; Van den Eynde, M.; Strobbe, D.; Kruth, J.-P.; Goderis, B.; Van Puyvelde, P. Analysis of the material properties involved in laser sintering of thermoplastic polyurethane. Addit. Manuf. 2017, 15, 12–19. [Google Scholar] [CrossRef]
- Kummert, C.; Josupeit, S.; Schmid, H.-J. Thermoplastic Elastomer Part Color as Function of Temperature Histories and Oxygen Atmosphere During Selective Laser Sintering. JOM 2018, 70, 425–430. [Google Scholar] [CrossRef]
- Yuan, S.; Shen, F.; Bai, J.; Chua, C.K.; Wei, J.; Zhou, K. 3D soft auxetic lattice structures fabricated by selective laser sintering: TPU powder evaluation and process optimization. Mater. Des. 2017, 120, 317–327. [Google Scholar] [CrossRef]
- Toncheva, A.; Brison, L.; Dubois, P.; Laoutid, F. Recycled tire rubber in additive manufacturing: Selective laser sintering for polymer-ground rubber composites. Appl. Sci. 2021, 11, 8778. [Google Scholar] [CrossRef]
- Parandoush, P.; Lin, D. A review on additive manufacturing of polymer-fiber composites. Compos. Struct. 2017, 182, 36–53. [Google Scholar] [CrossRef]
- Goodridge, R.D.; Tuck, C.J.; Hague, R.J.M. Laser sintering of polyamides and other polymers. Prog. Mater. Sci. 2012, 57, 229–267. [Google Scholar] [CrossRef]
- Stichel, T.; Frick, T.; Laumer, T.; Tenner, F.; Hausotte, T.; Merklein, M.; Schmidt, M. A Round Robin study for Selective Laser Sintering of polyamide 12: Microstructural origin of the mechanical properties. Opt. Laser Technol. 2017, 89, 31–40. [Google Scholar] [CrossRef]
- Shi, Y.; Li, Z.; Sun, H.; Huang, S.; Zeng, F. Effect of the properties of the polymer materials on the quality of selective laser sintering parts. Proc. Inst. Mech. Eng. Part L J. Mater. Des. Appl. 2004, 218, 247–252. [Google Scholar] [CrossRef]
- Osswald, P.V.; Obst, P.; Capote, G.A.M.; Friedrich, M.; Rietzel, D.; Witt, G. Failure criterion for PA 12 multi-jet fusion additive manufactured parts. Addit. Manuf. 2021, 37, 101668. [Google Scholar] [CrossRef]
- Dupin, S.; Lame, O.; Barrès, C.; Charmeau, J.-Y. Microstructural origin of physical and mechanical properties of polyamide 12 processed by laser sintering. Eur. Polym. J. 2012, 48, 1611–1621. [Google Scholar] [CrossRef]
- Majewski, C.; Zarringhalam, H.; Hopkinson, N. Effect of the degree of particle melt on mechanical properties in selective laser-sintered Nylon-12 parts. Proc. Inst. Mech. Eng. Part B J. Eng. Manuf. 2008, 222, 1055–1064. [Google Scholar] [CrossRef]
- Caulfield, B.; McHugh, P.E.; Lohfeld, S. Dependence of mechanical properties of polyamide components on build parameters in the SLS process. J. Mater. Process. Technol. 2007, 182, 477–488. [Google Scholar] [CrossRef]
- Chen, P.; Tang, M.; Zhu, W.; Yang, L.; Wen, S.; Yan, C.; Ji, Z.; Nan, H.; Shi, Y. Systematical mechanism of Polyamide-12 aging and its micro-structural evolution during laser sintering. Polym. Test. 2018, 67, 370–379. [Google Scholar] [CrossRef]
- Dadbakhsh, S.; Verbelen, L.; Verkinderen, O.; Strobbe, D.; Van Puyvelde, P.; Kruth, J.-P. Effect of PA12 powder reuse on coalescence behaviour and microstructure of SLS parts. Eur. Polym. J. 2017, 92, 250–262. [Google Scholar] [CrossRef]
- Hong, R.; Zhao, Z.; Leng, J.; Wu, J.; Zhang, J. Two-step approach based on selective laser sintering for high performance carbon black/polyamide 12 composite with 3D segregated conductive network. Compos. Part B Eng. 2019, 176, 107214. [Google Scholar] [CrossRef]
- Hui, D.; Goodridge, R.D.; Scotchford, C.A.; Grant, D.M. Laser sintering of nano-hydroxyapatite coated polyamide 12 powders. Addit. Manuf. 2018, 22, 560–570. [Google Scholar] [CrossRef]
- Schmid, M.; Wegener, K. Thermal and molecular properties of polymer powders for Selective Laser Sintering (SLS). In AIP Conference Proceedings; AIP Publishing LLC: Arlington, TX, USA, 2016; Volume 1779, p. 100003. [Google Scholar]
- O’Connor, H.J.; Dowling, D.P. Comparison between the properties of polyamide 12 and glass bead filled polyamide 12 using the multi jet fusion printing process. Addit. Manuf. 2020, 31, 100961. [Google Scholar]
- Mazzoli, A.; Moriconi, G.; Pauri, M.G. Characterization of an aluminum-filled polyamide powder for applications in selective laser sintering. Mater. Des. 2007, 28, 993–1000. [Google Scholar] [CrossRef]
- Salmoria, G.V.; Paggi, R.A.; Lago, A.; Beal, V.E. Microstructural and mechanical characterization of PA12/MWCNTs nanocomposite manufactured by selective laser sintering. Polym. Test. 2011, 30, 611–615. [Google Scholar] [CrossRef] [Green Version]
- Yi, X.; Tan, Z.-J.; Yu, W.-J.; Li, J.; Li, B.-J.; Huang, B.-Y.; Liao, J. Three dimensional printing of carbon/carbon composites by selective laser sintering. Carbon N. Y. 2016, 96, 603–607. [Google Scholar] [CrossRef]
- Türk, D.-A.; Brenni, F.; Zogg, M.; Meboldt, M. Mechanical characterization of 3D printed polymers for fiber reinforced polymers processing. Mater. Des. 2017, 118, 256–265. [Google Scholar] [CrossRef]
- Athreya, S.R.; Kalaitzidou, K.; Das, S. Processing and characterization of a carbon black-filled electrically conductive Nylon-12 nanocomposite produced by selective laser sintering. Mater. Sci. Eng. A 2010, 527, 2637–2642. [Google Scholar] [CrossRef]
- Guo, B.; Xu, Z.; Luo, X.; Bai, J. A detailed evaluation of surface, thermal, and flammable properties of polyamide 12/glass beads composites fabricated by multi jet fusion. Virtual Phys. Prototyp. 2021, 16, S39–S52. [Google Scholar] [CrossRef]
- Cai, C.; Tey, W.S.; Chen, J.; Zhu, W.; Liu, X.; Liu, T.; Zhao, L.; Zhou, K. Comparative study on 3D printing of polyamide 12 by selective laser sintering and multi jet fusion. J. Mater. Process. Technol. 2021, 288, 116882. [Google Scholar] [CrossRef]
- Salmoria, G.V.; Leite, J.L.; Vieira, L.F.; Pires, A.T.N.; Roesler, C.R.M. Mechanical properties of PA6/PA12 blend specimens prepared by selective laser sintering. Polym. Test. 2012, 31, 411–416. [Google Scholar] [CrossRef] [Green Version]
- Stoia, D.I.; Marsavina, L.; Linul, E. Mode I fracture toughness of polyamide and alumide samples obtained by Selective Laser Sintering additive process. Polymers 2020, 12, 640. [Google Scholar] [CrossRef] [PubMed] [Green Version]
- Păcurar, R.; Berce, P.; Petrilak, A.; Nemeş, O.; Borzan, C.Ş.M.; Harničárová, M.; Păcurar, A. Selective Laser Melting of PA 2200 for Hip Implant Applications: Finite Element Analysis, Process Optimization, and Morphological and Mechanical Characterization. Materials 2021, 14, 4240. [Google Scholar] [CrossRef] [PubMed]
- Simha Martynková, G.; Slíva, A.; Kratošová, G.; Čech Barabaszová, K.; Študentová, S.; Klusák, J.; Brožová, S.; Dokoupil, T.; Holešová, S. Polyamide 12 Materials Study of Morpho-Structural Changes during Laser Sintering of 3D Printing. Polymers 2021, 13, 810. [Google Scholar] [CrossRef]
- Nakonieczny, D.S.; Kern, F.; Dufner, L.; Antonowicz, M.; Matus, K. Alumina and Zirconia-Reinforced Polyamide PA-12 Composites for Biomedical Additive Manufacturing. Materials 2021, 14, 6201. [Google Scholar] [CrossRef]
- Hao, W.; Liu, Y.; Wang, T.; Guo, G.; Chen, H.; Fang, D. Failure analysis of 3D printed glass fiber/PA12 composite lattice structures using DIC. Compos. Struct. 2019, 225, 111192. [Google Scholar] [CrossRef]
- Bochnia, J.; Blasiak, M.; Kozior, T. Tensile strength analysis of thin-walled polymer glass fiber reinforced samples manufactured by 3D printing technology. Polymers 2020, 12, 2783. [Google Scholar] [CrossRef]
- Dzienniak, D.; Pawlik, J. Analysis of the surface quality of polycaprolactam 3D prints enriched with carbon and glass fiber. In MATEC Web of Conferences; EDP Sciences: Les Ulis, France, 2021; Volume 338. [Google Scholar]
- Ranganathan, S.; Thangaraj, H.N.R.S.; Vasudevan, A.K.; Shanmugan, D.K. Analogy of Thermal Properties of Polyamide 6 Reinforced with Glass Fiber and Glass Beads through FDM Process. SAE Tech. Pap. 2019, 5, 0137. [Google Scholar]
- Imaeda, Y.; Todoroki, A.; Matsuzaki, R.; Ueda, M.; Hirano, Y. Modified Moving Particle Semi-implicit Method for 3D Print Process Simulations of Short Carbon Fiber/Polyamide-6 Composites. Compos. Part C Open Access 2021, 6, 100195. [Google Scholar] [CrossRef]
- Iizuka, K.; Todoroki, A.; Takahashi, T.; Ueda, M. Reverse piezo-resistivity of 3D printed continuous carbon fiber/PA6 composites in a low stress range. Adv. Compos. Mater. 2021, 30, 380–395. [Google Scholar] [CrossRef]
- Liu, T.; Tian, X.; Zhang, Y.; Cao, Y.; Li, D. High-pressure interfacial impregnation by micro-screw in-situ extrusion for 3D printed continuous carbon fiber reinforced nylon composites. Compos. Part A Appl. Sci. Manuf. 2020, 130, 105770. [Google Scholar] [CrossRef]
- Liao, G.; Li, Z.; Cheng, Y.; Xu, D.; Zhu, D.; Jiang, S.; Guo, J.; Chen, X.; Xu, G.; Zhu, Y. Properties of oriented carbon fiber/polyamide 12 composite parts fabricated by fused deposition modeling. Mater. Des. 2018, 139, 283–292. [Google Scholar] [CrossRef]
- Van de Werken, N.; Tekinalp, H.; Khanbolouki, P.; Ozcan, S.; Williams, A.; Tehrani, M. Additively manufactured carbon fiber-reinforced composites: State of the art and perspective. Addit. Manuf. 2020, 31, 100962. [Google Scholar] [CrossRef]
- Zhou, W.D.; Chen, J.S. 3D printing of carbon fiber reinforced plastics and their applications. In Materials Science Forum; Trans Tech Publ.: Bäch, Switzerland, 2018; Volume 913, pp. 558–563. [Google Scholar]
- Batistella, M.; Pucci, M.; Regazzi, A.; Lopez-Cuesta, J.-M.; Kadri, O.; Bordeaux, D. PA 12 nanocomposites and flame retardants compositions processed through selective laser sintering. In Proceedings of the Eurofillers Polymerblends 2019, Palermo, Italy, 23–26 April 2019. [Google Scholar]
- Batistella, M.; Regazzi, A.; Pucci, M.F.; Lopez-Cuesta, J.-M.; Kadri, O.; Bordeaux, D.; Ayme, F. Selective laser sintering of polyamide 12/flame retardant compositions. Polym. Degrad. Stab. 2020, 181, 109318. [Google Scholar] [CrossRef]
- Navale, S.V. Feasibility Study of Thermoplastic Nanocomposite for ESD Applications Using Additive Manufacturing. Master’s Thesis, Texas State University, San Marcos, TX, USA, 2018. [Google Scholar]
- Espera, A.H., Jr.; Valino, A.D.; Palaganas, J.O.; Souza, L.; Chen, Q.; Advincula, R.C. 3D Printing of a Robust Polyamide-12-Carbon Black Composite via Selective Laser Sintering: Thermal and Electrical Conductivity. Macromol. Mater. Eng. 2019, 304, 1800718. [Google Scholar] [CrossRef]
- PA 12—PA2200: Nylon for Industrial 3D Printing|EOS GmbH. Polyamide 12 for 3D Printing. Available online: https://www.eos.info/en/additive-manufacturing/3d-printing-plastic/sls-polymer-materials/polyamide-pa-12-alumide (accessed on 11 March 2021).
- ALM—Advanced Laser Materials. PA 640—GSL. Available online: https://www.advancedlasermaterials.com/wp-content/uploads/2021/05/PA-640-GSL-Data-Sheet-2021.pdf (accessed on 15 March 2021).
- EOS GmbH—Electro Optical Systems. EOS Parameter Sheet. Machine, Software and Material Parameters. Available online: https://3dagainstcorona.eos.info/subdomain/subdomain_corona/pdf/shield_parameter_sheet.pdf (accessed on 15 March 2021).
- EOS GmbH. SLS Printer FORMIGA P 110 Velocis. Available online: https://www.eos.info/en/additive-manufacturing/3d-printing-plastic/eos-polymer-systems/formiga-p-110-velocis (accessed on 15 March 2021).
- EOS GmbH. Plastic 3D Printer for Industrial Applications. Available online: https://www.eos.info/en/additive-manufacturing/3d-printing-plastic/eos-polymer-systems/eos-p-396 (accessed on 15 March 2021).
- ISO 527-1:2019; Plastics—Determination of Tensile Properties—Part 1: General Principles. ISO: Prague, Czech Republic, 2019.
- ISO 25178:2016; Geometrical Product Specifications (GPS)—Surface Texture: Areal—Part 1: Indication of Surface Texture. ISO: Brussels, Belgium, 2016.
- Schmid, M.; Amado, A.; Wegener, K. Polymer powders for selective laser sintering (SLS). In AIP Conference Proceedings; AIP Publishing LLC: Arlington, TX, USA, 2015; Volume 1664, p. 160009. [Google Scholar]
- Rhee, S.; White, J.L. Crystal structure and morphology of biaxially oriented polyamide 12 films. J. Polym. Sci. Part B Polym. Phys. 2002, 40, 1189–1200. [Google Scholar] [CrossRef]
- Kwaśniewska, A.; Chocyk, D.; Gładyszewski, G.; Borc, J.; Świetlicki, M.; Gładyszewska, B. The influence of kaolin clay on the mechanical properties and structure of thermoplastic starch films. Polymers 2020, 12, 73. [Google Scholar] [CrossRef] [Green Version]
- Chacón, J.M.; Caminero, M.A.; Núñez, P.J.; García-Plaza, E.; García-Moreno, I.; Reverte, J.M. Additive manufacturing of continuous fibre reinforced thermoplastic composites using fused deposition modelling: Effect of process parameters on mechanical properties. Compos. Sci. Technol. 2019, 181, 107688. [Google Scholar] [CrossRef]
- Alscher, G. Das Verhalten teilkristalliner Thermoplaste Beim Lasersintern; Universität-GH Essen: Aachen, Germany, 2000. [Google Scholar]
- Stieß, M. Mechanische Verfahrenstechnik-Partikeltechnologie 1; Springer: Berlin/Heidelberg, Germany, 2008; ISBN 3540325522. [Google Scholar]
- Salmoria, G.V.; Leite, J.L.; Ahrens, C.H.; Lago, A.; Pires, A.T.N. Rapid manufacturing of PA/HDPE blend specimens by selective laser sintering: Microstructural characterization. Polym. Test. 2007, 26, 361–368. [Google Scholar] [CrossRef]
- Tiwari, S.K.; Pande, S.; Agrawal, S.; Bobade, S.M. Selection of selective laser sintering materials for different applications. Rapid Prototyp. J. 2015, 21, 630–648. [Google Scholar] [CrossRef]
- Negi, S.; Dhiman, S.; Sharma, R.K. Investigating the surface roughness of SLS fabricated glass-filled polyamide parts using response surface methodology. Arab. J. Sci. Eng. 2014, 39, 9161–9179. [Google Scholar] [CrossRef]
- Jing, W.; Hui, C.; Qiong, W.; Hongbo, L.; Zhanjun, L. Surface modification of carbon fibers and the selective laser sintering of modified carbon fiber/nylon 12 composite powder. Mater. Des. 2017, 116, 253–260. [Google Scholar] [CrossRef]
- Zhou, H.; Götzinger, M.; Peukert, W. The influence of particle charge and roughness on particle–substrate adhesion. Powder Technol. 2003, 135, 82–91. [Google Scholar] [CrossRef]
- Toth-Taşcău, M.; Raduta, A.; Stoia, D.I.; Locovei, C. Influence of the energy density on the porosity of Polyamide parts in SLS process. In Solid State Phenomena; Trans Tech Publ.: Bäch, Switzerland, 2012; Volume 188, pp. 400–405. [Google Scholar]
- Korifi, R.; Le Dréau, Y.; Antinelli, J.-F.; Valls, R.; Dupuy, N. CIEL⁎ a⁎ b⁎ color space predictive models for colorimetry devices–Analysis of perfume quality. Talanta 2013, 104, 58–66. [Google Scholar] [CrossRef]
- Bian, L.; Taheri, F.; Lu, Y. Analytical and experimental evaluations of the influence of fracture surface roughness, its sliding actions and the associated plasticity on fatigue crack propagation. Int. J. Plast. 2008, 24, 302–326. [Google Scholar] [CrossRef]
- Alsoufi, M.S.; Elsayed, A.E. How surface roughness performance of printed parts manufactured by desktop FDM 3D printer with PLA+ is influenced by measuring direction. Am. J. Mech. Eng. 2017, 5, 211–222. [Google Scholar]
- Extrand, C.W. Model for contact angles and hysteresis on rough and ultraphobic surfaces. Langmuir 2002, 18, 7991–7999. [Google Scholar] [CrossRef]
- Baschek, G.; Hartwig, G.; Zahradnik, F. Effect of water absorption in polymers at low and high temperatures. Polymer 1999, 40, 3433–3441. [Google Scholar] [CrossRef]
- Ma, Y.; Cao, X.; Feng, X.; Ma, Y.; Zou, H. Fabrication of super-hydrophobic film from PMMA with intrinsic water contact angle below 90. Polymer 2007, 48, 7455–7460. [Google Scholar] [CrossRef]
- Modi, U.; Prakash, S. Wettability of 3D printed polylactic acid (PLA) parts. In AIP Conference Proceedings; AIP Publishing LLC: Arlington, TX, USA, 2019; Volume 2148, p. 30052. [Google Scholar]
- Do, V.-T.; Nguyen-Tran, H.-D.; Chun, D.-M. Effect of polypropylene on the mechanical properties and water absorption of carbon-fiber-reinforced-polyamide-6/polypropylene composite. Compos. Struct. 2016, 150, 240–245. [Google Scholar] [CrossRef]
- Xu, Z.; Wang, Y.; Wu, D.; Ananth, K.P.; Bai, J. The process and performance comparison of polyamide 12 manufactured by multi jet fusion and selective laser sintering. J. Manuf. Process. 2019, 47, 419–426. [Google Scholar] [CrossRef]
- Hou, G.; Zhu, H.; Xie, D. The Influence of SLS Process Parameters on the Tensile Strength of PA2200 Powder. In IOP Conference Series: Earth and Environmental Science; IOP Publishing: Bristol, UK, 2020; Volume 571, p. 12111. [Google Scholar]
- Scrivener, K.; Ouzia, A.; Juilland, P.; Mohamed, A.K. Advances in understanding cement hydration mechanisms. Cem. Concr. Res. 2019, 124, 105823. [Google Scholar] [CrossRef]


| Material | New Powder/wt.% | Old Powder/wt.% |
|---|---|---|
| PA_2200 | 50 | 50 |
| PA_2210_FR | 100 | - |
| PA_3200_GF | 70 | 30 |
| PA_Alumide | 100 | - |
| PA_640_GSL | 70 | 30 |
| Technical Data | EOS P 396 |
|---|---|
| Construction volume (dimensions) | 340 × 340 × 620 mm3 |
| Building rate | up to 3 L·h−1 * |
| Laser type and power | CO2, 70 W |
| Precision optics | F-theta lens, high-speed scanner |
| Scan speed | up to 6 m·s−1 |
| Polyamide Powders | Layer Thickness/mm | Temperatures/°C | Beam Offset/mm | Material Dependent Scaling/% | ||||
|---|---|---|---|---|---|---|---|---|
| Process Chamber | Removal Chamber | X | Y | Z (0) | Z (600) | |||
| PA_2200 | 0.12 | 171 | 130 | 0.35 | 3.20 | 3.20 | 2.55 | 1.40 |
| PA_2210_FR | 178 | 0.33 | 2.40 | 2.40 | 1.70 | 1.20 | ||
| PA_3200_GF | 180 | 0.31 | 3.40 | 3.40 | 2.20 | 1.60 | ||
| PA_Alumide | 178 | 0.33 | 2.00 | 2.20 | 1.50 | 1.10 | ||
| PA_640_GSL | 175 | 0.36 | 1.15 | 2.15 | 2.80 | 1.60 | ||
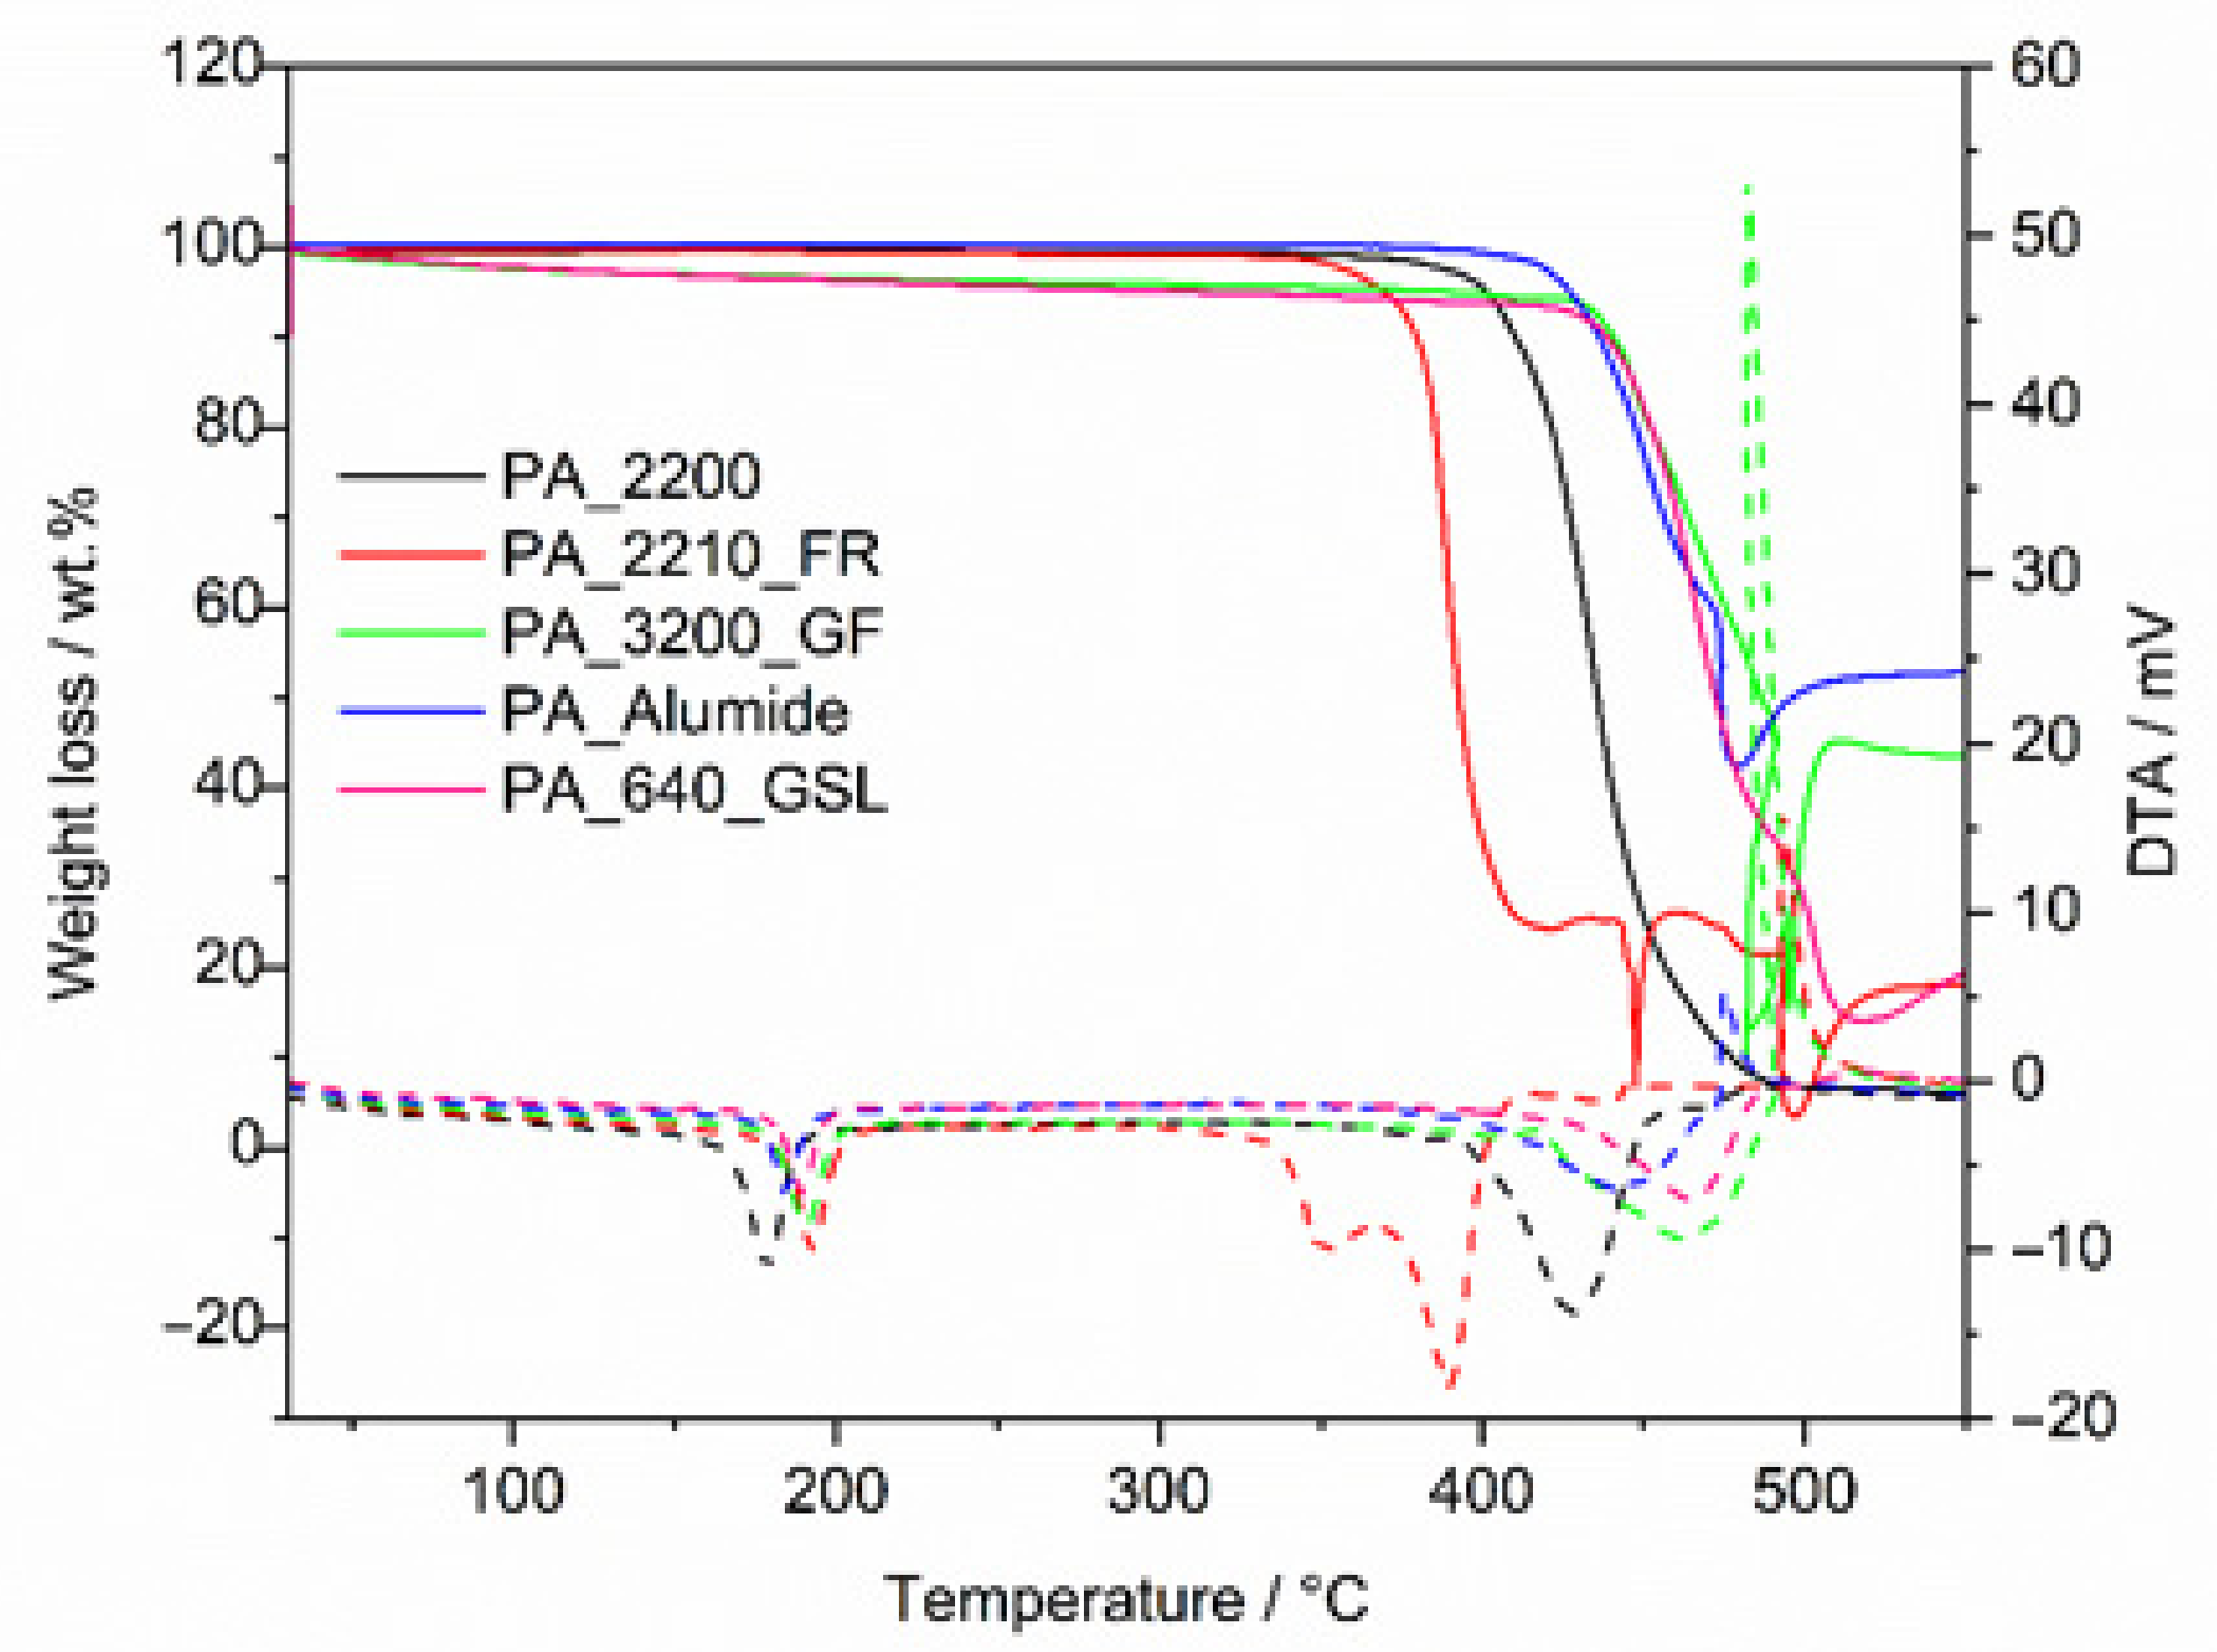
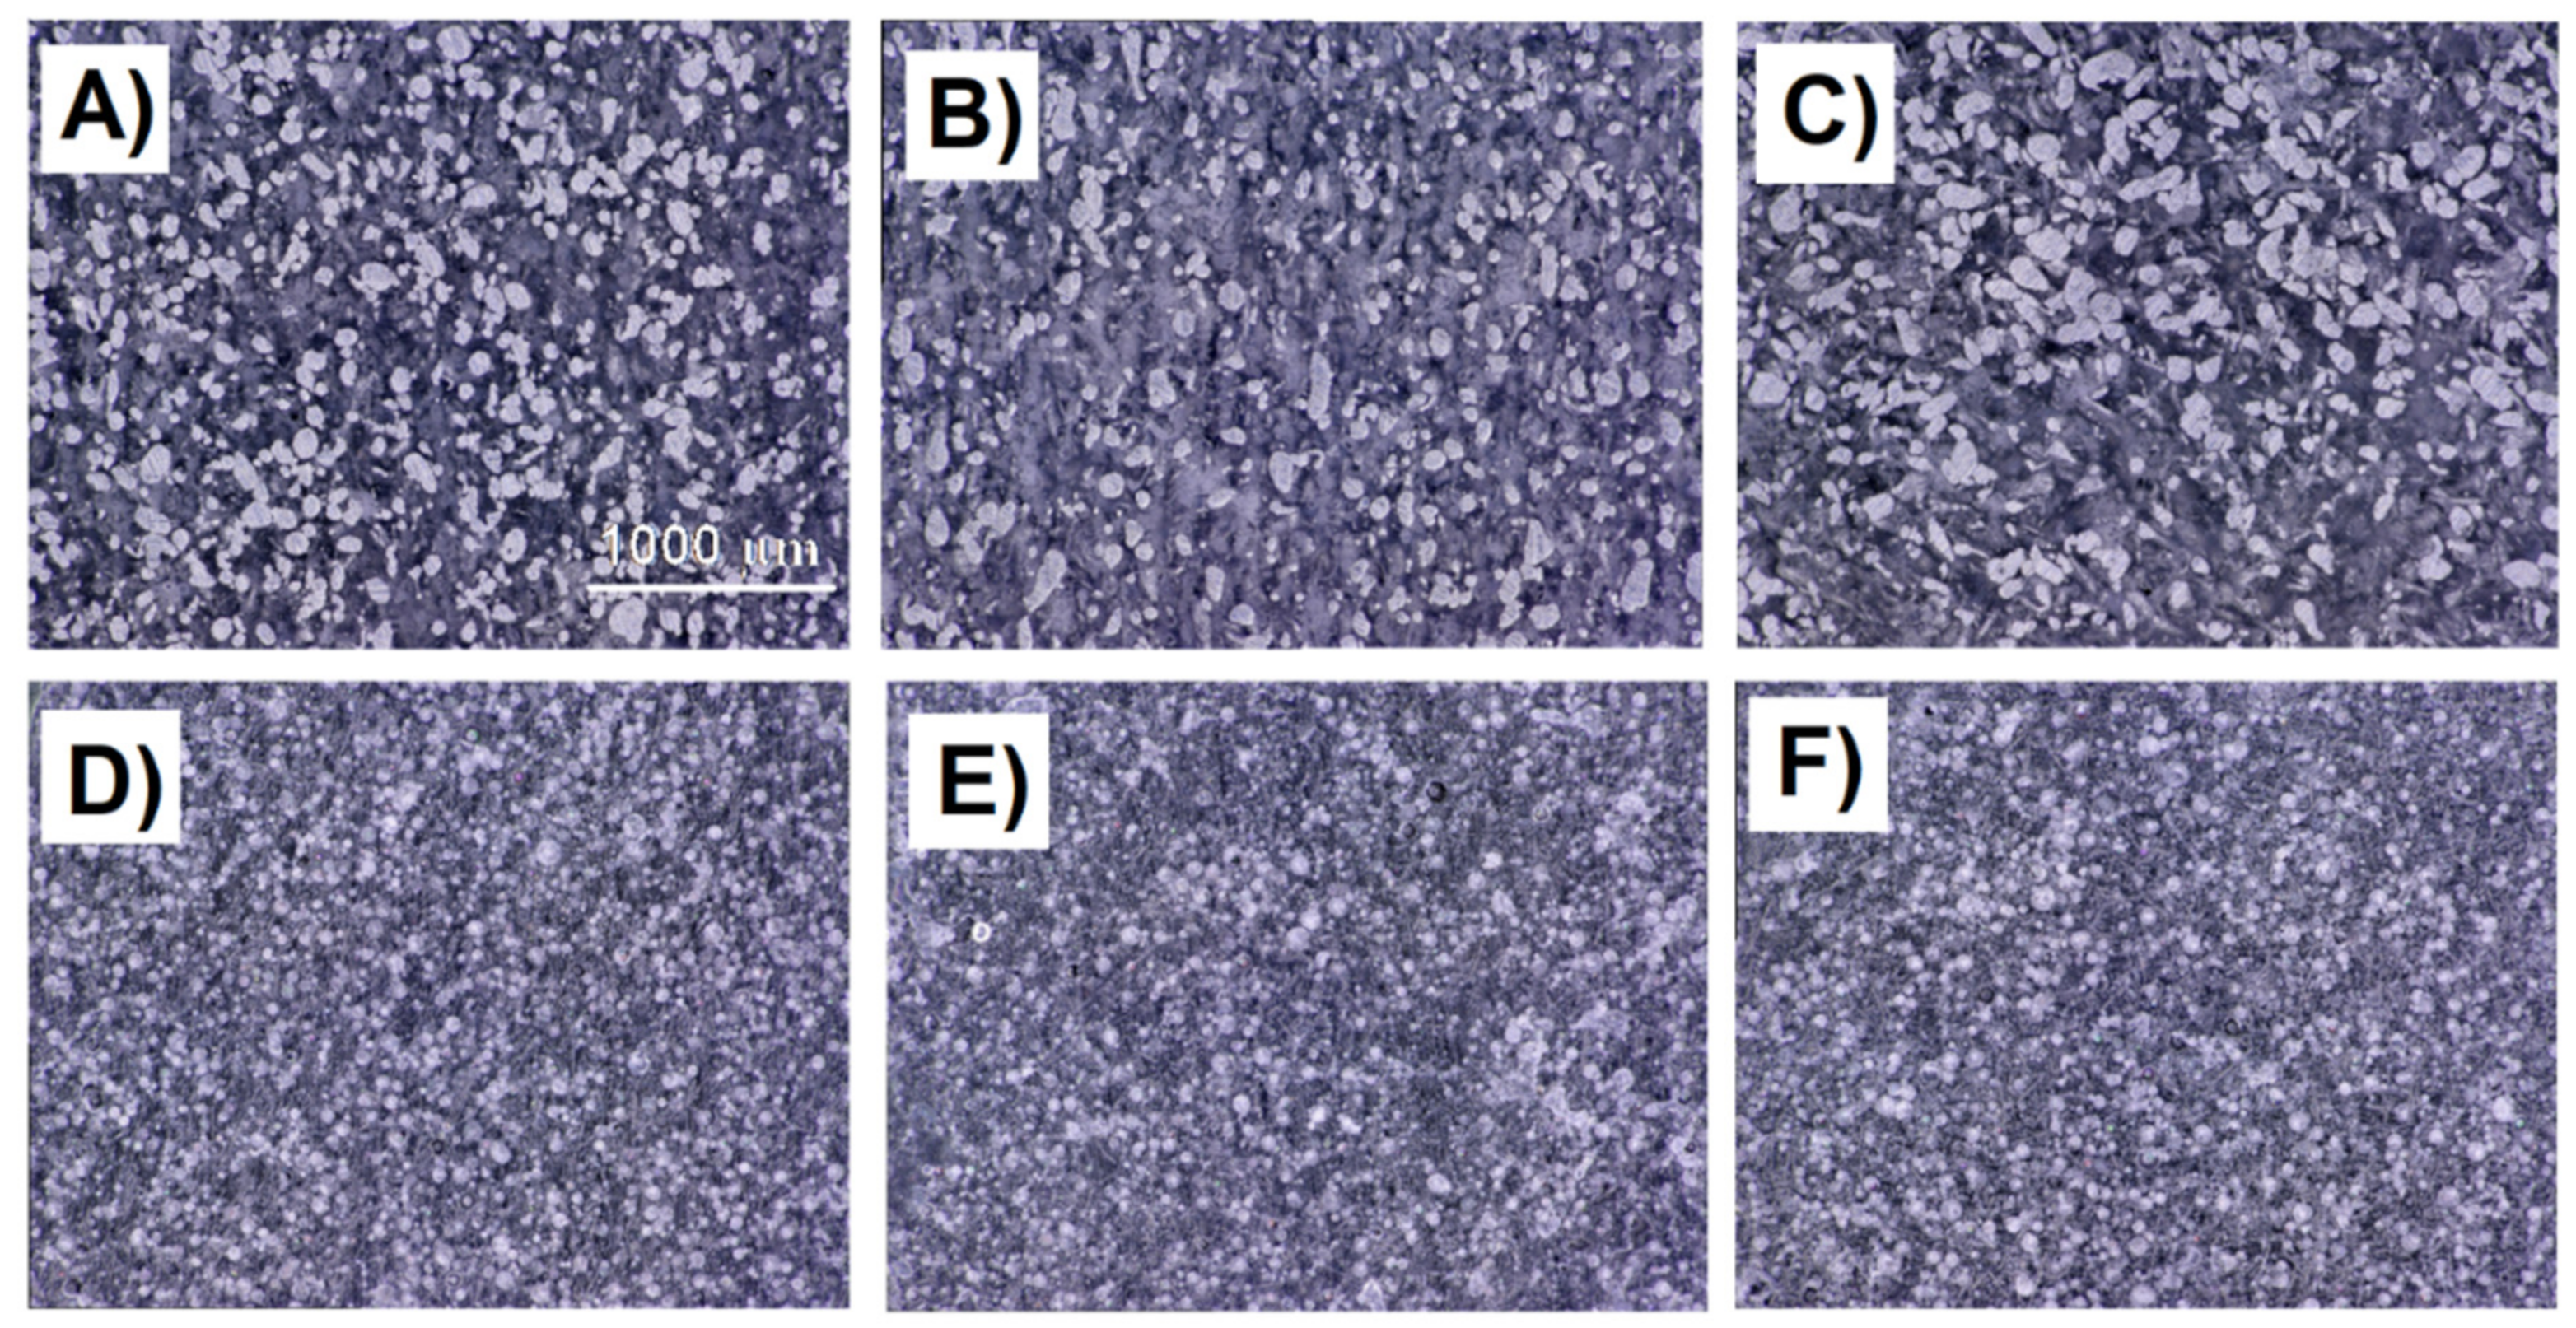
| Sample | Melting Point/°C | Tmax/°C | Additive Content/wt.% | AVG Size of Particle/µm |
|---|---|---|---|---|
| PA_2200 | 176.5 | 431.7 | - | 67.81 |
| PA_2210_FR | 186.9 | 383.7 | 11.38 | 53.94 |
| PA_3200_GF | 188.5 | 443.9 | 42.10 | 88.93 |
| PA_Alumide | 184.7 | 449.8 | 54.71 | 56.81 |
| PA_640_GSL | 184.2 | 460.2 | 22.84 | 26.81 |
| Sample | Print Orientation | L* | a* | b* | ΔE* |
|---|---|---|---|---|---|
| PA_2200 | A1 | 71.11 | 6.63 | −24.26 | * |
| B1 | 71.73 | 6.26 | −24.89 | * | |
| G1 | 69.75 | 6.50 | −25.49 | * | |
| PA_2210_FR | A1 | 69.16 | 6.65 | −24.19 | 1.95 |
| B1 | 69.78 | 6.99 | −23.95 | 2.28 | |
| G1 | 69.57 | 7.02 | −26.67 | 1.30 | |
| PA_3200_GF | A1 | 65.53 | 5.26 | −20.32 | 6.97 |
| B1 | 65.56 | 6.93 | −25.69 | 6.26 | |
| G1 | 65.05 | 11.03 | −24.19 | 6.66 | |
| PA_Alumide | A1 | 61.36 | 4.21 | −19.99 | 10.92 |
| B1 | 62.96 | 5.18 | −21.72 | 11.04 | |
| G1 | 62.28 | 6.55 | −20.13 | 9.19 | |
| PA_640_GSL | A1 | 67.64 | 8.63 | −25.95 | 4.35 |
| B1 | 67.43 | 8.87 | −26.09 | 5.17 | |
| G1 | 67.65 | 6.66 | −21.60 | 4.42 |
| Sample | Print Orientation | Mean Roughness Value, Ra/µm | Mean Roughness Depth, Rz/µm | Contact Angle/° | Water Absorption/wt.% |
|---|---|---|---|---|---|
| PA_2200 | A1 | 12.1 ± 0.03 | 74.7 ± 0.02 | 89.4 ± 6.6 | 0.62 ± 0.17 |
| B1 | 12.8 ± 0.01 | 72.5 ± 0.03 | 96.4 ± 3.4 | ||
| G1 | 25.3 ± 0.03 | 120.8 ± 0.05 | 110.5 ± 3.3 | ||
| PA_2210_FR | A1 | 8.6 ± 0.01 | 87.3 ± 0.03 | 89.9 ± 4.8 | 1.00 ± 0.21 |
| B1 | 6.6 ± 0.01 | 64.4 ± 0.02 | 97.7 ± 2.3 | ||
| G1 | 18.4 ± 0.03 | 91.3 ± 0.04 | 98.4 ± 6.2 | ||
| PA_3200_GF | A1 | 9.8 ± 0.02 | 49.8 ± 0.03 | 86.2 ± 5.3 | 0.59 ± 0.05 |
| B1 | 12.4 ± 0.02 | 73.4 ± 0.02 | 94.5 ± 2.9 | ||
| G1 | 18.4 ± 0.03 | 91.3 ± 0.03 | 100.3 ± 6.2 | ||
| PA_Alumide | A1 | 9.1 ± 0.01 | 50.2 ± 0.03 | 85.9 ± 4.9 | 0.61 ± 0.33 |
| B1 | 9.9 ± 0.01 | 51.8 ± 0.01 | 86.6 ± 4.7 | ||
| G1 | 25.4 ± 0.03 | 120.2 ± 0.04 | 92.3 ± 5.6 | ||
| PA_640_GSL | A1 | 9.1 ± 0.01 | 49.5 ± 0.03 | 90.7 ± 9.9 | 1.08 ± 0.08 |
| B1 | 13.1 ± 0.02 | 54.9 ± 0.03 | 96.6 ± 4.9 | ||
| G1 | 15.1 ± 0.03 | 85.1 ± 0.02 | 85.7 ± 7.6 |
| Sample | Print Orientation | Tensile Strength/MPa | Young’s Modulus/MPa |
|---|---|---|---|
| PA_2200 | A1 | 44.4 ± 0.9 | 1387.4 ± 51 |
| B1 | 43.2 ± 0.4 | 1290.1 ± 26 | |
| G1 | 39.5 ± 2.4 | 1339.2 ± 23 | |
| PA_2210_FR | A1 | 34.9 ± 0.2 | 2024.9 ± 30 |
| B1 | 35.3 ± 0.4 | 1986.4 ± 60 | |
| G1 | 31.4 ± 0.2 | 1867.4 ± 44 | |
| PA_3200_GF | A1 | 31.9 ± 0.7 | 2362.8 ± 74 |
| B1 | 32.8 ± 0.5 | 2211.5 ± 97 | |
| G1 | 32.2 ± 1.0 | 2180.3 ± 46 | |
| PA_Alumide | A1 | 33.9 ± 1.1 | 2660.1 ± 127 |
| B1 | 33.8 ± 0.4 | 2492.9 ± 127 | |
| G1 | 32.9 ± 0.6 | 2570.9 ± 31 | |
| PA_640_GSL | A1 | 30.8 ± 0.9 | 1996.3 ± 43 |
| B1 | 33.8 ± 1.2 | 2306.5 ± 37 | |
| G1 | 26.5 ± 0.4 | 1807.4 ± 19 |
| Sample | Print Orientation | Width Difference/% | Thickness Difference/% | Weight/g |
|---|---|---|---|---|
| PA_2200 | A1 | 0.60 ± 0.02 | 5.43 ± 0.02 | 9.68 ± 0.11 |
| B1 | 0.91 ± 0.02 | 5.98 ± 0.02 | ||
| G1 | 0.47 ± 0.06 | 2.73 ± 0.07 | ||
| PA_2210_FR | A1 | −0.15 ± 0.01 | −2.73 ± 0.02 | 10.72 ± 0.05 |
| B1 | 0.18 ± 0.02 | 0.13 ± 0.02 | ||
| G1 | 1.65 ± 0.02 | 5.98 ± 0.03 | ||
| PA_3200_GF | A1 | −0.72 ± 0.02 | −4.27 ± 0.03 | 12.19 ± 0.07 |
| B1 | −0.31 ± 0.02 | −1.85 ± 0.01 | ||
| G1 | 0.66 ± 0.02 | 4.10 ± 0.02 | ||
| PA_Alumide | A1 | −4.20 ± 0.40 | −4.12 ± 0.02 | 12.93 ± 0.15 |
| B1 | −1.83 ± 0.02 | −2.40 ± 0.04 | ||
| G1 | −0.71 ± 0.03 | −0.67 ± 0.02 | ||
| PA_640_GSL | A1 | 2.39 ± 0.05 | 10.87 ± 0.06 | 8.96 ± 0.08 |
| B1 | 2.77 ± 0.11 | 14.17 ± 0.08 | ||
| G1 | 2.23 ± 0.04 | 3.52 ± 0.03 |
Publisher’s Note: MDPI stays neutral with regard to jurisdictional claims in published maps and institutional affiliations. |
© 2022 by the authors. Licensee MDPI, Basel, Switzerland. This article is an open access article distributed under the terms and conditions of the Creative Commons Attribution (CC BY) license (https://creativecommons.org/licenses/by/4.0/).
Share and Cite
Zárybnická, L.; Petrů, J.; Krpec, P.; Pagáč, M. Effect of Additives and Print Orientation on the Properties of Laser Sintering-Printed Polyamide 12 Components. Polymers 2022, 14, 1172. https://doi.org/10.3390/polym14061172
Zárybnická L, Petrů J, Krpec P, Pagáč M. Effect of Additives and Print Orientation on the Properties of Laser Sintering-Printed Polyamide 12 Components. Polymers. 2022; 14(6):1172. https://doi.org/10.3390/polym14061172
Chicago/Turabian StyleZárybnická, Lucie, Jana Petrů, Pavel Krpec, and Marek Pagáč. 2022. "Effect of Additives and Print Orientation on the Properties of Laser Sintering-Printed Polyamide 12 Components" Polymers 14, no. 6: 1172. https://doi.org/10.3390/polym14061172
APA StyleZárybnická, L., Petrů, J., Krpec, P., & Pagáč, M. (2022). Effect of Additives and Print Orientation on the Properties of Laser Sintering-Printed Polyamide 12 Components. Polymers, 14(6), 1172. https://doi.org/10.3390/polym14061172