
Improving Layer Adhesion of Co-Extruded Polymer Sheets by Inducing Interfacial Flow Instabilities

 , , ,
, , ,
Abstract
:
1. Introduction
2. Materials and Methods
2.1. Materials
2.2. Co-Extrusion
2.2.1. Equipment
2.2.2. Screw Characteristics
2.2.3. Processing Conditions
3. Adhesion Experiments
4. Spectroscopic Analysis
4.1. Raman Imaging and Set-Up
4.2. Interface of the Co-Extruded Samples
4.3. Investigation of the Development of a Multilayer in the Flow Domain
5. Conclusions
Author Contributions
Funding
Data Availability Statement
Conflicts of Interest
References
- Chung, C.I. Extrusion of Polymers, 3rd ed.; Hanser Publishers: Munich, Germany, 2020; pp. 395–406. [Google Scholar]
- Hopmann, C.; Michaeli, W. Extrusion Die for Plastics and Rubber, 4th ed.; Hanser Publishers: Munich, Germany, 2016; pp. 223–289. [Google Scholar]
- Awaja, F.; Gilbert, M.; Kelly, G.; Fox, B.; Pigram, P.J. Adhesion of Polymers. Prog. Polym. Sci. 2009, 34, 948–968. [Google Scholar] [CrossRef]
- Vynckier, A.; Dierickx, L.; Voorspoels, J.; Gonnissen, Y.; Remon, J.P.; Vervaet, C. Hot-melt co-extrusion: Requirements, challenges and opportunities for pharmaceutical applications. J. Pharm. Pharmacol. 2013, 66, 167–179. [Google Scholar] [CrossRef] [PubMed]
- Voyutskii, S.S.; Vakula, V.L. The Role of Diffusion Phenomena in Polymer-to-Polymer Adhesion. J. Appl. Polym. Sci. 1963, 7, 475–491. [Google Scholar] [CrossRef]
- Klein, J. The Interdiffusion of Polymers. Science 1990, 250, 640–646. [Google Scholar] [CrossRef] [PubMed]
- Giles, H.F.; Wagner, J.R.; Mount, E.M. Extrusion: The Definitive Processing Guide and Handbook; William Andrew, Inc.: Norwich, CT, USA, 2005; pp. 373–423. [Google Scholar]
- Wagner, J.R. Multilayer Flexible Packaging, 1st ed.; William Andrew, Inc.: Oxford, UK, 2010; pp. 215–216. [Google Scholar]
- Kim, J.K.; Han, C.D. Polymer-Polymer Interdiffusion During Coextrusion. Polym. Eng. Sci. 1991, 31, 258–269. [Google Scholar] [CrossRef]
- Lamnawar, K.; Zhang, H.; Maazouz, A. Coextrusion of Multilayer Structures, Interfacial Phenomena. In Encyclopedia of Polymer Science and Technology, 4th ed.; John Wiley & Sons Inc.: Hoboken, NJ, USA, 2013; pp. 36–38. [Google Scholar] [CrossRef]
- Luger, H.-J.; Miethlinger, J. Development of an online rheometer for simultaneous measurement of shear and extensional viscosity during the polymer extrusion process. Polym. Test. 2019, 77, 105914. [Google Scholar] [CrossRef]
- Macosko, C.W. Rheology–Principles, Measurments, and Applications; Whiley: New York, NY, USA, 1994; ISBN 1-56081-579-5. [Google Scholar]
- Affenzeller, M.; Winkler, S.; Kronberger, G.; Kommenda, M.; Burlacu, B.; Wagner, S. Gaining Deeper Insights in Symbolic Regression. In Genetic Programming–Theory and Practice XI. Genetic and Evolutionary Computation; Riolo, R., Moore, J.H., Kotanchek, M., Eds.; Springer: New York, NY, USA, 2014. [Google Scholar] [CrossRef]
- Wagern, S.; Kronberger, G.; Beham, A.; Kommenda, M.; Scheibenpflug, A.; Pitzer, E.; Vonolefen, S.; Kofler, M.; Winkler, S.; Dorfer, V.; et al. Architecture and design of the HeuristicLab optimization environment. In Advanced Methods and Applications in Computational Intelligence; Klempous, R., Nikodem, J., Jacak, W., Chaczko, Z., Eds.; Springer: Berlin/Heidelberg, Germany, 2014. [Google Scholar] [CrossRef]
- Affenzeller, M.; Wagner, S.; Winkler, S.; Beham, A. Genetic Algorithms and Genetic Programming: Modern Concepts and Practical Applications; Chapman & Hall/CRC Press: New York, NY, USA, 2018; ISBN 978-1-58488-629-7. [Google Scholar]
- Klebstoffe–Bestimmung des Schälwiderstandes von Klebungen–Rollenschälversuch. 2010 (EN 1464). Available online: https://www.din.de/de/mitwirken/normenausschuesse/nmp/veroeffentlichungen/wdc-beuth:din21:125099945 (accessed on 26 December 2021).
- Gong, L.; Xiang, L.; Zhang, J.; Chen, J.; Zeng, H. Fundamentals and Advances in the Adhesion of Polymer Surfaces and Thin Films. Langmuir 2019, 35, 15914–15936. [Google Scholar] [CrossRef] [PubMed]
- Bruckmoser, K.; Resch, K.; Kisslinger, T.; Lucyshyn, T. Measurement of interdiffusion in polymeric materials by applying Raman spectroscopy. Polym. Test. 2015, 46, 122–133. [Google Scholar] [CrossRef]
- WITec GmbH. Project FIVE Handbook; WITec GmbH: Ulm, Germany, 2020. [Google Scholar]
- Tszganakis, B.; Perdikoulias, J. Interfacial Instabilities in Coextrusion Flows of Low-Density Polyethylenes: Experimental Studies. Polym. Eng. Sci. 2000, 40, 1056–1064. [Google Scholar] [CrossRef]
- Schrenk, W.J.; Bradley, N.L.; Alfrey, T.; Maack, H. Interfacial Flow Instabilities in Multilayer Coextrusion. Polym. Eng. Sci. 1978, 18, 620–623. [Google Scholar] [CrossRef]
- Han, C.D.; Shetty, R. Studies on Multilayer Film Coextrusion II. Interfacial Instability in Flat Film Coextrusion. Polym. Eng. Sci. 1978, 18, 180–186. [Google Scholar] [CrossRef]
- Zatloukal, M.; Kopytko, W.; Lengálóva, A.; Vlcek, J. Theoretical and Experimental Analysis of Interfacial Instabilities in Coextrusion Flows. J. Appl. Polm. Sci. 2005, 98, 153–162. [Google Scholar] [CrossRef]
- Hammer, A.; Roland, W.; Zacher, M.; Praher, B.; Hannesschläger, G.; Löw-Baselli, B.; Steinbichler, G. In Situ Detection of Interfacial Flow Instabilities in Polymer Co-Extrusion Using Optical Coherence Tomography and Ultrasonic Techniques. Polymers 2021, 13, 2880. [Google Scholar] [CrossRef] [PubMed]


| MFR (230 °C/2.16 kg) g·10 min−1 | Solid Density g·cm−3 | Bulk Density g·cm−3 | Melt Density g·cm−3 | |
|---|---|---|---|---|
| polymer | 0.30 | 0.900 | 0.516 | 0.745 |
| compound | 0.56 | 1.147 | 0.763 | 1.098 |
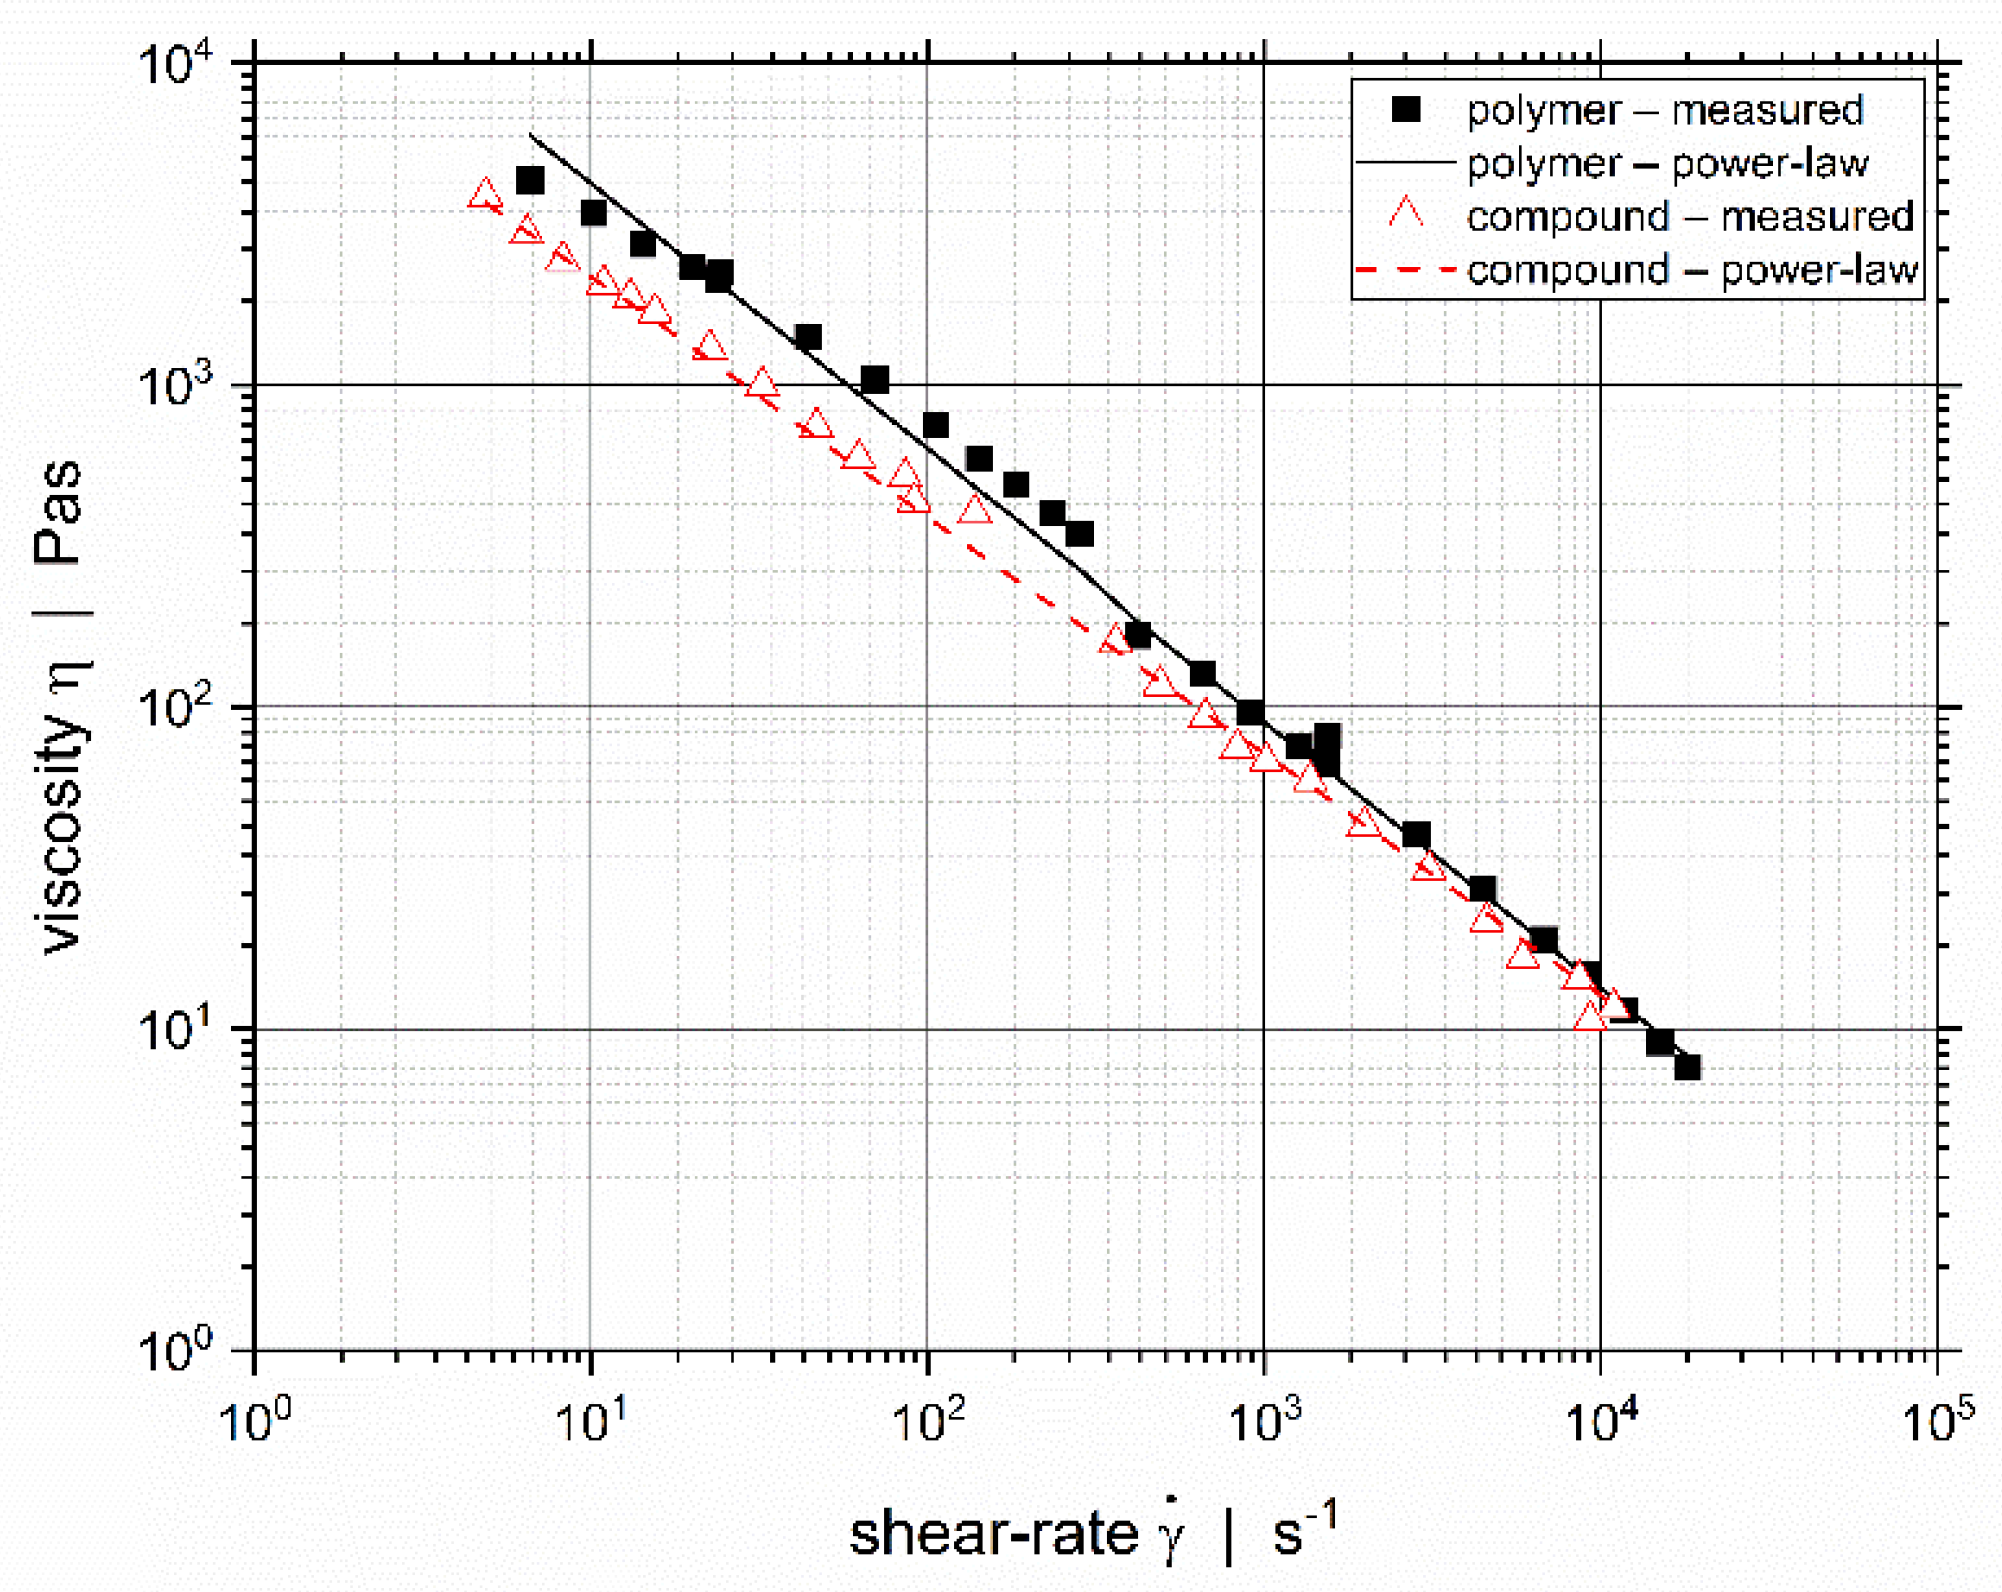
Pa·sn | - | °C | K−1 | |
|---|---|---|---|---|
| polymer | 28,658 | 0.163 | 240 | 0.00522 |
| compound | 11,373 | 0.257 | 240 | 0.00936 |
| Zone | Temperature °C |
|---|---|
| Feed-housing | Water-cooled |
| Extruder Zone 1 | 210 |
| Extruder Zone 2 | 230 |
| Extruder Zone 3 | 220 |
| Adapter | 210 |
| Feedblock | 210 |
| Extrusion die | 210 |
| Parameter | Unit | Min | Max | Divisions |
|---|---|---|---|---|
| Screw speed | rpm | 10 | 150 | 7 |
| Back-pressure | bar | 25 | 300 | 11 |
| Constant | Value | Constant | Value | Constant | Value |
|---|---|---|---|---|---|
| 0.010427 | −1.3905 × 10⁻⁴ | 0.0019322 | |||
| 1.0510 × 10⁻⁴ | 0.0028343 | −0.0025606 | |||
| 0.050902 | −0.0026408 | 0.073228 |
| Constant | Value | Constant | Value | Constant | Value |
|---|---|---|---|---|---|
| −0.056897 | 2.5372 × 10⁻⁴ | 4.4212 × 10⁻¹⁴ | |||
| 0.18002 | 5.4871 × 10⁻⁷ | −1.2538 × 10⁻¹¹ | |||
| −2.4022 × 10⁻⁴ | 1.7442 × 10⁻¹⁴ |
| Parameter | Unit | Polymer | Compound |
|---|---|---|---|
| - | 0.9979 | 0.9988 | |
| Mean absolute error MAE | kg/h | 0.1049 | 0.1545 |
| Mean relative error MRE | % | 2.303 | 2.475 |
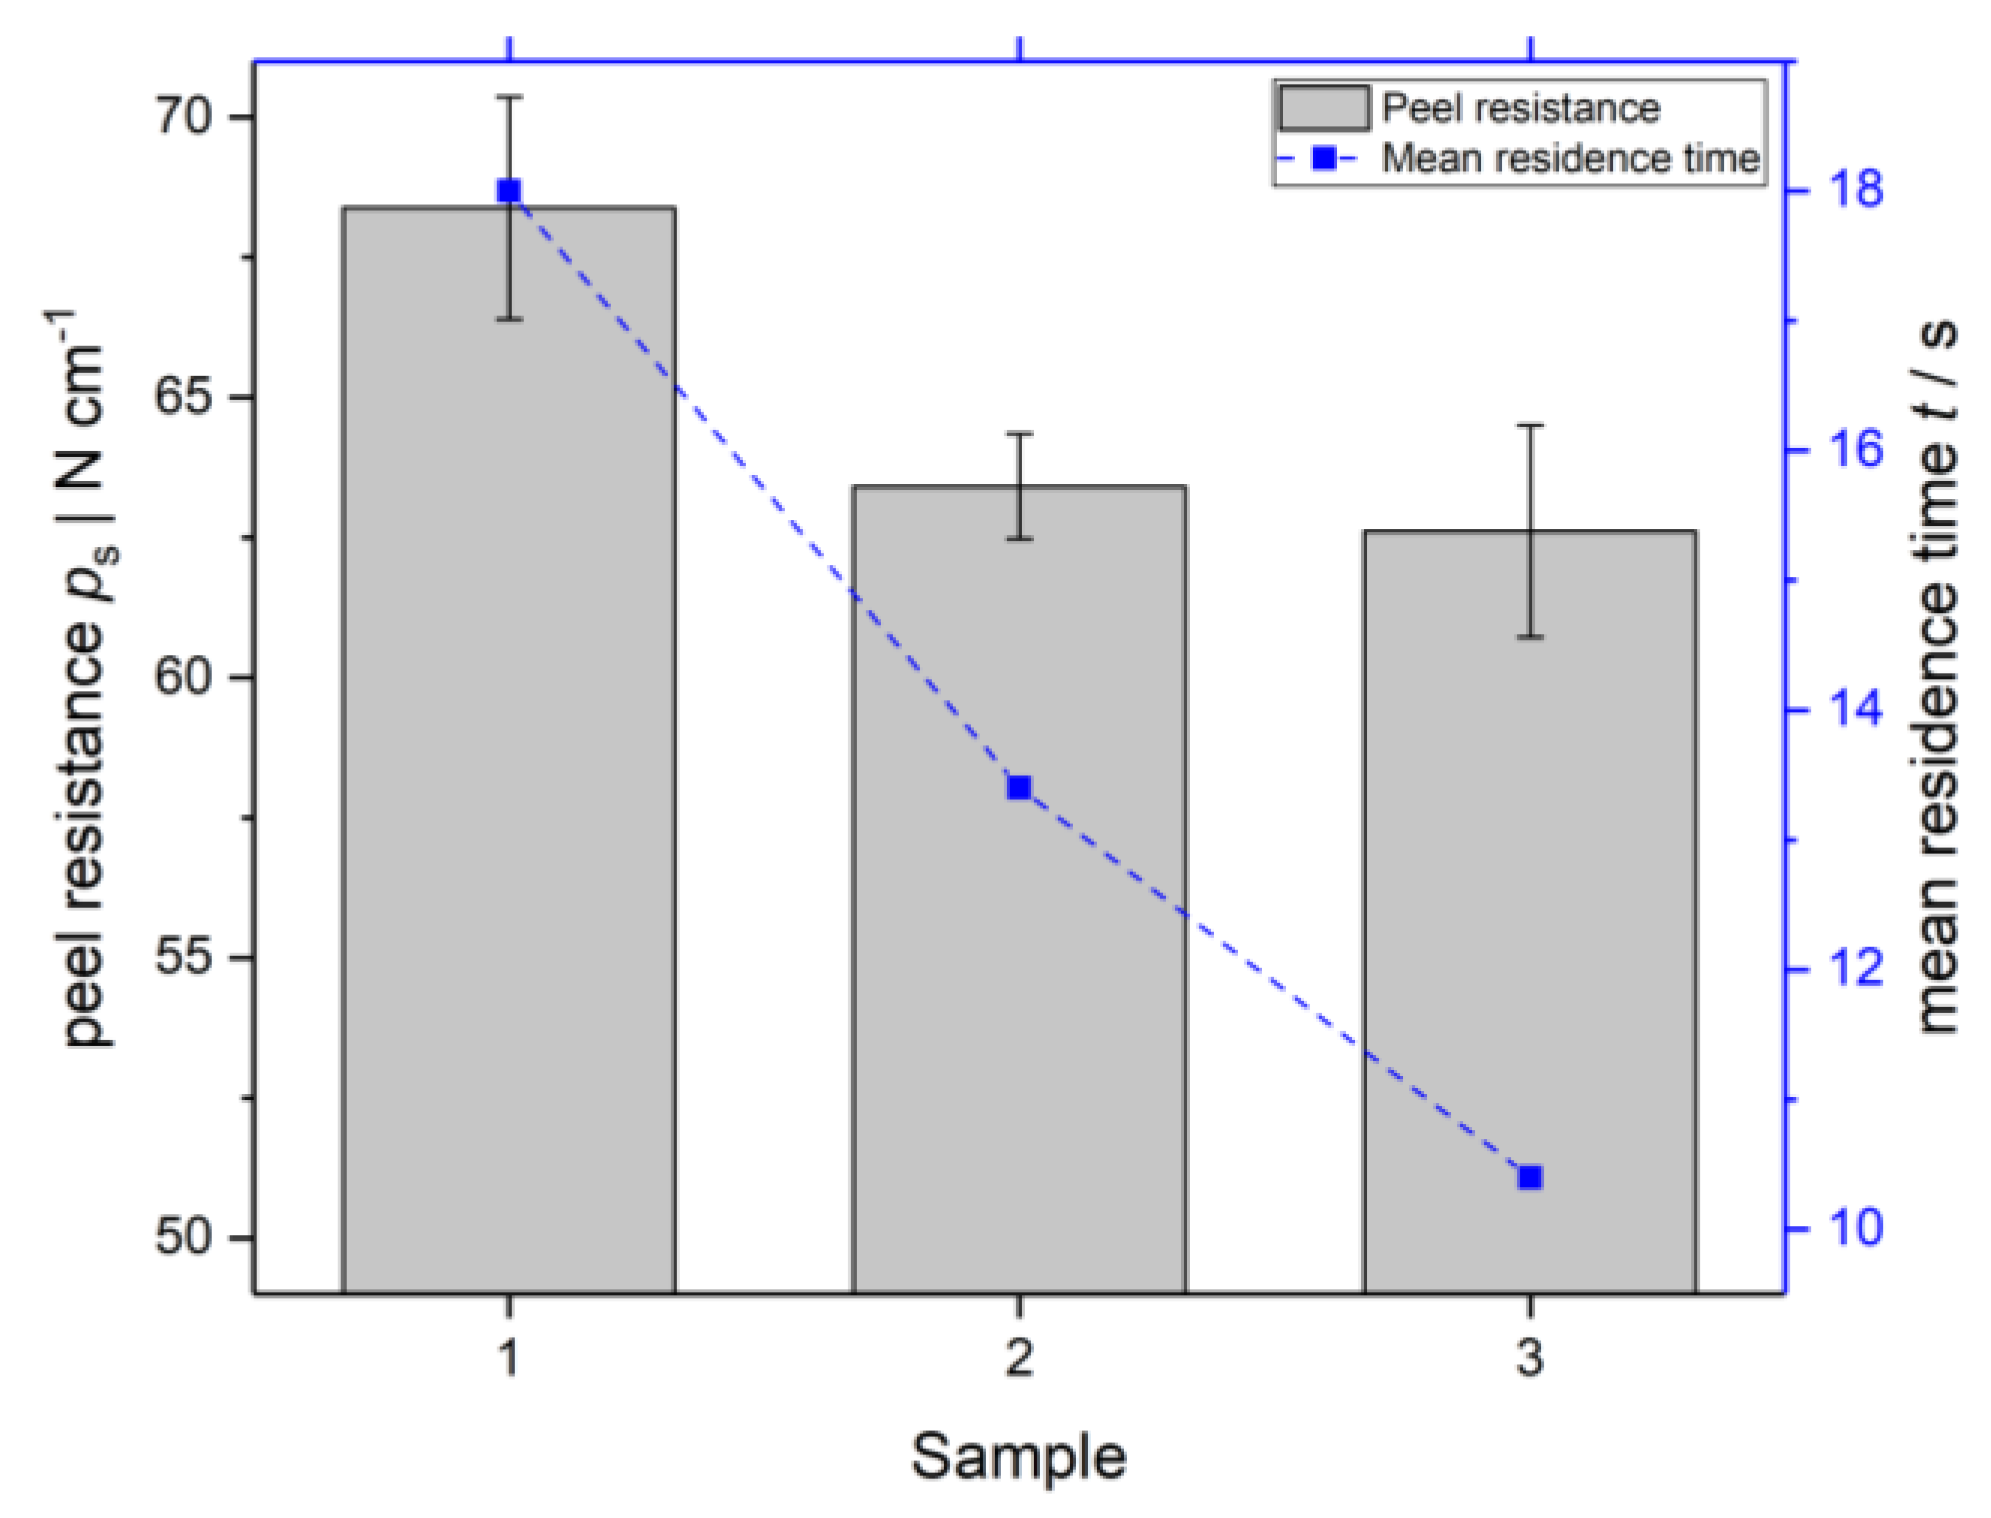
| Sample | kg·h−1 | kg·h−1 | kg·h−1 | mm | s | °C | °C |
|---|---|---|---|---|---|---|---|
| 1 | 2.3 | 9.2 | 11.5 | 1.6 | 18.0 | 242 | 241 |
| 2 | 3.1 | 12.3 | 15.4 | 13.4 | 242 | 241 | |
| 3 | 4.0 | 16.0 | 20.0 | 10.4 | 241 | 244 | |
| 4 | 2.3 | 9.2 | 11.5 | 1.2 | 17.2 | 242 | 241 |
| 5 | 3.1 | 12.3 | 15.4 | 12.8 | 242 | 241 | |
| 6 | 4.0 | 16.0 | 20.0 | 9.9 | 241 | 244 |
Publisher’s Note: MDPI stays neutral with regard to jurisdictional claims in published maps and institutional affiliations. |
© 2022 by the authors. Licensee MDPI, Basel, Switzerland. This article is an open access article distributed under the terms and conditions of the Creative Commons Attribution (CC BY) license (https://creativecommons.org/licenses/by/4.0/).
Share and Cite
Rathner, R.; Leimhofer, C.; Roland, W.; Hammer, A.; Löw-Baselli, B.; Steinbichler, G.; Hild, S. Improving Layer Adhesion of Co-Extruded Polymer Sheets by Inducing Interfacial Flow Instabilities. Polymers 2022, 14, 587. https://doi.org/10.3390/polym14030587
Rathner R, Leimhofer C, Roland W, Hammer A, Löw-Baselli B, Steinbichler G, Hild S. Improving Layer Adhesion of Co-Extruded Polymer Sheets by Inducing Interfacial Flow Instabilities. Polymers. 2022; 14(3):587. https://doi.org/10.3390/polym14030587
Chicago/Turabian StyleRathner, Raffael, Claudia Leimhofer, Wolfgang Roland, Alexander Hammer, Bernhard Löw-Baselli, Georg Steinbichler, and Sabine Hild. 2022. "Improving Layer Adhesion of Co-Extruded Polymer Sheets by Inducing Interfacial Flow Instabilities" Polymers 14, no. 3: 587. https://doi.org/10.3390/polym14030587
APA StyleRathner, R., Leimhofer, C., Roland, W., Hammer, A., Löw-Baselli, B., Steinbichler, G., & Hild, S. (2022). Improving Layer Adhesion of Co-Extruded Polymer Sheets by Inducing Interfacial Flow Instabilities. Polymers, 14(3), 587. https://doi.org/10.3390/polym14030587