
Recycled GFRP Aggregate Concrete Considering Aggregate Grading: Compressive Behavior and Stress–Strain Modeling


 ,
, 
Abstract
:1. Introduction
2. Experimental Program
2.1. Specimen Design
2.2. Material Properties
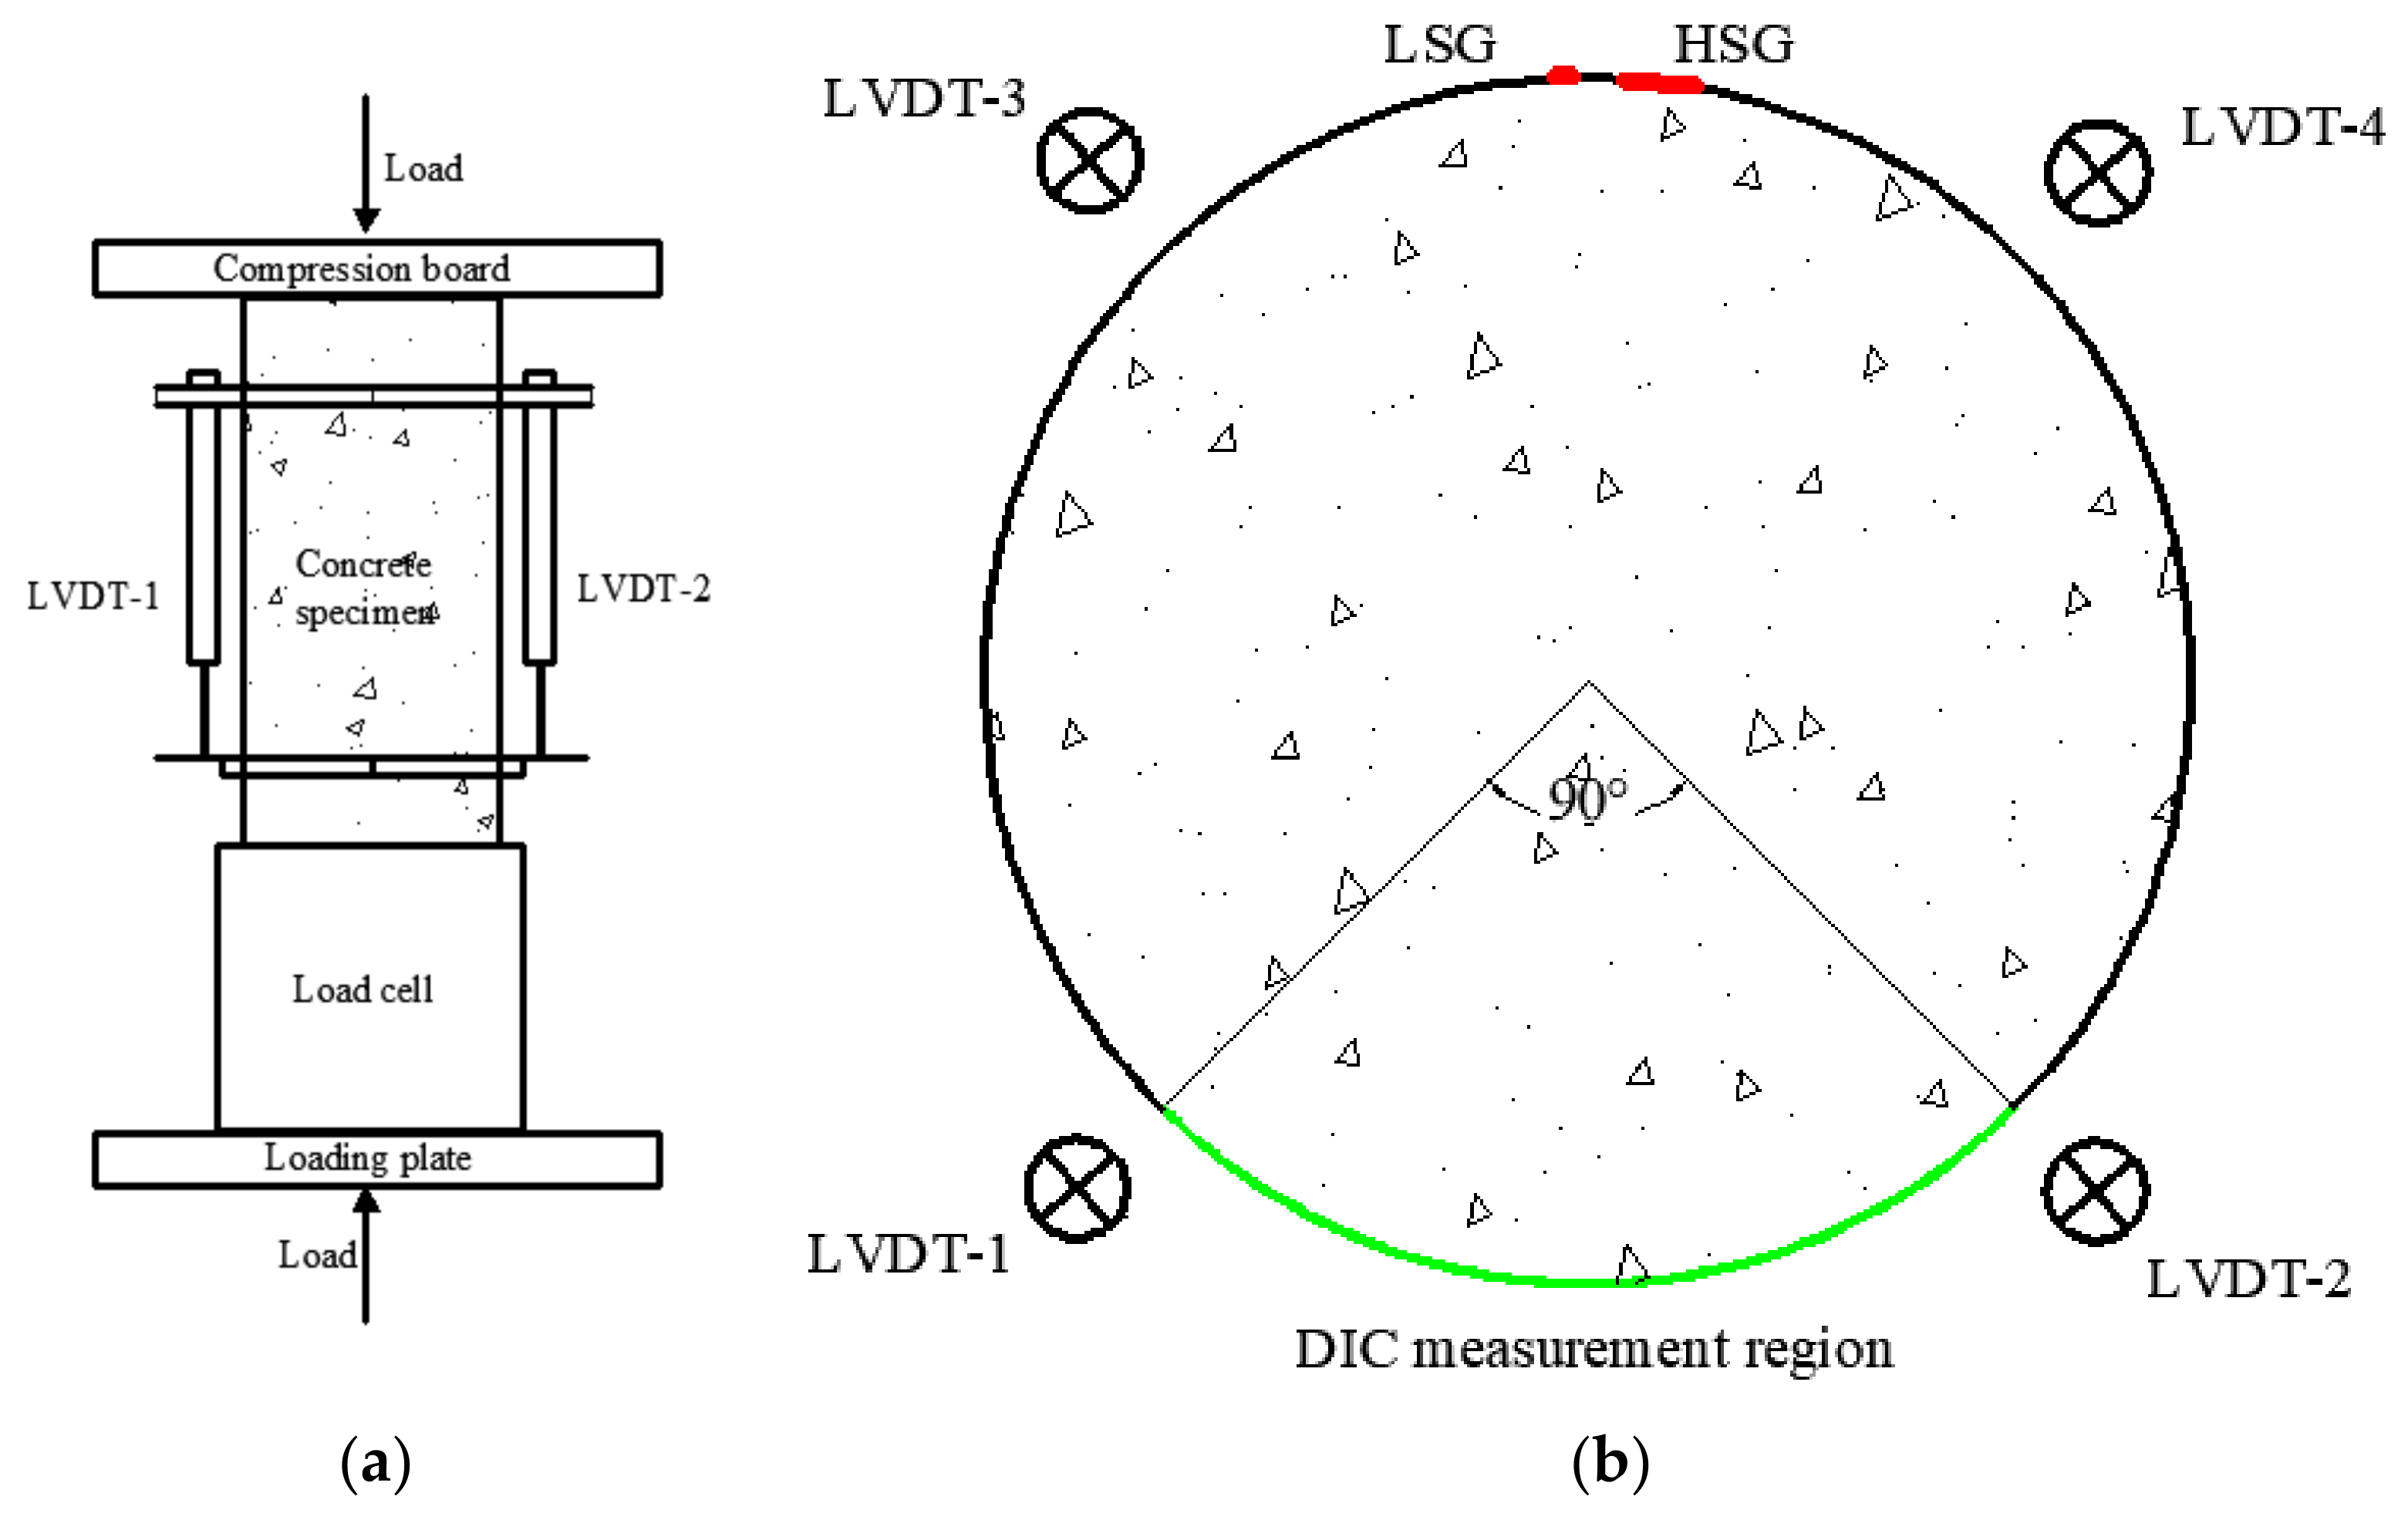
2.3. Test Setup
3. Results and Discussions
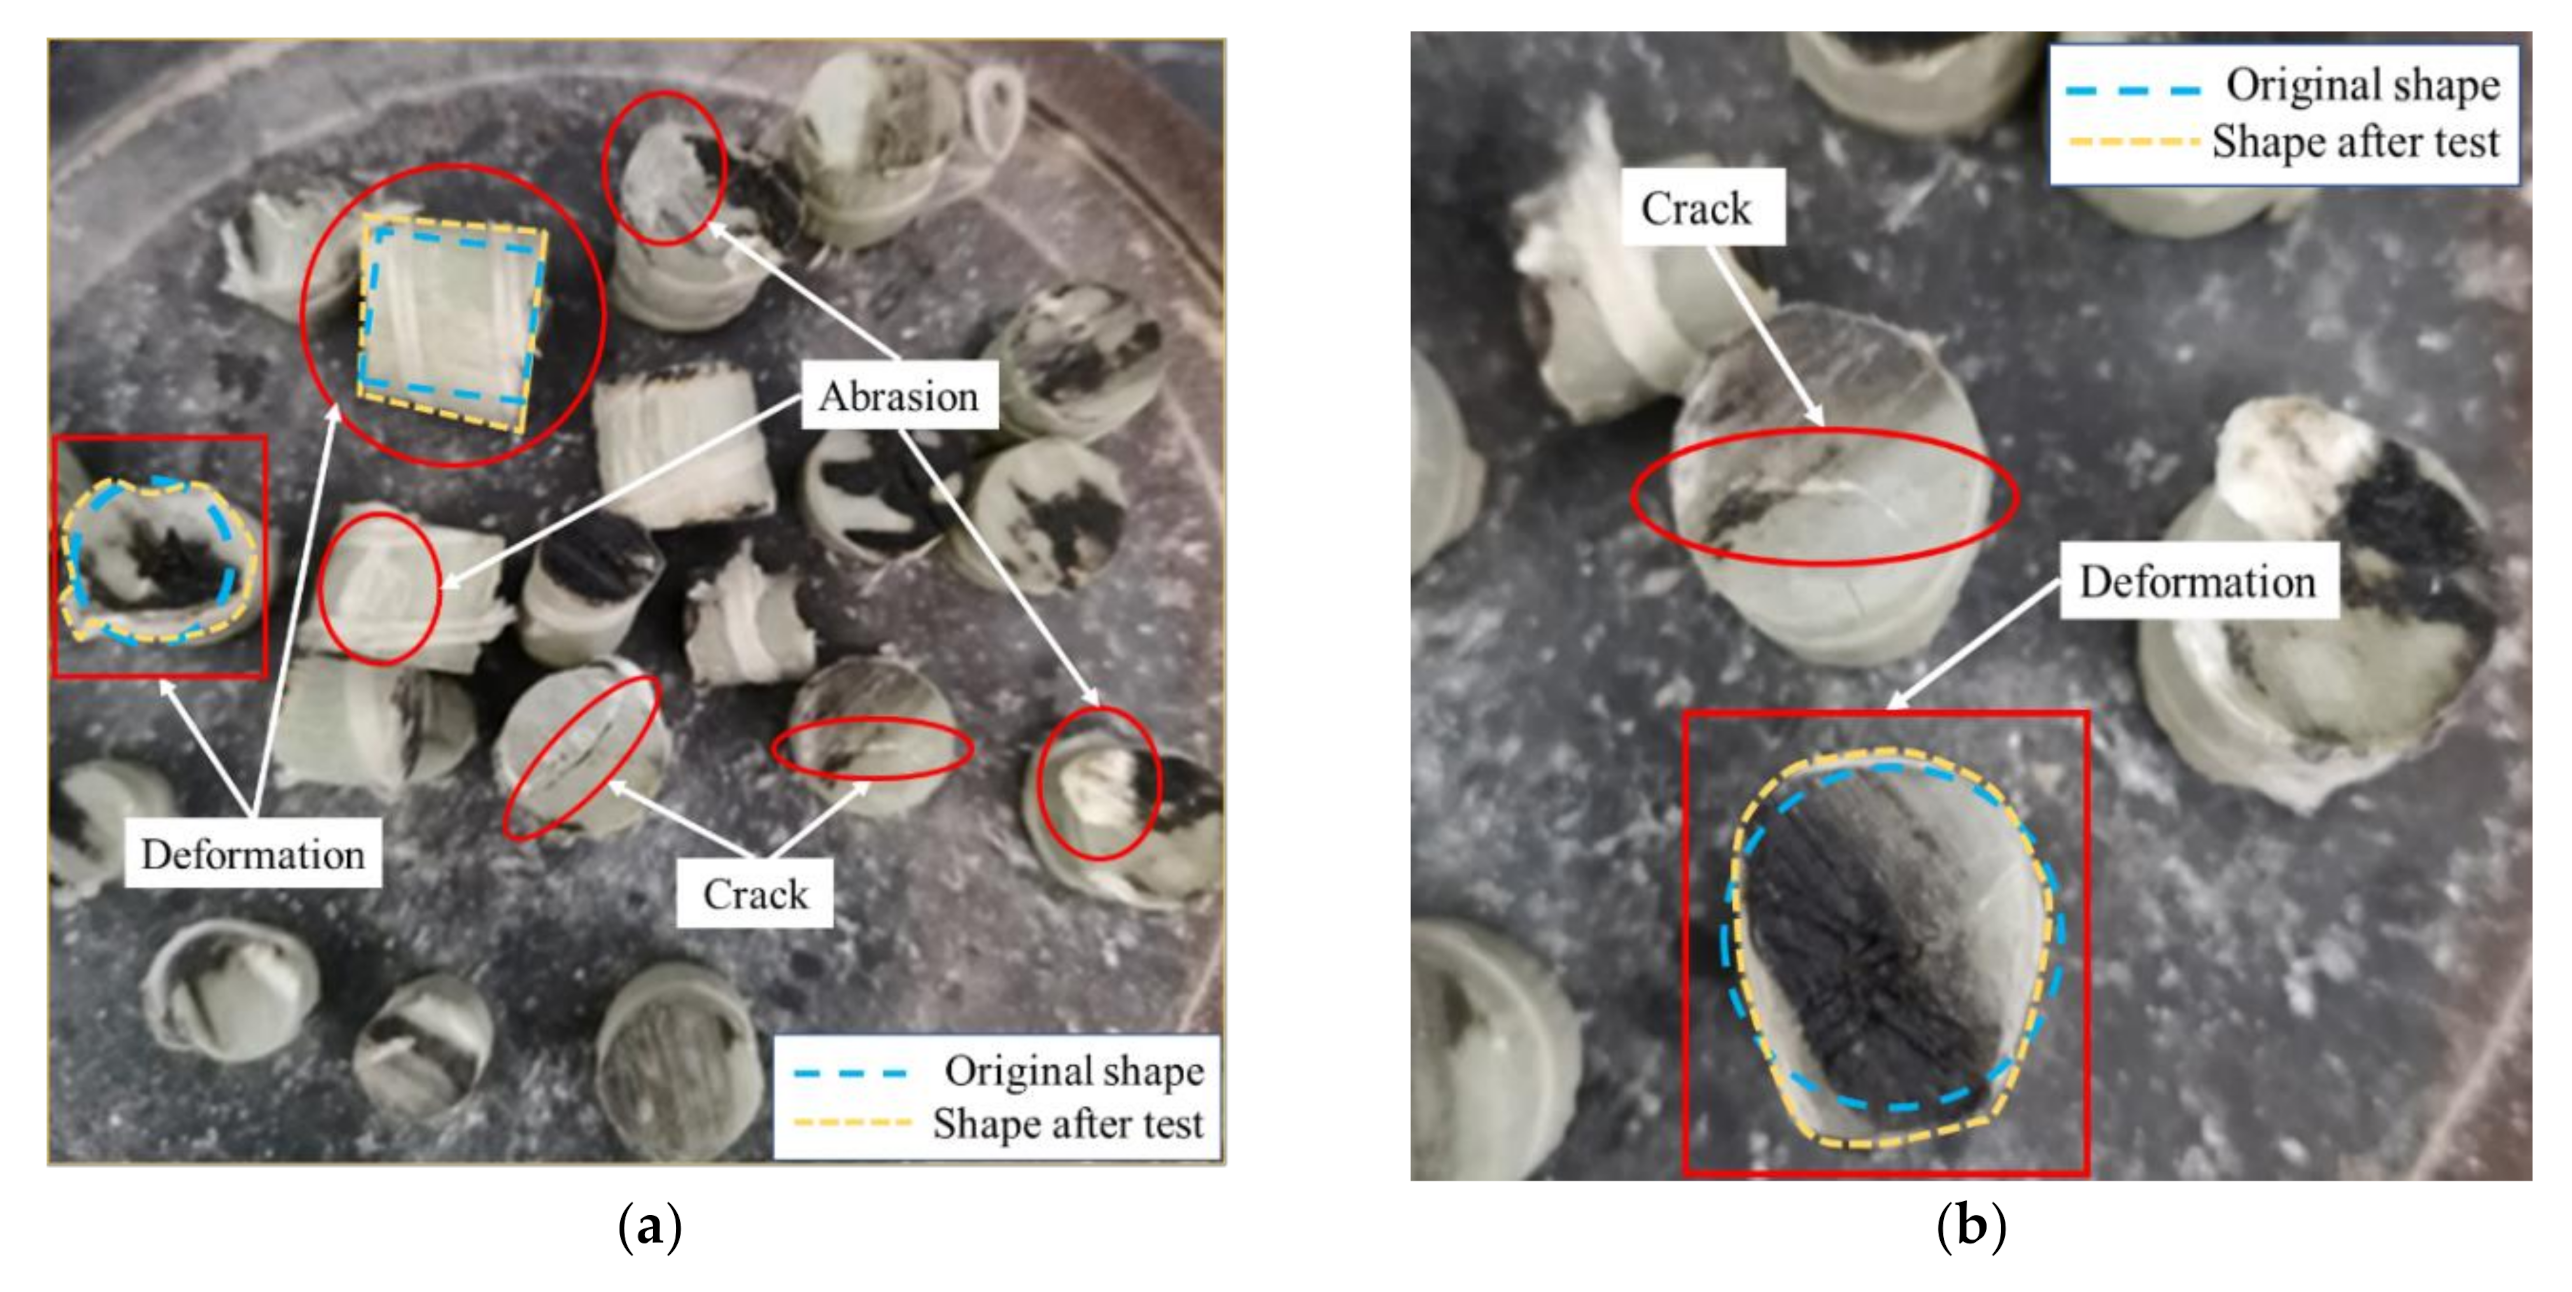
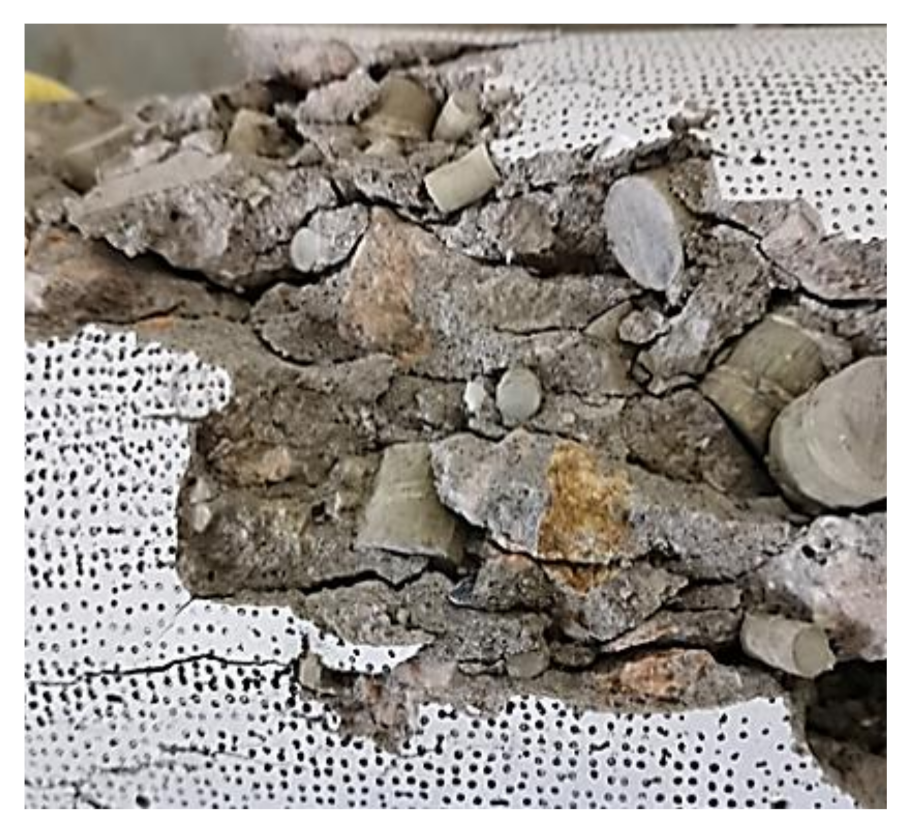
3.1. Failure Modes
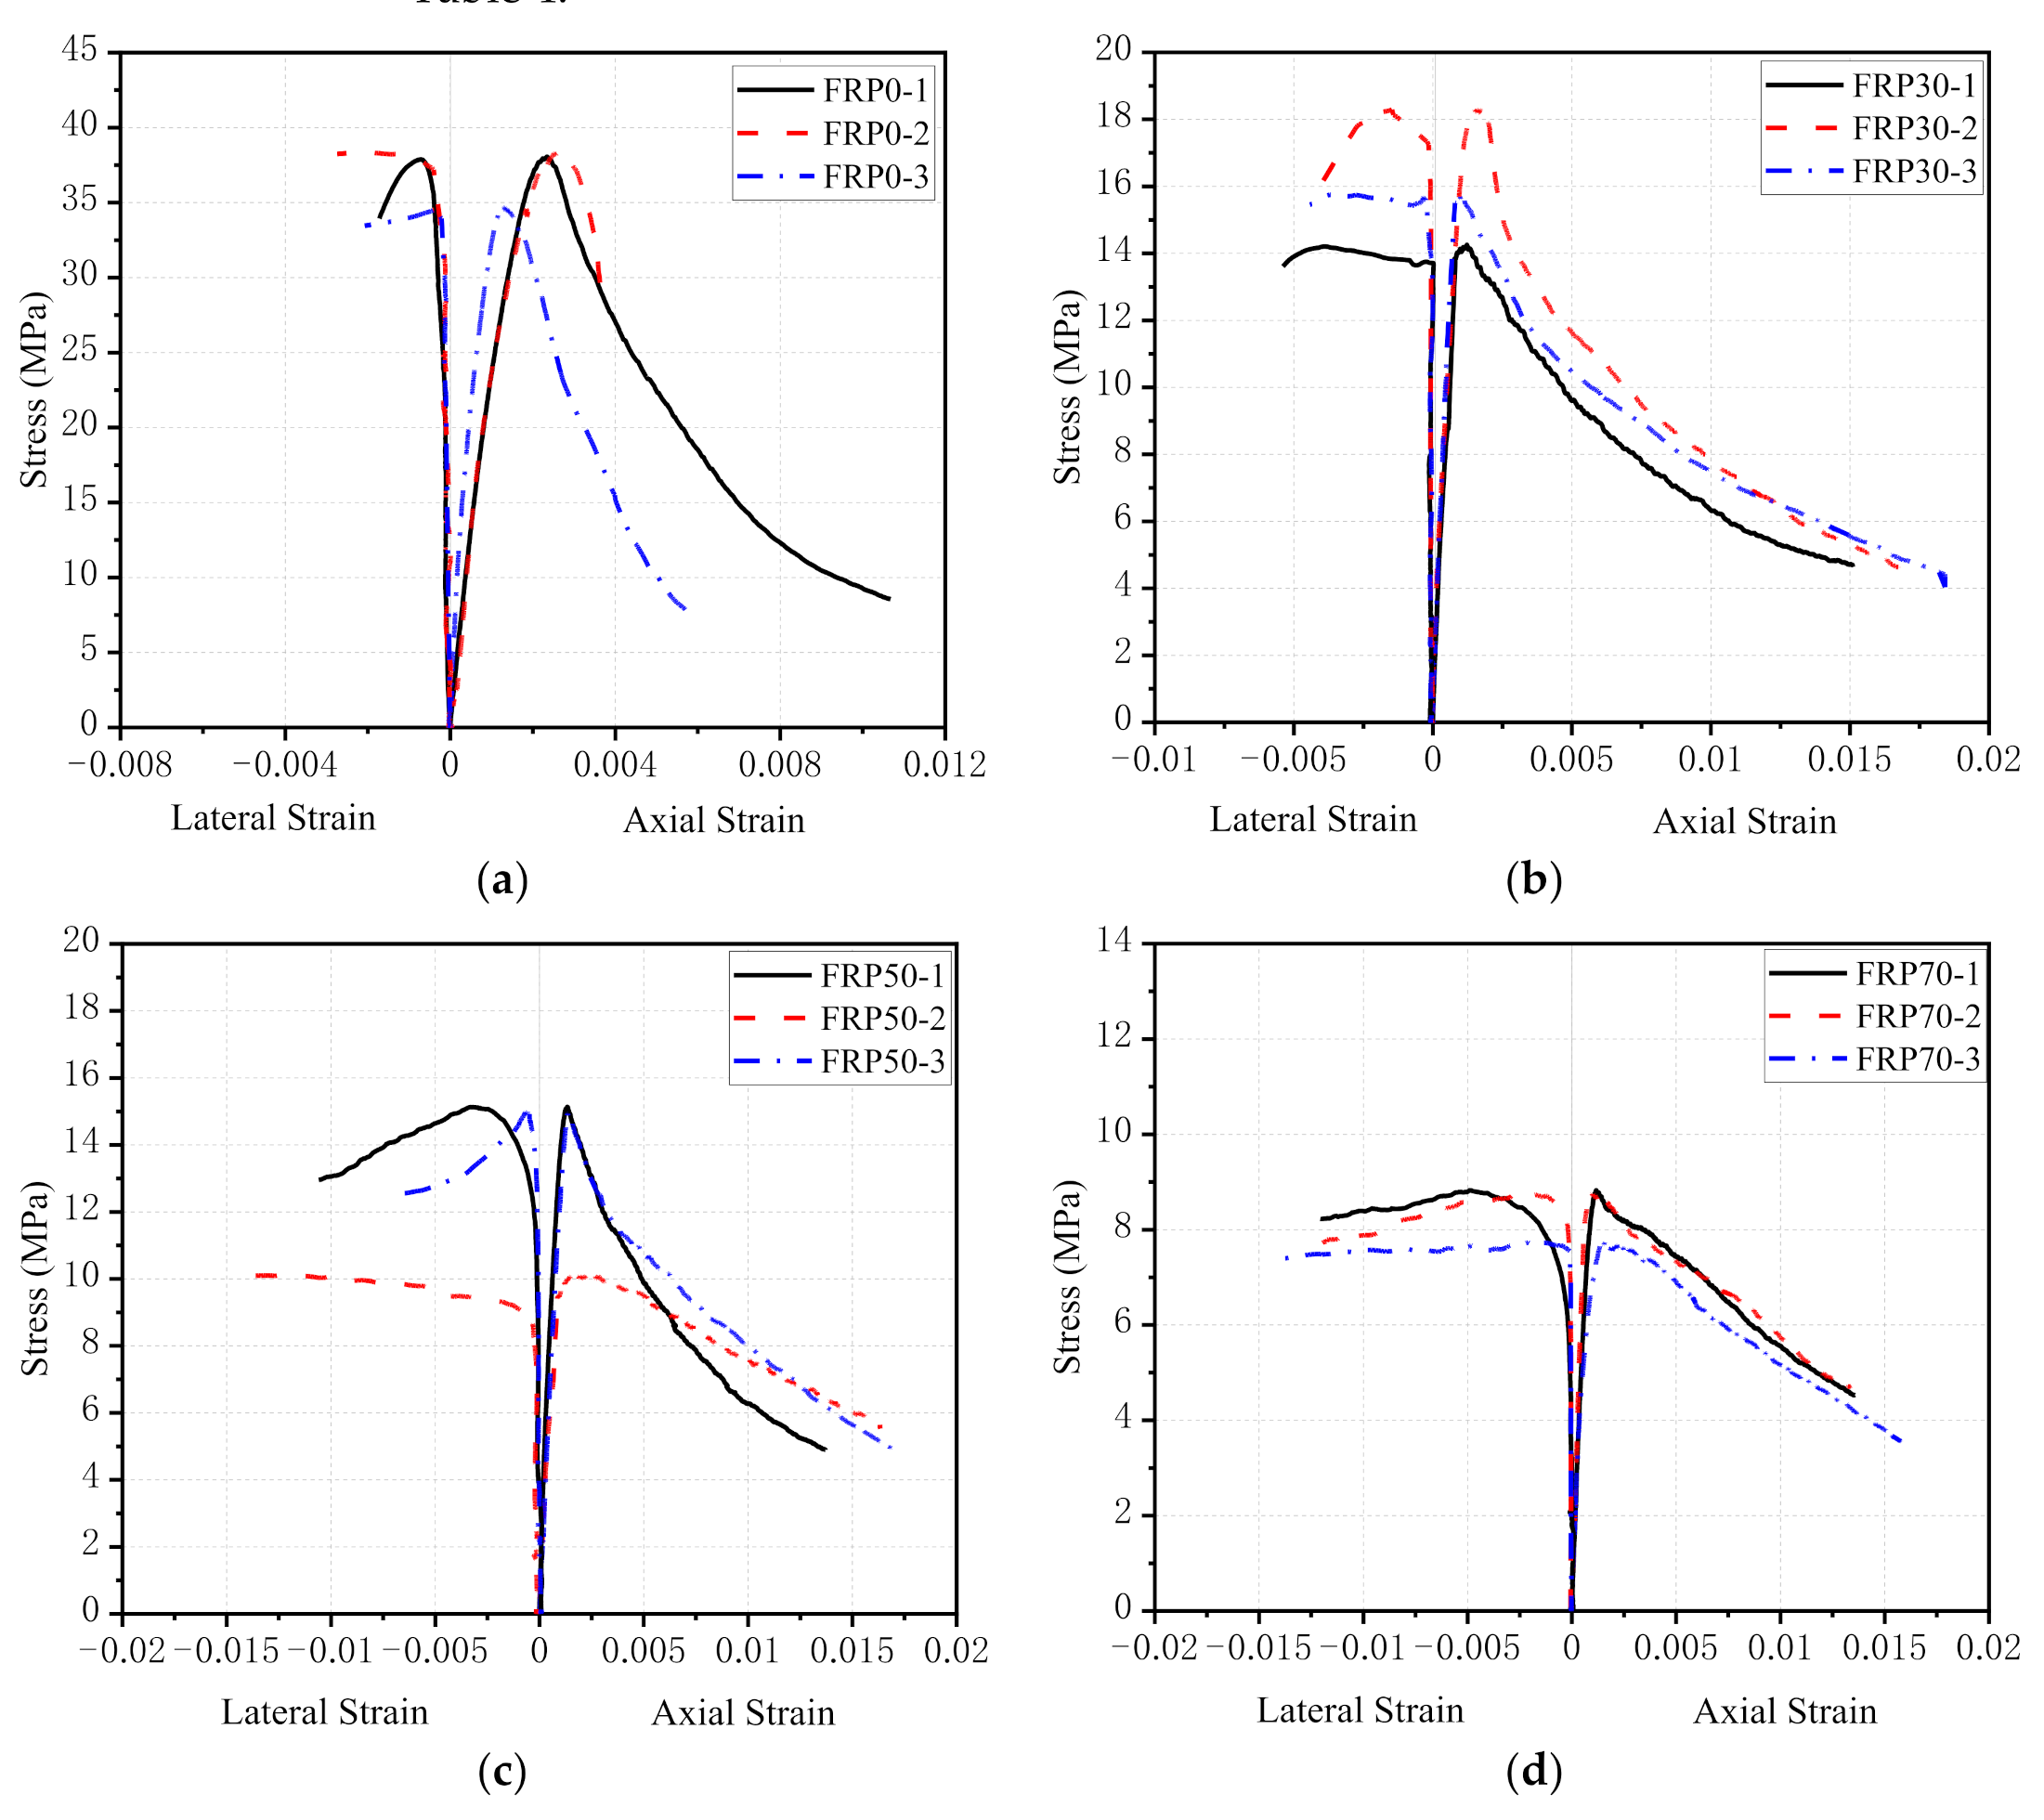
3.2. Stress–Strain Curves
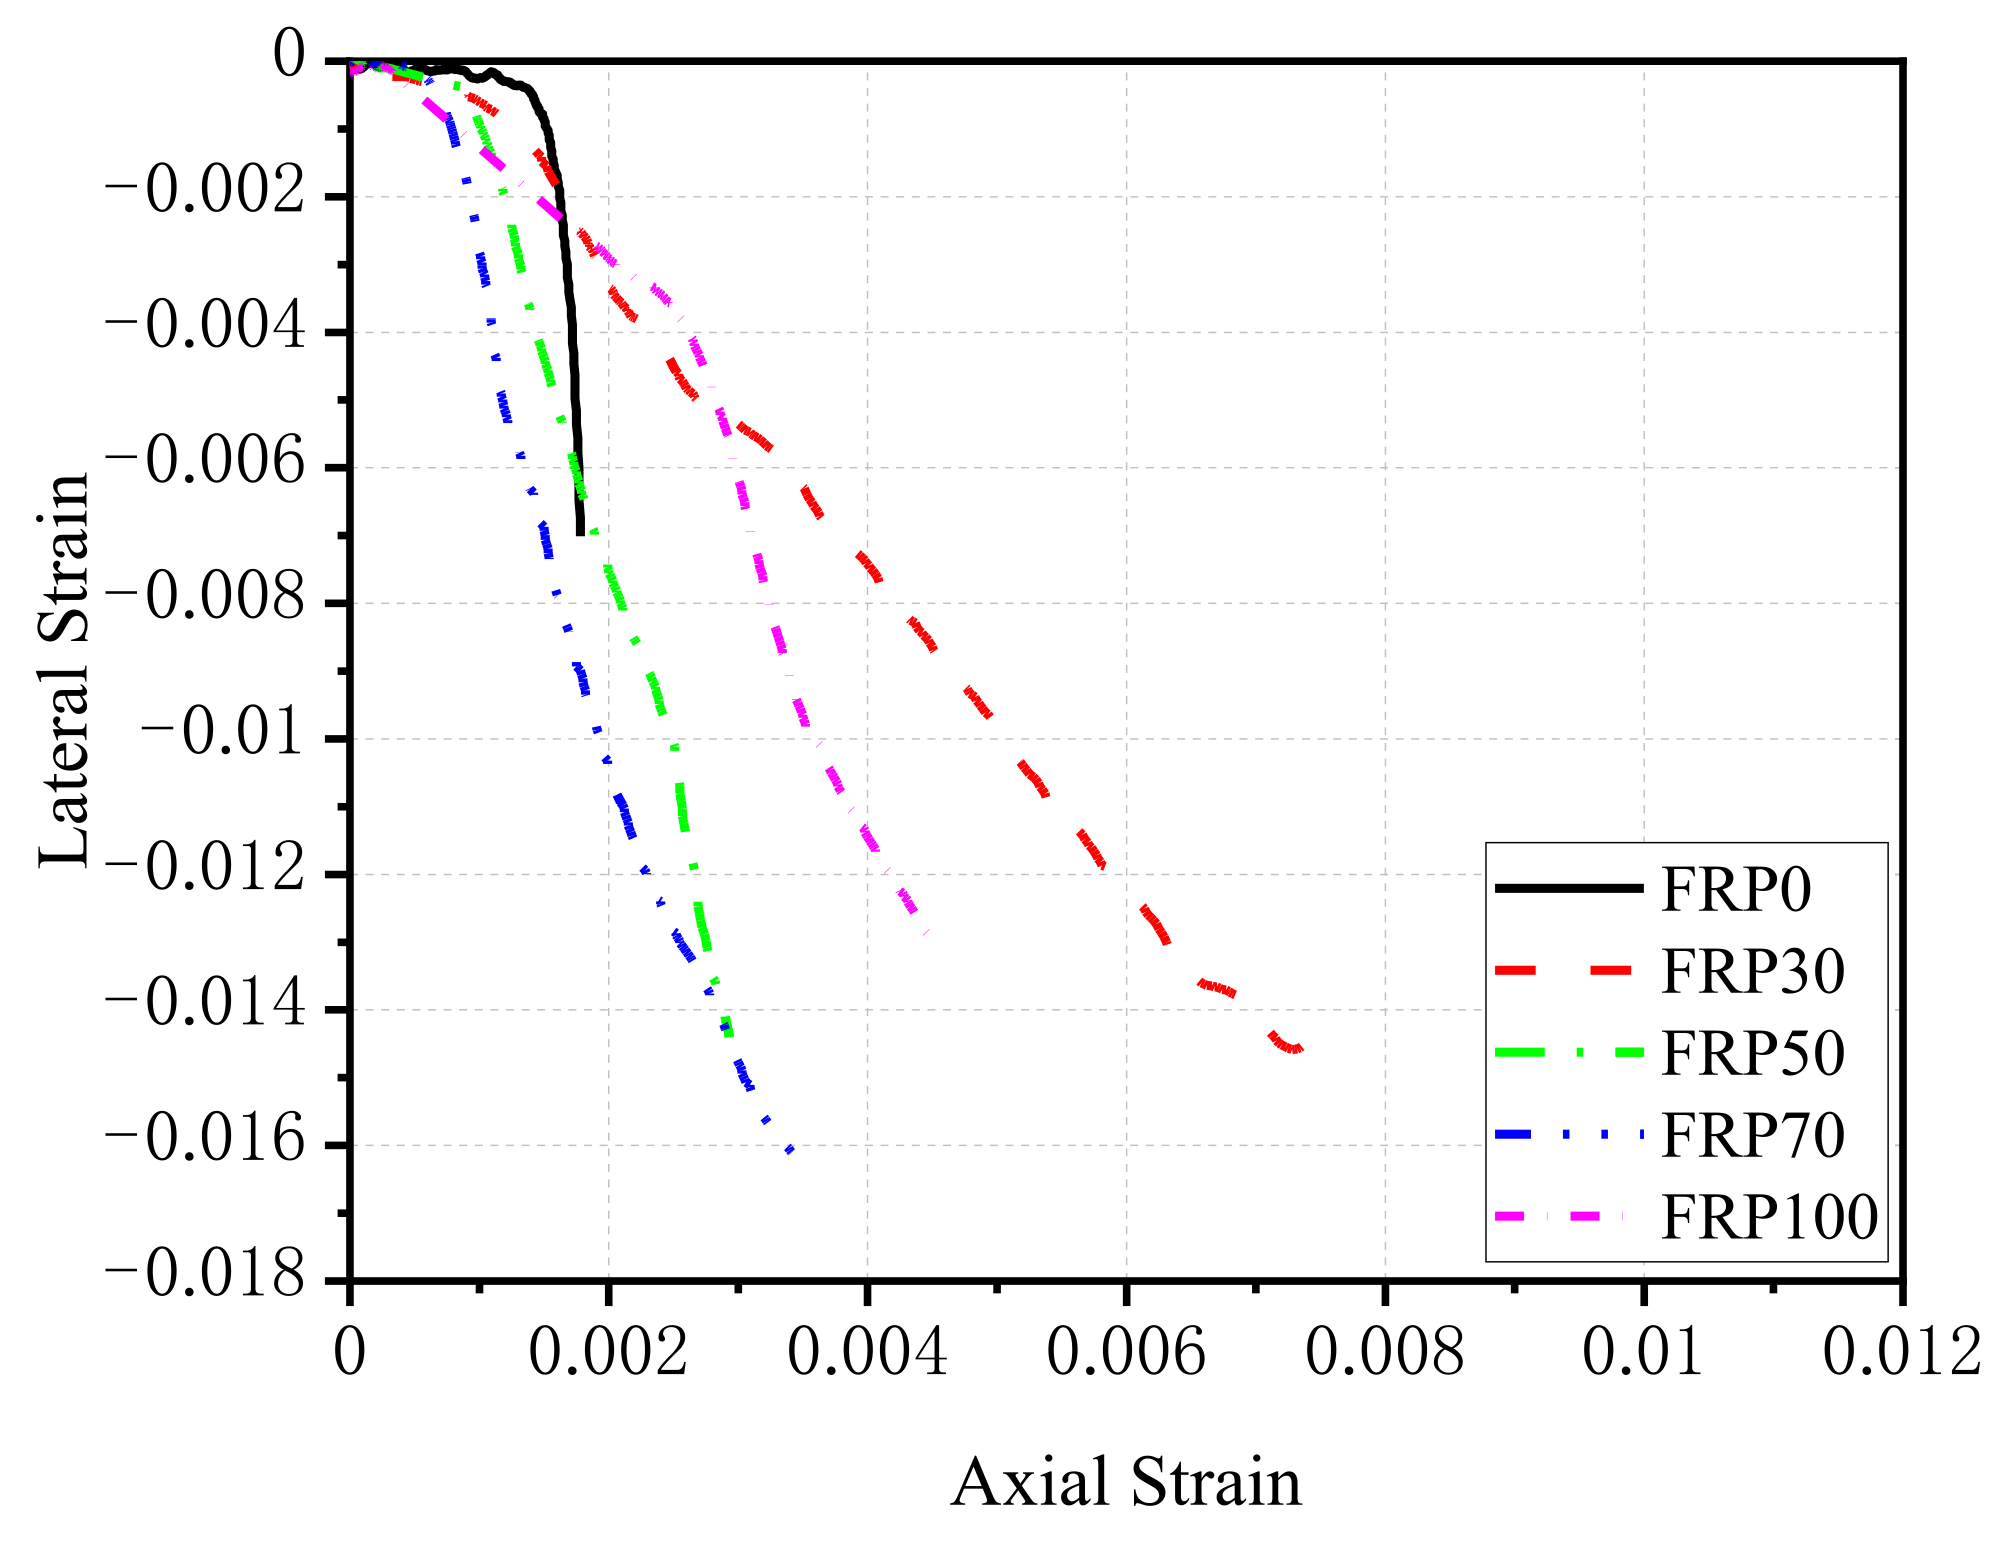
3.3. Axial Strain–Lateral Strain Relationship
4. Development of a Stress–Strain Model for RFAC
4.1. The Need for a New Stress–Strain Model of RFAC
4.1.1. Stress–Strain Models for Normal Concrete
4.1.2. Stress–Strain Models for Recycled Concrete
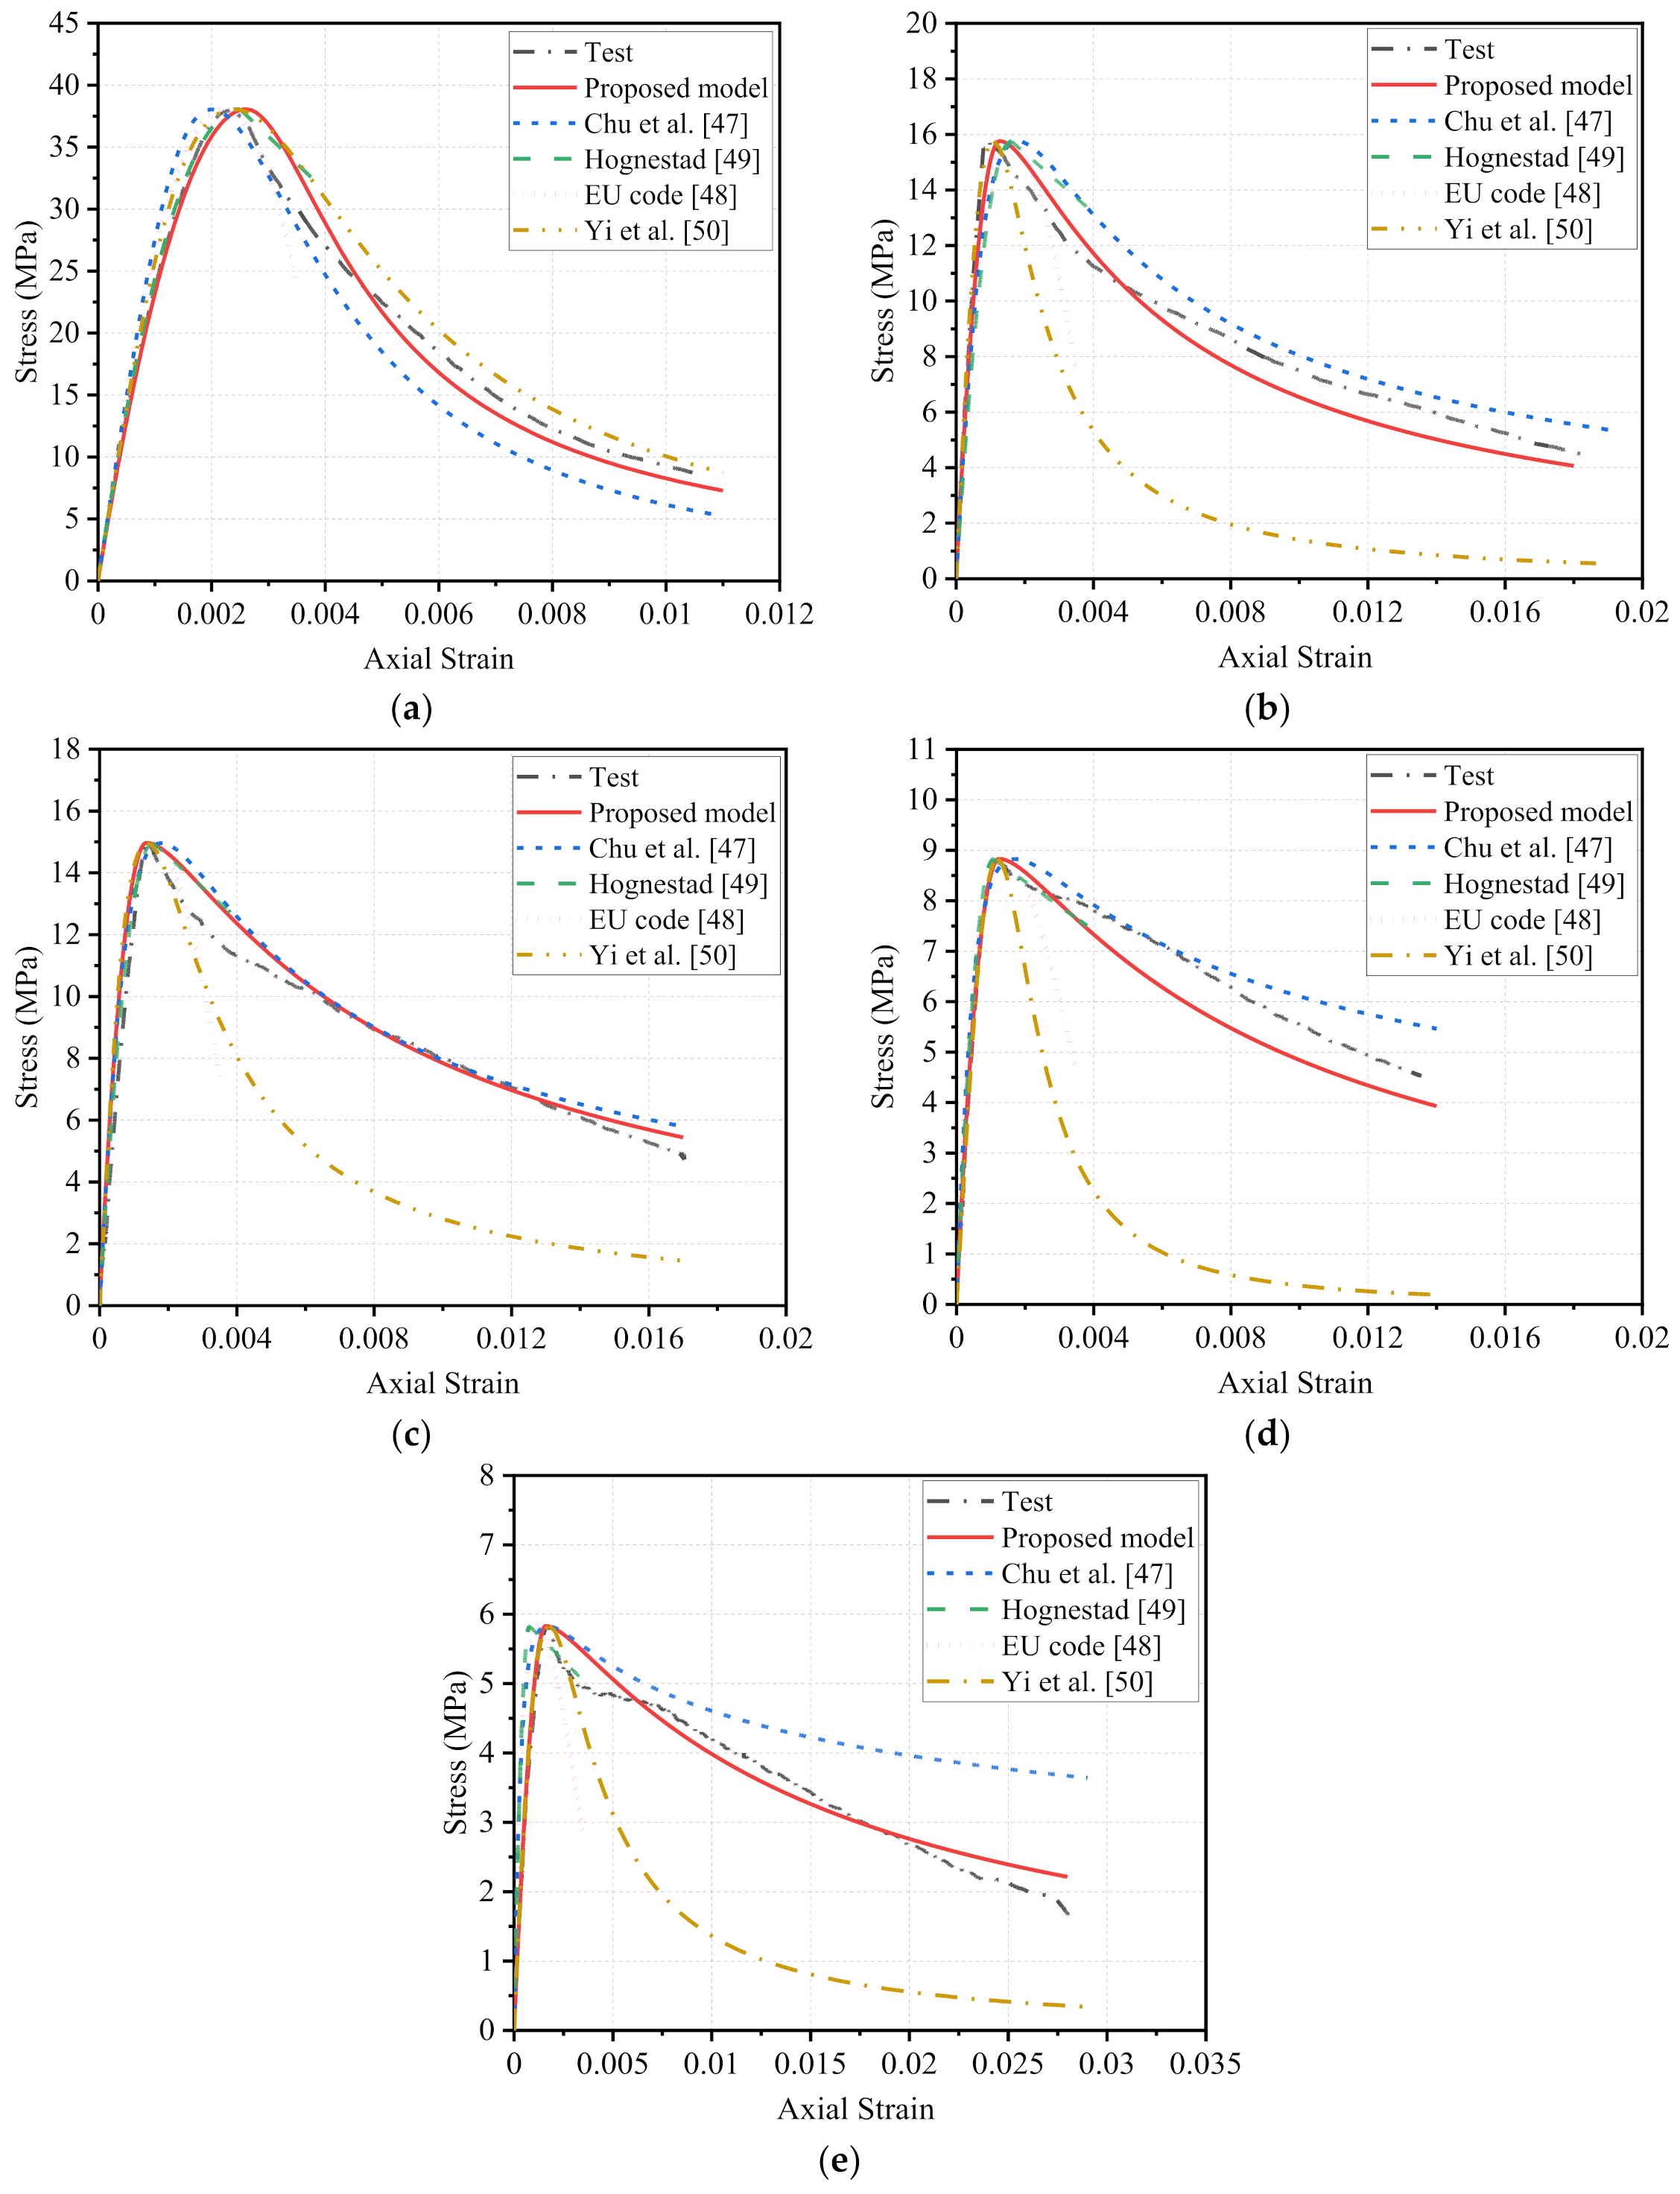
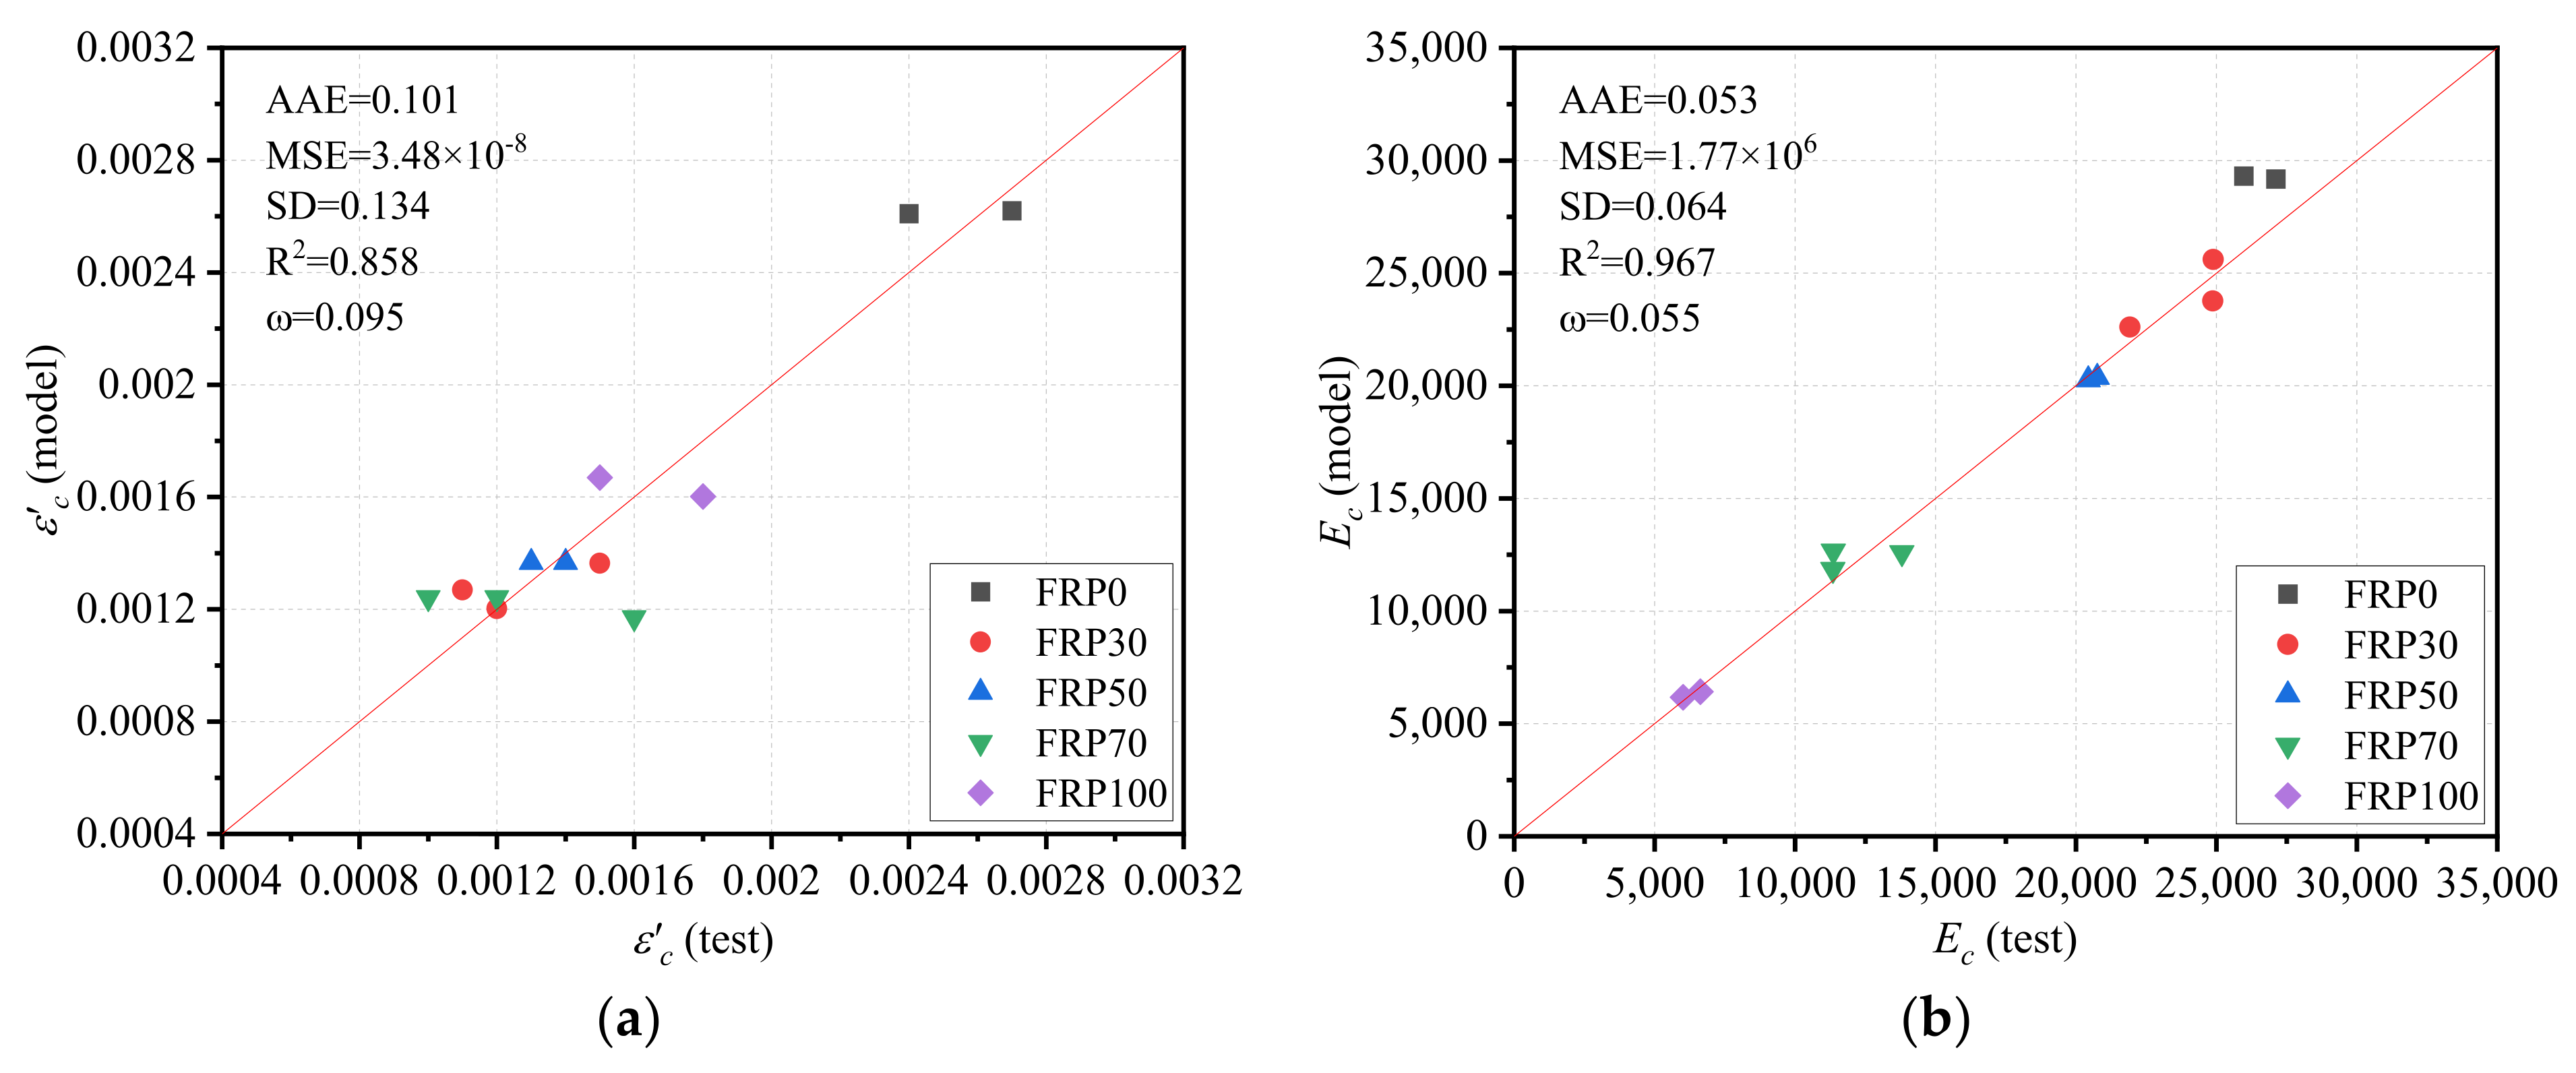
4.2. Proposed Model for RFAC
5. Conclusions
- The failure mode of RFAC was different from that of NCA concrete. Unlike NCA concrete failed by an obvious main diagonal crack, the cracks of RFAC were found to be distributed without an obvious main diagonal crack. This phenomenon was more significant as the RGFA replacement ratio increased.
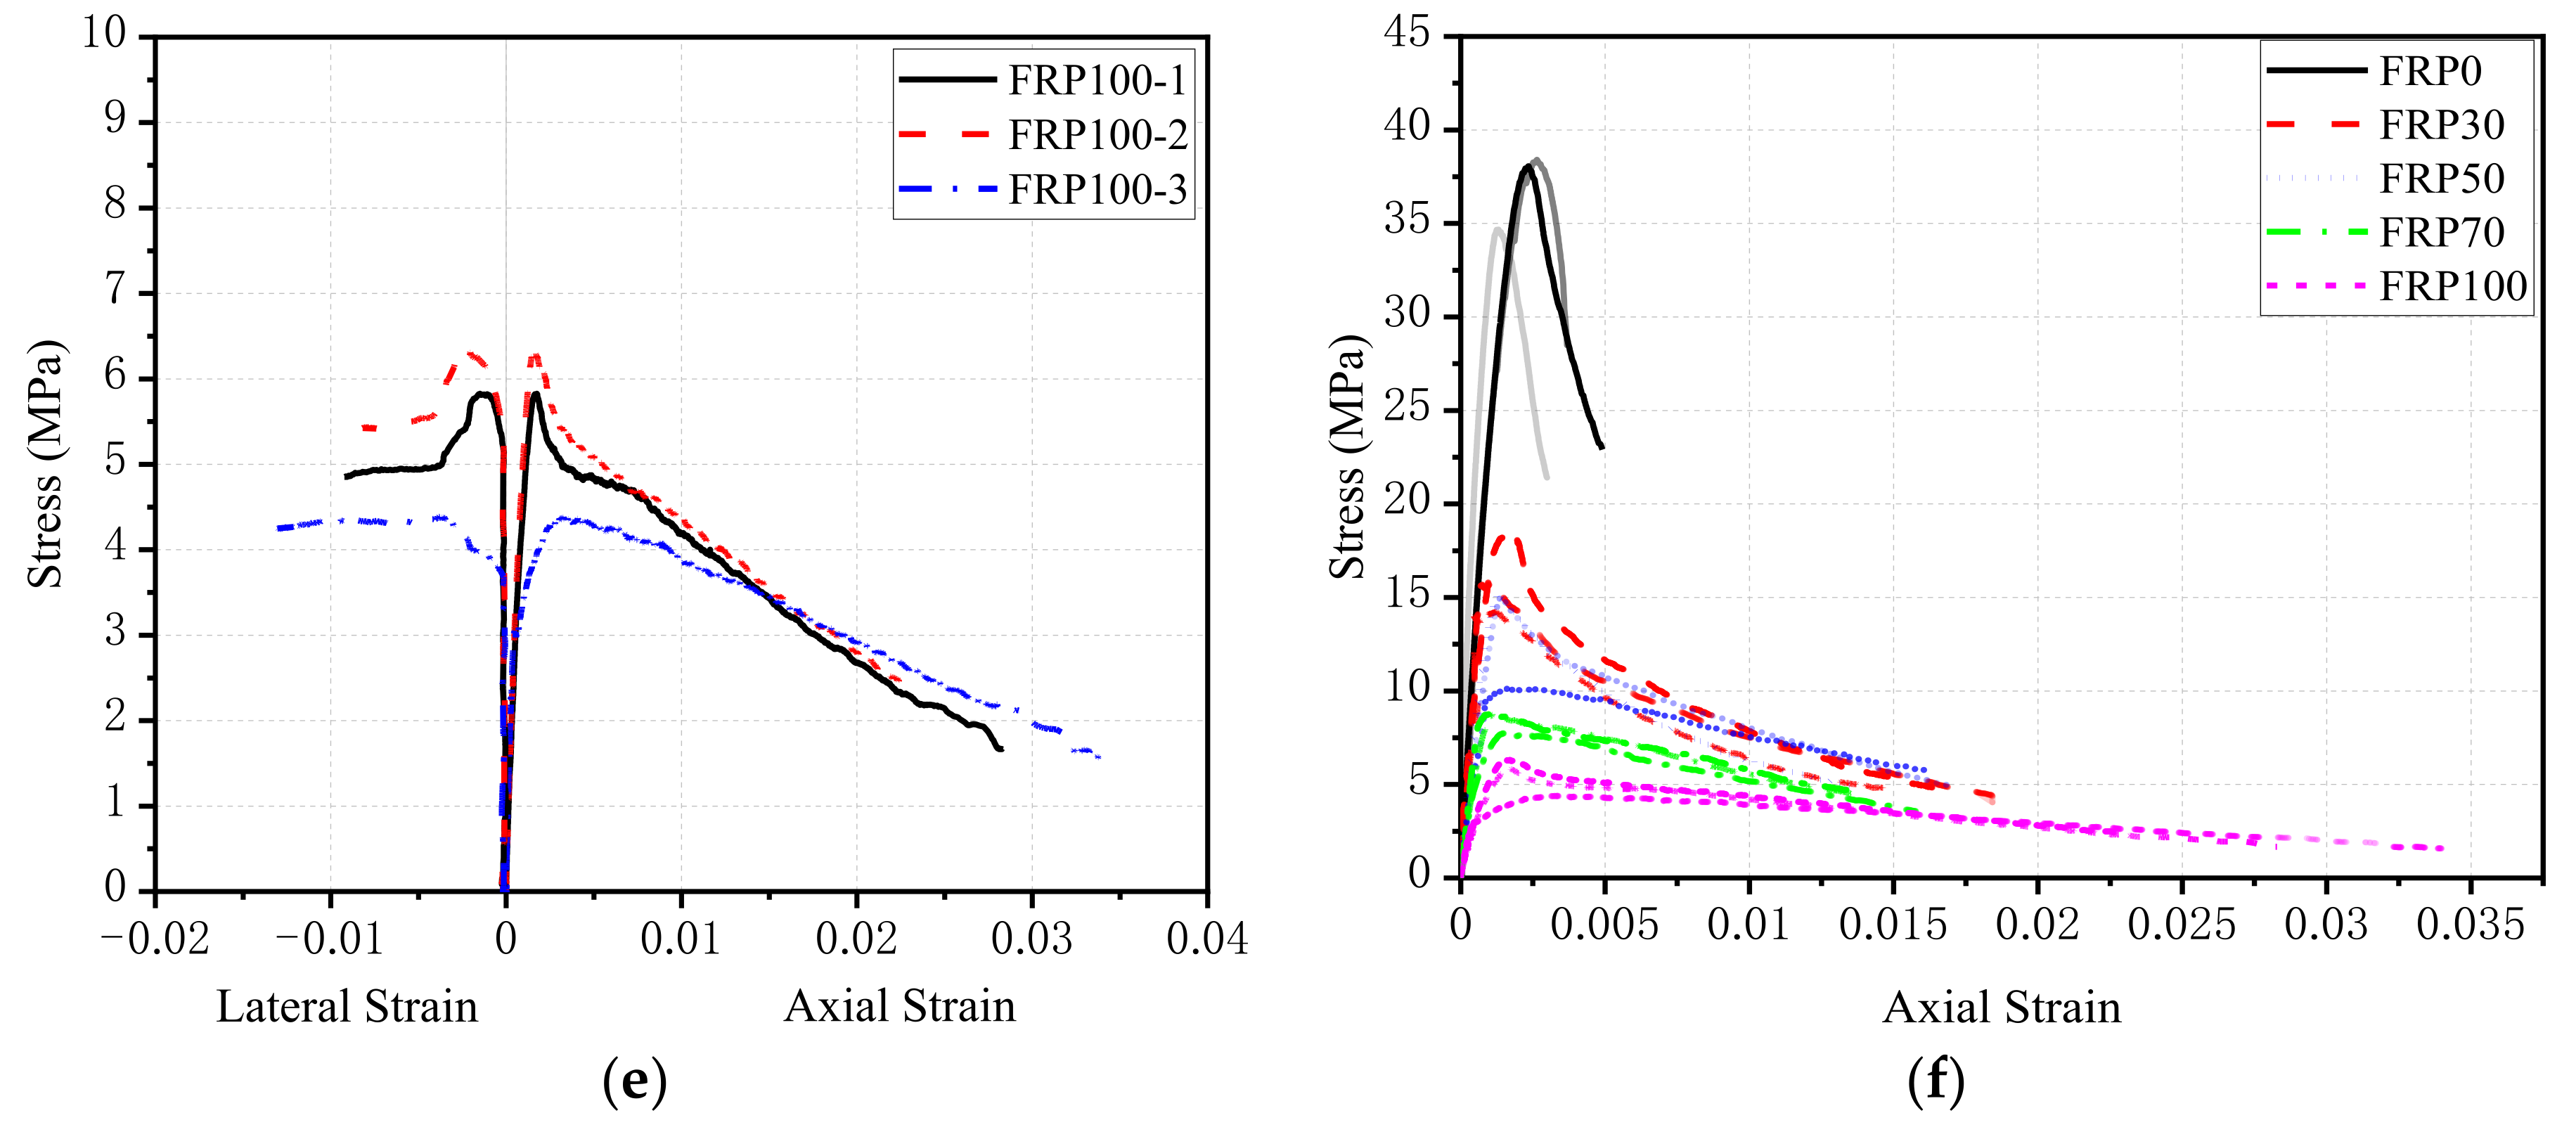
- The compressive strength of RFAC decreased non-linearly with the increase of the RFA replacement ratio, which was also true for the elastic modulus. The strain corresponding to the peak stress decreased compared with that of NCA concrete.
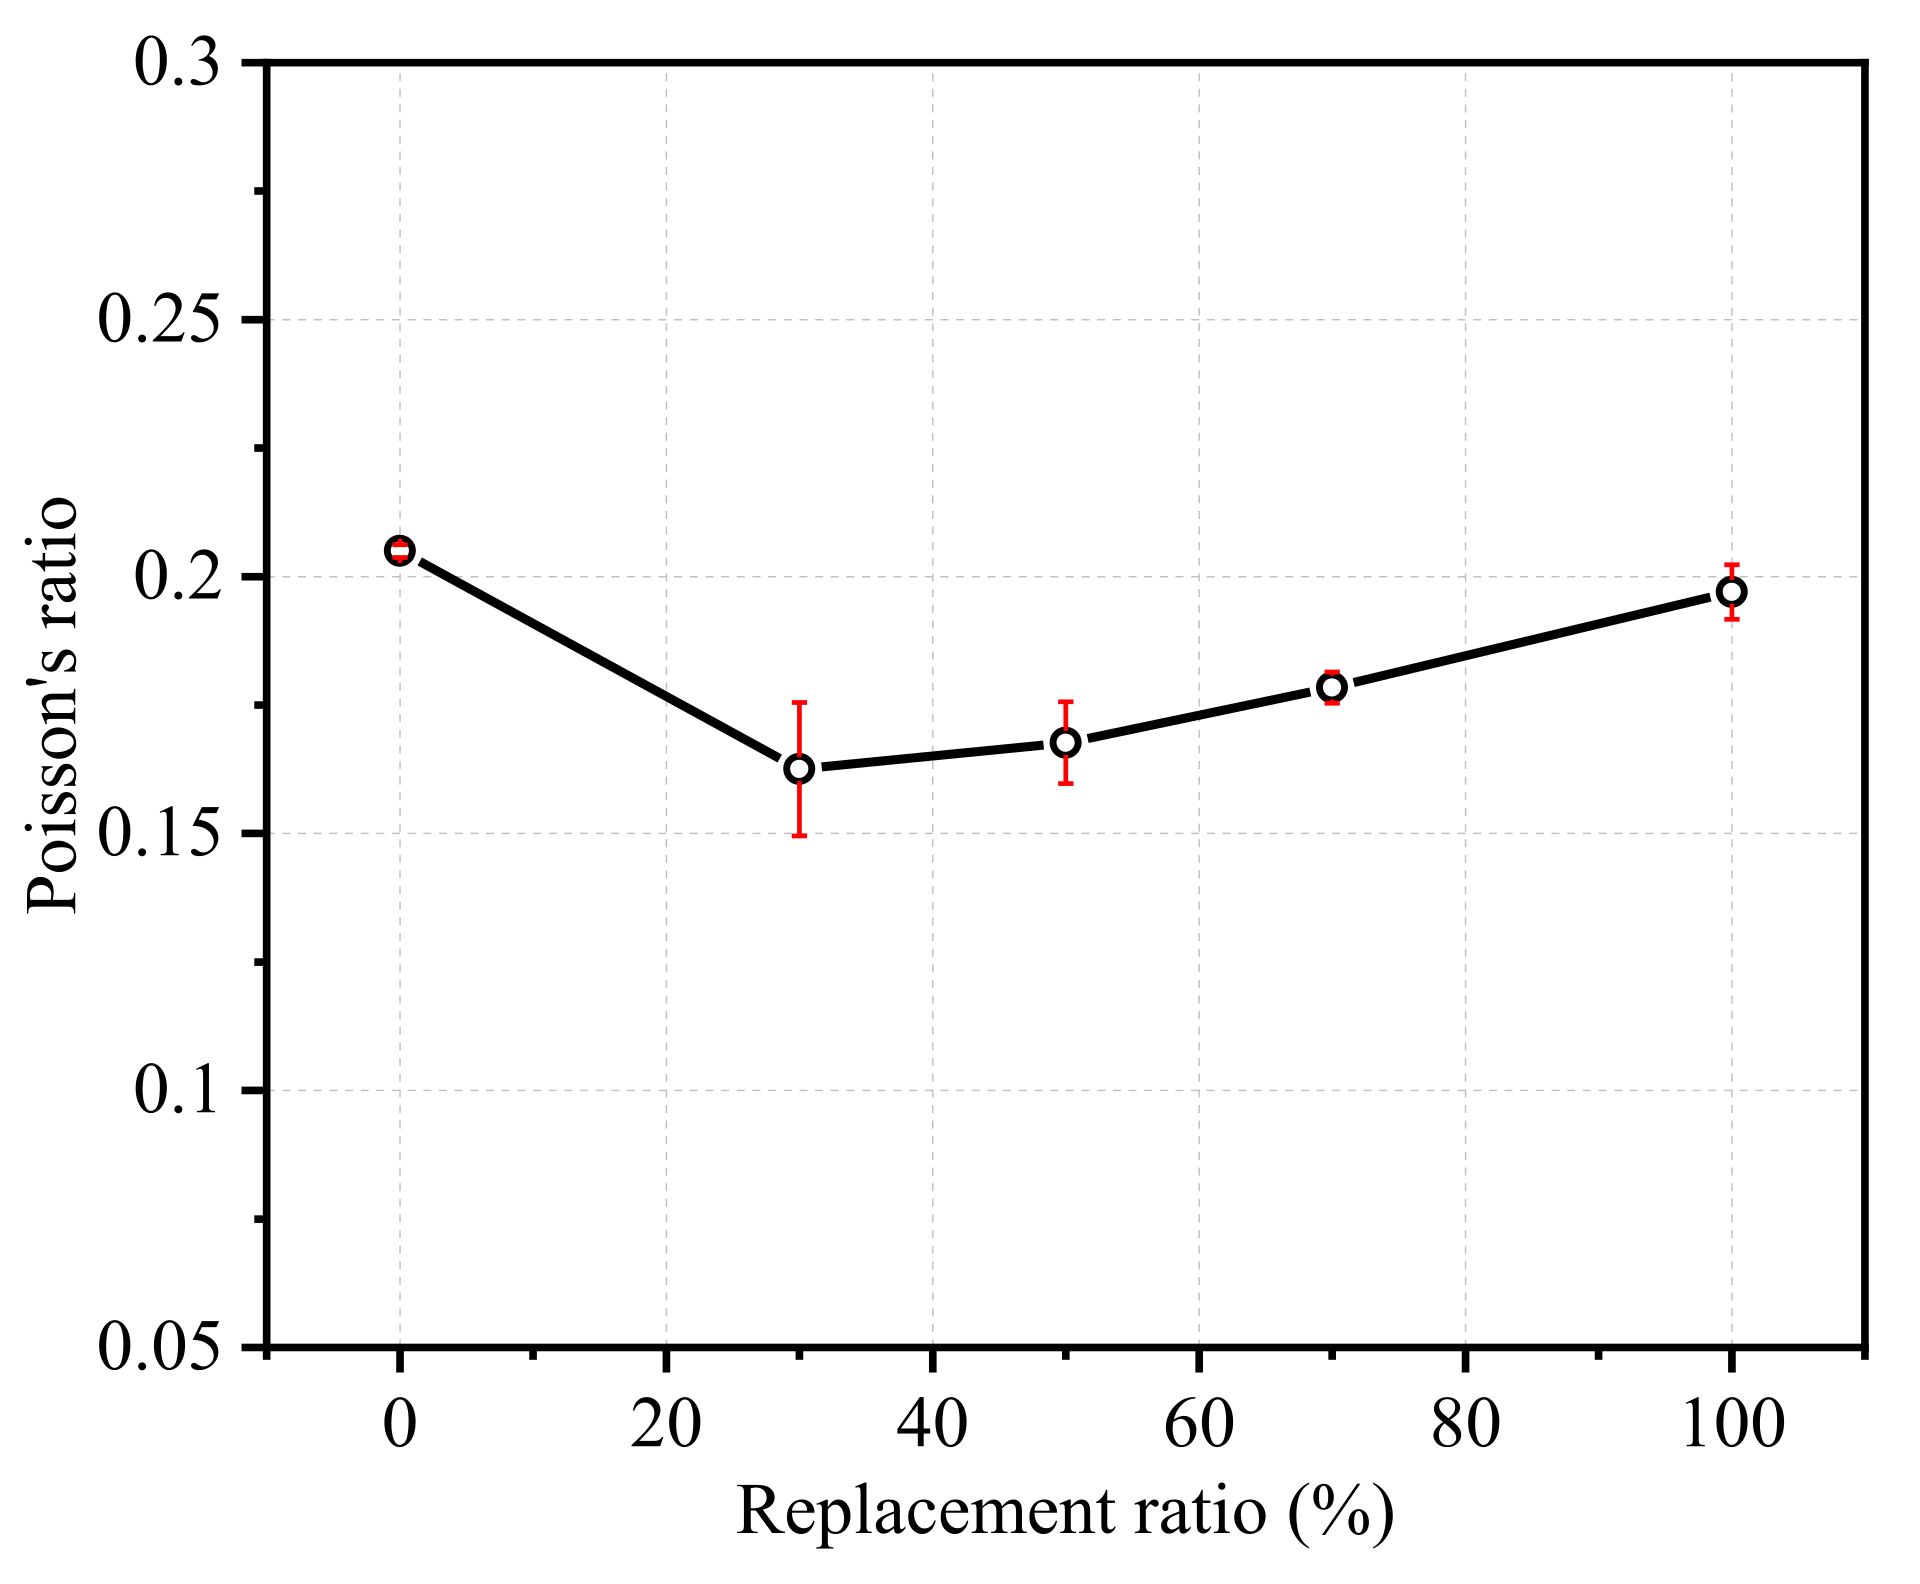
- Under the same axial stress, RFAC tended to expand more easily (reflected by larger lateral strain), especially in the post-peak softening stage. The Poisson’s ratio of RFAC at the elastic stage was slightly smaller than that of NCA concrete and tended to increase with the increase of the RGFA replacement ratio, but the overall change range was small, ranging from 0.14 to 0.20.
- The shape of the stress–strain curve of RFAC was different from that of NCA concrete, especially in the post-peak softening range. This can be due to the following changes of RFAC, including the weaker interfacial bond between GFRP aggregates and cement matrix, larger lateral expansion under the same axial stress and different cracking pattern.
- Comparisons between the test results and existing stress–strain models developed for NCA concrete as well as RAC indicated that the existing models are not suitable for predicting the stress–strain relationship of RFAC. Thus, based on the existing classical models, by considering the RGFA replacement ratio, a set of new models were proposed to predict the modulus of elasticity, peak strain and stress–strain model of RFAC, and good agreements were found between the models’ predictions and test results.
Author Contributions
Funding
Institutional Review Board Statement
Informed Consent Statement
Data Availability Statement
Acknowledgments
Conflicts of Interest
Notation
| a, b | Parameters related to ascending and descending portions in the model |
| Secant modulus at 0.4 | |
| Secant modulus at | |
| Elastic modulus | |
| Compressive stress | |
| Peak compressive stress | |
| Peak compressive stress of normal concrete | |
| Compressive strength after 28 days | |
| The parameter in a model by EU code [48] and model by Belen et al. [38] | |
| A coefficient used in proposed model | |
| The parameters in the model by Xiao et al. [54] | |
| m, n, p, q | The constant parameters in the model by Xiao et al. [54] |
| Volume replacement rate | |
| Curing time | |
| The constant parameters in the model by Xiao et al. [54] | |
| Shape parameter used in Xiao et al. [54] | |
| The adjustment factors in the model by Belen et al. [38] | |
| A concrete material parameter | |
| Axial compressive strain | |
| Peak axial strain at | |
| Ultimate axial strain | |
| The parameters in the model by Xiao et al. [54] | |
| The adjustment in the model by Belen et al. [38] |
| AAE | Average absolute error |
| DIC | Digital imagine collection |
| FRP | Fiber-reinforced polymer |
| GFRP | Glass fiber-reinforced polymer |
| HSG | Hooped strain gauge |
| ITZ | Interfacial transition zone |
| LSG | Longitudinal strain gauge |
| MSE | Mean square error |
| NAC | Natural aggregate concrete |
| NCA | Natural coarse aggregates |
| OPC | Ordinary Portland cement |
| RAC | Recycled aggregate concrete |
| RFA | Recycled FRP aggregates |
| RFAC | Recycled FRP aggregates concrete |
| RGFA | Recycled GFRP aggregates |
| SD | Standard deviation |
References
- Neşer, G. Polymer based composites in marine use: History and future trends. Procedia Eng. 2017, 194, 19–24. [Google Scholar] [CrossRef]
- Zhou, Y.W.; Sui, L.L.; Huang, X.X.; Guo, M.H.; Luo, M.S.; Hu, B.; Chen, C. Enhancing the EB-FRP strengthening effectiveness by incorporating a cracking-control layer of ECC with different thicknesses. Constr. Build. Mater. 2021, 286, 122975. [Google Scholar] [CrossRef]
- Chen, Y.; Yang, H.; Xu, J.; Fu, Y.; Yan, C. Recent advances in hole making of FRP/metal stacks: A review. T Nanjing. U Aeronaut. Astronaut. 2019, 36, 361–375. [Google Scholar]
- Sakamato, H.; Hanai, M. Reproduction of FRP blade failure for wind power generators by lightning and its mechanism. JSME Int. J. Ser. A 2005, 48, 465–471. [Google Scholar] [CrossRef] [Green Version]
- Mugahed Amran, Y.H.; Alyousef, R.; Rashid, R.S.M.; Alabduljabbar, H.; Hung, C.C. Properties and applications of FRP in strengthening RC structures: A review. Structures 2018, 16, 208–238. [Google Scholar] [CrossRef]
- Zhou, Y.W.; Chen, X.; Wang, X.H.; Sui, L.L.; Huang, X.X.; Guo, M.H.; Hu, B. Seismic performance of large rupture strain FRP retrofitted RC columns with corroded steel reinforcement. Eng. Struct. 2020, 216, 110744. [Google Scholar] [CrossRef]
- Jensen, J.P.; Skelton, K. Wind turbine blade recycling: Experiences, challenges and possibilities in a circular economy. Renew. Sustain. Energy Rev. 2018, 97, 165–176. [Google Scholar] [CrossRef]
- Global Wind Energy Council. Global Wind Report 2021; Global Wind Energy Council: Brussels, Belgium, 2021. [Google Scholar]
- Composites UK; Scott Bader; Renuables. FRP Circular Economy Study: Industry Summary. Available online: https://compositesuk.co.uk/industry-support/environmental/ (accessed on 9 January 2022).
- Bobovich, B.B. Glass-fiber reinforced plastics—Construction materials of the sixth technological paradigm? Glass Ceram. 2019, 76, 38–41. [Google Scholar] [CrossRef]
- Halliwell, S. FRPs—The Environmental Agenda. Adv. Struct. Eng. 2010, 13, 783–791. [Google Scholar] [CrossRef]
- Bank, L.C.; Arias, F.R.; Gentry, T.R.; Al-Haddad, T.; Tasistro-Hart, B.; Chen, J. Structural analysis of FRP parts from waste wind turbine blades for building reuse applications. In Advances in Engineering Materials, Structures and Systems: Innovations, Mechanics and Applications; Zingoni, A., Ed.; CRC Press: London, UK, 2019; pp. 1520–1524. [Google Scholar]
- Broekel, J.; Scharr, G. The specialities of fibre-reinforced plastics in terms of product lifecycle management. J. Mater. Process. Technol. 2005, 162–163, 725–729. [Google Scholar] [CrossRef]
- Meira Castro, A.C.; Carvalho, J.P.; Ribeiro, M.C.S.; Meixedo, J.P.; Silva, F.J.G.; Fiúza, A.; Dinis, M.L. An integrated recycling approach for GFRP pultrusion wastes: Recycling and reuse assessment into new composite materials using Fuzzy Boolean Nets. J. Clean. Prod. 2014, 66, 420–430. [Google Scholar] [CrossRef] [Green Version]
- Pimenta, S.; Pinho, S.T. Recycling carbon fibre reinforced polymers for structural applications: Technology review and market outlook. Waste Manag. 2011, 31, 378–392. [Google Scholar] [CrossRef] [PubMed] [Green Version]
- Yazdanbakhsh, A.; Bank, L.C. A critical review of research on reuse of mechanically recycled FRP production and end-of-life waste for construction. Polymers 2014, 6, 1810–1826. [Google Scholar] [CrossRef] [Green Version]
- Pickering, S.J. Recycling technologies for thermoset composite materials—Current status. Compos. Part A 2006, 37, 1206–1215. [Google Scholar] [CrossRef]
- Tittarelli, F.; Moriconi, G. Use of GRP industrial by-products in cement based composites. Cem. Concr. Compos. 2010, 32, 219–225. [Google Scholar] [CrossRef]
- Tittarelli, F.; Kawashima, S.; Tregger, N.; Moriconi, G.; Shah, S.P. Effect of GRP by-product addition on plastic and hardened properties of cement mortars. In Proceedings of the Second International Conference on Sustainable Construction Materials and Technologies, Ancona, Italy, 28–30 June 2010; pp. 677–687. [Google Scholar]
- Correia, J.R.; Almeida, N.M.; Figueira, J.R. Recycling of FRP composites: Reusing fine GFRP waste in concrete mixtures. J. Clean. Prod. 2011, 19, 1745–1753. [Google Scholar] [CrossRef]
- Asokan, P.; Osmani, M.; Price, A.D.F. Assessing the recycling potential of glass fibre reinforced plastic waste in concrete and cement composites. J. Clean. Prod. 2009, 17, 821–829. [Google Scholar] [CrossRef]
- Tittarelli, F.; Shah, S.P. Effect of low dosages of waste GRP dust on fresh and hardened properties of mortars: Part 1. Constr. Build. Mater. 2013, 47, 1532–1538. [Google Scholar] [CrossRef]
- Coppola, L.; Cadoni, E.; Forni, D.; Buoso, A. mechanical characterization of cement composites reinforced with fiberglass, carbon nanotubes or glass reinforced plastic (GRP) at high strain rates. Appl. Mech. Mater. 2011, 82, 190–195. [Google Scholar] [CrossRef] [Green Version]
- Yazdanbakhsh, A.; Bank, L.C.; Chen, C. Use of recycled FRP reinforcing bar in concrete as coarse aggregate and its impact on the mechanical properties of concrete. Constr. Build. Mater. 2016, 121, 278–284. [Google Scholar] [CrossRef] [Green Version]
- Yazdanbakhsh, A.; Bank, L.C.; Chen, C.; Tian, Y. FRP-needles as discrete reinforcement in concrete. J. Mater. Civ. Eng. 2017, 29, 04017175. [Google Scholar] [CrossRef]
- Fox, T.R. Recycling Wind Turbine Blade Composite Material as Aggregate in Concrete. Master of Science, Iowa State University, Ames, IA, USA, 2016. [Google Scholar]
- Alam, M.S.; Slater, E.; Billah, A.H.M.M. Green concrete made with RCA and FRP scrap aggregate: Fresh and hardened properties. J. Mater. Civ. Eng. 2013, 25, 1783–1794. [Google Scholar] [CrossRef]
- Yazdanbakhsh, A.; Bank, L.C.; Rieder, K.; Tian, Y.; Chen, C. Concrete with discrete slender elements from mechanically recycled wind turbine blades. Resour. Conserv. Recycl. 2018, 128, 11–21. [Google Scholar] [CrossRef]
- Nie, X.F.; Fu, B.; Teng, J.G.; Bank, L.C.; Tian, Y. Shear behavior of reinforced concrete beams with GFRP needles. Constr. Build. Mater. 2020, 257, 119430. [Google Scholar] [CrossRef]
- GB/T 50081-2019; Standard for Test Methods of Concrete Physical and Mechanical Properties. China Building Industry: Beijing, China, 2019.
- ASTM C33; Standard Specification for Concrete Aggregates. ASTM International: West Conshohocken, PA, USA, 2013.
- JGJ 52-2006; Standard for Technical Requirements and Test Method of Sand and Crushed Stone (Or Gravel) for Ordinary Concrete. China Building Industry: Beijing, China, 2006.
- Zhang, X.; Deng, D.; Yang, J.; Fang, W.; Fan, Y. Study on stress-strain curve of recycled lightweight aggregate concrete. Acta Silic. Sin. 2018, 37, 3166–3172. [Google Scholar]
- Lv, J.; Zhou, T.; Du, Q.; Li, K.; Sun, K. Evaluation of stress-strain behavior of self-compacting rubber lightweight aggregate concrete under uniaxial compression loading. Materials 2019, 12, 4064. [Google Scholar] [CrossRef] [PubMed] [Green Version]
- Liang, J.; Guo, L.; Cheng, L.; Wu, H. Study on mechanical properties of recycled brick coarse aggregate concrete under uniaxial compression. Concrete 2014, 78–80. [Google Scholar]
- Suryawanshi, S.; Singh, B.; Bhargava, P. Equation for stress–strain relationship of recycled aggregate concrete in axial compression. Mag. Concr. Res. 2018, 70, 163–171. [Google Scholar] [CrossRef]
- Li, X. Recycling and reuse of waste concrete in China. Resour. Conserv. Recycl. 2008, 53, 36–44. [Google Scholar] [CrossRef]
- Belen, G.; Fernando, M.; Lopez Diego, C.; Sindy, S. Stress-strain relationship in axial compression for concrete using recycled saturated coarse aggregate. Constr. Build. Mater. 2011, 25, 2335–2342. [Google Scholar] [CrossRef]
- Yazdanbakhsh, A.; Tian, Y. Shear performance of reinforced concrete beams incorporating stiff slender elements. Constr. Build. Mater. 2019, 222, 263–277. [Google Scholar] [CrossRef]
- Dong, Z.; Wu, G.; Zhu, H. Mechanical properties of seawater sea-sand concrete reinforced with discrete BFRP-Needles. Constr. Build. Mater. 2019, 206, 432–441. [Google Scholar] [CrossRef]
- Loo, Y.H. A new method for microcrack evaluation in concrete. Mater. Struct. 1992, 25, 573–578. [Google Scholar] [CrossRef]
- Chen, T. Effect of Reinforced Recycled Coarse Aggregate on Mechanical Properties and Durability of Recycled Concrete. Master of Engineering, Harbin Institute of Technology, Harbin, China, 2016. [Google Scholar]
- Zhang, X.; Chen, Z.; Xue, J. Experimental study on physical and mechanical properties of recycled concrete. Acta Silic. Sin. 2015, 34, 1685–1689. [Google Scholar]
- Chen, Z.; Xu, J.; Zheng, H.; Su, Y.; Xue, J.; Li, J. Basic mechanical properties test and stress-strain constitutive relationship of recycled concrete. J. Build. Mater. 2013, 16, 25–32. [Google Scholar]
- Wan, X.; Zhang, Y.; Zhao, T.; Zhang, S.; Cheng, Y. Mechanical properties of alkali-activated slag concrete. Mater. Rep. 2018, 32, 2091–2095. [Google Scholar]
- GB 50010-2010; Code for Design of Concrete Structures. China Building Industry: Beijing, China, 2015.
- Carreira, D.J.; Chu, K.-H. Stress-strain relationship for plain concrete in compression. J. Am. Concr. Inst. 1985, 82, 797–804. [Google Scholar]
- EN 1992-1-1, Eurocode 2: Design of Concrete Structures-Part 1.1: General Rules and Rules for Buildings, The European Union Per Regulation, Europe. 2004. Available online: https://www.phd.eng.br/wp-content/uploads/2015/12/en.1992.1.1.2004.pdf (accessed on 9 January 2022).
- Hognestad, E. A Study of Combined Bending and Axial Load in Reinforced Concrete Members; University of Illinois, Urbana: Trondheim, Norway, 1951. [Google Scholar]
- Yi, S.; Kim, J.; Oh, T. Effect of strength and age on the stress–strain curves of concrete specimens. Cem. Concr. Res. 2003, 33, 1235–1244. [Google Scholar] [CrossRef]
- Guo, Z.H.; Zhang, X.Q. Experimental investigation of stress-strain curves for concrete. Chin. J. Build. Struct. 1982, 3, 1–12. [Google Scholar]
- Peng, J.; Du, T.; Zhao, T.; Song, X.; Tang, J. Stress-strain relationship model of recycled concrete based on strength and replacement rate of recycled coarse aggregate. J. Mater. Civ. Eng. 2019, 31, 04019189. [Google Scholar] [CrossRef]
- Xiao, J.; Li, J.; Zhang, C. Mechanical properties of recycled aggregate concrete under uniaxial loading. Cem. Concr. Res. 2005, 35, 1187–1194. [Google Scholar] [CrossRef]
- Xiao, J.; Zhang, K.; Akbarnezhad, A. Variability of stress-strain relationship for recycled aggregate concrete under uniaxial compression loading. J. Clean. Prod. 2018, 181, 753–771. [Google Scholar] [CrossRef]
- Du, T.; Wang, W.; Liu, Z.; Lin, H.; Guo, T. The complete stress-strain curve of recycled aggregate concrete under uniaxial compression loading. J. Wuhan Univ. Technol. Mater. Sci. Ed. 2010, 25, 862–865. [Google Scholar] [CrossRef]
- ACI 318-08; Building Code Requirements for Structural Concrete and Commentary. American Concrete Institute: Farmington Hills, MI, USA, 1999.


| Spec. ID | Recycled GFRP Replacement Ratio (vol.%) | Mix Proportions (kg/m3) | |||||
|---|---|---|---|---|---|---|---|
| W/C | Water | OPC | Natural Aggregate | Recycled GFRP Aggregate | Sand | ||
| FRP0 | 0 | 0.45 | 190 | 422 | 950 | 0 | 683 |
| FRP30 | 30 | 0.45 | 190 | 422 | 666 | 225 | 683 |
| FRP50 | 50 | 0.45 | 190 | 422 | 475 | 375 | 683 |
| FRP70 | 70 | 0.45 | 190 | 422 | 285 | 526 | 683 |
| FRP100 | 100 | 0.45 | 190 | 422 | 0 | 751 | 683 |
| Indicators | Value (Type) |
|---|---|
| Tensile strength (MPa) | 920–1230 |
| Tensile modulus of elasticity (GPa) | 53 |
| Density (kg/m3) | 1933–2070 |
| Fiber content by weight (%) | 78 |
| Fiber type | E glass fiber |
| Matrix type | Unsaturation resin |
| Type | Bulk Density (kg/m3) | Crushing Value (wt.%) | Cylinder Compressive Strength (MPa) |
|---|---|---|---|
| Natural aggregate | 1513.67 | 9.55 | 19.43 |
| Recycled GFRP aggregate | 1195.67 | \ | 36.35 |
| Spec. ID | r (%) | f’c (MPa) | Avg. (MPa) | Change a (%) | Ec (GPa) | Avg. (GPa) | Change b (%) | ε′c (%) | Avg. (%) | Change c (%) |
|---|---|---|---|---|---|---|---|---|---|---|
| FRP0-1 | 0 | 38.06 | 37.04 | / | 27.11 | 26.54 | / | 0.24 | 0.26 | / |
| FRP0-2 | 0 | 38.40 | 25.97 | 0.27 | ||||||
| FRP0-3 | 0 | 34.67 | 52.91 | 0.13 | ||||||
| FRP30-1 | 30 | 14.26 | 16.11 | −56.52 | 21.92 | 23.89 | −9.97 | 0.12 | 0.13 | −50.00 |
| FRP30-2 | 30 | 18.30 | 24.89 | 0.15 | ||||||
| FRP30-3 | 30 | 15.76 | 24.87 | 0.11 | ||||||
| FRP50-1 | 50 | 15.13 | 13.42 | −63.76 | 20.76 | 18.77 | −29.28 | 0.13 | 0.14 | −46.15 |
| FRP50-2 | 50 | 10.17 | 15.10 | 0.25 | ||||||
| FRP50-3 | 50 | 14.97 | 20.44 | 0.14 | ||||||
| FRP70-1 | 70 | 8.83 | 8.43 | −77.23 | 11.36 | 12.17 | −54.14 | 0.12 | 0.13 | −50.00 |
| FRP70-2 | 70 | 8.74 | 13.80 | 0.10 | ||||||
| FRP70-3 | 70 | 7.73 | 11.35 | 0.16 | ||||||
| FRP100-1 | 100 | 5.83 | 5.51 | −85.13 | 6.01 | 7.48 | −71.82 | 0.18 | 0.17 | −34.62 |
| FRP100-2 | 100 | 6.31 | 6.63 | 0.15 | ||||||
| FRP100-3 | 100 | 4.39 | 9.80 | 0.34 |
| Test | Replacement (%) | Change a (%) | Material | Gradation of FRP Aggregate |
|---|---|---|---|---|
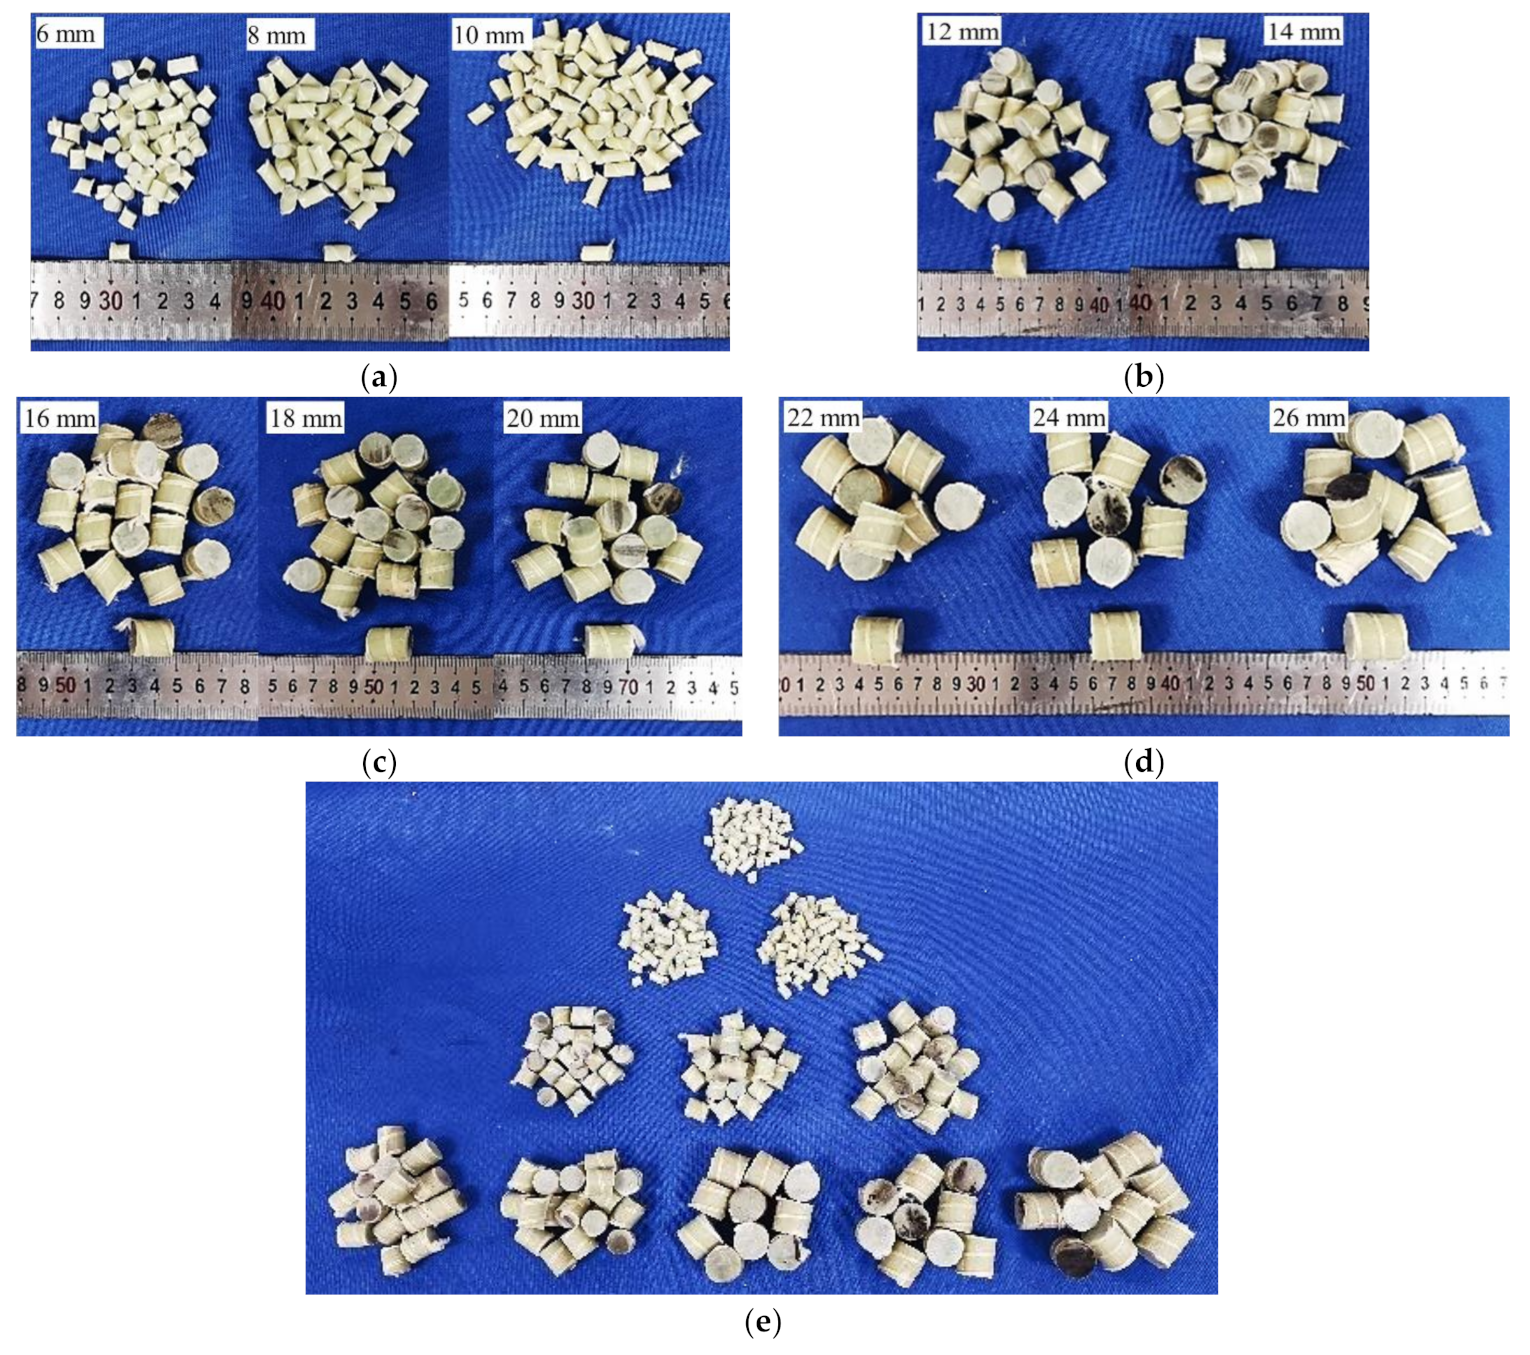
| This study | 0 | / | GFRP rebars (E glass fibers and unsaturation resin) | ASTM C33 No.57 (Granular FRP aggregate size: 6 mm, 8 mm, 10 mm, 12 mm, 14 mm, 16 mm, 18 mm, 20 mm, 22 mm, 24 mm, 26 mm) |
| 30 | −56.52 | |||
| 50 | −63.76 | |||
| 70 | −77.23 | |||
| 100 | −85.13 | |||
| Alam et al. [27] | 0 | / | The excess from the casting of waterslides | CSA A23. (square FRP aggregate size: 10 mm–30 mm) |
| 25 | −37.64 | |||
| 50 | −51.09 | |||
| Fox [26] | 0 | / | Wind turbine blades | |
| 25 | −22.96 | Cubic FRP size: 25 mm | ||
| 37.5 | −38.27 | |||
| 50 | −45.43 | |||
| 50 | −44.94 | Cubic FRP size: 13 mm | ||
| 50 | −45.43 | Cubic FRP size: 13 mm (25%) + 25 mm (25%) | ||
| 50 | −44.2 | Cubic FRP size: 25 mm | ||
| Yazdanbakhsh et al. [24] | 0 | / | GFRP rebars (ECR glass fibers and vinyl Ester resin) | ASTM C33 No. 56 (graular FRP aggregate size: 6 mm, 10 mm, 13 mm, 16 mm, 19 mm, 25 mm) |
| 40 | −12.53 | |||
| 100 | −21.33 | |||
| 0 | / | |||
| 40 | −12.74 | |||
| 100 | −20.95 | |||
| Yazdanbakhsh et al. [25] | 0 | / | GFRP rebars (ECR glass fibers and vinyl Ester resin) | ASTM C33 No. 56 (graular FRP aggregate size: 6 mm, 10 mm, 13 mm, 16 mm) |
| 5 | −5.72 | |||
| 10 | −3.23 |
Publisher’s Note: MDPI stays neutral with regard to jurisdictional claims in published maps and institutional affiliations. |
© 2022 by the authors. Licensee MDPI, Basel, Switzerland. This article is an open access article distributed under the terms and conditions of the Creative Commons Attribution (CC BY) license (https://creativecommons.org/licenses/by/4.0/).
Share and Cite
Zhou, Y.; Weng, Y.; Li, L.; Hu, B.; Huang, X.; Zhu, Z. Recycled GFRP Aggregate Concrete Considering Aggregate Grading: Compressive Behavior and Stress–Strain Modeling. Polymers 2022, 14, 581. https://doi.org/10.3390/polym14030581
Zhou Y, Weng Y, Li L, Hu B, Huang X, Zhu Z. Recycled GFRP Aggregate Concrete Considering Aggregate Grading: Compressive Behavior and Stress–Strain Modeling. Polymers. 2022; 14(3):581. https://doi.org/10.3390/polym14030581
Chicago/Turabian StyleZhou, Yingwu, Yitao Weng, Limiao Li, Biao Hu, Xiaoxu Huang, and Zhongfeng Zhu. 2022. "Recycled GFRP Aggregate Concrete Considering Aggregate Grading: Compressive Behavior and Stress–Strain Modeling" Polymers 14, no. 3: 581. https://doi.org/10.3390/polym14030581
APA StyleZhou, Y., Weng, Y., Li, L., Hu, B., Huang, X., & Zhu, Z. (2022). Recycled GFRP Aggregate Concrete Considering Aggregate Grading: Compressive Behavior and Stress–Strain Modeling. Polymers, 14(3), 581. https://doi.org/10.3390/polym14030581