Article

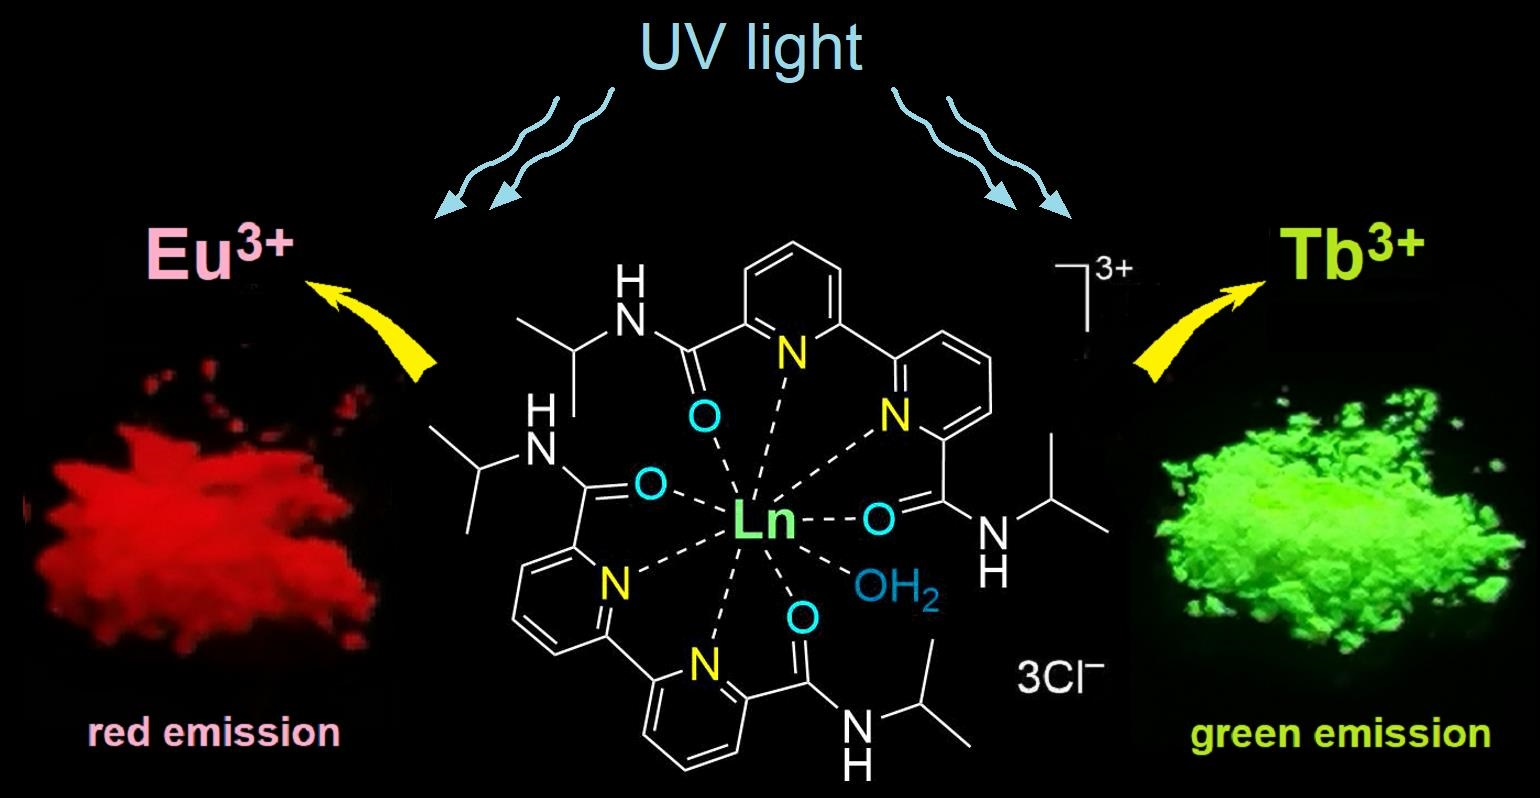
Structural Features of Eu3+ and Tb3+-Bipyridinedicarboxamide Complexes

by
Anna S. Miroshnichenko
1,2,†,
Konstantin V. Deriabin
1,†,
Artem A. Rashevskii
1,
Vitalii V. Suslonov
1,
Alexander S. Novikov
1,3,
Ivan S. Mukhin
1,2,4,5 and
Regina M. Islamova
1,*
1
Institute of Chemistry, St. Petersburg University, 7/9 Universitetskaya Emb., St. Petersburg 199034, Russia
2
ChemBio Cluster, ITMO University, 49 Kronverksky Pr., St. Petersburg 197101, Russia
3
Research Institute of Chemistry, Peoples’ Friendship University of Russia (RUDN University), 6 Miklukho-Maklaya Str., Moscow 117198, Russia
4
Laboratory of Renewable Energy Sources, St. Petersburg Academic University, 8/3 Khlopina Str., St. Petersburg 194021, Russia
5
High School of Engineering Physics, The Great St. Petersburg Polytechnical University, 29 Polytechnicheskaya Str., St. Petersburg 195251, Russia
*
Author to whom correspondence should be addressed.
These authors contributed equally to this work.
Polymers 2022, 14(24), 5540; https://doi.org/10.3390/polym14245540
Submission received: 25 November 2022 / Revised: 9 December 2022 / Accepted: 14 December 2022 / Published: 18 December 2022

Abstract

:
Photoluminescent lanthanide complexes of Eu3+ and Tb3+ as central atoms and N6,N6-diisopropyl-[2,2′-bipyridine]-6,6′-dicarboxamide as ligand were synthesized. The structure of these complexes was established by single-crystal X-ray diffraction, mass spectrometry, 1H and 13C nuclear magnetic resonance, ultraviolet-visible, infrared spectroscopy, and thermogravimetry. Bipyridinic ligands provide formation of coordinatively saturated complexes of lanthanide ions and strong photoluminescence (PL). The Eu3+- and Tb3+-complexes exhibit PL emission in the red and green regions observed at a 340 nm excitation. The quantum yield for the complexes was revealed to be 36.5 and 12.6% for Tb3+- and Eu3+-complexes, respectively. These lanthanide compounds could be employed as photoluminescent solid-state compounds and as emitting fillers in polymer (for example, polyethylene glycol) photoluminescent materials.

Graphical Abstract

1. Introduction

Luminescent lanthanide complexes are receiving a strong interest in their application in optoelectronics [1], photonics [2], amplifiers [3], cell dyes fabrication [4], photocatalysis [5], UV light-sensing or dosimeter materials [6], theranostics [7], and development of fluorescent probes for bioimaging [8]. The mentioned fields associated with lanthanide complexes are due to their narrow emission lines, large Stokes displacement, high quantum yield (QY), and long-lived luminescence lifetimes, as opposed to lanthanide ions directly, which possess the poor light absorption because of Laporte forbidden f-f transitions [9].
Among a great range of photoluminescent lanthanide complexes, europium(III) and terbium(III) organic luminophores are broadly investigated, since Eu3+ and Tb3+ cations have intense pure red and green emission in the visible region [10]. These emission colors are the components of the RGB system [11] that could be used as a light converter for light-emitting diodes and colored displays fabrication.
As mentioned in the ref. [12], 2,2′-bipyridine-6,6′-dicarboxylate ligand in complexes is a highly efficient sensitizer for the “antenna effect”. Thus, the use of 2,2′-bipyridine-6,6′-dicarboxylate ligands, especially amides—N6,N6-diisopropyl-[2,2′-bipyridine]-6,6′-dicarboxamide (BDCA), in europium and terbium complexes, can lead to a relatively higher QY compared to several europium and terbium complexes with some ligands, including phenanthroline derivatives, thenoyltrifluoroacetone, β-diketonates, substituted pyridine, and 2,2′-bipyridine derivatives [13,14,15,16,17,18,19].
To the best of our knowledge, the photoluminescent properties of lanthanide(III) coordinatively saturated complexes with BDCA have never been studied. The only known similar lanthanide(III)-incorporating polymer-metal complexes (PMCs) are based on polydimethylsiloxanes functionalized by tetradentate bipyridine, functioning as ligands toward Eu3+ and Tb3+ [11]. Previously, we designed PMCs of Eu3+ and Tb3+-bipyridinedicarboxamide-co-polydimethylsiloxanes, which exhibit a high photoresponse and are applied as flexible, self-healing, and color-tunable photoluminophores in flexible device applications [11]. The main advantage of these PMCs is that they can be mechanically stacked one above another to achieve the desired emission color in the spectral range from green to yellow and red. The external quantum efficiency of these PMCs was good enough, however, it did not exceed 10.5% and 18.3% at a 340 nm excitation in the case of Eu and Tb-PMCs, respectively. These QY values are related to luminescence quenching due to the use of a polymer ligand [20]. Therefore, the use of low-molecular-weight BDCA ligand instead of polysiloxane bipyridine-containing ligand can increase QY compared to ref. [11]. Hence, the development of methods for the synthesis of luminescent complexes based on Eu3+, Tb3+, and BDCA, with high QY, is a challenging task.
Thus, the aims of the study are to (i) synthesize lanthanide complexes with a novel framework by complexation of Eu3+ and Tb3+ ions with N6,N6-diisopropyl-[2,2′-bipyridine]-6,6′-dicarboxamide (BDCA) organic ligand, (ii) establish their structure by single-crystal X-ray diffraction (XRD), high-resolution electrospray ionization mass spectrometry (HRESIMS), 1H, 13C NMR, UV-vis, and FTIR spectroscopy, (iii) study their photoluminescent properties, (iv) incorporation of Eu, Tb-complexes as fillers in polymer films (polyethylene glycol, PEG) for creating luminescent composites, and (v) study their thermal stability. All our experimental data and the corresponding discussion are detailed in the following sections.

2. Results

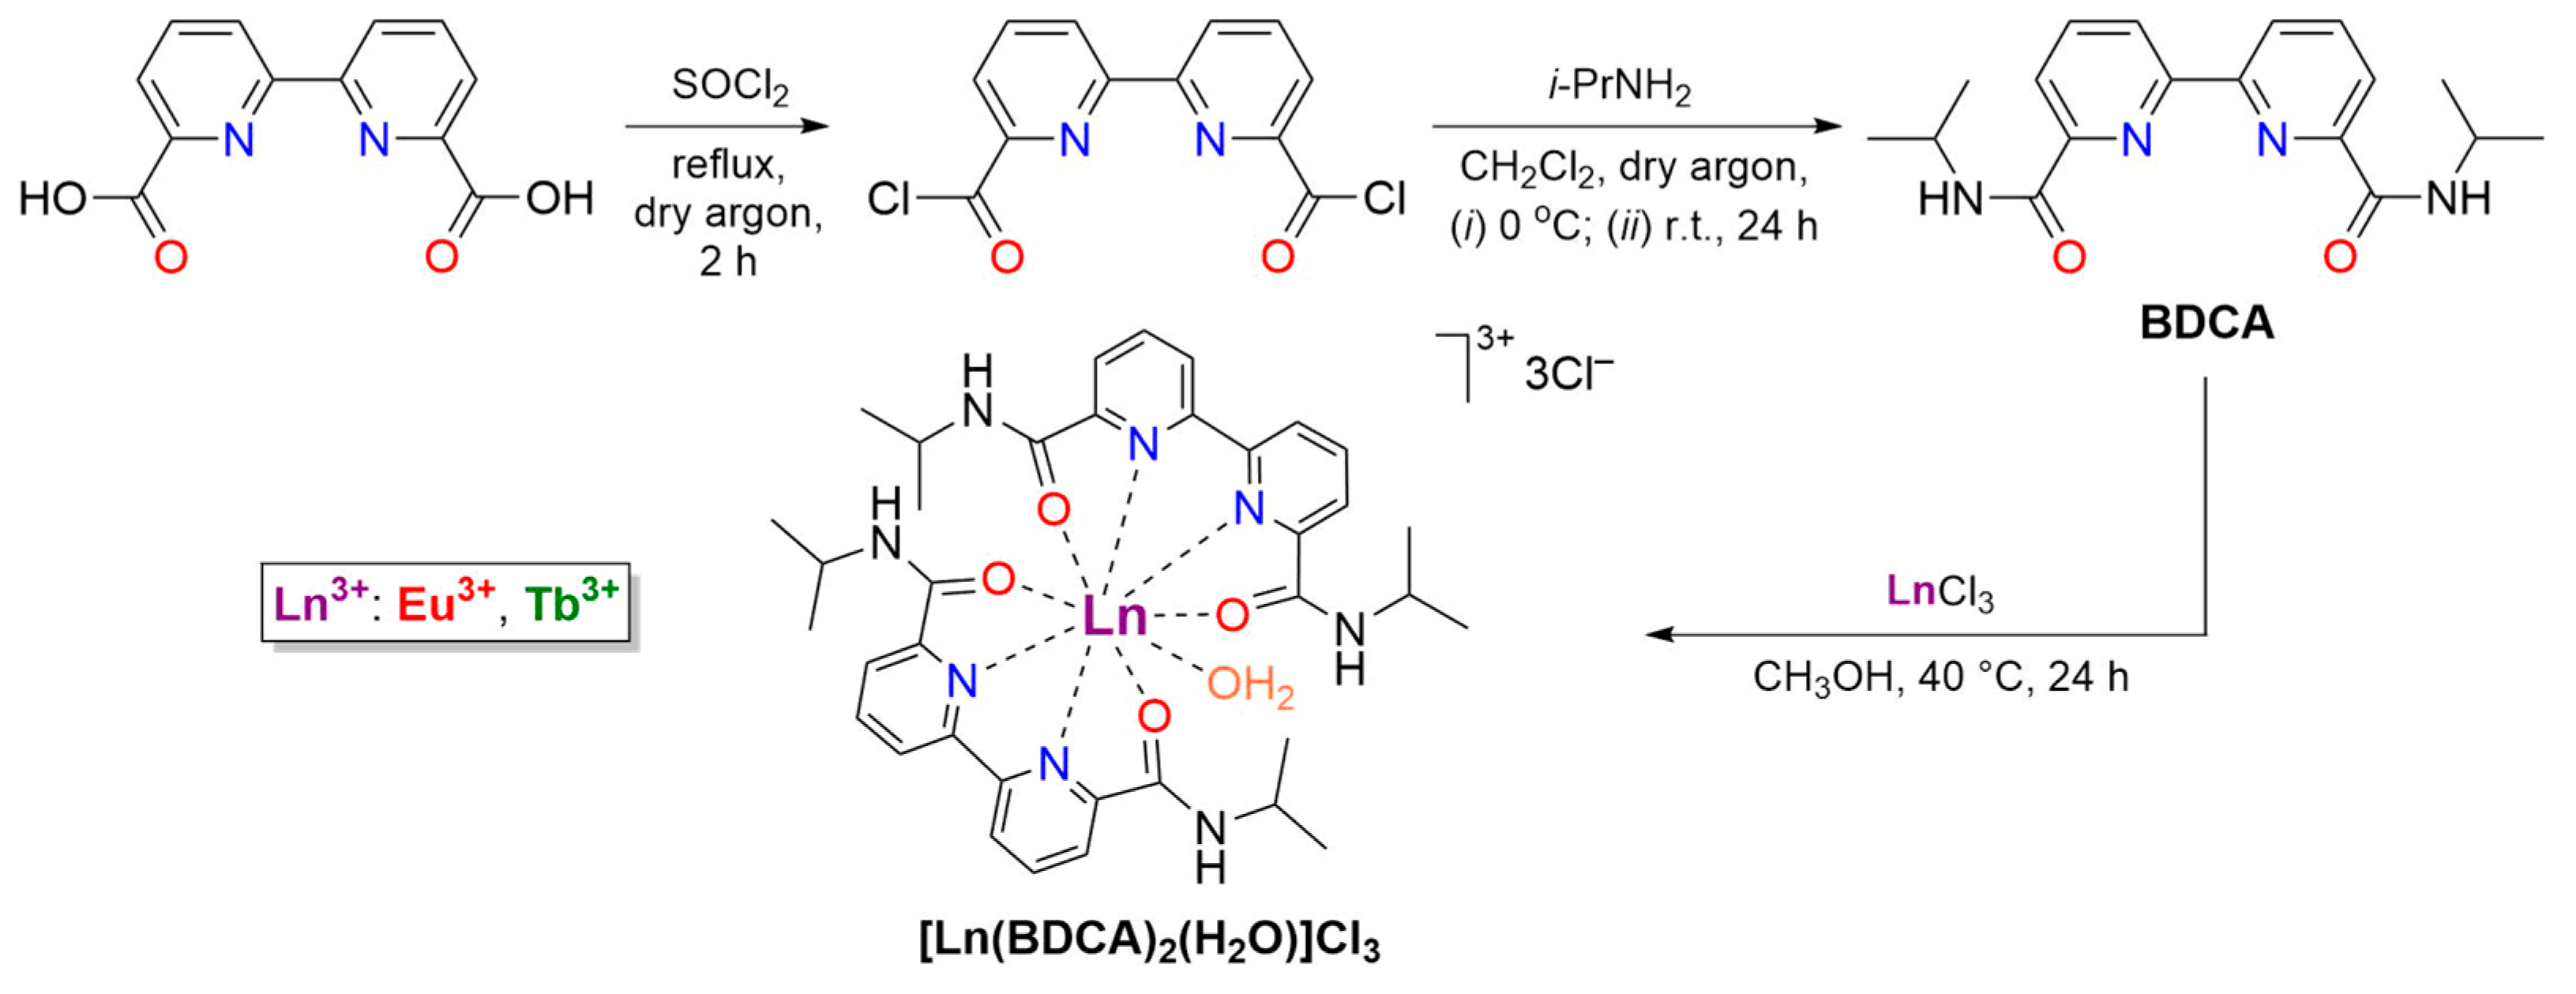
2.1. Synthesis of Lanthanide Complexes

Lanthanide(III) complexes [Eu(BDCA)2(H2O)]Cl3 and [Tb(BDCA)2(H2O)]Cl3 were synthesized by a three-stage procedure including the two-step synthesis of ligand and its complexation with lanthanide(III) chlorides (Scheme 1).
The BDCA ligand was obtained by the reaction between pre-prepared [2,2′-bipyridine]-6,6′-dicarbonyl dichloride (Scheme 1) and isopropylamine in CH2Cl2 at room temperature (r.t., 21 °C). The structure of BDCA ligand was established by 1H NMR, indicating a 1H NMR signal of amide groups (NHC(=O) at δ = 8.62 ppm, 13C NMR (spectra are illustrated in Figure S1 in the Supplementary Material), HRESIMS, and single-crystal XRD (Figures S2 and S3, Table S1).
In the last stage, the complexation between BDCA and dry lanthanide(III) chlorides (EuCl3 and TbCl3) with metal–ligand molar ratio of 1:2 was conducted in a CH3OH solution at 40 °C for 24 h in order to obtain complexes [Eu(BDCA)2(H2O)]Cl3 and [Tb(BDCA)2(H2O)]Cl3. The synthesized complexes are soluble in DMSO and alcohols, especially EtOH.

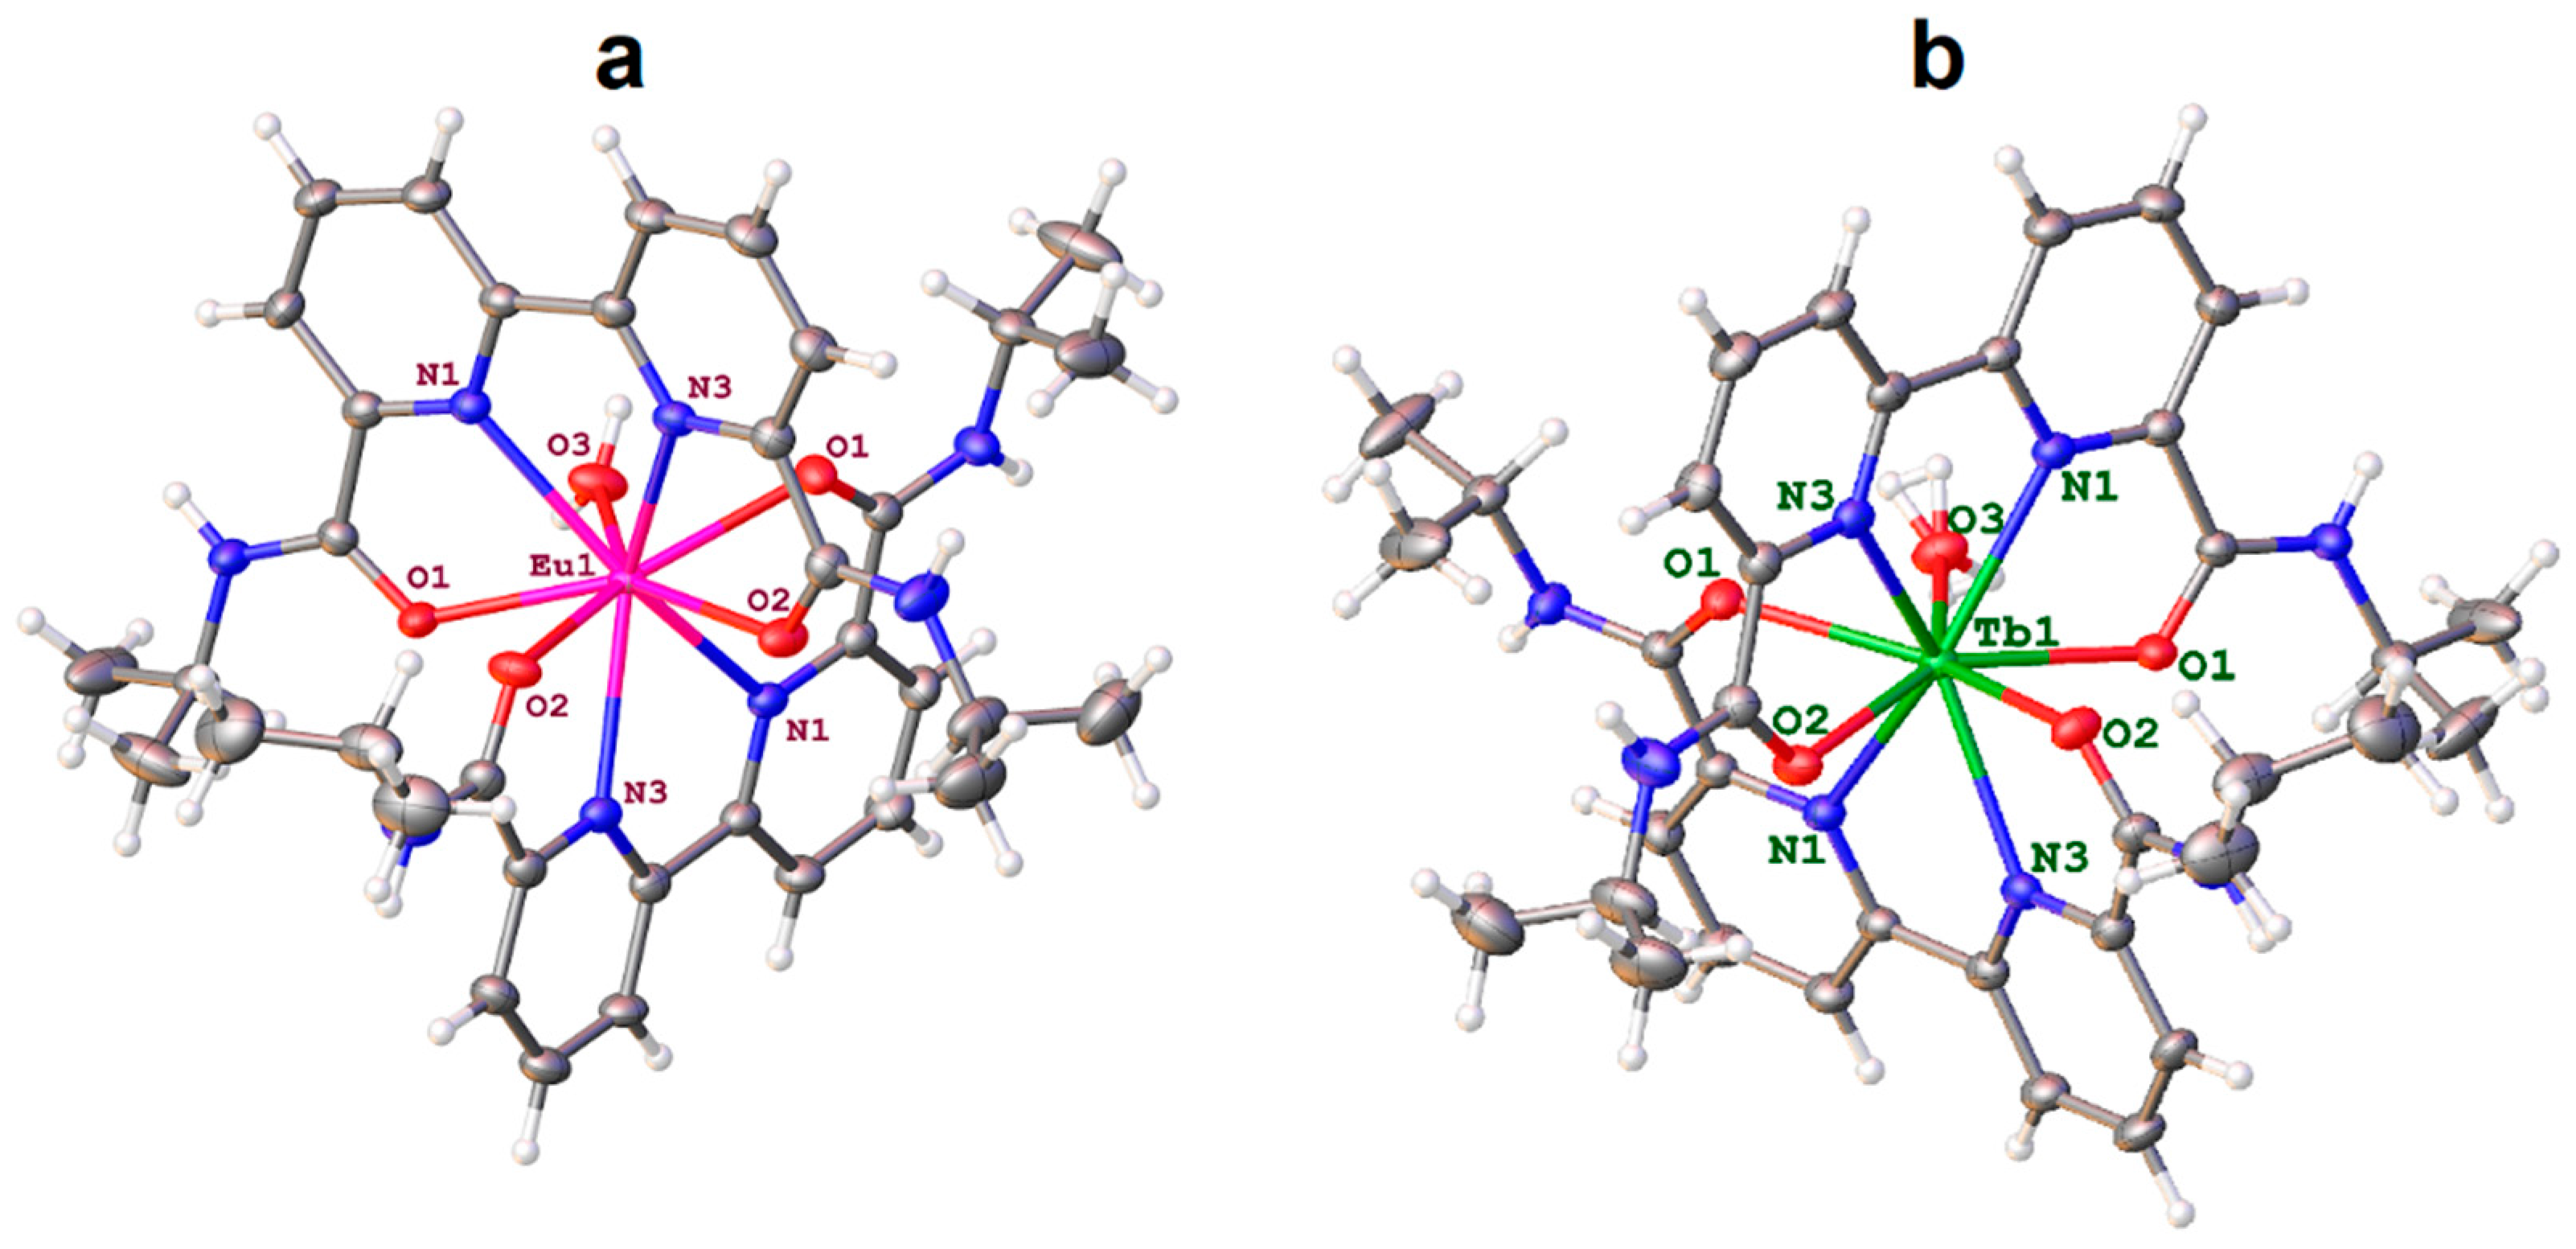
2.2. Structure of Lanthanide Complexes

The synthesized complexes were then characterized by XRD, HRESIMS, FTIR, and UV-vis (Figure 1 and Figure 2 and Figures S4 and S5, Table S1). The single-crystal XRD data indicated that lanthanide(III) coordination with BDCA induces bonding between Ln–NBipy and Ln−O (Ln = Eu, Tb, Figure 1, for details, see Experimental section). The complexation between BDCA and Ln3+ should be conducted via O,N,N,O-chelating moieties ligation. Thus, considering the coordination number 9 of Ln3+, the only possible conclusion in the metal–ligand molar ratio is 1:2. Europium and terbium complexes have the same geometry of the nine-vertex polyhedron with distorted pentagonal coordination formed by oxygen atoms in the equatorial position and nitrogen atoms along the tetragonal tetrahedron in apical positions. This coordination polyhedron contains crystallographic 2-fold axes passing through the metal atom and the coordinated water molecule.
In the HRESIMS spectra, the [Eu(BDCA)2]3+ (m/3 = 268.4233) and [Tb(BDCA)2]3+ ions (m/3 = 270.4241) were indicated with their characteristic isotopic distribution (Figures S4 and S5), respectively. In the FTIR spectra of [Eu(BDCA)2(H2O)]Cl3 and [Tb(BDCA)2(H2O)]Cl3, the amide I ν(C=O) band was shifted from 1653 to 1631 cm−1 in comparison with the BDCA (Figure 2a). According to the refs. [11,21,22,23], this band shift can be attributed to the involvement of the C=O group in the coordination.
As a result, [Eu(BDCA)2(H2O)]Cl3 and [Tb(BDCA)2(H2O)]Cl3 complexes were synthesized by a complexation of EuCl3 and TbCl3 with BDCA ligand. Considering all the spectral, XRD, and HRESIMS data, we conclude that the ligation of BDCA occurred via Ln–NBipy and Ln−O bonding. The complexes are heteroleptic, composed of Ln3+, two BDCA ligands, and one molecule of coordinated H2O.

2.3. Theoretical Calculations of HOMO–LUMO Energy Gaps

The energies for the coordination bonds Ln–O and Ln–NBipy (Ln = Eu, Tb) were computed by appropriate quantum chemical calculations at the ωB97XD/DZP-DKH level of theory, followed by the topological analysis of the electron density distribution (for details, see the Computational Details section in the Supplementary Material). Our results are summarized in Table S2, while the model structures, the contour line diagrams of the Laplacian of electron density distribution 2ρ(r), bond paths, selected zero-flux surfaces, visualization of electron localization function (ELF), reduced density gradient analyses referring to coordination bonds Ln–O and Ln–NBipy, and Cartesian atomic coordinates of [Eu(BDCA)2(H2O)]Cl3 and [Tb(BDCA)2(H2O)]Cl3 model structures are shown in Figures S6−S8 and Table S3 (Supplementary Material). Thus, Ln–N coordination bonds exhibited a slightly longer bond length (c.a. 2.5 Å) and energy values (c.a. 11–12 kcal·mol−1) lower than the Ln–O bonds (l = 2.4 Å, Eint = 15–16 kcal·mol−1). Two BDCA ligands are similarly ligated to the Ln3+ center in terms of binding energies.
The calculated HOMO–LUMO energy gaps (EH-L) in model structures [Eu(BDCA)2(H2O)]Cl3 and [Tb(BDCA)2(H2O)]Cl3 are 7.50 and 8.17 eV, respectively (theoretical calculations are presented in Section S4.2 in the Supplementary Material).

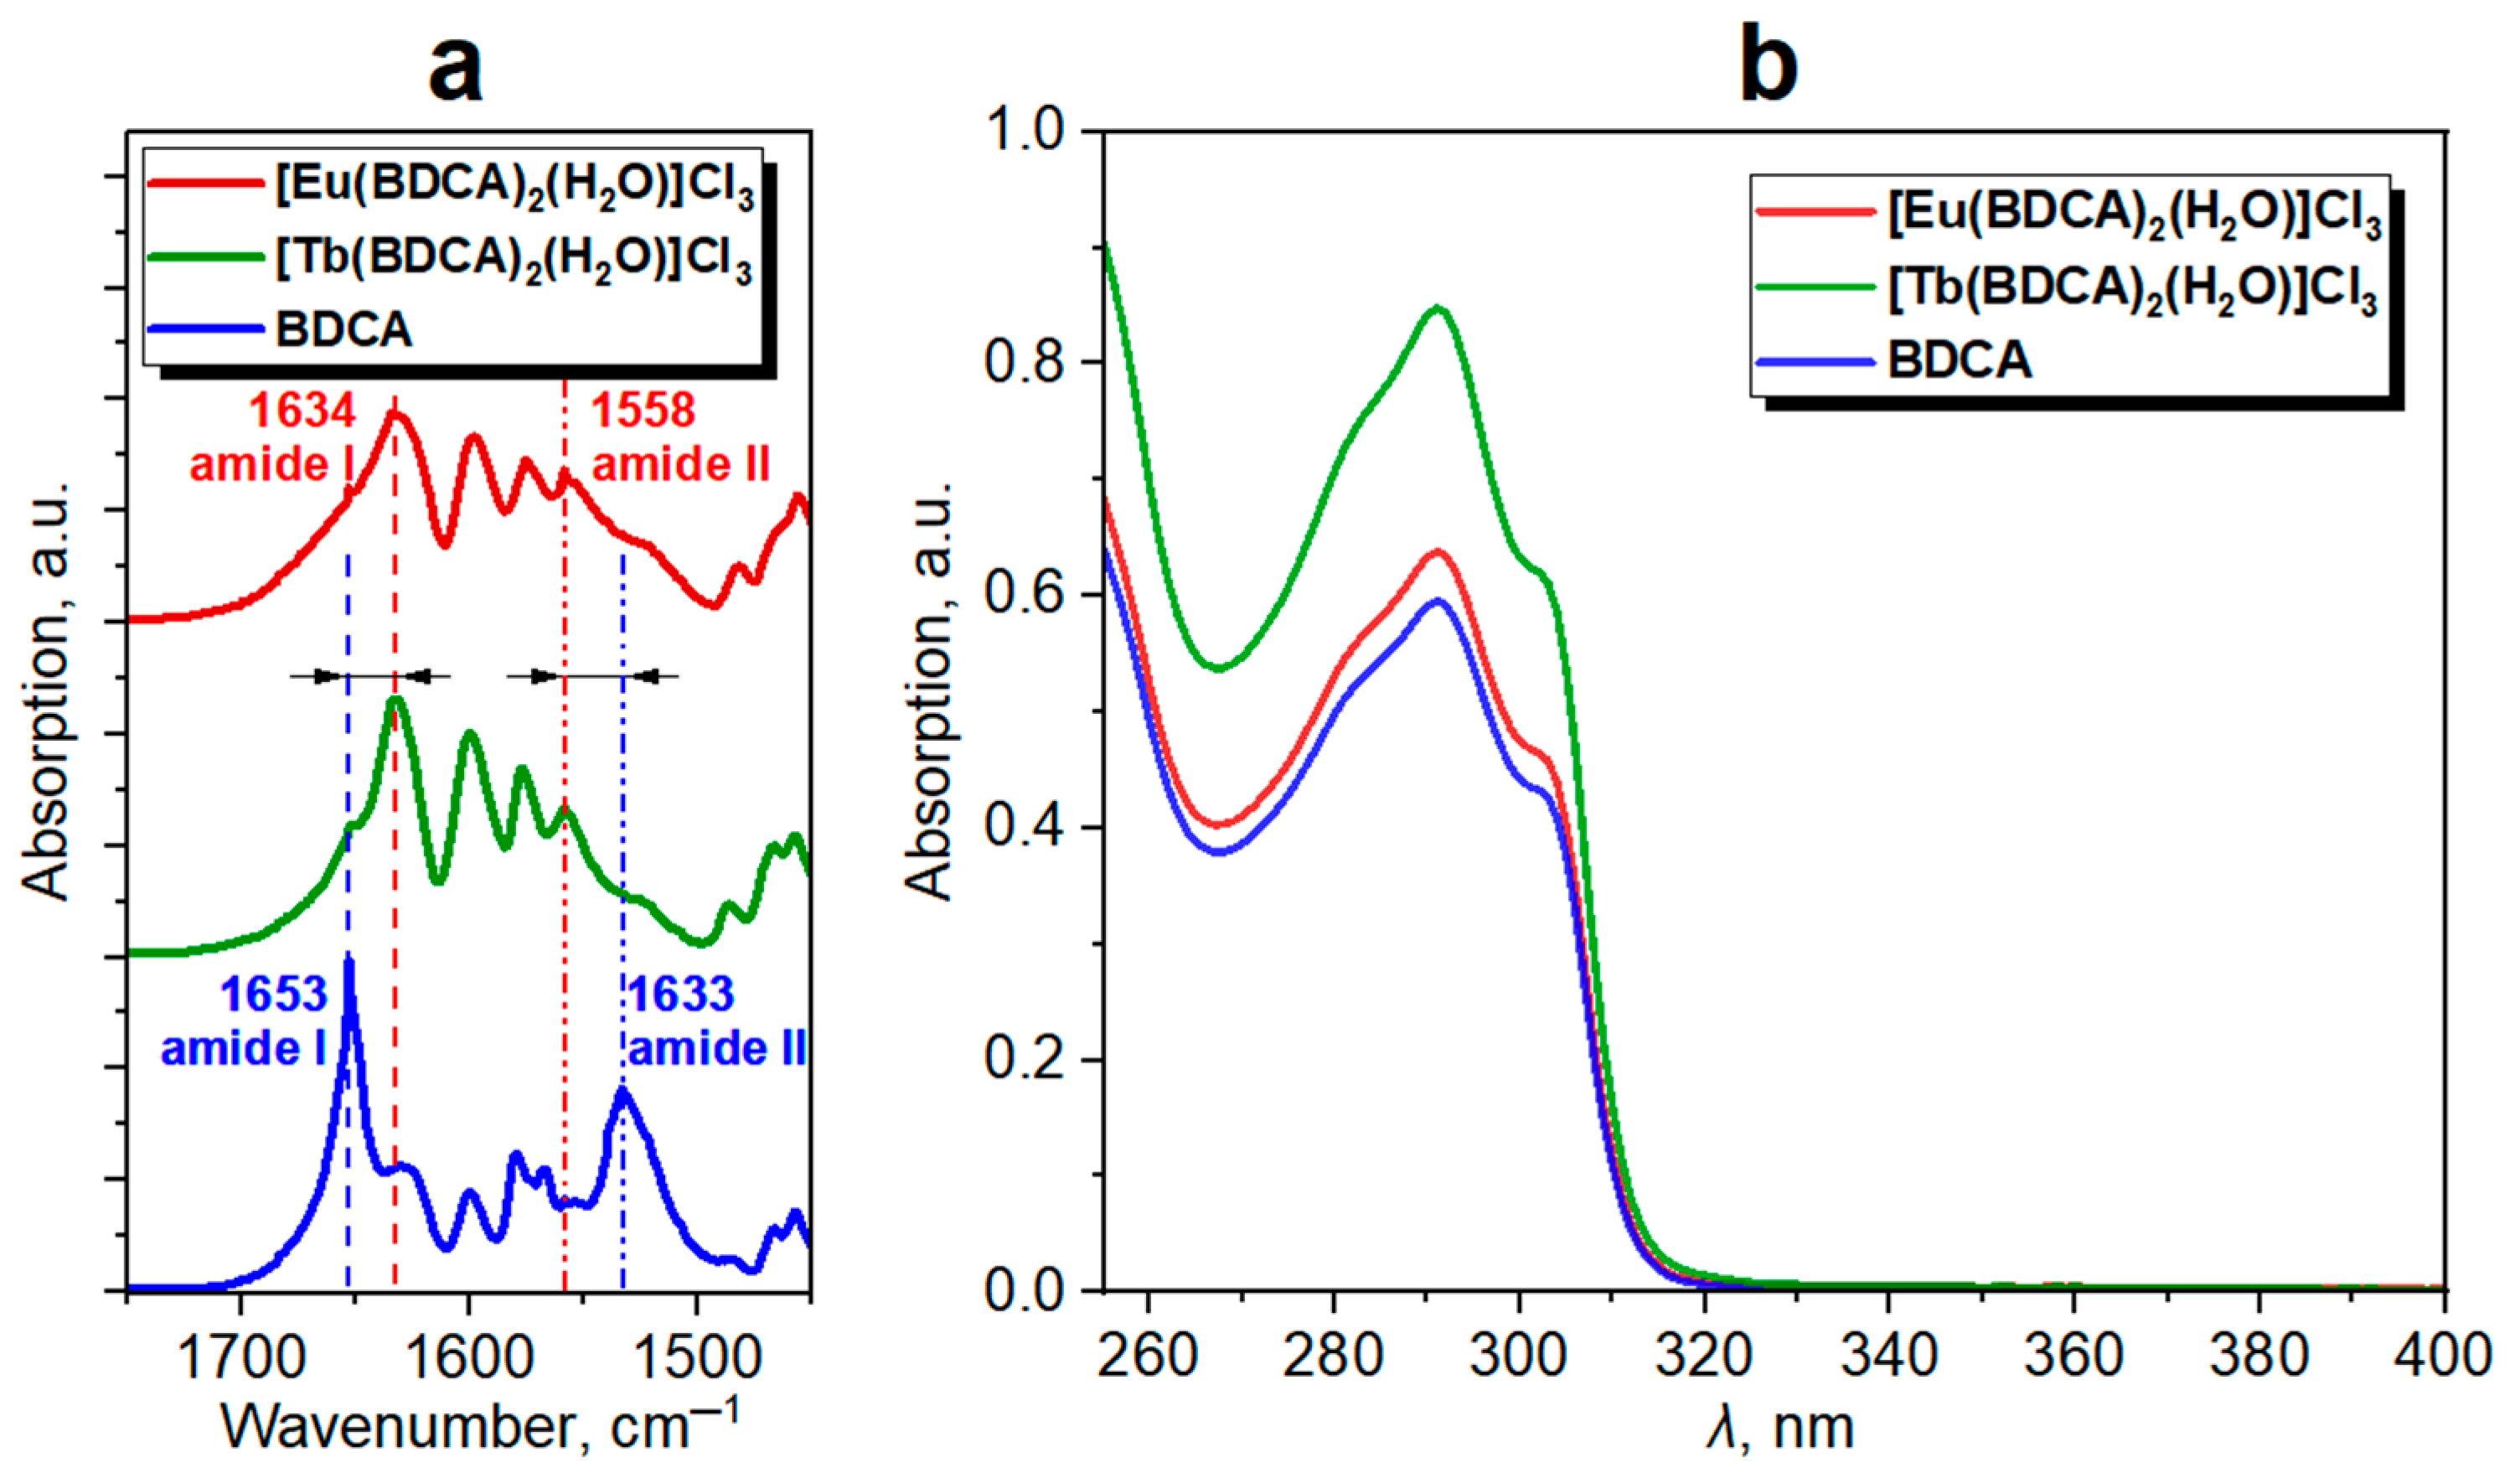
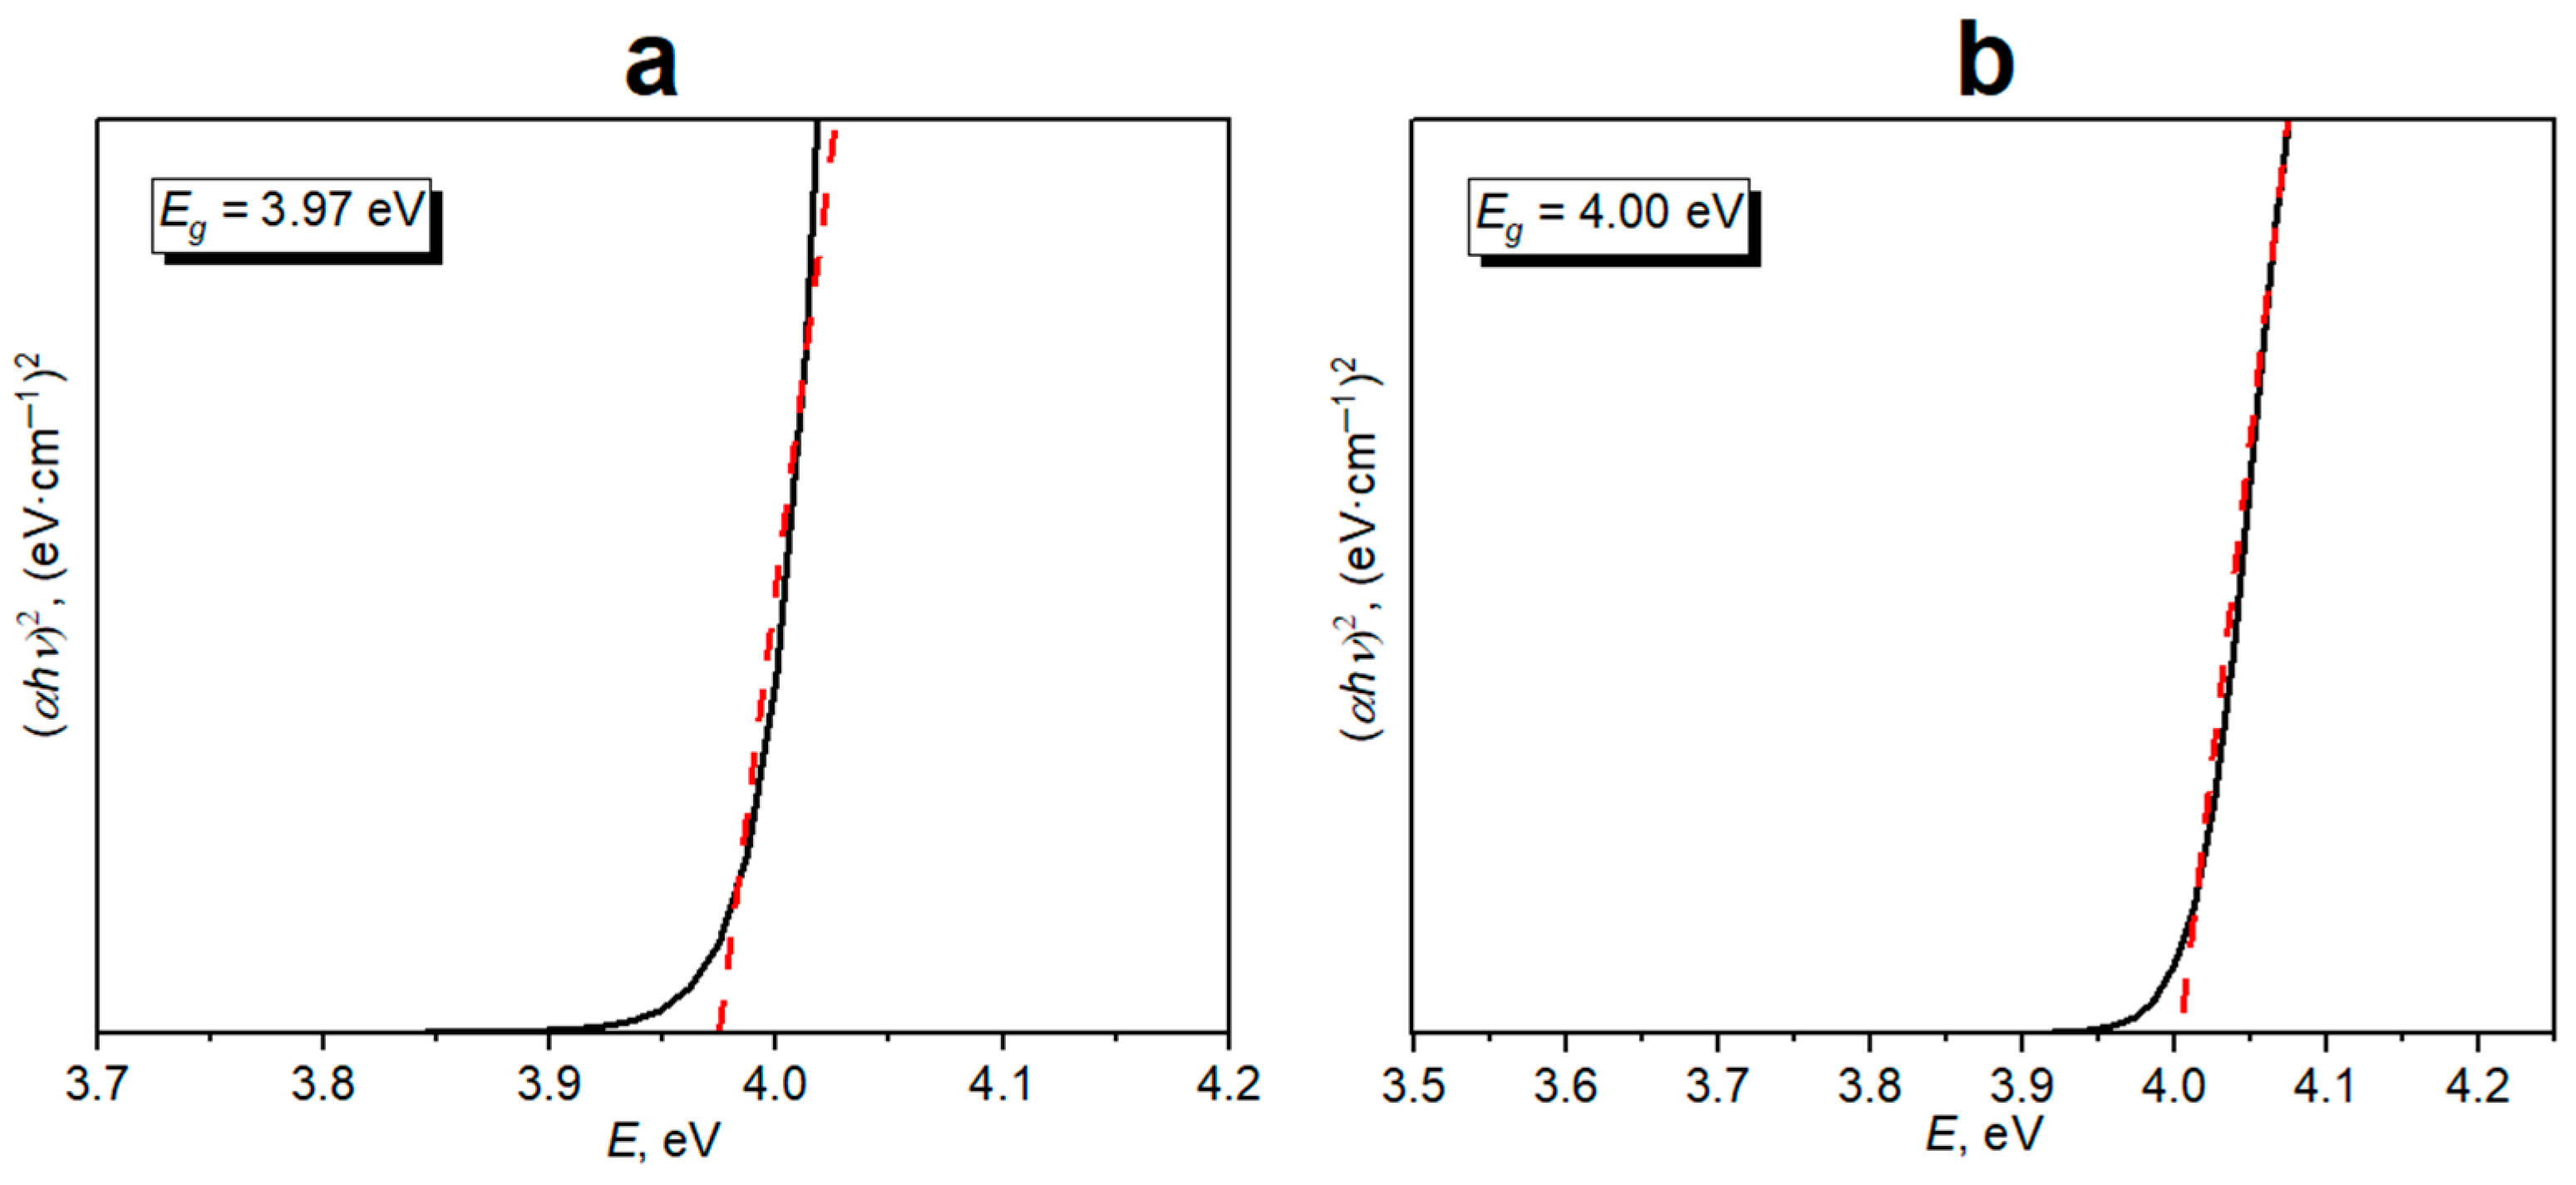
2.4. Band Gap Estimation by UV-Vis Absorption Study

In the UV-vis spectra of [Eu(BDCA)2(H2O)]Cl3 and [Tb(BDCA)2(H2O)]Cl3 (Figure 2b), a peak at 291 nm (with two shoulders at 283 and 302 nm) is observed, which corresponds to ligand-to-metal charge transfer (LMCT) (theoretical modeling of UV-vis absorption spectra is presented in Section S4.3 in the Supplementary Material, Figure S9). The UV-vis spectra of the complexes were similar to the spectral shape of the free ligand, since the π–π* state energy was probably not influenced by the coordination sphere of the metal [2,15,24,25,26].
Optical band gap of [Eu(BDCA)2(H2O)]Cl3 and [Tb(BDCA)2(H2O)]Cl3 was estimated from absorption spectral data using Tauc’s relation (Equation 1), which is represented below:
αE = A(EEg)m,
where α, E, and m represent absorption coefficient, photon’s energy, and optical parameters, respectively [27]. Tauc’s profiles were plotted as (αhυ) 2–energy (E). Extrapolation of the tangent down to the x-axis provides the value of the band gap. Figure 3 shows the Tauc’s profiles of complexes, which demonstrate a similar band gap Eg = 4.0 eV of [Eu(BDCA)2(H2O)]Cl3 and [Tb(BDCA)2(H2O)]Cl3.
As a result, optical band gap values gained from absorption spectral data using Tauc’s plot (Eg = 4.0 eV) is c.a. two times lower than calculated EH-L (7.50 and 8.17 eV).
The calculated by the density-functional theory method (DFT) HOMO–LUMO gap gives only an approximation of the band gap and does not take into account the formation of electron-hole semi-particle in the excited state [28]. Thus, the optical gap obtained by Tauc’s relation from the UV-vis spectrum corresponds to the energy of the lowest electronic transition and could be substantially lower than EH-L.

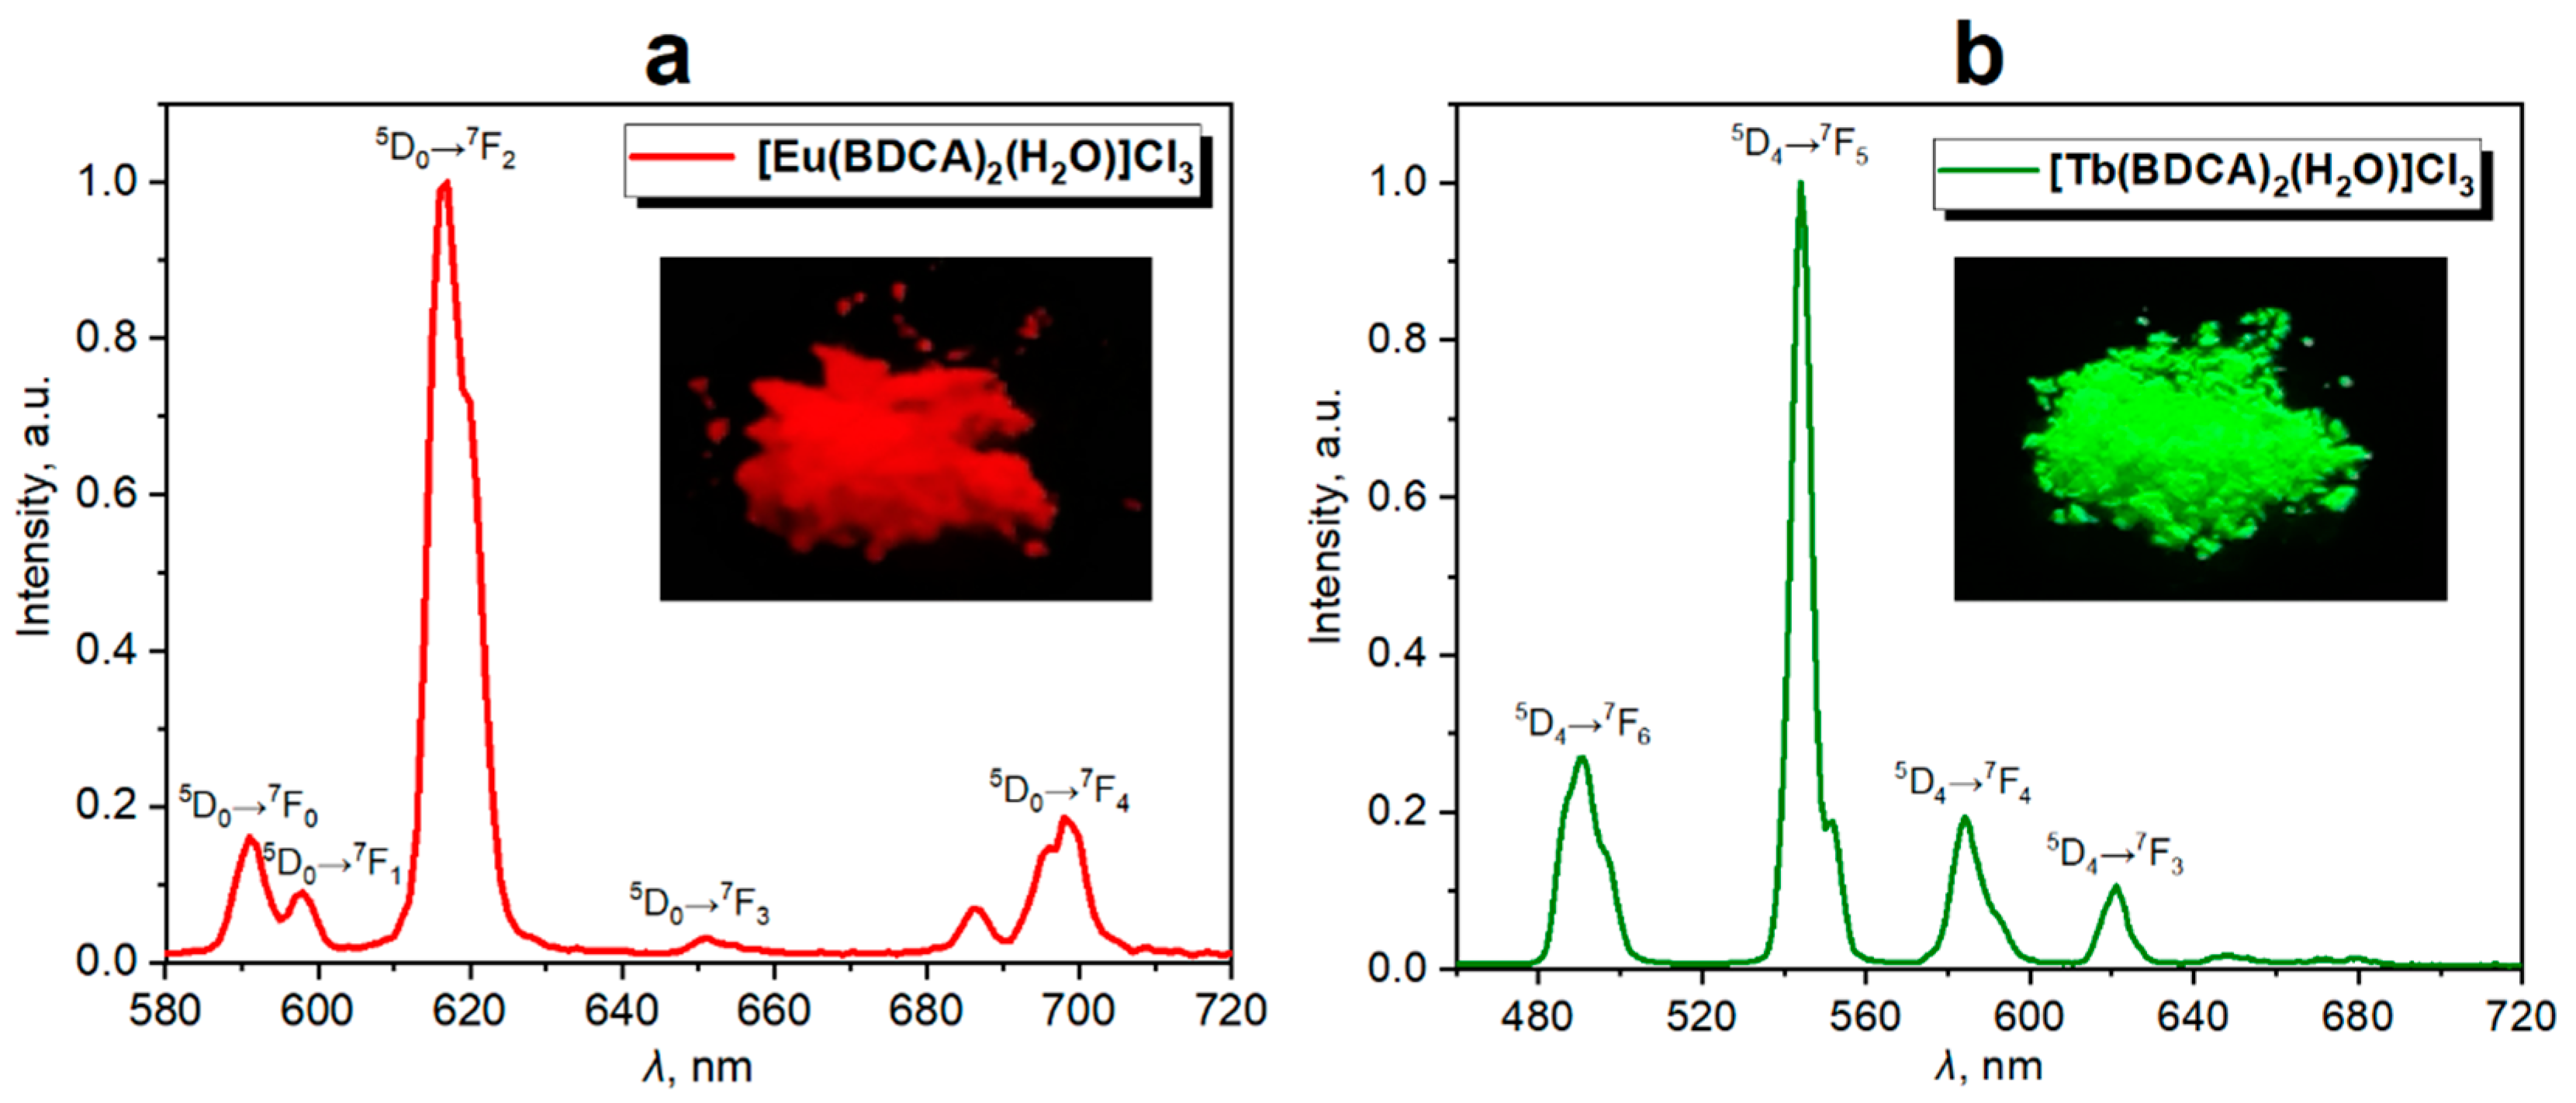
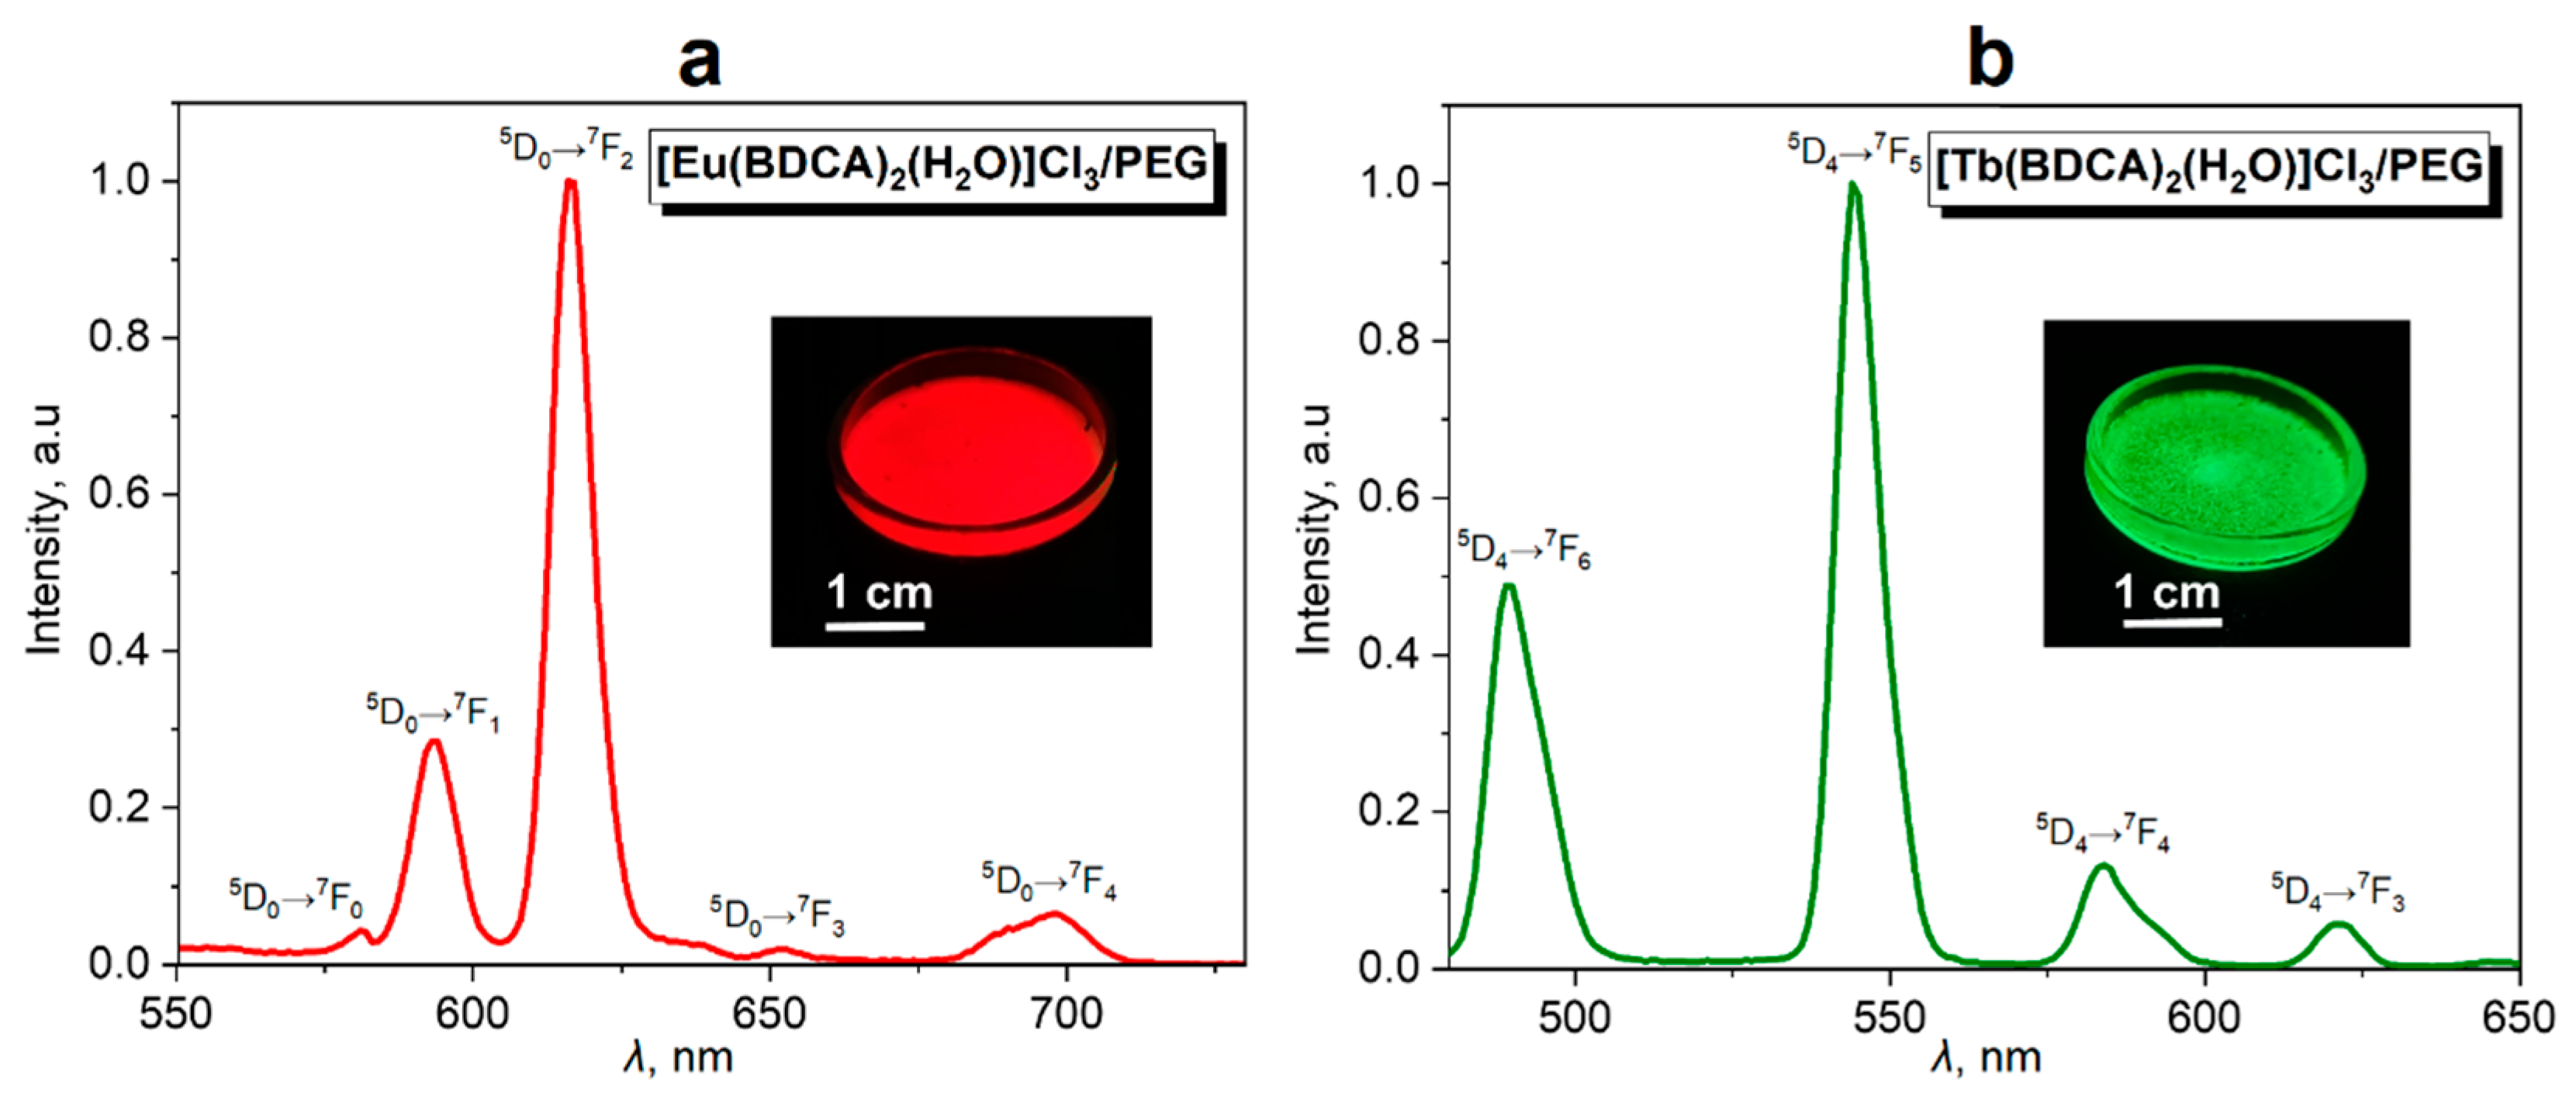
2.5. Luminescent Properties

The use of 2,2′-bipyridine-6,6′-dicarboxylate sensitizer provides efficient energy transfer from an excited state of ligand to Ln3+ excited state, which leads to energy transitions 5D47FJ (J = 6–3) for Tb3+ and 5D07FJ (J = 0–4) for Eu3+ [11,12]. As noticed in the ref. [29], 2,2′-bipyridine-6,6′-dicarboxylate is a highly efficient sensitizer for the “antenna effect”.
Emission spectra of [Eu(BDCA)2(H2O)]Cl3 and [Tb(BDCA)2(H2O)]Cl3 under UV light excitation (at excitation wavelength λex = 340 nm, excitation spectra are illustrated in Figure S10) [11] were acquired (Figure 4). Typical energy transitions of Tb3+ and Eu3+ were observed in PL emission spectra as signals of their characteristic wavelengths.
The studied complexes demonstrate red and green phosphorescence according to acquired PL lifetimes 2.9 and 4.9 ms for [Eu(BDCA)2(H2O)]Cl3 and [Tb(BDCA)2(H2O)]Cl3, respectively (Figure S11).
QY upon direct excitation of the Ln3+ ion is determined mainly by the probability of nonradiative processes. For free ions, the probability of nonradiative transitions is smaller, and the energy gap is larger between the resonant level of the Ln3+ ion and the first level of the main multiplet. QY values for [Eu(BDCA)2(H2O)]Cl3 and [Tb(BDCA)2(H2O)]Cl3 complexes are presented in Table 1. According to the ref. [12], the difference in PL between complexes can be explained by ΔE = 12,300 cm−1 (5D07F0 ) and 14,800 cm−1 (5D47F6) for Eu3+ and Tb3+.
The QY values for [Eu(BDCA)2(H2O)]Cl3 and [Tb(BDCA)2(H2O)]Cl3 are expectedly higher than that of corresponding reported Eu3+ and Tb3+-incorporating PMCs [11] (Table 1) and some other bipyridine derivatives of Eu3+ and Tb3+ [2,14,15]. The increase in QY in complexes is associated with use of low-molecular-weight BDCA ligand in studied complexes instead of bipyridine-incorporating polymer ligand [11]. PMCs contain polymer ligands with the number-average molecular weight of 45,000–50,000 [21] compared to BDCA ligand with a molecular weight of 326, which leads to luminescence quenching [20,30].
The [Eu(BDCA)2(H2O)]Cl3 and [Tb(BDCA)2(H2O)]Cl3 can retain a high QY even after encapsulation in a semitransparent polymer matrix (Figure 5). Taking into account the good solubility of the complexes (Section 2.1. Synthesis of lanthanide complexes), soluble in EtOH PEG was chosen as the polymer matrix. The QY values of [Eu(BDCA)2(H2O)]Cl3 and [Tb(BDCA)2(H2O)]Cl3 encapsulated in PEG were 11.2 and 25.3%, respectively. This was compared to the pure [Eu(BDCA)2(H2O)]Cl3 in the emission spectra signal at 580 nm, which corresponds to the forbidden transition 5D07F0, which disappears after encapsulation in PEG. The intensity increases for the signals 5D07F0 (592 nm) and 5D47F6 (485 nm), which correspond to energy transitions from excited state to ground state of Eu3+ and Tb3+, respectively. More information about excitation spectra and PL lifetimes are described in the Supplementary Material (Section S5—“Luminescent properties”, Figures S10 and S11).

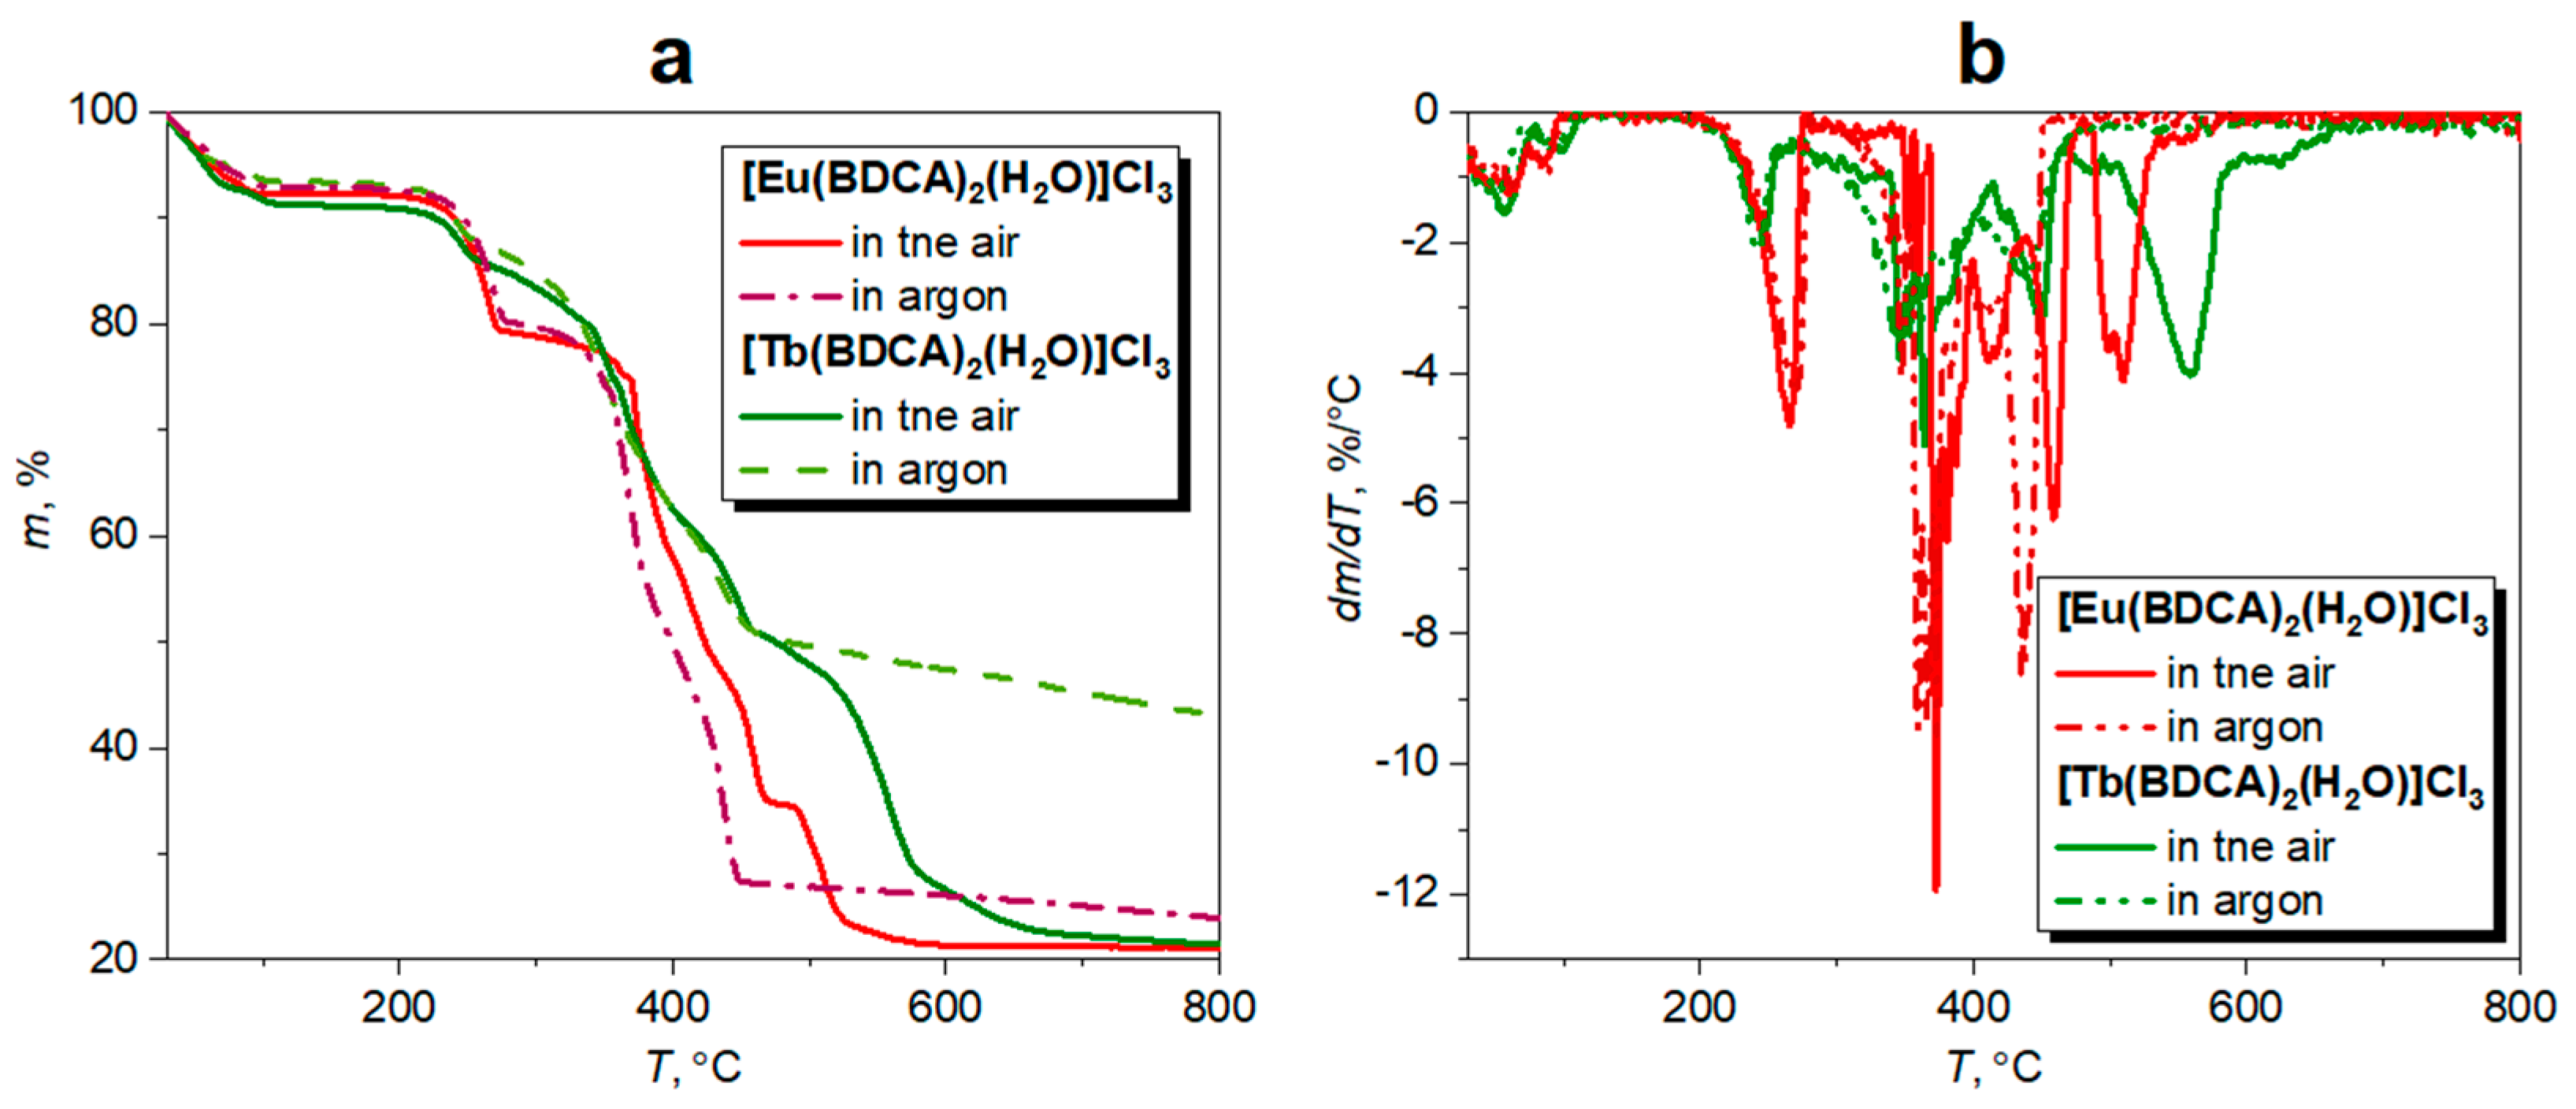
2.6. Thermal Stability

TG and differential TG curves of [Eu(BDCA)2(H2O)]Cl3 and [Tb(BDCA)2(H2O)]Cl3 indicate some steps of mass loss (Figure 6): 5–7% mass loss at 100 °C (dehydration), 15–20% at 280 °C, and 40% at 480 °C. The final thermal destruction of coordination centers of [Eu(BDCA)2(H2O)]Cl3 and [Tb(BDCA)2(H2O)]Cl3 probably starts at 380 °C.

3. Materials and Methods

3.1. Materials

[2,2′-bipyridine]-6,6′-dicarboxylic acid (97%, BLD Pharm, Shanghai, China), Et3N (99%, Abcr GmbH, Karlsruhe, Germany), and isopropylamine (99%, Abcr GmbH, Karlsruhe, Germany) were purchased from commercial suppliers, and their purity was checked by 1H NMR. Ultradry EuCl3 (99.99%) and TbCl3 (99.99%) were acquired from ChemCraft Ltd. (Kaliningrad, Russia). SOCl2 and CH2Cl2 (99%, Vecton, St. Petersburg, Russia) were distilled under argon (though the latter was also over P₂O₅). CH3OH (99%, Vecton, St. Petersburg, Russia) was dried and distilled over (OCH3)2Mg prior to use. Et2O (99%, Vecton, St. Petersburg, Russia) was freshly distilled over sodium/benzophenone under an argon atmosphere prior to use. DMSO (99%, Reachem, Moscow, Russia), EtOH (99%, Himprod, Ekaterinburg, Russia), and PEG polymer (Mn = 10 000; 1.2 g·mL; Merck KGaA, St. Louis, MO, USA) were used as received.

3.2. Methods

The NMR spectra have been recorded on a Bruker Avance III 400 spectrometer (Germany) in DMSO-d6 at r.t. (at 400 MHz for 1H and 100 MHz for 13C). 13C NMR spectra were recorded with 1H decoupling. The chemical shifts are given in δ-values [ppm] and refer to the residual signals of non-deuterated DMSO: δ 2.50 (1H) and 39.5 (13C). The following abbreviations were used to designate multiplicities: s = singlet, d = doublet, t = triplet, m = multiplet, br = broad, and dd = doublet of doublets. FTIR spectra were recorded on a Shimadzu IRAffinity-1 FTIR spectrophotometer (Kyoto, Japan) in KBr pellets. The measurements were carried out at RT in the wavenumber range of 400–4000 cm−1. The following abbreviations of the absorption bands are used to designate intensity: s—strong, m—medium, and w—weak. UV-vis spectra were recorded on a Shimadzu UV-1800 spectrophotometer (Kyoto, Japan) in DMSO. The measurements have been carried out at RT using a quartz cell 1 cm wide in the wavelength range of 250–800 nm. HRESIMS was conducted on a Bruker Maxis HRMS ESI QTOF spectrometer equipped with an electrospray ionization source. The analyzed samples had been dissolved beforehand in pure CH3OH for the HRESIMS measurements. The instrument has been operated at a positive ion mode using the m/z range of 50–400. The most intense peak in the isotopic pattern is noted.
Crystallographic data for all crystals were obtained using Rigaku Oxford Diffraction «SuperNova» (Tokyo, Japan) (in the case of BDCA) and Rigaku Oxford Diffraction «Synergy XtaLAB» (Tokyo, Japan) (in the case of [Eu(BDCA)2(H2O)]Cl3 and [Tb(BDCA)2(H2O)]Cl3) diffractometers with monochromated micro-focus CuKα (λ = 1.54184) X-ray sources. All crystals were kept at 100 K during all data collection. Crystal structures were solved using ShelXT [31] structure solution program and refined by means using ShelXL [32] structure refinement program incorporated in the Olex2 program package [33]. All crystallographic data for this paper can be obtained free of charge via the Cambridge Crystallographic Database.
PL spectra were recorded on a Horiba Fliorolog-3 spectrofluorometer (Jobin Yvon Technology, Bensheim Germany) at r.t. QY measurements were performed using a Shimadzu RF-6000 spectrofluorometer (Kyoto, Japan) with an integrating sphere (101 mm in diameter). PL lifetime steady state measurements were performed via Horiba Fliorolog-3 spectrofluorometer with the impulse xenon lamp with a power of 150 W as an excitation source.
TG was carried out on a NETZSCH TG 209F1 Libra TGA209F1D0024 analyzer (Selb, Germany) in the air and inert (argon) atmosphere. The samples were heated from 50 to 800 °C at a heating rate of 10 °C∙min−1.

3.3. Synthetic Procedures

3.3.1. [2,2′-Bipyridine]-6,6′-Dicarbonyl Dichloride

A round-bottom flask, which was purged with argon, and equipped with a reflux condenser, was charged with [2,2′-bipyridine]-6,6′-dicarboxylic acid (1.0 g, 4.1 mmol), 10 µL of Et3N, and freshly distilled SOCl2 (250 mL). The mixture had been refluxed for 2 h under a constant argon flow until complete dissolution of the dicarboxylic acid and then cooled to r.t. The excess SOCl2 was removed at r.t. under reduced pressure for 3 h to obtain powdery dicarbonyl dichloride. Yield: 1.14 g (99%); beige crystals; mp 288 °C.

3.3.2. N6,N6-Diisopropyl-[2,2′-Bipyridine]-6,6′-Dicarboxamide (BDCA)

A freshly prepared 2,2′-bipyridine-6,6′-dicarbonyl dichloride (1.14 g, 4.06 mmol) solution in dry CH2Cl2 (10 mL) was added to isopropylamine (2.39 g, 40.6 mmol) solution in dry CH2Cl2 (20 mL) by drops at 0 °C under an argon atmosphere. The reaction mixture was stirred at r.t. for 24 h and then filtered. Afterwards, it was filtered and washed with distilled water (3 × 100 mL). The residue was dried under vacuum at 65 °C and washed with Et2O to afford pure BDCA. Yield: 0.93 g (70%); beige powder. 1H NMR (DMSO-d6, δ): 1.28 (d, J = 6.6 Hz, 12H, CH(CH3)2), 4.23 (m, J1 = 6.6 Hz, J2 = 8.5 Hz, 2H, CH(CH3)2), 8.13 (dd, J1 = 7.7 Hz, J2 = 1.3 Hz, 2H, 5,5′-H-Bipy), 8.19 (t, J1 = 7.7 Hz, J2 = 7.7 Hz, 2H, 4,4′-H-Bipy), 8.62 (d, J = 8.5 Hz, 2H, NHC(=O)), 8.98 (dd, J1 = 7.7 Hz, J2 = 1.3 Hz, 2H, 3,3′-H-Bipy). 13C NMR (DMSO-d6, δ): 22.7 (CH(CH3)2), 41.4 (CH(CH3)2), 123.0 (3,3′-CBipy), 124.3 (5,5′-CBipy), 139.3 (4,4′-CBipy), 150.4 (6,6′-CBipy), 153.8 (2,2′-CBipy), 163.2 (C=O). FTIR (KBr, selected bands, ν, cm−1): 3303 (s; ν(N–H)), 1653 (s; νamide I (C=O)), 1533 (s; νamide II (N–H)). UV-vis (DMSO, λmax, nm): 302 (C=O, n→π*), 291 (Bipy, π→π*), and 282 nm (Bipy, π→π*). HRESIMS+: calculated for C18H22N4O2 349.1640, found m/z 349.1630 [M+Na]+. Single crystals of BDCA were grown from CH3OH solution over a one-week period for XRD. Crystal lattice parameters: a = 9.2043(6), b = 11.4313(5), c = 9.6843(6); α = 90°, β = 116.612(8)°, and γ = 90°; monoclinic, space group P21/c (14), temperature 100 K. CCDC number: 2215221.

3.3.3. [Eu(BDCA)2(H2O)]Cl3

BDCA (465 mg, 1.42 mmol) was placed in a round-bottom flask and dissolved in anhydrous CH3OH (20 mL). A solution of dry EuCl3 (175 mg, 0.68 mmol) in 2 mL of anhydrous CH3OH was slowly added dropwise to the resulting mixture. The solution was stirred at 40 °C for 24 h, and the solvent was removed by rotary evaporation at 60 °C. The obtained residue was then washed with Et2O (3 × 50 mL). Yield: 608 mg (95%); beige crystals. FTIR (KBr, selected bands, ν, cm−1): 3410 (s; ν(O–H)), 3220 (s; ν(N–H)), 1634 (s; ν(C = O--Eu)), 1558 (s; νamide II (N–H)), 1456 (m; ν(Py)). UV-vis (DMSO, λmax, nm): 302 (C=O, n→π*), 291 (LMCT), 283 nm (LMCT). HRESIMS+: calculated for C36H44N8EuO43+ 268.4233, found m/z 268.4232 [M–3Cl]3+. Single crystals of [Eu(BDCA)2(H2O)]Cl3 were grown from EtOH solution over a two-week period for XRD. Crystal lattice parameters: a = 11.2713(2), b = 15.3222(2), and c = 14.2917(2); α = 90°, β = 106.511(2)°, and γ = 90°; monoclinic, space group P2/c (13), temperature 100 K. Selected bond lengths (Å): Eu1–O1 2.4137(19), Eu1–O2 2.4019(19), Eu1–O3(H2O) 2.463(3), Eu1–N1 2.536(2), and Eu1–N3 2.541(2). Selected bond angles (°): O1–Eu1–N1 64.25(7), N1–Eu1–N3 62.37(7), O2–Eu1–N3 64.30(7), and O1–Eu1–O3(H2O) 70.26(5). CCDC number: 2215232.

3.3.4. [Tb(BDCA)2(H2O)]Cl3

BDCA (465 mg, 1.42 mmol) was placed in a round-bottom flask and dissolved in anhydrous CH3OH (20 mL). A solution of dry TbCl3 (180 mg, 0.68 mmol) in 2 mL of anhydrous CH3OH was slowly added dropwise to the resulting mixture. The solution was stirred at 40 °C for 24 h, and the solvent was removed by rotary evaporation at 60 °C. The obtained residue was then washed with Et2O (3 × 50 mL). Yield: 606 mg (94%); beige crystals. FTIR (KBr, selected bands, ν, cm−1): 3416 (s; ν(O–H)), 3222 (s; ν(N–H)), 1634 (s; ν(C=O--Tb)), 1558 (s; νamide II (N–H)), 1457 (m; ν(Py)). UV-vis (DMSO, λmax, nm): 302 (C=O, n→π*), 291 (LMCT), 283 nm (LMCT). HRESIMS+: calculated for C36H44N8TbO43+ 270.4241, found m/z 268.4232 [M–3Cl]3+. Single crystals of [Eu(BDCA)2(H2O)]Cl3 were grown from EtOH solution over a two-week period for XRD. Crystal lattice parameters: a = 11.2666(3), b = 15.2986(3), c = 14.2345(3); α = 90°, β = 106.335(3)°, and γ = 90°; monoclinic, space group P2/c (13), temperature 100 K. Selected bond lengths (Å): Tb1–O1 2.390(2), Tb1–O2 2.3802(19), Tb1–O3(H2O) 2.445(3), Tb1–N1 2.512(2), and Tb1–N3 2.517(2). Selected bond angles (°): O1–Tb1–N1 64.76(7), N1–Tb1–N3 62.65(8), O2–Tb1–N3 64.88(7), and O1–Tb1–O3(H2O) 70.18(5). CCDC number: 2215233.

3.4. Encapsulation of Lanthanide Complexes in a PEG Matrix

A solution of the corresponding lanthanide(III) chloride in EtOH (0.5 mL, concentration 2 mg·mL−1) was mixed with a solution of PEG (1 g) in EtOH (2.0 mL). The resulting mixture was intensely stirred at r.t. for 10 min and then poured into a glass Petri dish and dried at 70 °C for 1 h in order to remove EtOH from the polymer product. For PL studies, thin films were peeled off the Petri dish via a razor blade.

4. Conclusions

The red and green-emitting luminescent Eu3+ ([Eu(BDCA)2(H2O)]Cl3) and Tb3+ ([Tb(BDCA)2(H2O)]Cl3) bipyridine complexes were synthesized in three steps using the pre-prepared N6,N6-diisopropyl-[2,2′-bipyridine]-6,6′-dicarboxamide (BDCA) ligand and anhydrous LnCl3 (Ln = Eu, Tb) as reactants.
The structure of [Eu(BDCA)2(H2O)]Cl3 and [Tb(BDCA)2(H2O)]Cl3 was established by XRD, HRESIMS, FTIR, and UV-vis spectroscopy. The XRD data indicated that Ln(III) coordination with BDCA induce bonding between Ln−N and Ln−O. Amide I ν(C=O) band displacements in FTIR spectra are related to the involvement of the C=O group in the coordination that provides the formation of coordinatively saturated complexes.
HOMO–LUMO energy gaps (Eg) estimated from crystallographic data by QTAIM analysis, are 7.50 and 8.17 eV for [Eu(BDCA)2(H2O)]Cl3 and [Tb(BDCA)2(H2O)]Cl3, respectively. Optical band gap value of lanthanide complexes gained from absorption spectral data using Tauc’s plot was Eg = 4.0 eV.
Structural features of [Eu(BDCA)2(H2O)]Cl3 and [Tb(BDCA)2(H2O)]Cl3 provide strong PL of lanthanides in the red and green spectral range, respectively, with sharp lines of high intensity. The QY values of [Eu(BDCA)2(H2O)]Cl3 and [Tb(BDCA)2(H2O)]Cl3 complexes are 12.6% and 36.5% at λex = 340 nm excitation, respectively, and are higher compared to previously reported PMCs [11].
We demonstrated that the complexes can be utilized as emitting fillers in polymer composites, especially in the PEG matrix. The QY values of [Eu(BDCA)2(H2O)]Cl3 and [Tb(BDCA)2(H2O)]Cl3 encapsulated in PEG are 11.2 and 25.3%, respectively.
Hence, we report on novel bipyridinic lanthanide complexes, which could be further employed as photoluminescent solid-state compounds and as emitting fillers in polymer photoluminescent materials for optoelectronic devices.

Supplementary Materials

The following supporting information can be downloaded at: https://www.mdpi.com/article/10.3390/polym14245540/s1, Figure S1: 1H (a) and 13C NMR (b) spectrum of BDCA ligand; Figure S2: Molecular structures BDCA with thermal ellipsoids shown at the 50% probability level. The molecules of solvents are omitted for better representability; Table S1: Crystallographic information for structures of BDCA, [Eu(BDCA)2(H2O)]Cl3, and [Tb(BDCA)2(H2O)]Cl3.; Figure S3:HRESIMS spectra of BDCA ligand; Figure S4: HRESIMS spectrum of [Eu(BDCA)2(H2O)]Cl3 complex; Figure S5: HRESIMS spectrum of [Tb(BDCA)2(H2O)]Cl3 complex; Figure S6: Model structures [Eu(BDCA)2(H2O)]Cl3 (a) and [Tb(BDCA)2(H2O)]Cl3 (b). Length of coordination bonds Ln–O and Ln–NBipy (Ln = Eu, Tb) are indicated in Å; Table S2: Values of the density of all electrons — ρ(r), Laplacian of electron density — 2ρ(r) and appropriate λ2 eigenvalues, energy density — Hb, potential energy density — V(r), Lagrangian kinetic energy — G(r), and electron localization function — ELF (a.u.) at the bond critical points (3, −1), corresponding to coordination bonds Ln–O and Ln–NBipy (Ln = Eu, Tb) in model structures [Eu(BDCA)2(H2O)]Cl3 and [Tb(BDCA)2(H2O)]Cl3, as well as estimated energies for these contacts Eint (kcal·mol−1) and bond lengths — l (Å); Figure S7: Contour line diagram of the Laplacian of electron density distribution 2ρ(r), bond paths, and selected zero-flux surfaces (left panel), visualization of electron localization function (ELF, center panel) and reduced density gradient (RDG, right panel) analyses referring to coordination bonds Eu–O and Eu–N in model structure [Eu(BDCA)2(H2O)]Cl3. Bond critical points (3, −1) are shown in blue, nuclear critical points (3, −3) — in pale brown, ring critical points (3, +1) — in orange, bond paths are shown as pale brown lines, length units — Å, and the color scale for the ELF and RDG maps is presented in a.u.; Figure S8: Contour line diagram of the Laplacian of electron density distribution 2ρ(r), bond paths, and selected zero-flux surfaces (left panel), visualization of electron localization function (ELF, center panel) and reduced density gradient (RDG, right panel) analyses referring to coordination bonds Tb–O and Tb–N in model structure [Tb(BDCA)2(H2O)]Cl3. Bond critical points (3, −1) are shown in blue, nuclear critical points (3, −3) — in pale brown, ring critical points (3, +1) — in orange, bond paths are shown as pale brown lines, length units — Å, and the color scale for the ELF and RDG maps is presented in a.u.; Figure S9: TD-DFT simulated UV-Vis spectrum of model structure [Eu(BDCA)2(H2O)]Cl3; Table S3: Cartesian atomic coordinates for model structures [Eu(BDCA)2(H2O)]Cl3 and [Tb(BDCA)2(H2O)]Cl3; Figure S10: Excitation spectra of raw [Eu(BDCA)2(H2O)]Cl3 (a), [Tb(BDCA)2(H2O)]Cl3 (b), and the encapsulated complexes in PEG (c, d); Figure S11: Luminescence lifetime decay for [Eu(BDCA)2(H2O)]Cl3 (a), Tb(BDCA)2(H2O)]Cl3 (b), and the encapsulated complexes in PEG (c, d).

Author Contributions

A.S.M., writing—original draft preparation, investigation, visualization; K.V.D., writing—original draft preparation, validation, data curation, visualization; A.A.R., methodology, investigation, visualization; V.V.S., investigation, visualization; A.S.N., formal analysis, visualization; I.S.M., writing—review and editing; R.M.I., writing—review and editing, conceptualization, supervision, project administration, funding acquisition. All authors have read and agreed to the published version of the manuscript.

Funding

This study was funded by St. Petersburg State University, project number 94385659.

Institutional Review Board Statement

Not applicable.

Informed Consent Statement

Not applicable.

Data Availability Statement

Data is contained within the article or supplementary material. The data presented in this study are available in https://www.mdpi.com/article/10.3390/polym14245540/s1. All crystallographic data for this paper can be obtained free of charge via the Cambridge Crystallographic Database (CCDC numbers: 2215221, 2215232, and 2215233).

Acknowledgments

The physicochemical measurements were conducted at the Magnetic Resonance Research Centre, Centre for X-ray Diffraction Studies, Chemical Analysis and Materials Research Centre, Thermogravimetric and Calorimetric Research Center, and the Center for Optical and Laser Materials Research (which are part of St. Petersburg University). We thank Anton V. Rozhkov (St. Petersburg University) for technical assistance with XRD measurements. Alexander S. Novikov is grateful to the RUDN University Strategic Academic Leadership Program.

Conflicts of Interest

The authors declare no conflict of interest.

References

  1. Xu, H.; Chen, R.; Sun, Q.; Lai, W.; Su, Q.; Huang, W.; Liu, X. Recent Progress in Metal–Organic Complexes for Optoelectronic Applications. Chem. Soc. Rev. 2014, 43, 3259–3302. [Google Scholar] [CrossRef] [Green Version]
  2. Bedi, M.; Punia, M.; Taxak, V.B.; Khatkar, S.P.; Doon, P.B. Investigations into Spectroscopic and Optoelectronic Behaviour of Furoic Acid-based Eu(III) Complexes for Advanced Photonic Applications. Luminescence 2022, 37, 1098–1108. [Google Scholar] [CrossRef]
  3. Rocha, J.; Carlos, L.D.; Paz, F.A.A.; Ananias, D. Luminescent Multifunctional Lanthanides-Based Metal–Organic Frameworks. Chem. Soc. Rev. 2011, 40, 926–940. [Google Scholar] [CrossRef]
  4. Shinoda, S.; Tsukube, H. Luminescent Lanthanide Complexes as Analytical Tools in Anion Sensing, PH Indication and Protein Recognition. Analyst 2011, 136, 431–435. [Google Scholar] [CrossRef]
  5. Ren, S.; Jiang, W.; Wang, Q.; Li, Z.; Qiao, Y.; Che, G. Synthesis, Structures and Properties of Six Lanthanide Complexes Based on a 2-(2-Carboxyphenyl)Imidazo(4,5-f)-(1,10)Phenanthroline Ligand. RSC Adv. 2019, 9, 3102–3112. [Google Scholar] [CrossRef] [PubMed] [Green Version]
  6. Manzani, D.; Nigoghossian, K.; Iastrensk, M.F.; Coelho, G.R.; dos Santos, M.V.; Maia, L.J.Q.; Ribeiro, S.J.L.; Segatelli, M.G. Luminescent Silicone Materials Containing Eu3+ -Complexes for Photonic Applications. J. Mater. Chem. C 2018, 6, 8258–8265. [Google Scholar] [CrossRef]
  7. Ranjan, S.; Jayakumar, M.K.G.; Zhang, Y. Luminescent Lanthanide Nanomaterials: An Emerging Tool for Theranostic Applications. Nanomedicine 2015, 10, 1477–1491. [Google Scholar] [CrossRef]
  8. Bui, A.T.; Grichine, A.; Duperray, A.; Lidon, P.; Riobé, F.; Andraud, C.; Maury, O. Terbium(III) Luminescent Complexes as Millisecond-Scale Viscosity Probes for Lifetime Imaging. J. Am. Chem. Soc. 2017, 139, 7693–7696. [Google Scholar] [CrossRef]
  9. Bünzli, J.-C.G.; Eliseeva, S.V. Intriguing Aspects of Lanthanide Luminescence. Chem. Sci. 2013, 4, 1939. [Google Scholar] [CrossRef]
  10. Hasegawa, M.; Ohmagari, H.; Tanaka, H.; Machida, K. Luminescence of Lanthanide Complexes: From Fundamental to Prospective Approaches Related to Water- and Molecular-Stimuli. J. Photochem. Photobiol. C Photochem. Rev. 2022, 50, 100484. [Google Scholar] [CrossRef]
  11. Miroshnichenko, A.S.; Deriabin, K.V.; Baranov, A.I.; Neplokh, V.; Mitin, D.M.; Kolesnikov, I.E.; Dobrynin, M.V.; Parshina, E.K.; Mukhin, I.S.; Islamova, R.M. Lanthanide(III)-Incorporating Polysiloxanes as Materials for Light-Emitting Devices. ACS Appl. Polym. Mater. 2022, 4, 2683–2690. [Google Scholar] [CrossRef]
  12. Bünzli, J.-C.G. Benefiting from the Unique Properties of Lanthanide Ions. Acc. Chem. Res. 2006, 39, 53–61. [Google Scholar] [CrossRef] [PubMed]
  13. Nehra, K.; Dalal, A.; Hooda, A.; Kumar, P.; Singh, D.; Kumar, S.; Malik, R.S.; Kumar, P. Luminous Terbium and Samarium Complexes with Diacetylmethane and Substituted 1,10-Phenanthroline Derivatives for Display Applications: Preparation and Optoelectronic Investigations. J. Lumin. 2022, 249, 119032. [Google Scholar] [CrossRef]
  14. Dalal, A.; Nehra, K.; Hooda, A.; Saini, R.K.; Singh, D.; Kumar, S.; Malik, R.S. Preparation and Optoelectronic Enhancement of Trivalent Terbium Complexes with Fluorinated β-Diketone and Bidentate Ancillary Ligands. J. Mater. Sci. Mater. Electron. 2022, 33, 12984–12996. [Google Scholar] [CrossRef]
  15. Dalal, A.; Nehra, K.; Hooda, A.; Singh, S.; Singh, D.; Kumar, S. Synthesis, Optoelectronic and Photoluminescent Characterizations of Green Luminous Heteroleptic Ternary Terbium Complexes. J. Fluoresc. 2022, 32, 1019–1029. [Google Scholar] [CrossRef]
  16. Hooda, P.; Lather, V.; Malik, R.K.; Taxak, V.B.; Khatkar, S.P.; Khatri, S.; Ahlawat, P.; Kumar, R. Achieving Crimson Red Emission of Europium (III) Complexes with β-Keto Acids and Ancillary Ligands for Their Applications in Optoelectronic Devices and Biomedical Domain. Optik 2022, 264, 169389. [Google Scholar] [CrossRef]
  17. Okayasu, Y.; Yuasa, J. Structure Determination of Europium Complexes in Solution Using Crystal-Field Splitting of the Narrow ff Emission Lines. J. Phys. Chem. Lett. 2021, 12, 6867–6874. [Google Scholar] [CrossRef]
  18. Hooda, A.; Nehra, K.; Dalal, A.; Bhagwan, S.; Gupta, I.; Singh, D.; Kumar, S. Luminescent Features of Ternary Europium Complexes: Photophysical and Optoelectronic Evaluation. J. Fluoresc. 2022, 32, 1529–1541. [Google Scholar] [CrossRef]
  19. Chen, F.-F.; Bian, Z.-Q.; Liu, Z.-W.; Nie, D.-B.; Chen, Z.-Q.; Huang, C.-H. Highly Efficient Sensitized Red Emission from Europium (III) in Ir−Eu Bimetallic Complexes by 3MLCT Energy Transfer. Inorg. Chem. 2008, 47, 2507–2513. [Google Scholar] [CrossRef]
  20. Wang, X.; Bodunov, E.N.; Nau, W.M. Fluorescence Quenching Kinetics in Short Polymer Chains: Dependence on Chain Length. Opt. Spectrosc. 2003, 95, 560–570. [Google Scholar] [CrossRef]
  21. Deriabin, K.V.; Ignatova, N.A.; Kirichenko, S.O.; Novikov, A.S.; Kryukova, M.A.; Kukushkin, V.Y.; Islamova, R.M. Structural Features of Polymer Ligand Environments Dramatically Affect the Mechanical and Room-Temperature Self-Healing Properties of Cobalt(II)-Incorporating Polysiloxanes. Organometallics 2021, 40, 2750–2760. [Google Scholar] [CrossRef]
  22. Deriabin, K.V.; Ignatova, N.A.; Kirichenko, S.O.; Novikov, A.S.; Islamova, R.M. Nickel(II)-Pyridinedicarboxamide-Co-Polydimethylsiloxane Complexes as Elastic Self-Healing Silicone Materials with Reversible Coordination. Polymer 2021, 212, 123119. [Google Scholar] [CrossRef]
  23. Li, C.-H.; Wang, C.; Keplinger, C.; Zuo, J.-L.; Jin, L.; Sun, Y.; Zheng, P.; Cao, Y.; Lissel, F.; Linder, C.; et al. A Highly Stretchable Autonomous Self-Healing Elastomer. Nat. Chem. 2016, 8, 618–624. [Google Scholar] [CrossRef]
  24. Rao, N.S.; Rajesh, M.; Prasad, K.; Reddy, G.R.; Raju, B.D.P.; Dhanapandian, S. Study of Trivalent Samarium Ion Embedded Lithium-based Borate Glass for High-density Optical Memory Devices. Luminescence 2020, 35, 721–727. [Google Scholar] [CrossRef] [PubMed]
  25. Devi, S.; Khatkar, A.; Taxak, V.B.; Dalal, M.; Chahar, S.; Dalal, J.; Khatkar, S.P. Optical Properties of Trivalent Samarium-Doped Ba5Zn4Y8O21 Nanodiametric Rods Excitable by NUV Light. J. Alloys Compd. 2018, 767, 409–418. [Google Scholar] [CrossRef]
  26. Khanagwal, J.; Khatkar, S.P.; Dhankhar, P.; Bala, M.; Kumar, R.; Boora, P.; Taxak, V.B. Synthesis and Photoluminescence Analysis of Europium(III) Complexes with Pyrazole Acid and Nitrogen Containing Auxiliary Ligands. Spectrosc. Lett. 2020, 53, 625–647. [Google Scholar] [CrossRef]
  27. Makuła, P.; Pacia, M.; Macyk, W. How To Correctly Determine the Band Gap Energy of Modified Semiconductor Photocatalysts Based on UV–Vis Spectra. J. Phys. Chem. Lett. 2018, 9, 6814–6817. [Google Scholar] [CrossRef] [Green Version]
  28. Bredas, J.-L. Mind the Gap! Mater. Horiz. 2014, 1, 17–19. [Google Scholar] [CrossRef]
  29. Wahsner, J.; Seitz, M. Perdeuterated 2,2′-Bipyridine-6,6′-Dicarboxylate: An Extremely Efficient Sensitizer for Thulium Luminescence in Solution. Inorg. Chem. 2013, 52, 13301–13303. [Google Scholar] [CrossRef]
  30. de Bettencourt-Dias, A. (Ed.) Luminescence of Lanthanide Ions in Coordination Compounds and Nanomaterials; John Wiley & Sons Ltd.: Chichester, UK, 2014; ISBN 978-1-118-68276-0. [Google Scholar]
  31. Sheldrick, G.M. SHELXT—Integrated Space-Group and Crystal-Structure Determination. Acta Crystallogr. Sect. A Found. Adv. 2015, 71, 3–8. [Google Scholar] [CrossRef]
  32. Sheldrick, G.M. Crystal Structure Refinement with SHELXL. Acta Crystallogr. Sect. C Struct. Chem. 2015, 71, 3–8. [Google Scholar] [CrossRef] [PubMed] [Green Version]
  33. Dolomanov, O.V.; Bourhis, L.J.; Gildea, R.J.; Howard, J.A.K.; Puschmann, H. OLEX2: A Complete Structure Solution, Refinement and Analysis Program. J. Appl. Cryst. 2009, 42, 339–341. [Google Scholar] [CrossRef]
Scheme 1. Synthetic scheme of [Eu(BDCA)2(H2O)]Cl3 and [Tb(BDCA)2(H2O)]Cl3.
Polymers 14 05540 sch001
Figure 1. Molecular structures of the inner spheres of [Eu(BDCA)2(H2O)]Cl3 (a) and [Tb(BDCA)2(H2O)]Cl3 (b) with thermal ellipsoids shown at the 50% probability level. The Cl anions and water molecules of the outer spheres of the complexes are omitted for better representability.
Polymers 14 05540 g001
Figure 2. Spectra of [Eu(BDCA)2(H2O)]Cl3, [Tb(BDCA)2(H2O)]Cl3, and BDCA: FTIR in KBr (a) and UV-vis in DMSO (b).
Polymers 14 05540 g002
Figure 3. Tauc’s plots for band gap determination of [Eu(BDCA)2(H2O)]Cl3 (a) and [Tb(BDCA)2(H2O)]Cl3 (b).
Polymers 14 05540 g003
Figure 4. PL emission spectra of [Eu(BDCA)2(H2O)]Cl3 (a) and [Tb(BDCA)2(H2O)]Cl3 (b).
Polymers 14 05540 g004
Figure 5. PL emission spectra of [Eu(BDCA)2(H2O)]Cl3 (a) and [Tb(BDCA)2(H2O)]Cl3 (b) encapsulated in PEG at a concentration of 10−3 mg·mL−1 under UV-light (340 nm).
Polymers 14 05540 g005
Figure 6. TG (a) and differential TG curves (b) of [Eu(BDCA)2(H2O)]Cl3 and [Tb(BDCA)2(H2O)]Cl3.
Polymers 14 05540 g006
Table 1. QY values for [Eu(BDCA)2(H2O)]Cl3 and [Tb(BDCA)2(H2O)]Cl3 complexes compared to corresponding reported PMCs [11] at λex = 340 nm.
ComplexQY, %QY of Corresponding Reported PMCs [11], %QY of Encapsulated Complexes in PEG, %
[Eu(BDCA)2(H2O)]Cl312.610.511.2
[Tb(BDCA)2(H2O)]Cl336.518.325.3
Publisher’s Note: MDPI stays neutral with regard to jurisdictional claims in published maps and institutional affiliations.

