

Development and Mechanical Characterization of Short Curauá Fiber-Reinforced PLA Composites Made via Fused Deposition Modeling

 ,
,  and
and 
Abstract
1. Introduction
2. Materials and Methods
2.1. Materials
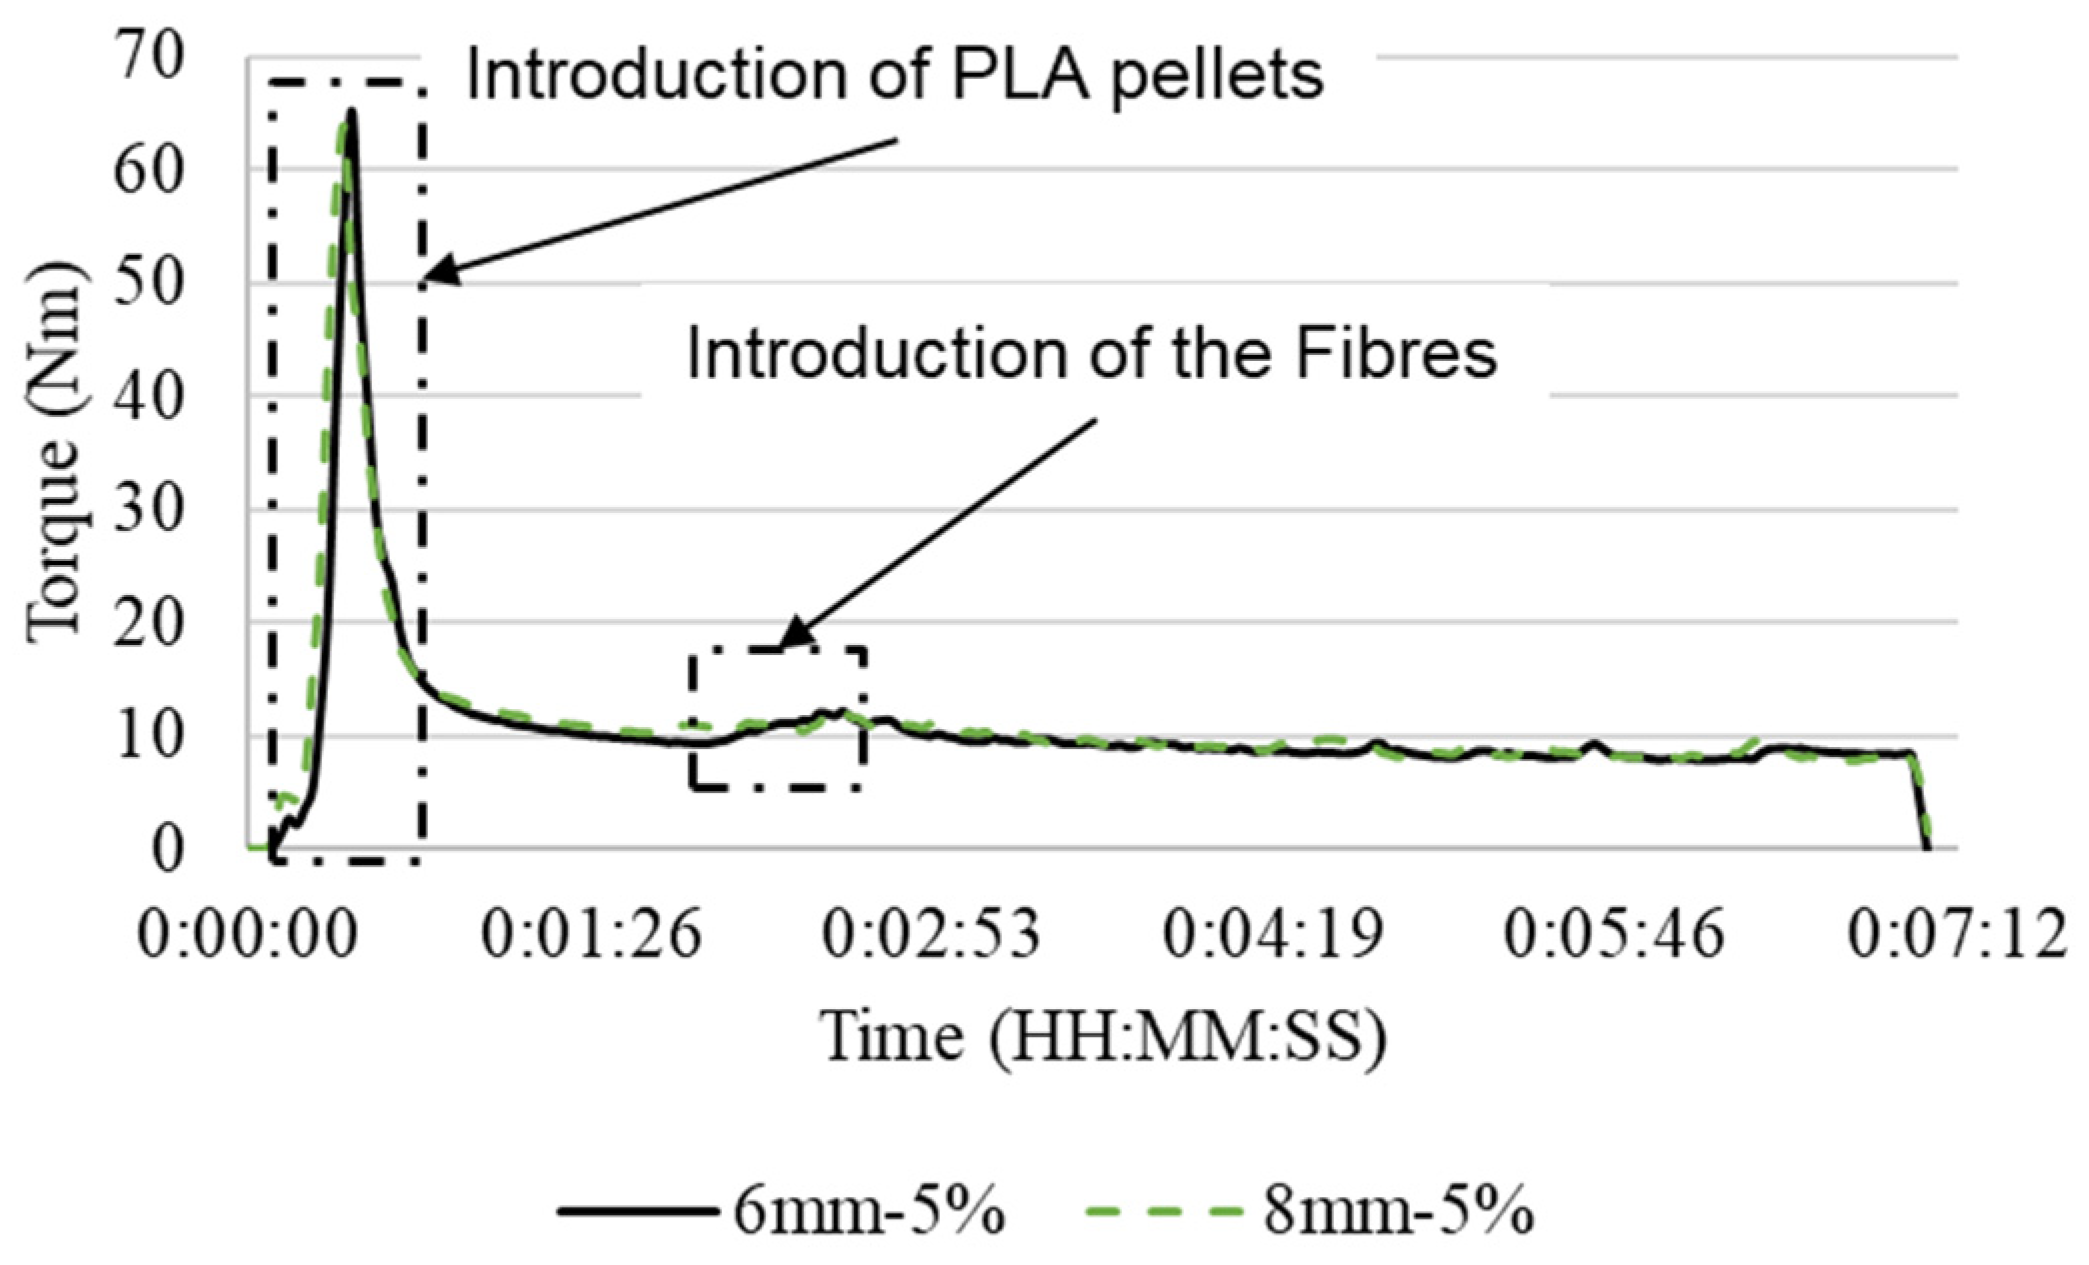
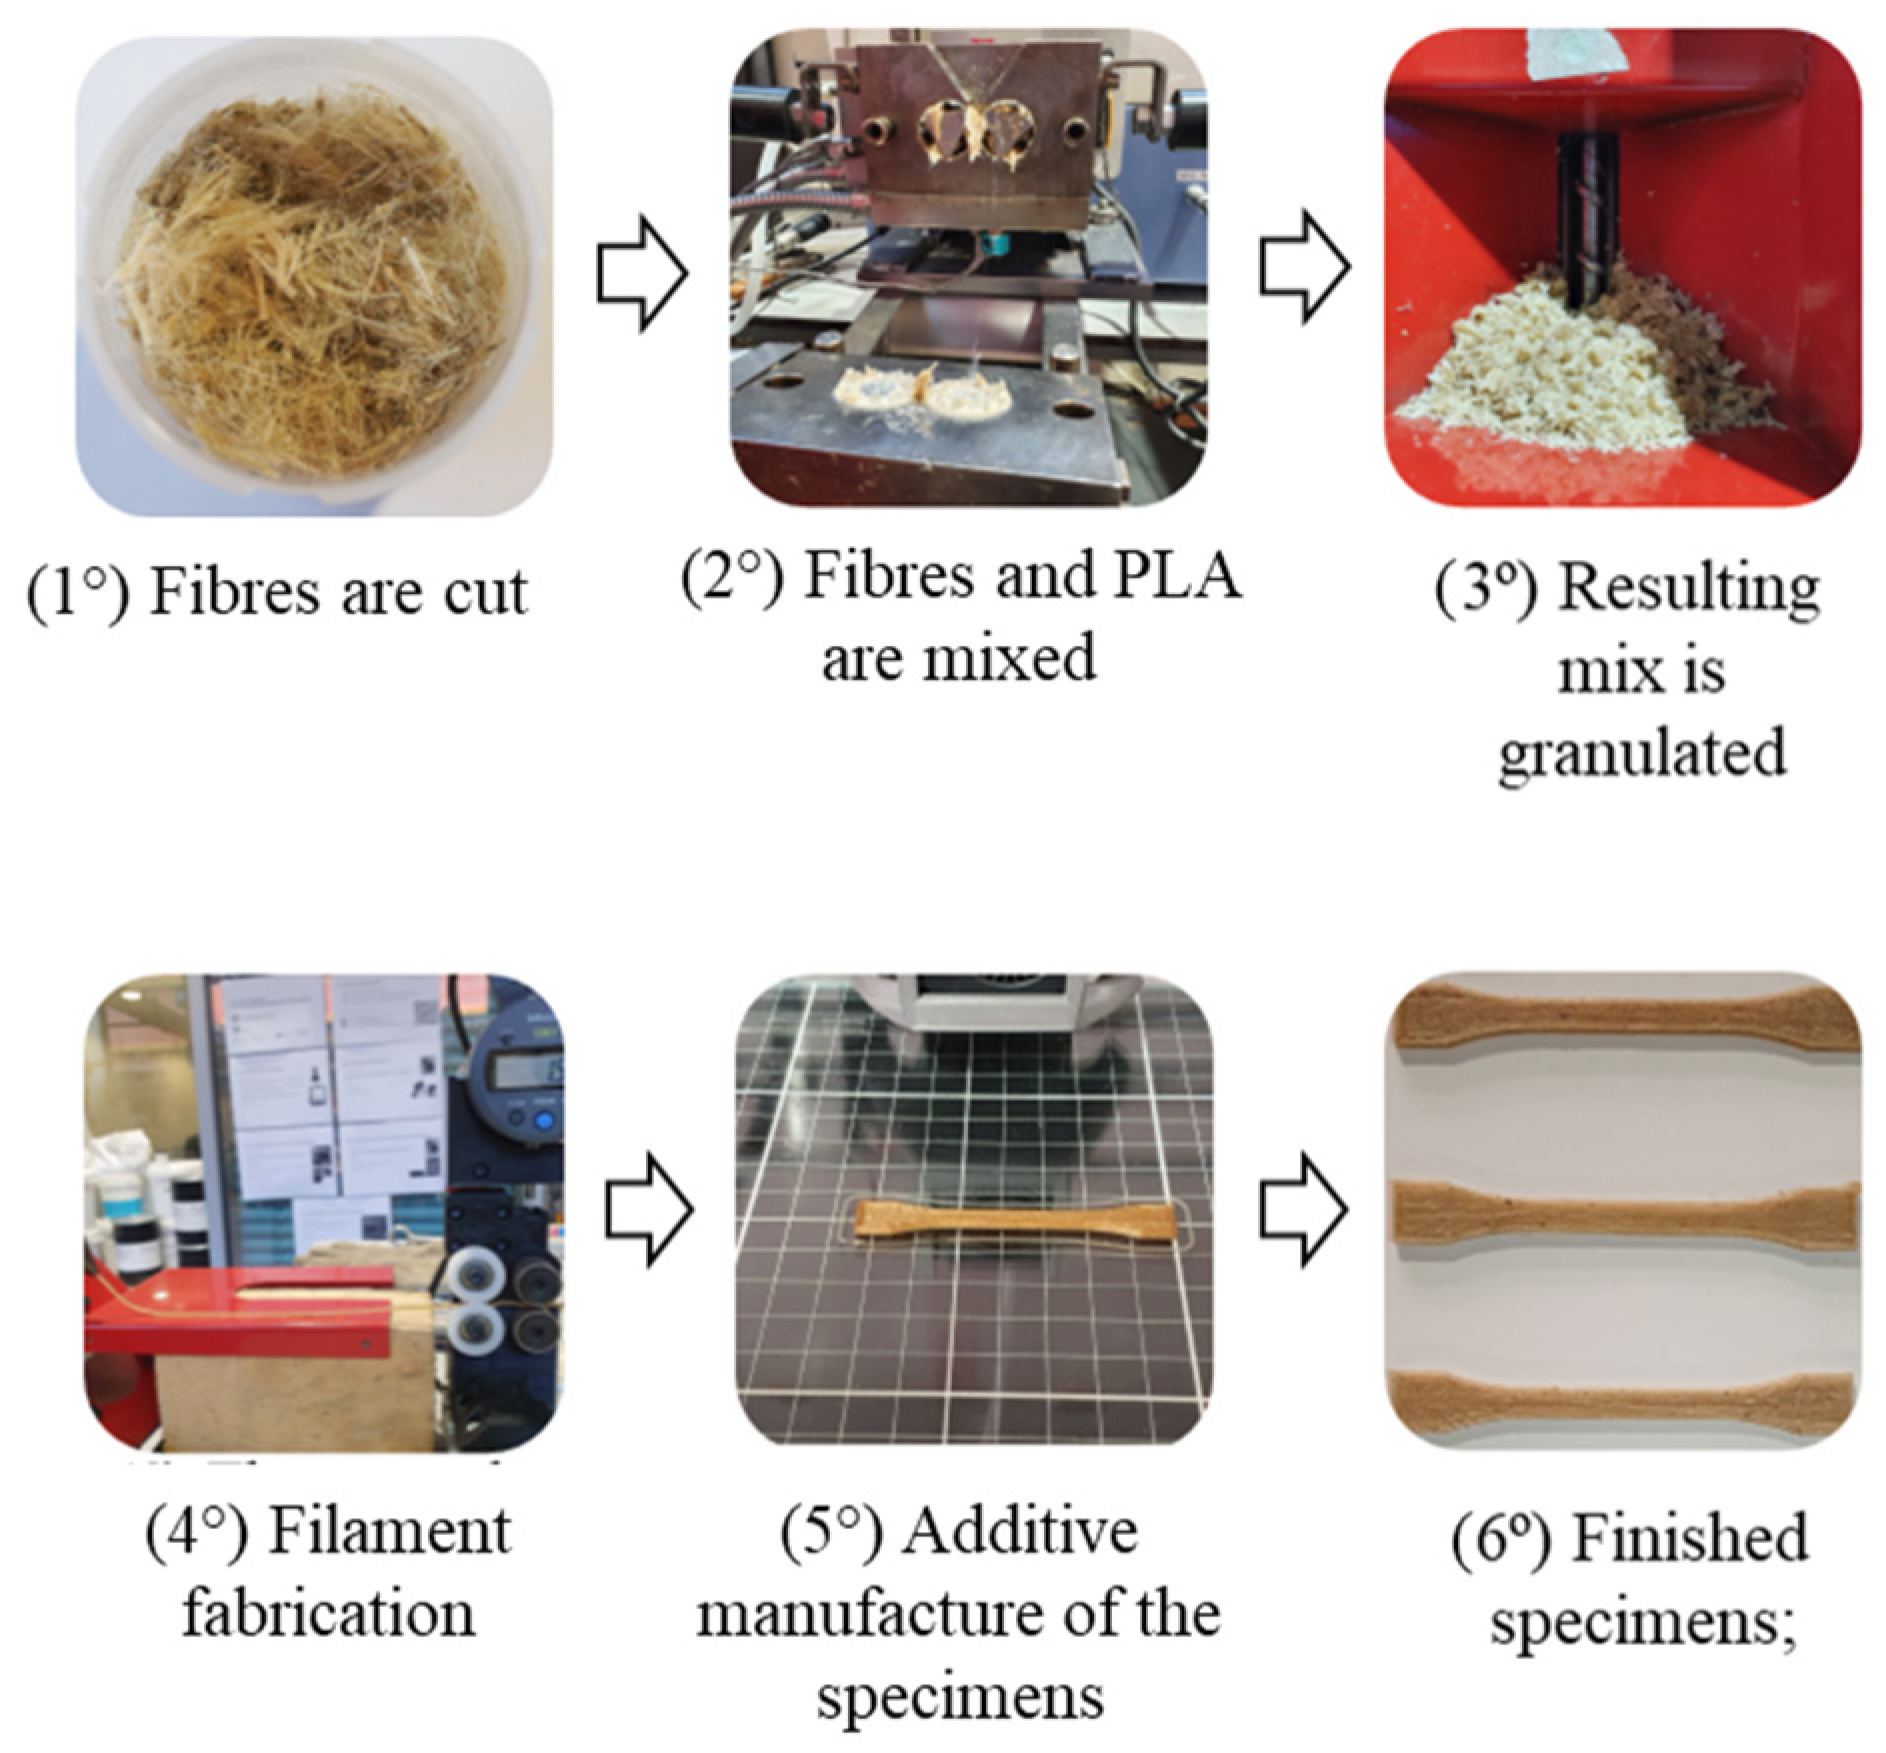
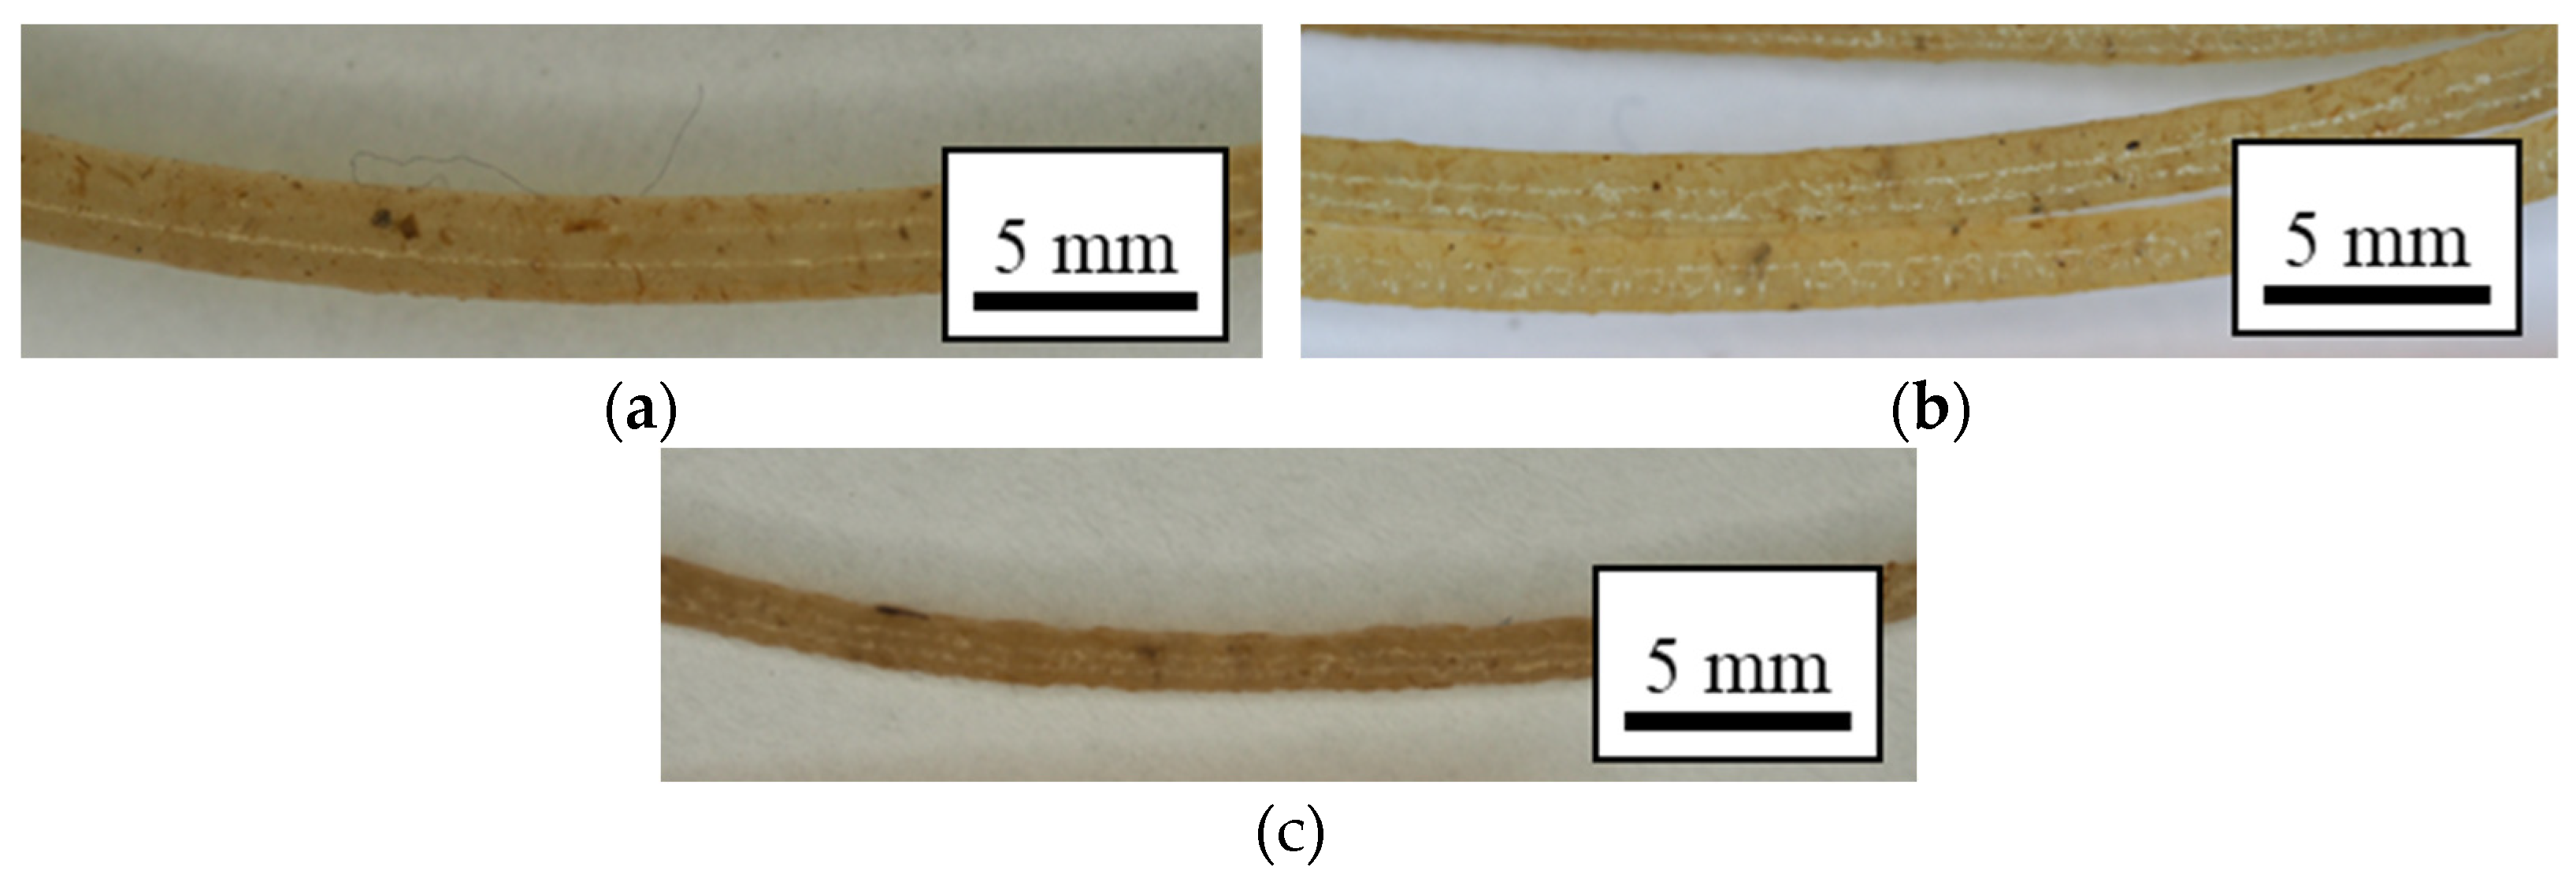
2.2. Filament and 3D Part Specimens’ Fabrication
2.3. Test Methods
Tensile and Flexural Tests
2.4. Thermal Analysis
2.4.1. Thermogravimetric Analysis (TGA)
2.4.2. Differential Exploratory Calorimetry (DSC)
3. Results and Discussion
3.1. Effect of Curauá Fibre Weight Fraction
3.2. Effect of Curauá Fiber Length
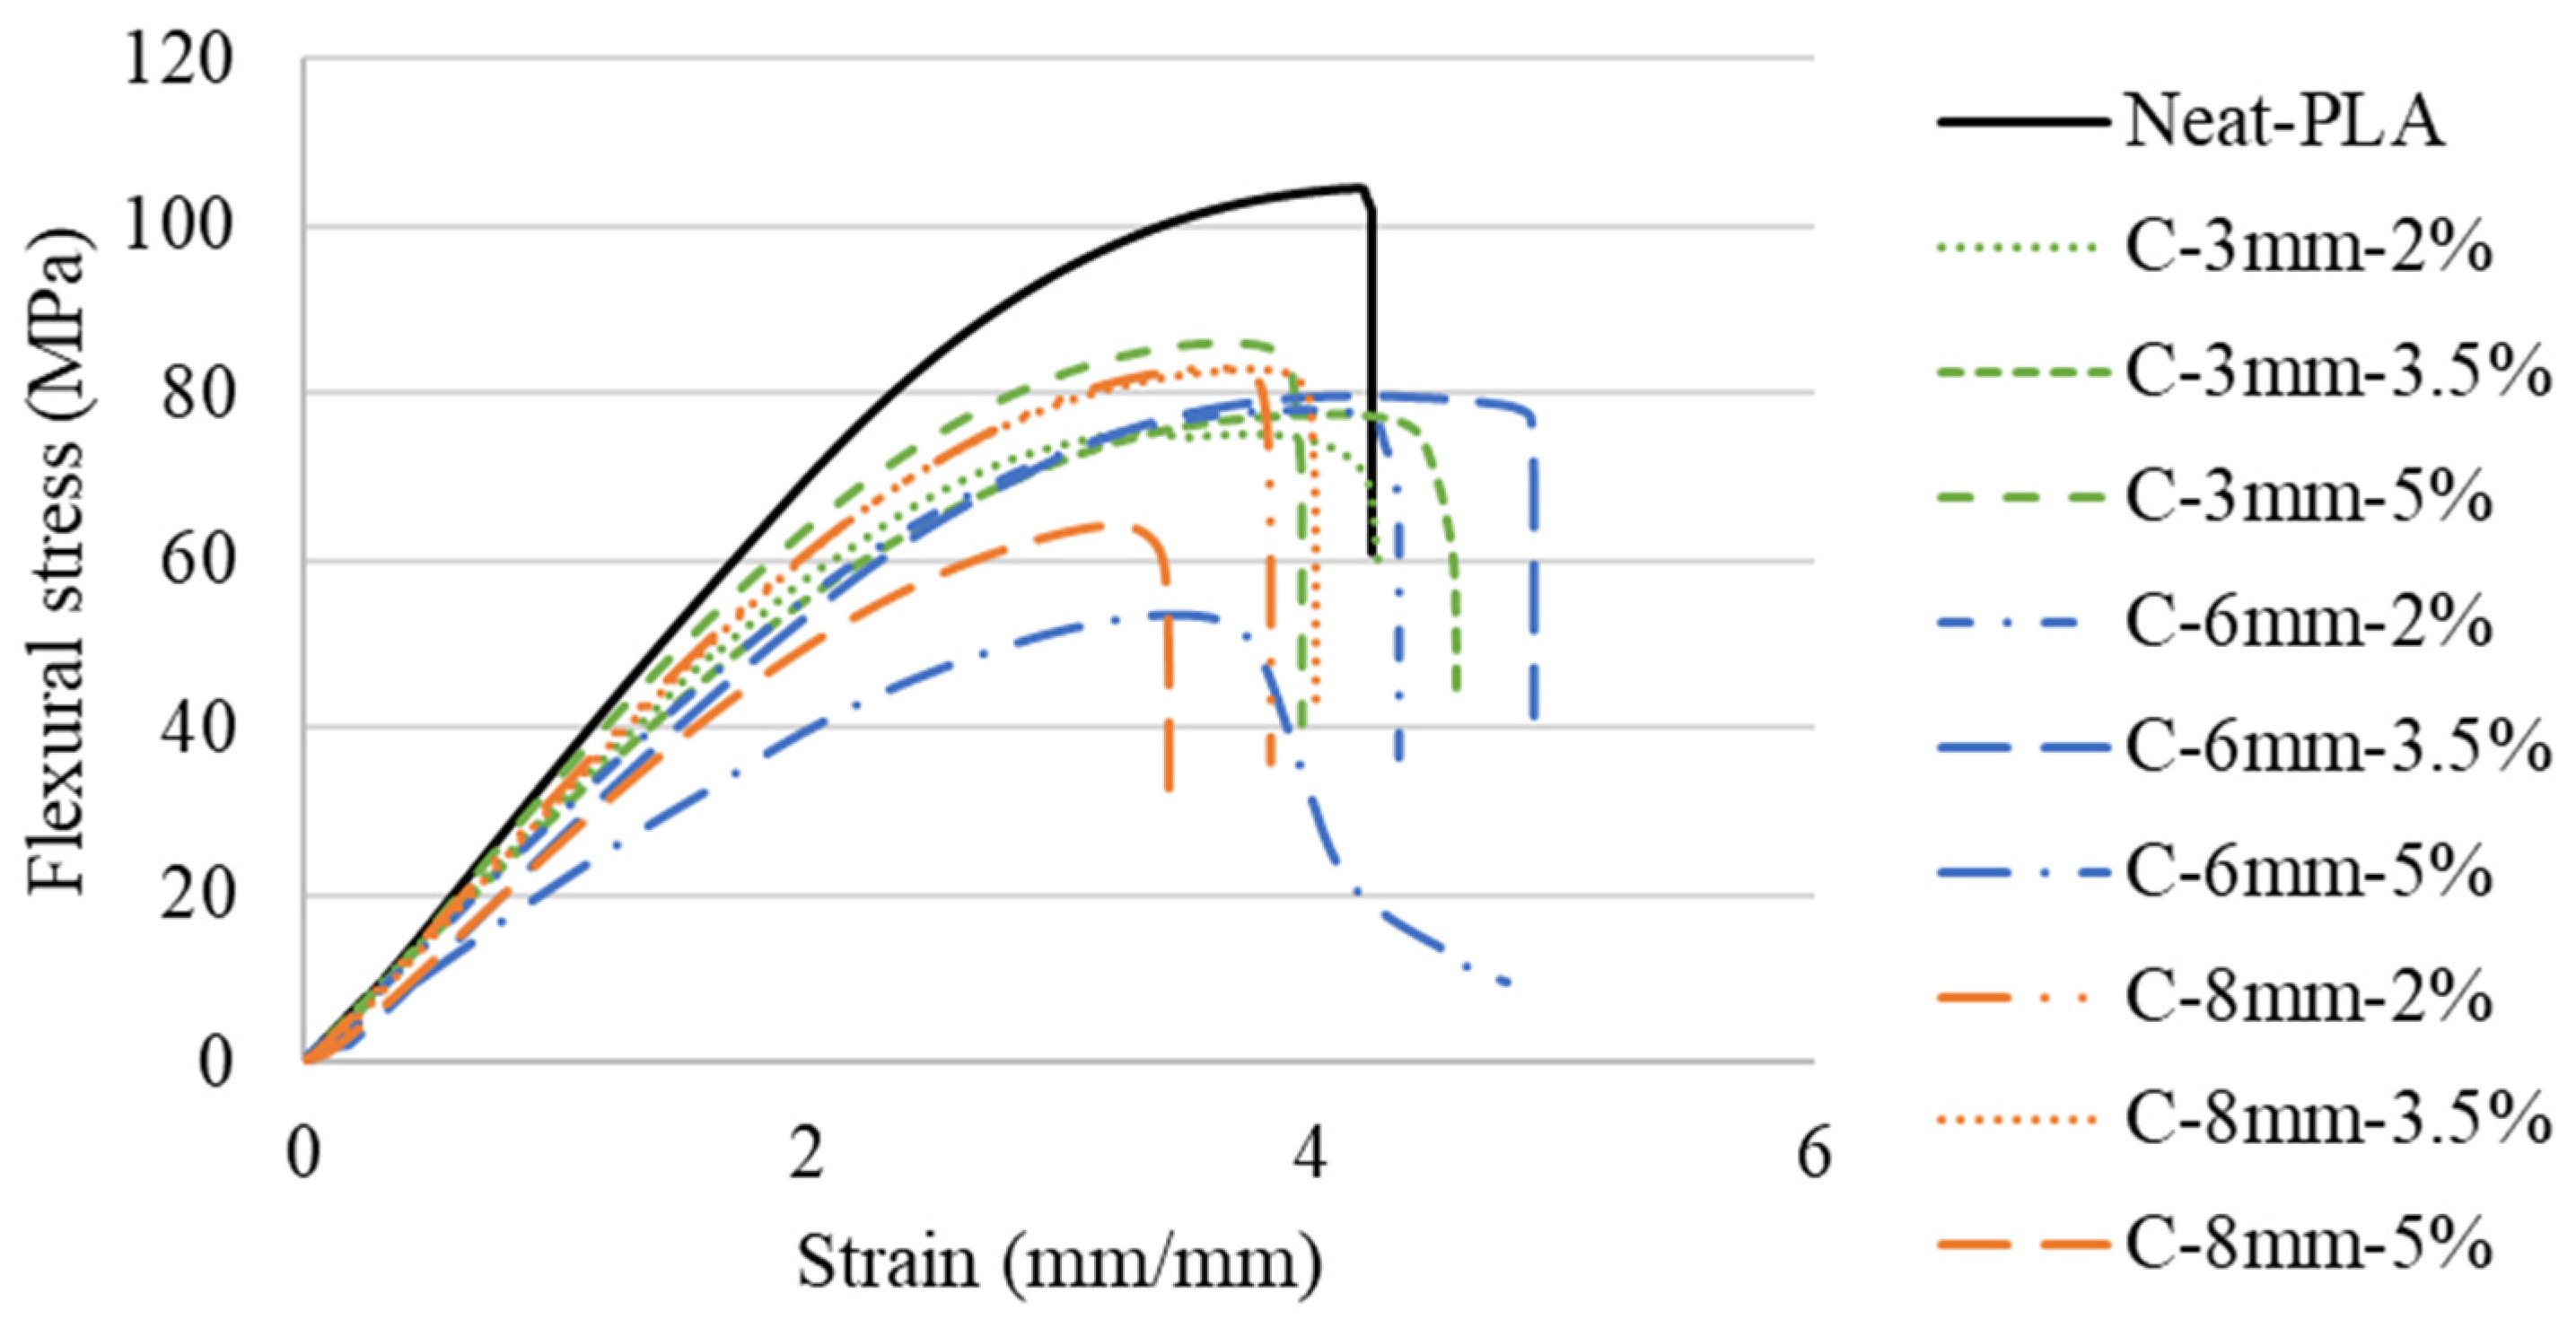
3.3. Flexural Tests
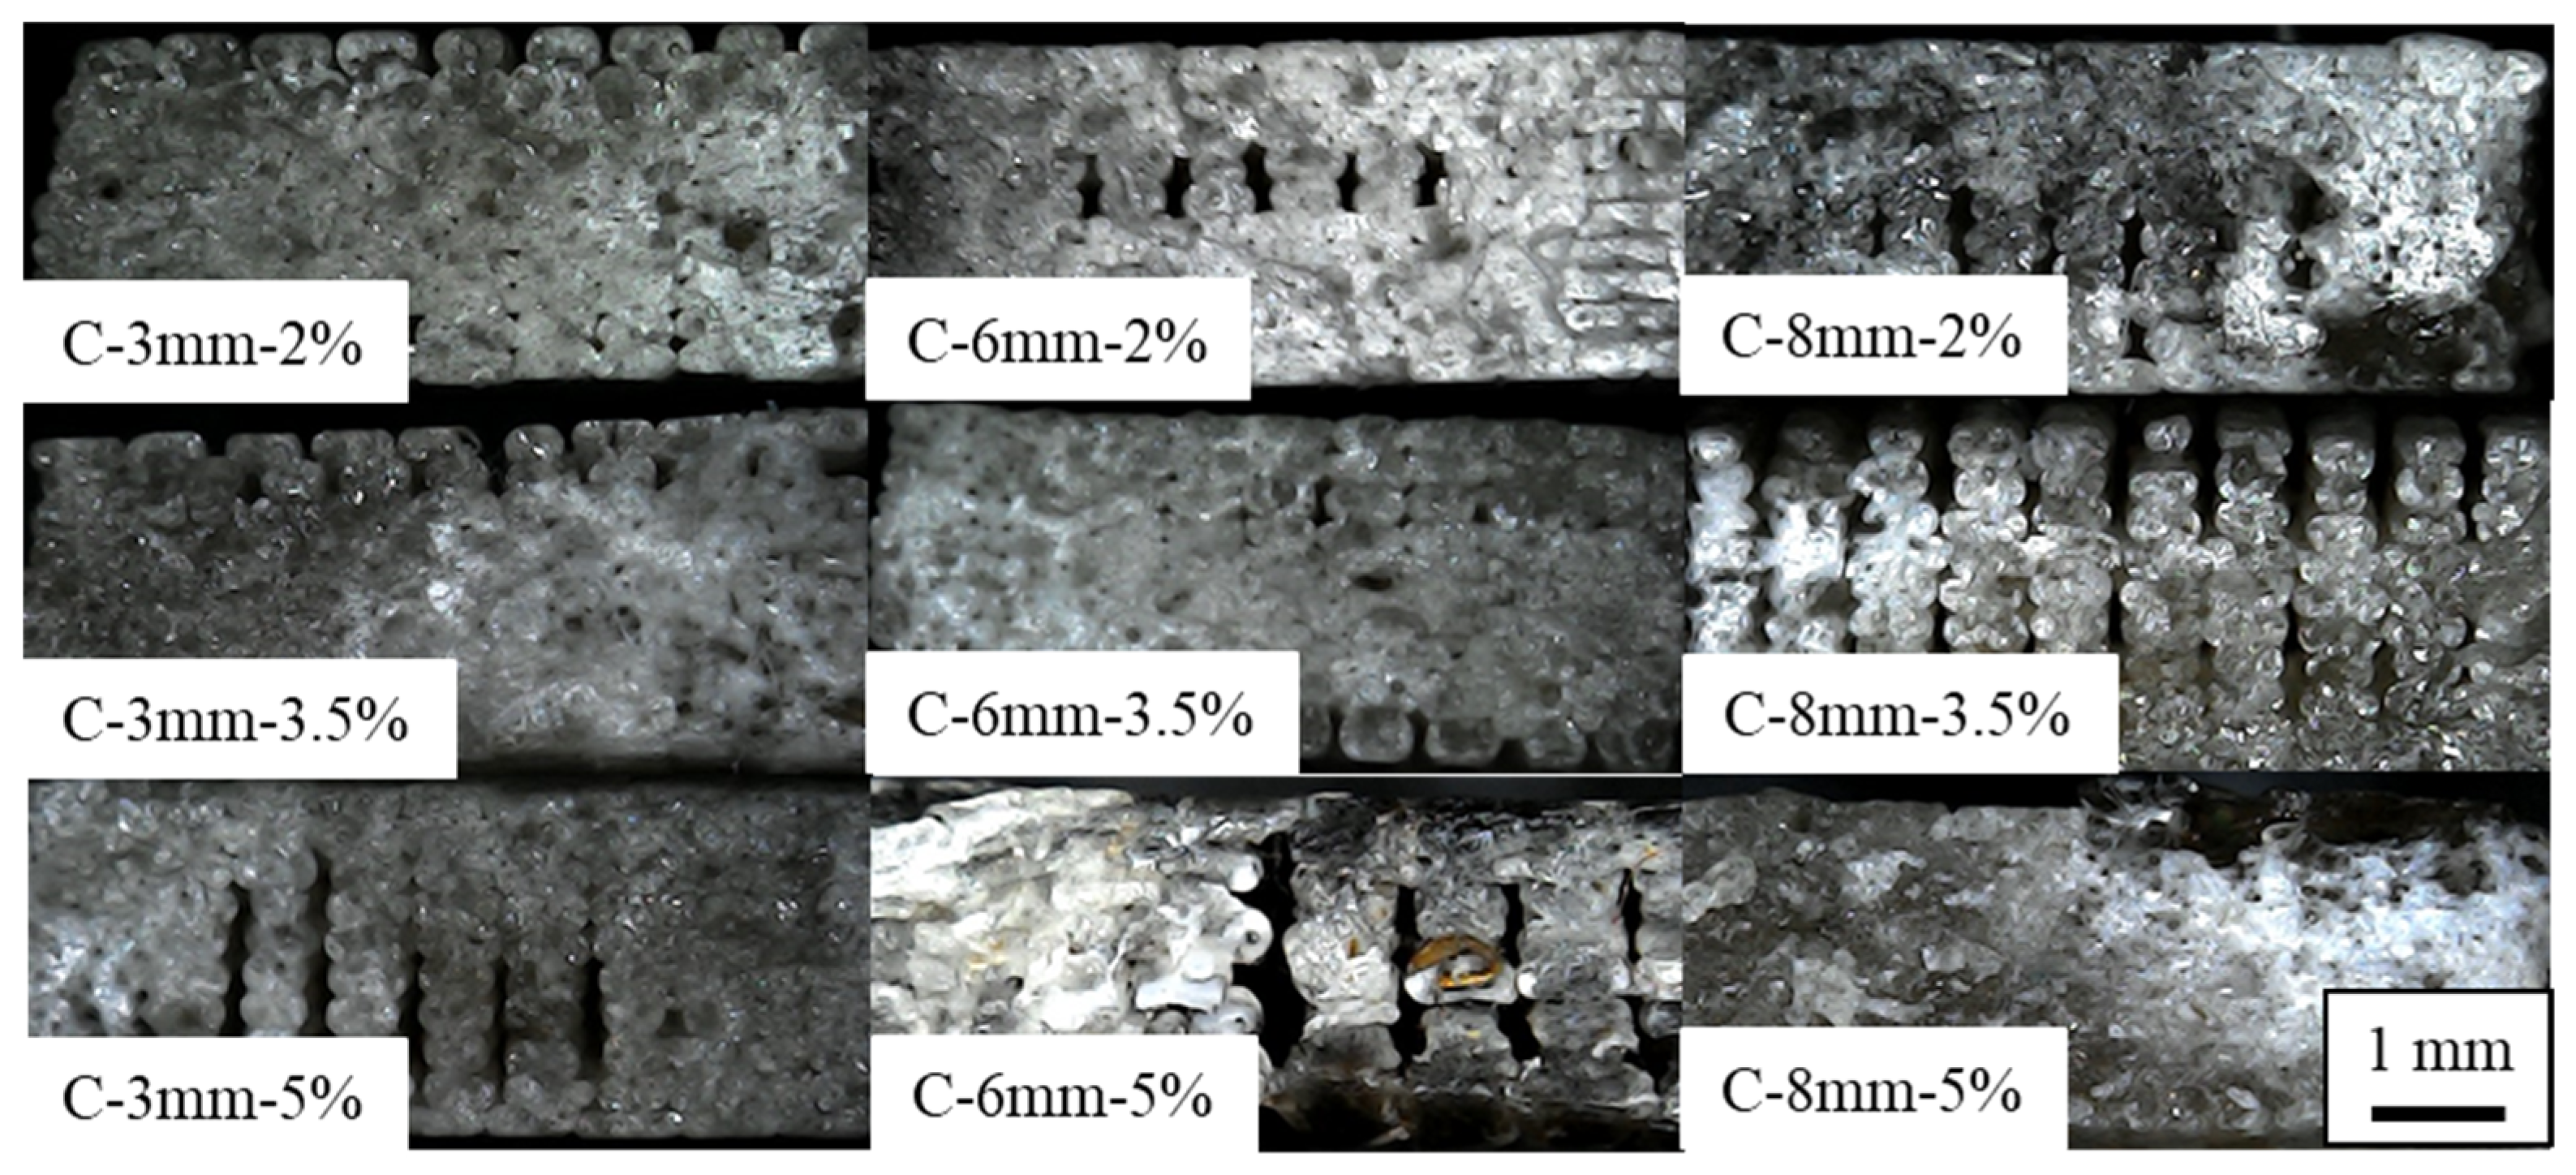
3.4. Fracture Analysis
4. Thermal Properties
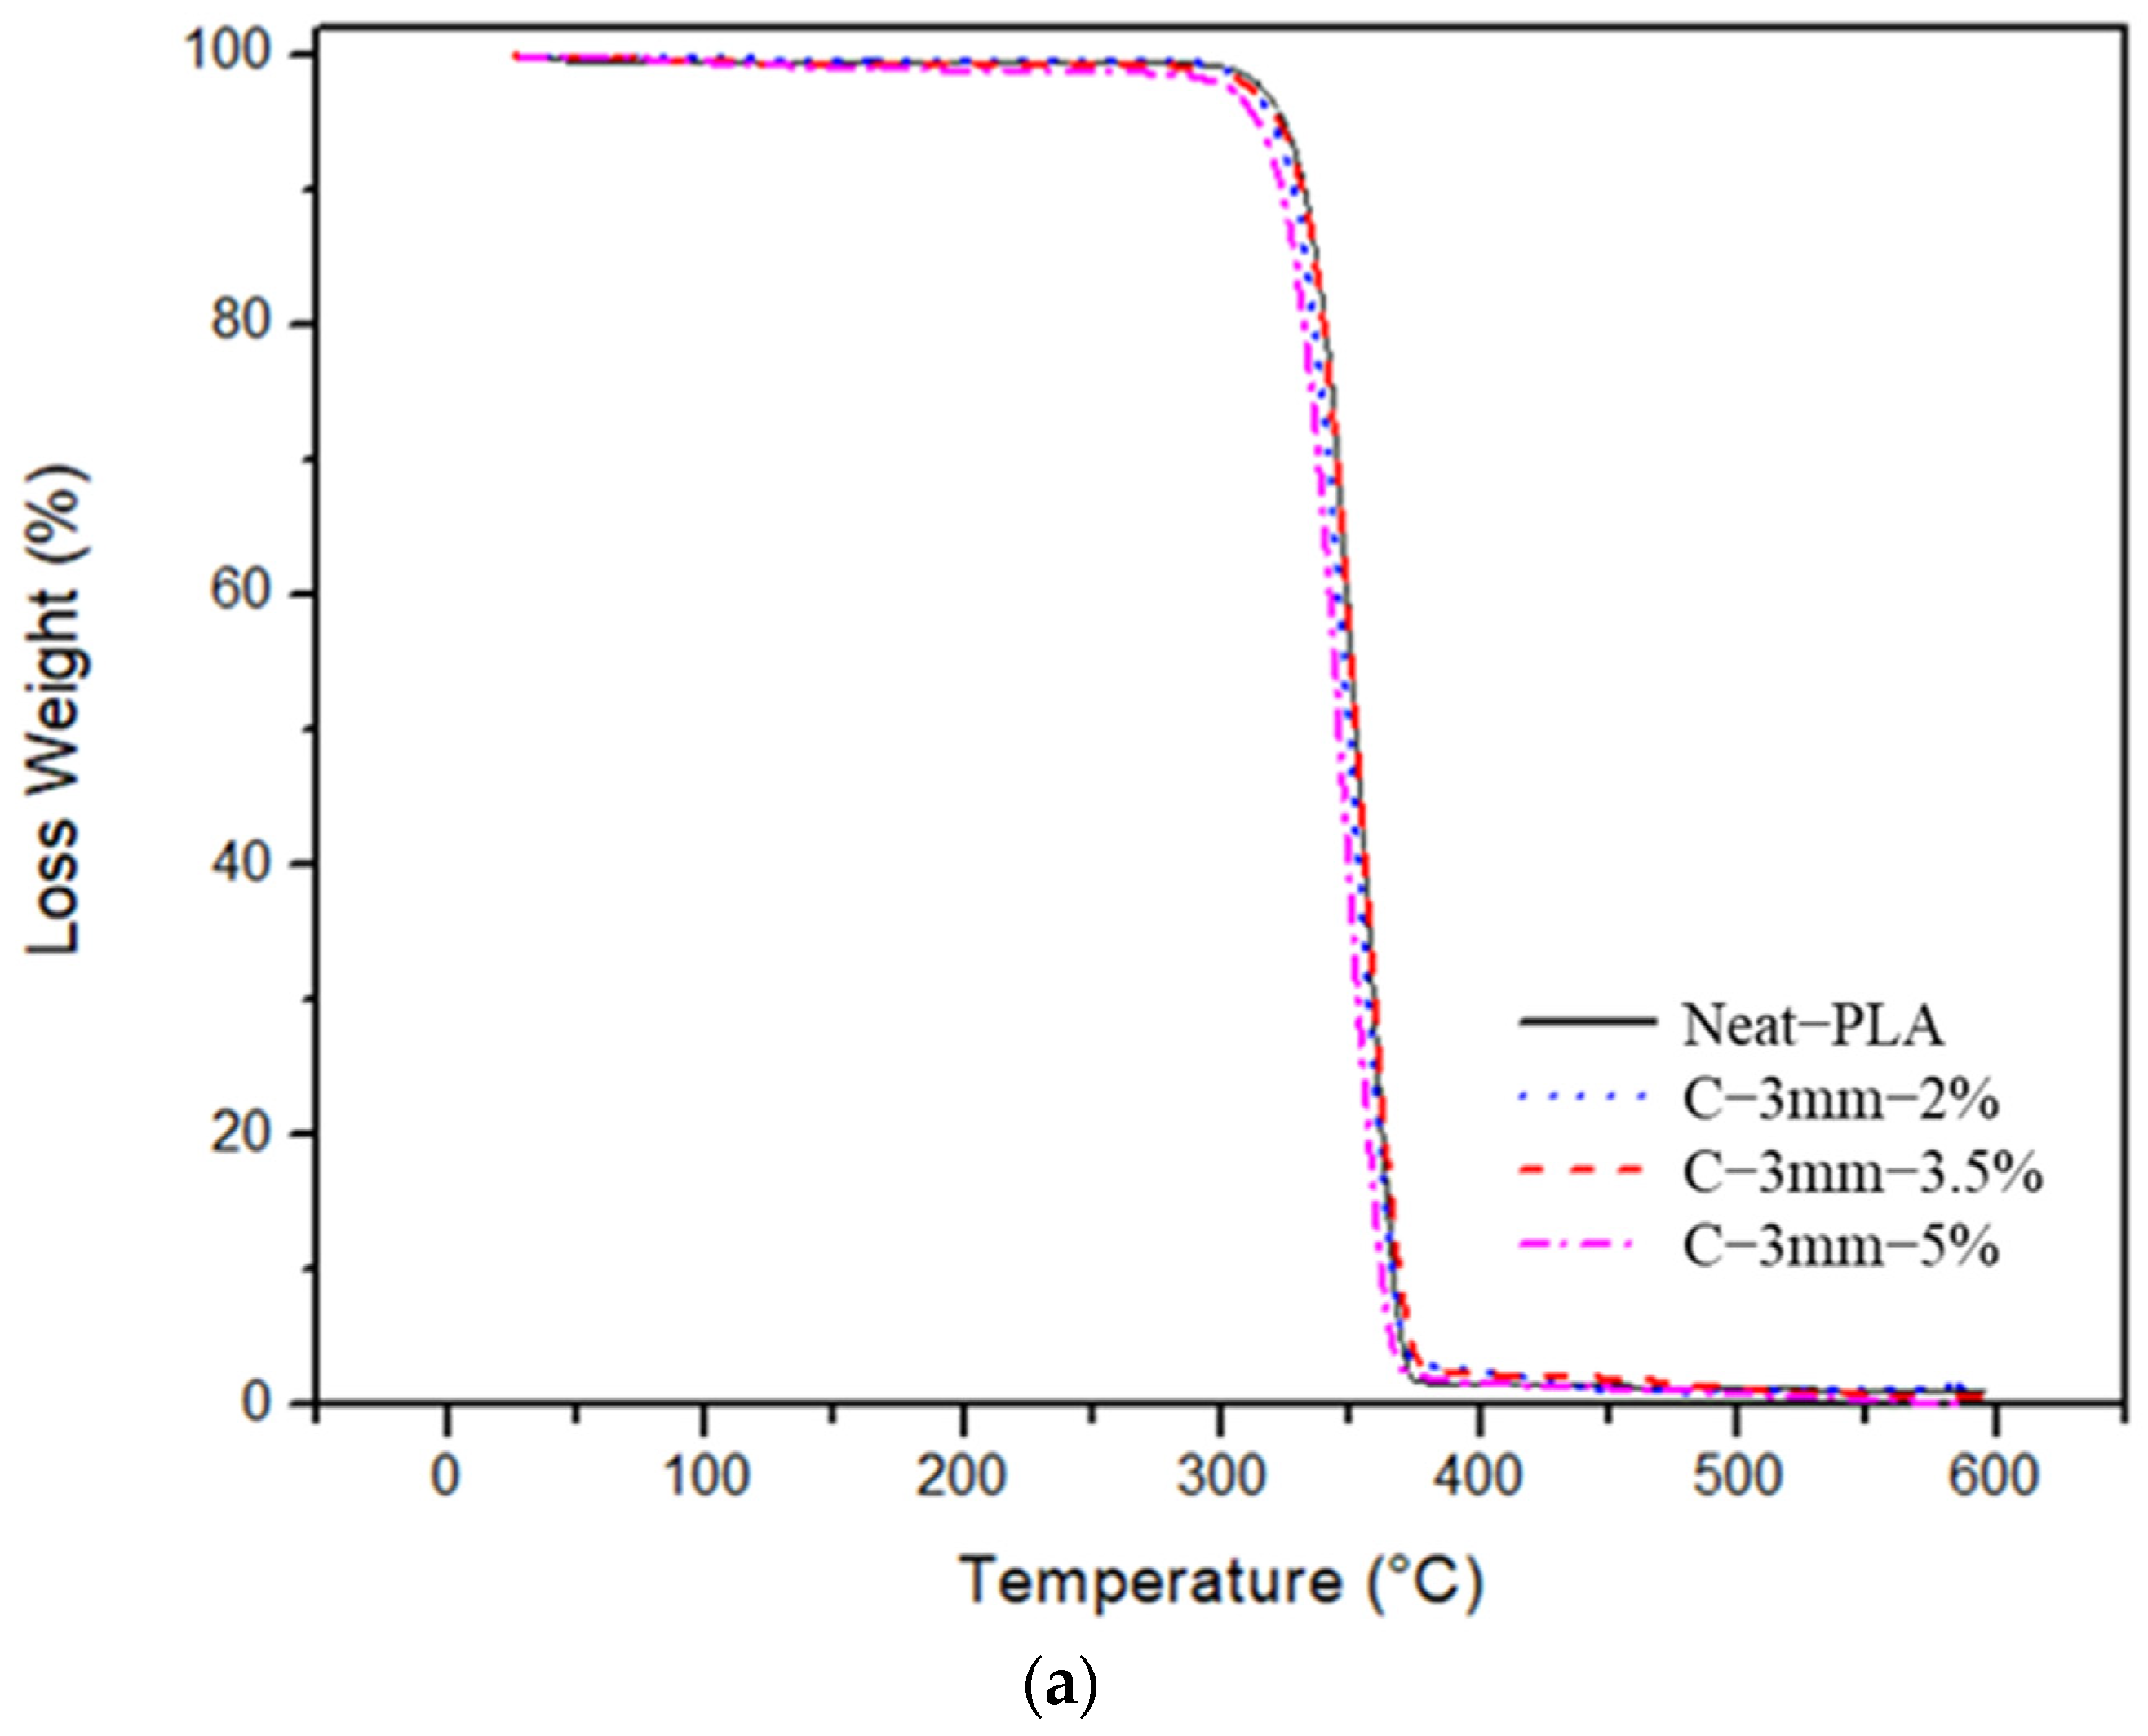
4.1. TGA Analysis
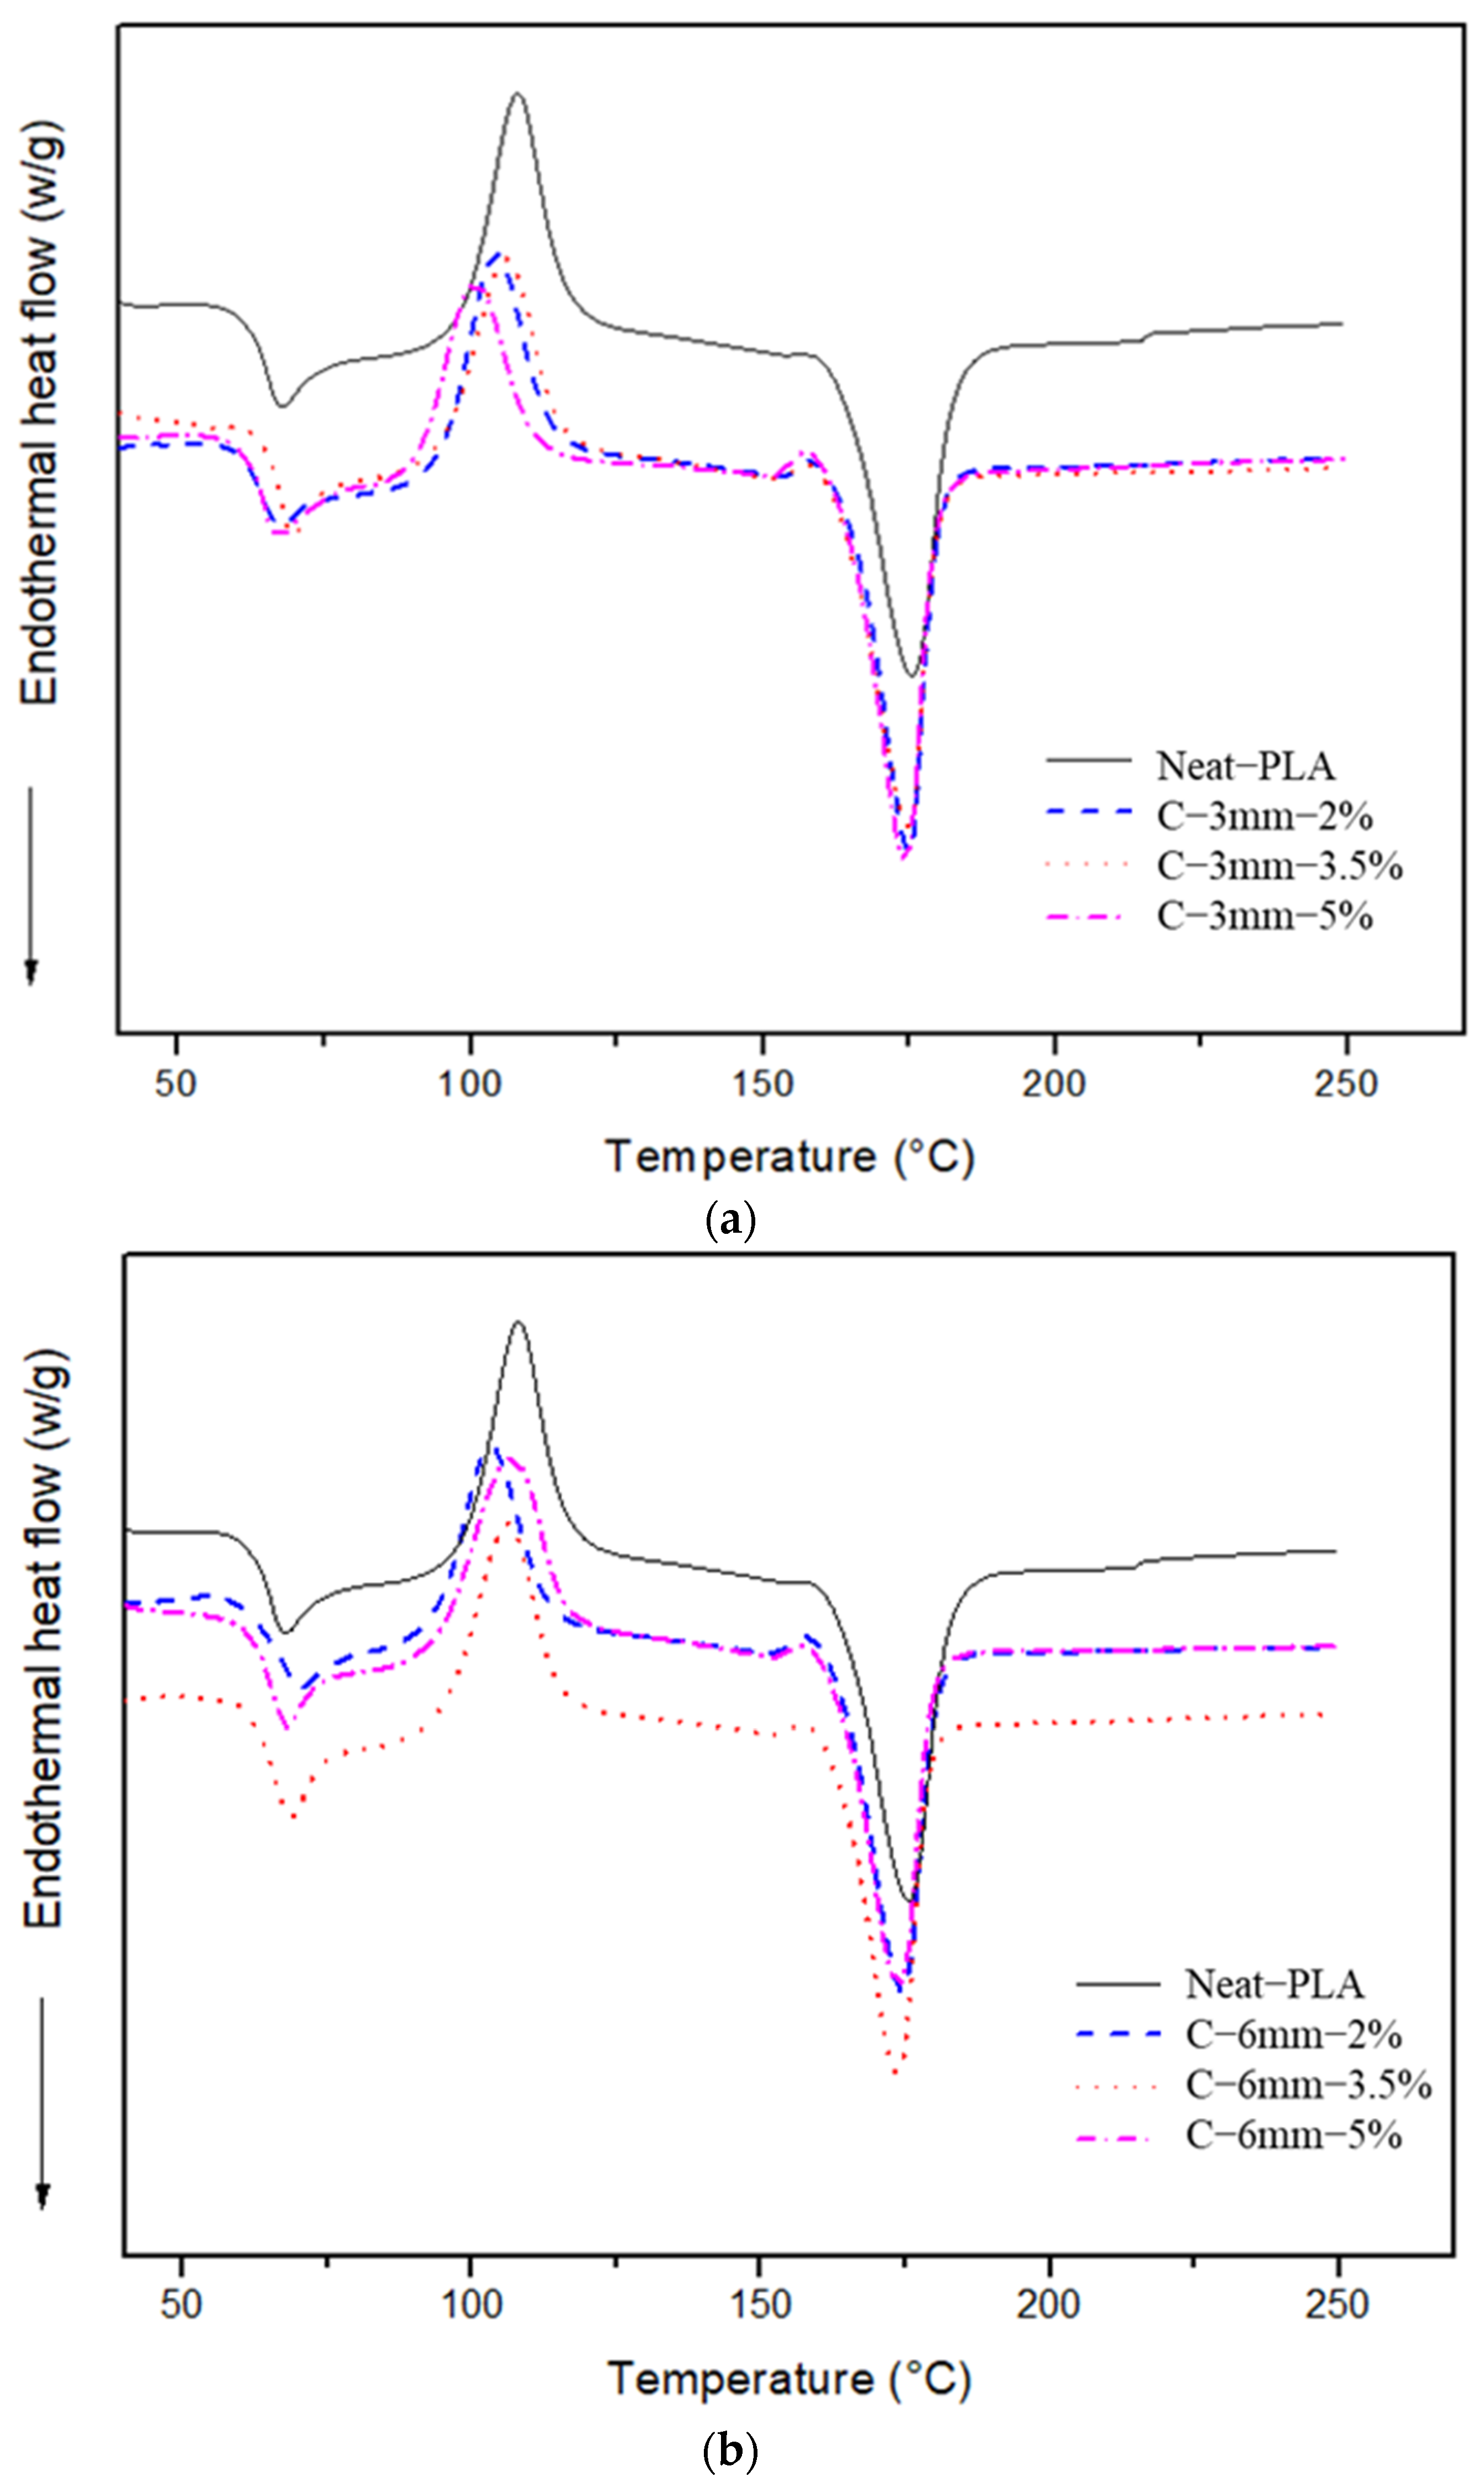
4.2. DSC Analysis
5. Conclusions
- The fiber weight fraction dominated the tensile properties of the 3D printed parts, with lower content (2 wt.%) presenting a significant improvement in tensile properties. Fiber length also affected the tensile properties; however, a downward trend was seen with the increase in length, with the C-3 mm-2% (56.45 MPa and 3 GPa) group presenting the best results.
- For flexural properties, the best condition was the C-3 mm-5% case, with values of 83.71 MPa and 3.42 Gpa for flexural strength and modulus, respectively. Unlike the tensile properties, the addition of the fibers did not provide an increase in flexural strength, with the best case presenting a reduction of 12% when compared to the Neat-PLA. However, the reinforcements did have a positive impact on the flexural modulus (the C-3 mm-5% specimens presented an increase of approximately 17% over the Neat-PLA).
- The incorporation of natural fiber presented, in some cases, changes in the composite’s thermal stability. The C-3 mm-3.5% specimens presented the best condition with values of 334 °C for Tonset and 67.5 °C for Tg.
Author Contributions
Funding
Institutional Review Board Statement
Data Availability Statement
Acknowledgments
Conflicts of Interest
References
- Ngo, T.D.; Kashani, A.; Imbalzano, G.; Nguyen, K.T.Q.; Hui, D. Additive manufacturing (3D printing): A review of materials, methods, applications and challenges. Compos. Part B Eng. 2018, 143, 172–196. [Google Scholar] [CrossRef]
- Singh, S.; Ramakrishna, S.; Singh, R. Material issues in additive manufacturing: A review. J. Manuf. Process. 2017, 25, 185–200. [Google Scholar] [CrossRef]
- Tofail, S.A.M.; Koumoulos, E.P.; Bandyopadhyay, A.; Bose, S.; O’Donoghue, L.; Charitidis, C. Additive manufacturing: Scientific and technological challenges, market uptake and opportunities. Mater. Today 2018, 21, 22–37. [Google Scholar] [CrossRef]
- Cavalcanti, D.; Banea, M.; Queiroz, H. Mechanical Characterization of Bonded Joints Made of Additive Manufactured Adherends. Ann. Dunarea De Jos Univ. Galati. Fascicle XII Weld. Equip. Technol. 2019, 30, 27–33. [Google Scholar] [CrossRef]
- Harris, M.; Potgieter, J.; Archer, R.; Arif, K.M. Effect of Material and Process Specific Factors on the Strength of Printed Parts in Fused Filament Fabrication: A Review of Recent Developments. Materials 2019, 12, 1664. [Google Scholar] [CrossRef]
- Jiang, C.; Wang, K.; Jiang, X.; Zhang, C.; Wang, B. Quantitative Investigation of the Process Parameters of Electrohydrodynamic Direct-Writing and Their Effects on Fiber Surface Roughness and Cell Adhesion. Polymers 2020, 12, 2475. [Google Scholar] [CrossRef]
- Borg, G.; Kiss, S.; Rochman, A. Filament Development for Laser Assisted FFF 3D Printing. J. Manuf. Mater. Process. 2021, 5, 115. [Google Scholar] [CrossRef]
- Ahmadifar, M.; Benfriha, K.; Shirinbayan, M.; Tcharkhtchi, A. Additive Manufacturing of Polymer-Based Composites Using Fused Filament Fabrication (FFF): A Review. Appl. Compos. Mater. 2021, 28, 1335–1380. [Google Scholar] [CrossRef]
- Oktavianty, O.; Haruyama, S.; Ishii, Y. Enhancing Droplet Quality of Edible Ink in Single and Multi-Drop Methods by Optimization the Waveform Design of DoD Inkjet Printer. Processes 2022, 10, 91. [Google Scholar] [CrossRef]
- Gutiérrez, E.; Barreto, J.d.J.; Garcia-Hernandez, S.; Morales, R.; González-Solorzano, M.G. Decrease of Nozzle Clogging through Fluid Flow Control. Metals 2020, 10, 1420. [Google Scholar] [CrossRef]
- Lalehpour, A.; Janeteas, C.; Barari, A. Surface roughness of FDM parts after post-processing with acetone vapor bath smoothing process. Int. J. Adv. Manuf. Technol. 2018, 95, 1505–1520. [Google Scholar] [CrossRef]
- Wu, H.; Fahy, W.P.; Kim, S.; Kim, H.; Zhao, N.; Pilato, L.; Kafi, A.; Bateman, S.; Koo, J.H. Recent developments in polymers/polymer nanocomposites for additive manufacturing. Prog. Mater. Sci. 2020, 111, 100638. [Google Scholar] [CrossRef]
- Cavalcanti, D.K.K.; de Queiroz, H.F.M.; Neto, J.S.S.; Banea, M.D. Strengthening of additive manufactured parts by using different type of fibre reinforcements. Int. J. Adv. Manuf. Tech. 2022, 123, 1889–1903. [Google Scholar] [CrossRef]
- Ning, F.; Cong, W.; Hu, Y.; Wang, H. Additive manufacturing of carbon fiber-reinforced plastic composites using fused deposition modeling: Effects of process parameters on tensile properties. J. Compos. Mater. 2017, 51, 451–462. [Google Scholar] [CrossRef]
- McIlroy, C.; Olmsted, P.D. Disentanglement effects on welding behaviour of polymer melts during the fused-filament-fabrication method for additive manufacturing. Polymer 2017, 123, 376–391. [Google Scholar] [CrossRef]
- Weng, Z.; Wang, J.; Senthil, T.; Wu, L. Mechanical and thermal properties of ABS/montmorillonite nanocomposites for fused deposition modeling 3D printing. Mater. Des. 2016, 102, 276–283. [Google Scholar] [CrossRef]
- Afrose, M.F.; Masood, S.H.; Nikzad, M.; Iovenitti, P. Effects of Build Orientations on Tensile Properties of PLA Material Processed by FDM. Adv. Mater. Res. 2014, 1044–1045, 31–34. [Google Scholar] [CrossRef]
- Carrasco, F.; Pagès, P.; Gámez-Pérez, J.; Santana, O.O.; Maspoch, M.L. Processing of poly(lactic acid): Characterization of chemical structure, thermal stability and mechanical properties. Polym. Degrad. Stab. 2010, 95, 116–125. [Google Scholar] [CrossRef]
- Cavalcanti, D.K.K.; Banea, M.D.; de Queiroz, H.F.M. Effect of material on the mechanical properties of additive manufactured thermoplastic parts. Ann. Dunarea De Jos Univ. Galati Fascicle XII Weld. Equip. Technol. 2020, 31, 5–12. [Google Scholar] [CrossRef]
- Gomes, T.E.P.; Cadete, M.S.; Dias-de-Oliveira, J.; Neto, V. Controlling the properties of parts 3D printed from recycled thermoplastics: A review of current practices. Polym. Degrad. Stab. 2022, 196, 109850. [Google Scholar] [CrossRef]
- Justo, J.; Távara, L.; García-Guzmán, L.; París, F. Characterization of 3D printed long fibre reinforced composites. Compos. Struct. 2018, 185, 537–548. [Google Scholar] [CrossRef]
- Le Duigou, A.; Correa, D.; Ueda, M.; Matsuzaki, R.; Castro, M. A review of 3D and 4D printing of natural fibre biocomposites. Mater. Des. 2020, 194, 108911. [Google Scholar] [CrossRef]
- Yan, J.; Demirci, E.; Ganesan, A.; Gleadall, A. Extrusion width critically affects fibre orientation in short fibre reinforced material extrusion additive manufacturing. Addit. Manuf. 2022, 49, 102496. [Google Scholar] [CrossRef]
- Yu, T.; Jiang, N.; Li, Y. Study on short ramie fiber/poly(lactic acid) composites compatibilized by maleic anhydride. Compos. Part A Appl. Sci. Manuf. 2014, 64, 139–146. [Google Scholar] [CrossRef]
- Taborda-Ríos, J.A.; López-Botello, O.; Zambrano-Robledo, P.; Reyes-Osorio, L.A.; Garza, C. Mechanical characterisation of a bamboo fibre/polylactic acid composite produced by fused deposition modelling. J. Reinf. Plast. Compos. 2020, 39, 932–944. [Google Scholar] [CrossRef]
- Neto, J.S.S.; Lima, R.A.A.; Cavalcanti, D.K.K.; Souza, J.P.B.; Aguiar, R.A.A.; Banea, M.D. Effect of chemical treatment on the thermal properties of hybrid natural fiber-reinforced composites. J. Appl. Polym. Sci. 2019, 136, 47154. [Google Scholar] [CrossRef]
- Neto, J.; Queiroz, H.; Aguiar, R.; Lima, R.; Cavalcanti, D.; Banea, M.D. A review of recent advances in hybrid natural fiber reinforced polymer composites. J. Renew. Mater. 2022, 10, 561–589. [Google Scholar] [CrossRef]
- Souza, S.F.; Leão, A.L.; Cai, J.H.; Wu, C.; Sain, M.; Cherian, B.M. Nanocellulose from Curava Fibers and their Nanocomposites. Mol. Cryst. Liq. Cryst. 2010, 522, 42/[342]–52/[352]. [Google Scholar] [CrossRef]
- Schindelin, J.; Arganda-Carreras, I.; Frise, E.; Kaynig, V.; Longair, M.; Pietzsch, T.; Preibisch, S.; Rueden, C.; Saalfeld, S.; Schmid, B.; et al. Fiji: An open-source platform for biological-image analysis. Nat. Methods 2012, 9, 676–682. [Google Scholar] [CrossRef]
- Coppola, B.; Cappetti, N.; Di Maio, L.; Scarfato, P.; Incarnato, L. 3D Printing of PLA/clay Nanocomposites: Influence of Printing Temperature on Printed Samples Properties. Materials 2018, 11, 1947. [Google Scholar] [CrossRef]
- de Araujo Alves Lima, R.; Kawasaki Cavalcanti, D.; de Souza e Silva Neto, J.; Meneses da Costa, H.; Banea, M.D. Effect of surface treatments on interfacial properties of natural intralaminar hybrid composites. Polym. Compos. 2020, 41, 314–325. [Google Scholar] [CrossRef]
- Correia, C.; Gomes, T.E.P.; Gonçalves, I.; Neto, V. Reprocessability of PLA through Chain Extension for Fused Filament Fabrication. J. Manuf. Mater. Process. 2022, 6, 26. [Google Scholar] [CrossRef]
- Yu, T.; Li, Y.; Ren, J. Preparation and properties of short natural fiber reinforced poly(lactic acid) composites. Trans. Nonferrous Met. Soc. China 2009, 19, s651–s655. [Google Scholar] [CrossRef]
- Berzin, F.; Lemkhanter, L.; Marcuello, C.; Chabbert, B.; Aguié-Béghin, V.; Molinari, M.; Castellani, R.; Vergnes, B. Influence of the polarity of the matrix on the breakage mechanisms of lignocellulosic fibers during twin-screw extrusion. Polym. Compos. 2020, 41, 1106–1117. [Google Scholar] [CrossRef]
- Graupner, N.; Rößler, J.; Ziegmann, G.; Müssig, J. Fibre/matrix adhesion of cellulose fibres in PLA, PP and MAPP: A critical review of pull-out test, microbond test and single fibre fragmentation test results. Compos. Part A Appl. Sci. Manuf. 2014, 63, 133–148. [Google Scholar] [CrossRef]
- Guessasma, S.; Belhabib, S.; Nouri, H. Understanding the microstructural role of bio-sourced 3D printed structures on the tensile performance. Polym. Test. 2019, 77, 105924. [Google Scholar] [CrossRef]
- Pawłowska, A.; Stepczyńska, M.; Walczak, M. Flax fibres modified with a natural plant agent used as a reinforcement for the polylactide-based biocomposites. Ind. Crops Prod. 2022, 184, 115061. [Google Scholar] [CrossRef]
- Jesus, L.C.C.; Oliveira, J.M.; Leão, R.M.; Beltrami, L.R.; Zattera, A.J.; Anflor, C.T.M.; Doca, T.C.R.; Luz, S.M. Tensile behavior analysis combined with digital image correlation and mechanical and thermal properties of microfibrillated cellulose fiber/ polylactic acid composites. Polym. Test. 2022, 113, 107665. [Google Scholar] [CrossRef]
- Silva, C.G.; Campini, P.A.L.; Rocha, D.B.; Rosa, D.S. The influence of treated eucalyptus microfibers on the properties of PLA biocomposites. Compos. Sci. Technol. 2019, 179, 54–62. [Google Scholar] [CrossRef]
- Butt, J.; Bhaskar, R.; Mohaghegh, V. Investigating the effects of extrusion temperatures and material extrusion rates on FFF-printed thermoplastics. Int. J. Adv. Manuf. Technol. 2021, 117, 2679–2699. [Google Scholar] [CrossRef]
- Neto, J.S.S.; de Queiroz, H.F.M.; Aguiar, R.A.A.; Banea, M.D. A Review on the Thermal Characterisation of Natural and Hybrid Fiber Composites. Polymers 2021, 13, 4425. [Google Scholar] [CrossRef] [PubMed]
- Azlin, M.N.M.; Sapuan, S.M.; Zuhri, M.Y.M.; Zainudin, E.S.; Ilyas, R.A. Thermal Stability, Dynamic Mechanical Analysis and Flammability Properties of Woven Kenaf/Polyester-Reinforced Polylactic Acid Hybrid Laminated Composites. Polymers 2022, 14, 2690. [Google Scholar] [CrossRef] [PubMed]
- Iannace, S.; Sorrentino, L.; Di Maio, E. 6—Biodegradable biomedical foam scaffolds. In Biomedical Foams for Tissue Engineering Applications; Netti, P.A., Ed.; Woodhead Publishing: Sawston, Cambridge, 2014; pp. 163–187. [Google Scholar] [CrossRef]
- Na, H.; Huang, J.; Xu, H.; Bao, X.; Xie, L.; Liu, F.; Zhu, B.; Wang, J.; Zhu, J. Effect of high content filling jute fiber with large aspect ratio on structure and properties of PLA composite. Polym. Compos. 2022, 43, 1429–1437. [Google Scholar] [CrossRef]
- Mofokeng, J.P.; Luyt, A.S.; Tábi, T.; Kovács, J. Comparison of injection moulded, natural fibre-reinforced composites with PP and PLA as matrices. J. Thermoplast. Compos. Mater. 2012, 25, 927–948. [Google Scholar] [CrossRef]
- Ye, C.; Ma, G.; Fu, W.; Wu, H. Effect of fiber treatment on thermal properties and crystallization of sisal fiber reinforced polylactide composites. J. Reinf. Plast. Compos. 2015, 34, 718–730. [Google Scholar] [CrossRef]
- Xia, X.; Shi, X.; Liu, W.; Zhao, H.; Li, H.; Zhang, Y. Effect of flax fiber content on polylactic acid (PLA) crystallization in PLA/flax fiber composites. Iran. Polym. J. 2017, 26, 693–702. [Google Scholar] [CrossRef]
- Akonda, M.; Alimuzzaman, S.; Shah, D.U.; Rahman, A.N.M.M. Physico-Mechanical, Thermal and Biodegradation Performance of Random Flax/Polylactic Acid and Unidirectional Flax/Polylactic Acid Biocomposites. Fibers 2018, 6, 98. [Google Scholar] [CrossRef]
- Zhang, K.; Chen, Z.; Smith, L.M.; Hong, G.; Song, W.; Zhang, S. Polypyrrole-modified bamboo fiber/polylactic acid with enhanced mechanical, the antistatic properties and thermal stability. Ind. Crops Prod. 2021, 162, 113227. [Google Scholar] [CrossRef]


| Material | Tensile Strength (MPa) | Young’s Modulus (GPa) | Elongation at Break (%) | Density (g/cm3) |
|---|---|---|---|---|
| PLA 4032D [30] | 51.00 ± 5.00 | 3.08 ± 0.30 | 5.76 ± 0.50 | 1.24 |
| Curauá [31] | 1929.80 ± 249.50 | 87.23 ± 15.40 | 3.94 ± 0.60 | 1.33 |
| Specimen Type | Fibre Length (mm) | Weight Concentration (wt.%) |
|---|---|---|
| Neat-PLA | - | - |
| C-3 mm-2% | 3.02 ± 0.97 | 2 |
| C-3 mm-3.5% | 3.5 | |
| C-3 mm-5% | 5 | |
| C-6 mm-2% | 6.53 ± 0.99 | 2 |
| C-6 mm-3.5% | 3.5 | |
| C-6 mm-5% | 5 | |
| C-8 mm-2% | 7.97 ± 0.92 | 2 |
| C-8 mm-3.5% | 3.5 | |
| C-8 mm-5% | 5 |
| Printing Parameters | Value |
|---|---|
| Nozzle diameter (mm) | 0.40 |
| Layer height (mm) | 0.20 |
| Raster width (mm) | 0.8 |
| Raster angle | 0° |
| Infill % | 100 |
| Extruder temperature (°C) | 220 |
| Printing bed temperature (°C) | 50 |
| Printing speed (mm/s) | 30 |
| Number of contours | 1 |
| Flow (%) | 108 |
| Part | Tensile Strength (MPa) | Young’s Modulus (GPa) | Strain (%) |
|---|---|---|---|
| Neat-PLA | 46.42 ± 1.62 | 2.56 ± 0.21 | 1.94 ± 0.15 |
| C-3 mm-2% | 56.45 ± 3.34 | 3.00 ± 0.13 | 2.72 ± 0.31 |
| C-3 mm-3.5% | 51.58 ± 1.9 | 3.13 ± 0.08 | 2.32 ± 0.38 |
| C-3 mm-5% | 39.15 ± 5.55 | 2.25 ± 0.12 | 1.81 ± 0.68 |
| C-6 mm-2% | 57.56 ± 0.67 | 2.4 ± 0.18 | 2.59 ± 0.18 |
| C-6 mm-3.5% | 45.98 ± 1.95 | 2.63 ± 0.2 | 2.51 ± 0.11 |
| C-6 mm-5% | 43.29 ± 0.56 | 2.91 ± 0.02 | 2.21 ± 0.1 |
| C-8 mm-2% | 54.25 ± 5.22 | 2.86 ± 0.09 | 2.34 ± 0.27 |
| C-8 mm-3.5% | 43.91 ± 3.02 | 2.16 ± 0.24 | 3.01 ± 0.46 |
| C-8 mm-5% | 44.76 ± 3.96 | 2.43 ± 0.32 | 2.62 ± 0.23 |
| Specimen Type | Onset Temperature (°C) | Maximum Temperature (°C) | Residual Mass (%) |
|---|---|---|---|
| Neat-PLA | 330 | 357.5 | 1 |
| C-3 mm-2% | 330.0 | 355.0 | 1.4 |
| C-3 mm-3.5% | 334.0 | 354.5 | 0.7 |
| C-3 mm-5% | 327.8 | 349.0 | 0.2 |
| C-6 mm-2% | 329.6 | 355.0 | 1.4 |
| C-6 mm-3.5% | 326.3 | 350.0 | 0.4 |
| C-6 mm-5% | 328.0 | 351.5 | 1.6 |
| Specimen Type | Glass Transition Temperatures (Tg) | Crystallization Temperatures (Tc) | Melting Temperature (Tm) |
|---|---|---|---|
| Neat-PLA | 64.0 | 108.1 | 175.5 |
| C-3 mm-2% | 65.1 | 104.1 | 175.0 |
| C-3 mm-3.5% | 67.5 | 106.4 | 174.7 |
| C-3 mm-5% | 64.3 | 100.9 | 174.2 |
| C-6 mm-2% | 66.1 | 103.4 | 174.3 |
| C-6 mm-3.5% | 64.0 | 106.3 | 173.5 |
| C-6 mm-5% | 64.4 | 106.5 | 174.2 |
Publisher’s Note: MDPI stays neutral with regard to jurisdictional claims in published maps and institutional affiliations. |
© 2022 by the authors. Licensee MDPI, Basel, Switzerland. This article is an open access article distributed under the terms and conditions of the Creative Commons Attribution (CC BY) license (https://creativecommons.org/licenses/by/4.0/).
Share and Cite
Cavalcanti, D.K.K.; Neto, J.S.S.; Queiroz, H.F.M.d.; Wu, Y.; Neto, V.F.S.; Banea, M.D. Development and Mechanical Characterization of Short Curauá Fiber-Reinforced PLA Composites Made via Fused Deposition Modeling. Polymers 2022, 14, 5047. https://doi.org/10.3390/polym14225047
Cavalcanti DKK, Neto JSS, Queiroz HFMd, Wu Y, Neto VFS, Banea MD. Development and Mechanical Characterization of Short Curauá Fiber-Reinforced PLA Composites Made via Fused Deposition Modeling. Polymers. 2022; 14(22):5047. https://doi.org/10.3390/polym14225047
Chicago/Turabian StyleCavalcanti, Daniel K. K., Jorge S. S. Neto, Henrique F. M. de Queiroz, Yiyun. Wu, Victor F. S. Neto, and Mariana D. Banea. 2022. "Development and Mechanical Characterization of Short Curauá Fiber-Reinforced PLA Composites Made via Fused Deposition Modeling" Polymers 14, no. 22: 5047. https://doi.org/10.3390/polym14225047
APA StyleCavalcanti, D. K. K., Neto, J. S. S., Queiroz, H. F. M. d., Wu, Y., Neto, V. F. S., & Banea, M. D. (2022). Development and Mechanical Characterization of Short Curauá Fiber-Reinforced PLA Composites Made via Fused Deposition Modeling. Polymers, 14(22), 5047. https://doi.org/10.3390/polym14225047