Abstract
Recently, substantial investigations were developed on a polyvinyl chloride (PVC)-carbon fiber-reinforced polymer (CFRP) confined concrete (PFCC) structure owing to its superior mechanical behavior and durability. However, a convenient and effective joint configuration between the PFCC columns and reinforced concrete (RC) beams still requires in-depth study. In the present work, the seismic performance of an RC beam to PFCC column exterior joint with steel tube connector (STC) is systematically studied. Eleven joint specimens are fabricated and tested, with the steel ratio of STC, reinforcement ratio of the frame beam, axial compression ratio, stirrup ratio of the joint and CFRP strips spacing as the design parameters. The experimental results, that is, 8 the failure modes, hysteretic response, ductility, strength, stiffness and energy dissipation, are analyzed. All specimens exhibit joint shear failure, although the joints with STC exhibit significantly better performance those of ordinary joint. In addition to reducing the axial compression ratio, the reinforcement ratio of the frame beam or increasing the stirrup ratio of the joint can also produce a positive effect. Furthermore, the numerical analysis of the exterior joints is performed; the calculated skeleton curves agree well with the test results, and additional parametric studies (i.e., the diameter, height and concrete strength of the joint) are carried out based on the verified numerical model.
1. Introduction
Previous studies have proven that concrete-filled tube (CFT) systems can significantly enhance the mechanical properties and durability of encased concrete; CFT has emerged as one of the essential strengthening forms for high-rise and pile foundations [1,2]. In particular, concrete-filled steel tube (CFST) and concrete-filled fiber-reinforced polymer (FRP) tube (CFFT) columns, as two of the commonest forms of CFT structures, have been extensively studied in the component and system levels [3,4,5].
However, owing to the corrosion of steel tubes, as well as the brittle fracture and high price of FRP materials [6,7], several investigations have turned to novel types of confining tubes [8,9,10]. In view of the considerable corrosion resistance of polyvinyl chloride (PVC) and excellent confinement effect of FRP strips, the PVC-CFRP confined concrete (PFCC) column was introduced [11]. So far, the mechanical properties of the PFCC column have been extensively studied, such as its static, seismic and long-term behavior, which exhibits the advantages of lightweight, high bearing capacity, excellent ductility and durability [12,13,14].
It is well recognized that the connection between the CFT columns and reinforced concrete (RC) beams is an imperative research field for CFT systems [15,16,17]. Currently, studies involving the connection between the CFT columns and RC beams are mainly focused on the CFST structure [18,19,20,21,22,23]. Among them, according to whether the steel tube is interrupted in the joint core, the joints can be divided into column-through system and beam-through system. For the former, although the expected joint stiffness can be measured, the following defects are commonly demonstrated: (1) The transmission of joint shear force relies on external steel members, such as reinforced loop plate [24], steel corbels [25,26] and plate-studs [27], which may result in stress concentration, whereby (2) the mentioned steel members are required to be bolted or welded to the CFST columns on-site, which complicates the process of construction.
For the beam-through system, the longitudinal bars of the RC beam can penetrate through the joint core directly, which significantly improves the integrity of the joint area. However, considering the discontinuity of the steel tube may weaken the confinement on the joint core concrete, a novel joint form (i.e., a steel tube connector (STC) with the surrounded ring stirrups is employed in the joint core to confine the core concrete) is proposed [28]. Wang et al [29] carried out the axial compression experiments on the RC beam to CFST column joint with STC. The results manifested that STC could effectively transmit the vertical loads and exhibited excellent bearing capacity and deformability. Subsequently, Fu [30] developed a finite element (FE) analysis on the composite joints, and the method for calculating the compressive strength was proposed. The hysteretic behavior of composite joints was experimentally and numerically investigated by dozens of scaled joints [31,32]. The results demonstrated that all specimens were damaged with the occurrence of the plastic hinge, the full hysteretic curves reflected that the joints presented superior energy dissipation capacity and ductility.
As mentioned above, multiple studies have confirmed the feasibility of the joint with STC. Similar measures were applied to deal with connections between the PFCC columns and RC beams, and a series of static experiments and FE simulations were performed [33,34,35,36]. The results revealed that the bearing capacity, deformability and stiffness of the specimens increased considerably with the improvement in the steel ratio of STC. Moreover, the prediction formula of axial bearing capacity and the related structural measures were proposed.
Nevertheless, given the vulnerable portions in the earthquakes, it is far from sufficient to only conduct the investigations on the static performance of the developed joints [37,38]. Meanwhile, the exterior joints are only confined by the unilateral frame beam, resulting in its damage in the earthquake are more serious than the interior joints. Therefore, ten RC beam to PFCC column exterior joints with STC and one ordinary exterior joint are prepared and tested under low cycle loading in the work. The impacts of the steel ratio of STC, reinforcement ratio of the frame beam, axial compression ratio, stirrup ratio of the joint and CFRP strips spacing on the seismic performances are systematically analyzed. Furthermore, the numerical analysis of the joint is established utilizing the OpenSees and verified by the experimental data. Finally, the additional parametric studies are conducted and some configuration suggestions are proposed, which is expected to provide a theoretical guideline for the application of the PFCC structures.
2. Test Preparation
2.1. Design of the Joints
To ensure that the loading conditions of the specimens were in accordance with the stress characteristics of the frame joints, a T-shaped joint consisting of the upper and lower columns and a unilateral frame beam were intercepted as the investigation objects. The overall appearance and detailed reinforcements of the specimens are plotted in Figure 1.
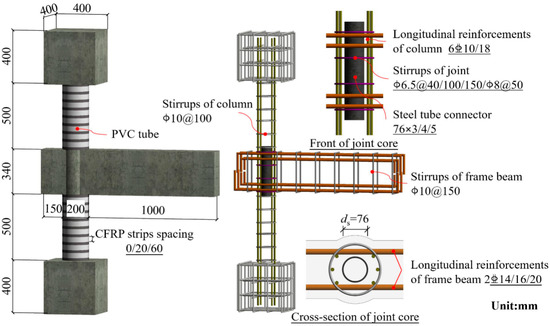
Figure 1.
The overall appearance and detailed reinforcements of the specimens.
A total of ten RC beam to PFCC column exterior joints with STC and one reference joint were manufactured. The design principle of “strong members, weak joint” was adopted because the main purposes of this experiment was to investigate the failure modes and seismic behavior of the composite joints. The impacts of the steel ratio of STC , reinforcement ratio of the frame beam , axial compression ratio , stirrup ratio of the joint and CFRP strips spacing are considered. The detailed parameters are depicted in Table 1.

Table 1.
The detailed parameters of the specimens.
Additionally, the thickness of the PVC tubes adopted for the specimens was 7.8 mm and the outer diameter was 200 mm. Two layers of 0.111 mm thick CFRP strips are wrapped around the PVC tubes in the hoop direction, and the width of each layer is 20 mm. It is worth mentioning that an additional layer of CFRP strip is utilized at the PFCC column ends to prevent its premature failure. The stirrups of the PFCC columns and frame beams for all specimens are A10@150 and A10@100, respectively.
2.2. Material Properties
According to GB/T 50152-2012 [39], the cube specimens with a side length of 150 mm are prepared when pouring the joint specimens, the average compressive strength and elastic modulus of the concrete obtained from the cube test are 22.28 Mpa and 3.06 × 10⁴ Mpa, respectively. The main index properties of the steel material, PVC tubes and CFRP strips adopted in the test are measured according to GB/T 228.1-2010 [40], GB/T 8804.1-2003 [41] and GB/T 3354-2014 [42], respectively, and the measurement results are recorded in Table 2.

Table 2.
Mechanical index of the steel, PVC tubes, FRP strips and reinforcements.
2.3. Loading Device and Protocol
As presented in Figure 2, the vertical load transmitted from the superstructure is performed by the hydraulic jack on the column top, the MTS actuator attached to the portal frame provides the cyclic loading to simulate the seismic action. The data acquisition system automatically captures the vertical loads and displacements at the frame beam end from the transducers inside the MTS actuator.
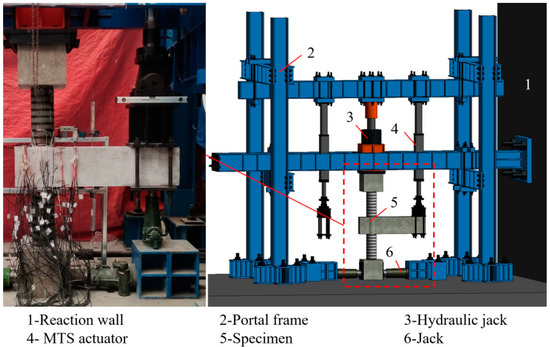
Figure 2.
The loading and measurement device.
Referring to the test method specified in China Industry Standard JGJ/T 101-2015 [43], the displacement control is adopted, as illustrated in Figure 3. The loading process can be divided into two stages: Before the specimen yield, the load cycles for each control level performs once, and the displacement amplitude increases by 1 mm after each cycle. Then, the load for each control level repeats thrice with an integral multiple yield displacement Δy as the displacement amplitude until the specimen is destroyed or the load declines to 85% of the peak bearing capacity. However, considering the relatively poor deformability in the joint core of the designed specimens, the method of identifying the yield displacement Δy by the reinforcements yielding may result in the premature failure of the specimens. Consequently, in accordance with the crack development and reinforcements strain of the specimens in the pre-test, 6 mm is selected as the yield displacement in subsequent test. Nevertheless, regarding the subsequent seismic performance analysis, the veritable yield displacement is determined by the energy equivalence method [44] based on the obtained load-displacement skeleton curves.
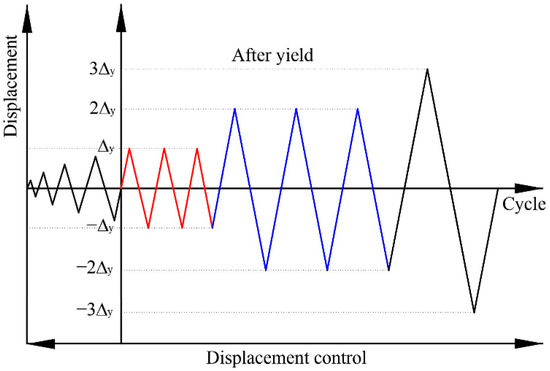
Figure 3.
The loading protocol.
3. Experimental Observations and Results
To facilitate the description of the experimental phenomenon, the components of the joints are denominated as shown in Figure 4.
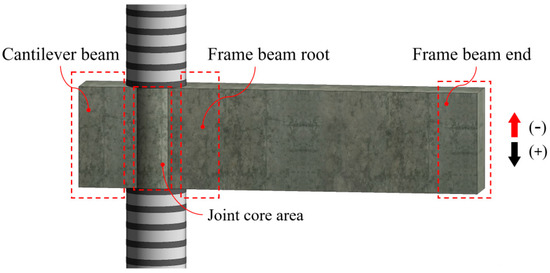
Figure 4.
Denomination of the components.
3.1. Crack and Failure Modes
As expected, the shear failure of the joint core area is observed in all specimens, and the variation in the structural parameters has no apparent impact on the final failure mode. Meanwhile, the specimens exhibit similar crack mode except for an insignificant variance in the timing of crack appearance. The typical crack and failure mode are depicted in Figure 5, and the exhaustive description of the failure process is developed as follows.
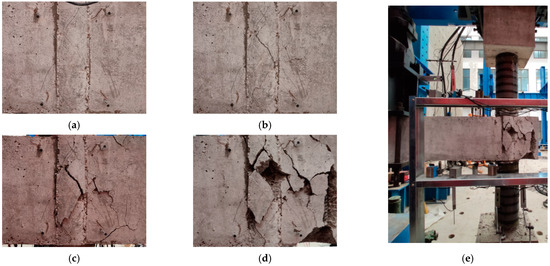
Figure 5.
Typical crack and failure mode. (a) Oblique cracks. (b) Crossed oblique cracks. (c) Cracks extending. (d) Concrete spalling. (e) Overall failure mode.
At the initial loading stage, the specimens have no obvious cracks and exhibit elastic response. With the improvement of the displacement in the frame beam end (hereinafter called displacement), several oblique cracks emerge in the joint core area. Compared with the specimens PJ-2 and PJ-4, the above-mentioned oblique cracks of the specimen PJ-5 is accompanied with a higher displacement, which is mainly because the joint stirrups can provide a slight confinement for the surrounding concrete. At the displacement of 2Δy, the oblique cracks are developed into the crossed oblique cracks and extends to the frame beam root and the cantilever beam. Until the peak bearing capacity is reached, the cracks present a stable development without new cracks occur, only the increase in the crack width. In this stage, the improvement in axial compression ratio can further accelerate the cracks development. When loading to the cycle with the displacement of 6Δy, severe concrete spalling is exhibited in the joint core area, an inevitable bond-slip between the STC and the joint concrete is observed, which indicates that the experiment is accomplished. There is no significant damage in the PFCC column during the whole loading process.
3.2. Hysteretic Response
Figure 6 plots the hysteretic curves between the vertical load on the frame beam end P and the corresponding vertical displacement Δ. All hysteretic curves are characterized by the significant pinching effect and residual deformation, the evolution of the generic hysteretic curves is described as follows.
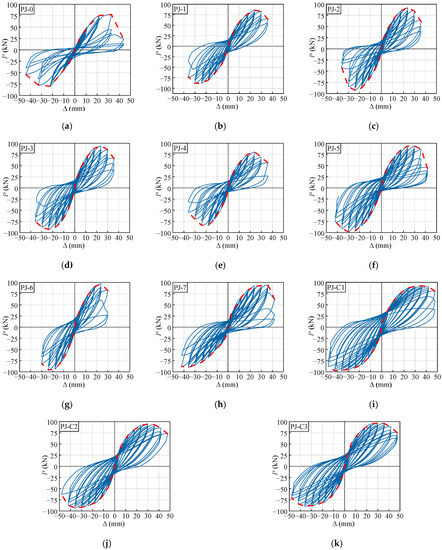
Figure 6.
Hysteresis and skeleton curves of the specimens. (a) PJ-0. (b) PJ-1. (c) PJ-2. (d) PJ-3. (e) PJ-4. (f) PJ-5. (g) PJ-6. (h) PJ-7. (i) PJ-C1. (j) PJ-C2. (k) PJ-C3.
Before the specimens cracking, the hysteretic curves basically cycle linearly with a slight residual deformation. When the obvious crossed oblique cracks appearing in the joint core area, the hysteretic curves gradually progress into the elasto-plastic stage, in which stage, the growth rate of load is increasingly slower than the displacement, the pinching phenomenon is detected and becomes more pronounced with the increasing displacement. After the peak bearing capacity is reached, since the bond failure between the joint concrete and STC, the growth rate of load decreases drastically. Correspondingly, the apparent residual deformation and pinching effect is observed from the hysteretic loops, which indicates the significant degradation in strength and stiffness of the joints.
Additionally, as illustrated in Figure 6, the hysteretic curve of the specimen PJ-0 exhibits a premature pinching phenomenon and short yielding platform. In contrast, the hysteretic loops of the specimens PJ-1, PJ-2 and PJ-3 are relatively plump and show a fusiform shape, indicating that the seismic performance can be significantly enhanced after strengthening with STC. Meanwhile, the improvement in the stirrup ratio of the joint, reinforcement ratio of the frame beam or the decrease of axial compression ratio can also enlarge the area surrounded by the hysteretic loops. The CFRP strips spacing has no significant impact on the hysteretic behavior, mainly because the PFCC column is basically unimpaired when the specimens are damaged. This is in accordance with the results proposed by Ref. [45].
The P-Δ skeleton curves for each specimen are also presented in Figure 6, which are generated by sequentially connecting the peak points of the first hysteretic loop for each displacement loading, involving the seismic performance indicators such as bearing capacity and deformability, etc. Obviously, each specimen undergoes a prominent elastic stage, elasto-plastic stage, plastic hardening stage, and descending stage. The trajectories of all specimens exhibit slight diversity in the initial stage, indicating the impact of various structural parameters on the seismic performance is mainly reflected in the elasto-plastic stage and beyond.
For an intuitive discussion of the test results, the peak loads and displacements (The average values of the positive and negative directions of the points) are plotted in Figure 7. The peak bearing capacity of the specimens PJ-1, PJ-2, and PJ-3 increase by 10.6%, 18.2%, and 18.7% contrasting with that of the reference specimen PJ-0, respectively. This is because the STC can deliver a confinement on the encased concrete and participate in bearing the shear forces. Similar reason results in a higher peak bear capacity of 3.5% and 16.7% for the specimen PJ-5 compared with the specimens PJ-4 and PJ-2, respectively. Additionally, it is worth noting that when the steel ratio of STC exceeds 3.39%, the peak bearing capacity does not increase significantly as the steel ratio of STC increases. This is because, a certain bond failure is occurred between the joint concrete and the STC before the peak bearing capacity is reached. With the improvement in axial compression ratio, the compressive region of the joint concrete is enlarged, which is the reason for the 10.7% increase in peak bearing capacity of the specimen PJ-6 compared to the specimen PJ-1.
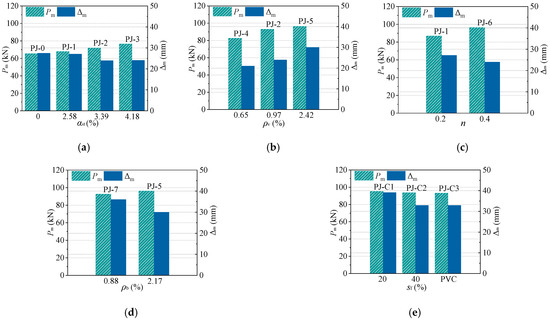
Figure 7.
Effects of design parameters on the peak bearing capacity and deformation. (a) Steel ratio of STC. (b) Stirrup ratio of the joint. (c) Axial compression ratio. (d) Reinforcement ratio of the frame beam. (e) CFRP strips spacing.
Moreover, it is observed that the peak displacements of the specimens are principally determined by the stirrup ratio of the joint and the reinforcement ratio of the frame beam. With the improvement in stirrup ratio of the joint, the development of the core concrete cracks is further confined, and the joints present a stronger deformability. Meanwhile, the plastic hinge on the frame beam root is more prone to adequately develop with a smaller reinforcement ratio of the frame beam, the deformability of the joints can also be enhanced.
3.3. Ductility
The ductility coefficient is a crucial indicator to quantify the deformability of the RC structures in seismic design, which is defined as the ratio of the ultimate displacement to the yield displacement . Based on the skeleton curves established above, is defined as the point corresponding to a 15% strength degradation from the peak point. is determined by the energy equivalence method [44], as illustrated in Figure 8. The ductility coefficients of each specimen are summarized in Figure 9.
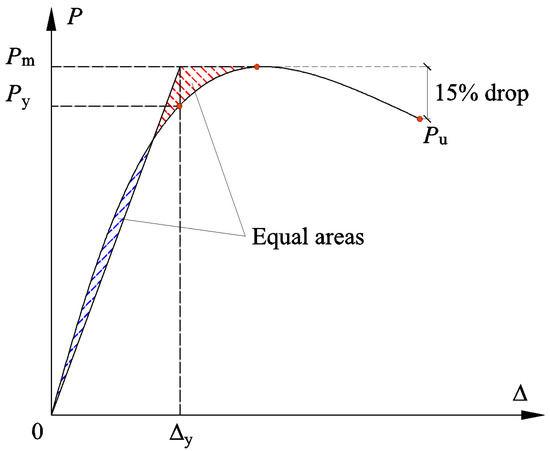
Figure 8.
Illustration of energy equivalence method.
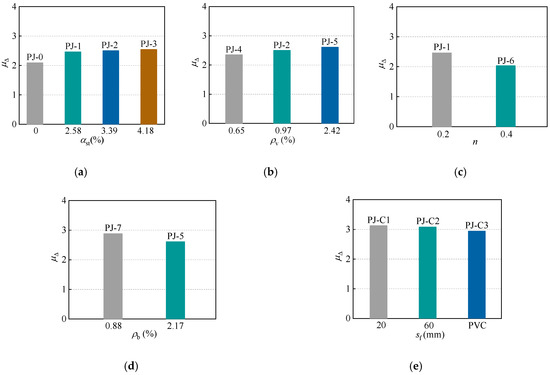
Figure 9.
Effects of design parameters on the ductility coefficients. (a) Steel ratio of STC. (b) Stirrup ratio of the joint. (c) Axial compression ratio. (d) Reinforcement ratio of the frame beam. (e) CFRP strips spacing.
The ductility coefficients of the specimens PJ-0, PJ-1, PJ-2 and PJ-3 are 2.09, 2.46, 2.50 and 2.54, respectively. The ductility coefficient of the specimen PJ-3 is only slightly higher than that of the specimen PJ-1 attribute to the above-mentioned bond failure. Therefore, corresponding methods should be developed to avoid this phenomenon, such as welding ring bars or shear studs on the outer wall of STC. Alternatively, bonding (or bolting, etc.) CFRP profiles on the surface of the joint area as additional shear reinforcement is an option worth investigating [46,47,48,49,50]. However, the improvement is considerable compared to the ordinary joint.
Additionally, as the stirrup ratio of the joint increases, the confinement on the core concrete at the periphery of the STC is enhanced, which can effectively inhibit the extension of the joint concrete cracks, resulting in a stronger ductility of the specimens. The ductility coefficient of the specimen PJ-5 with a higher reinforcement ratio of the frame beam is 10.3% less than that of the specimen PJ-7. This may due to the higher reinforcement ratio inhibiting the generation of the plastic hinge. It is worth mentioning that, although the specimen PJ-6 exhibits a considerable peak bearing capacity in the above description, its ductility is the lowest among the specimens, this is because the increasing axial compression ratio will further accelerate the development of concrete cracks.
Furthermore, the ductility coefficient of each specimen ranges from 2.03 to 3.12, which satisfies the requirement that the ductility coefficient of RC structures is not less than 2 [44].
3.4. Strength Degradation
Since the cyclic loading is usually accompanied by a reduction in the bearing capacity for the identical displacement amplitude, the strength degradation coefficient is utilized to estimate the degree of degradation, as shown in Equation (1).
where, and denote the peak load at the ith cycle and first cycle for the displacement amplitude level j, respectively.
To simplify the calculation, the strength degradation coefficient at the second cyclic loading is adopted, as depicted in Figure 10. All specimens exhibit similar strength degradation coefficients in the initial stage, and the effect of each structural parameter on the stiffness degradation commences in the descending stage.
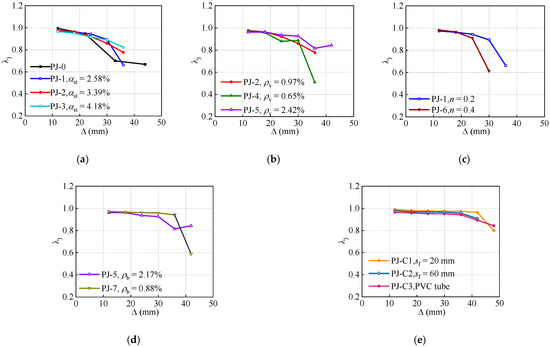
Figure 10.
Effects of design parameters on the strength degradation coefficient. (a) Steel ratio of STC. (b) Stirrup ratio of the joint. (c) Axial compression ratio. (d) Reinforcement ratio of the frame beam. (e) CFRP strips spacing.
In the specimens with the steel ratio of STC and stirrup ratio of the joint as the comparison parameters, the specimens PJ-3 and PJ-5 show the gentlest descending stage. Manifesting that the improvement in the steel ratio of STC and stirrup ratio of the joint are relatively effective methods to strengthen the joints. Significantly, the turning point of the specimen PJ-1 is earlier than that of the specimen PJ-6, which suggests that the improvement in axial compression ratio will accelerate the strength degradation. The strength degradation coefficient of the specimen PJ-7 is maintained above 0.8, indicating the joints with lower reinforcement ratio of the frame beam can perform a better stability of the bearing capacity.
3.5. Stiffness Degradation
Stiffness is often described as the ability of the RC structures to resist the deformation. The loop stiffness is introduced to characterize the stiffness degradation of the joints, which is defined as Equation (2).
where, denotes the peak displacement at the ith cycle for the displacement amplitude level j.
As shown in Figure 11, a similar law to the strength degradation is revealed in the stiffness degradation, presenting two distinct rates of degradation. After the turning point, the specimens PJ-3 and PJ-5 with a higher steel ratio of STC and stirrup ratio of the joint present a more stable stiffness degradation than that of the specimens PJ-0, PJ-1, PJ-2 and PJ-4. This behavior further demonstrates the effectiveness of the STC and joint stirrups in enhancing the seismic performance of the proposed joint. In contrast with the strength degradation, the specimen PJ-1 exhibits a slightly lower initial stiffness compared with the specimen PJ-6. However, as the loading proceeds, the specimen PJ-6 presents a more severe tendency of stiffness degradation due to the accelerated cracks development with the axial compression ratio increases.
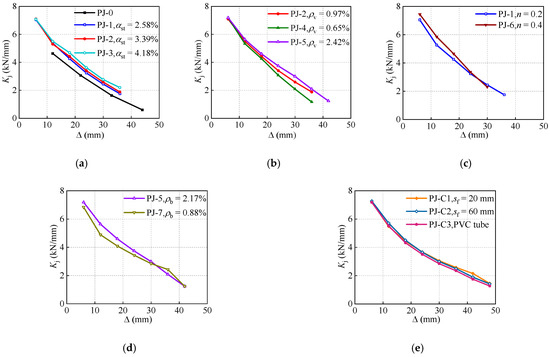
Figure 11.
Effects of design parameters on the loop stiffness. (a) Steel ratio of STC. (b) Stirrup ratio of the joint. (c) Axial compression ratio. (d) Reinforcement ratio of the frame beam. (e) CFRP strips spacing.
3.6. Energy Dissipation
The equivalent viscous damping ratio is generally recognized as an indicator to evaluate the magnitude of the energy dissipation capacity. As shown in Figure 12, the is defined as Equation (3).
where, , and are the areas enveloped by the hysteretic loop ABCDA, triangle OBF and triangle ODE, respectively.
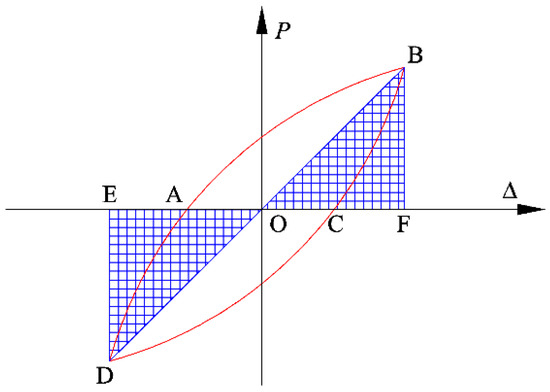
Figure 12.
Typical hysteretic loop.
The development of the curves is presented in Figure 13. In combination with the skeleton curves, the curves are classified into the stable stage and ascending stage. It can be observed that the of the joints with STC are higher than that of the ordinary joint throughout the loading process. However, owing to the bond failure between the joint concrete and STC, the STC does not yield completely, resulting in the effect of the steel ratio of STC on the is not noticeable.

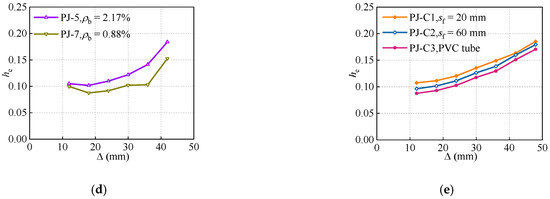
Figure 13.
Effects of design parameters on the equivalent viscous damping ratio. (a) Steel ratio of STC. (b) Stirrup ratio of the joint. (c) Axial compression ratio. (d) Reinforcement ratio of the frame beam. (e) CFRP strips spacing.
In addition, the impact of the stirrup ratio of the joint on the is revealed in the ascending stage, i.e., the increases with the improvement in the stirrup ratio of the joint. Interestingly, the of the specimen PJ-5 is smaller than that of the specimens PJ-2 and PJ-4 after the displacement reaches 36 mm. This is due to the fact that the confining effect from the joint stirrups of the specimen PJ-5 is not entirely developed. On the other hand, the specimen PJ-5 exhibits a more favorable capability of cumulative energy dissipation. As the axial compression ratio increases, the curves present a faster growth rate. This is mainly because, the lateral deformation of the joint concrete expands correspondingly with the increasing axial compression ratio. However, it also induces the earlier damage of the specimens. As expected, the CFRP strips spacing exhibits a slight impact on the stiffness degradation, nevertheless, as described in the Ref. [51], the efficacy of the CFRP strips in the joints with STC can probably be found in the high axial compression ratio specimens. In addition, the specimen PJ-5 presents a relatively excellent energy dissipation capacity, especially in the ascending stage, where its is 20.9% to 38.5% higher than that of the specimen PJ-7, which may attribute to the increased flexural stiffness of the frame beam.
4. Numerical Modelling
OpenSees is a finite element software for simulating the seismic response of engineering structures, which shows the advantages of short computation time-consumption and high solution efficiency. The skeleton curves of the exterior joint with STC under low cyclic loading is numerically simulated by the fiber beam-column element in the OpenSees, and the further parametric analysis of the joints is performed.
4.1. Constitutive Model of the Materials
(1) Concrete
The ‘Concrete02′ and ‘Concrete03′ models are commonly adopted in OpenSees to simulate the concrete under seismic action since they can incorporate the stiffness degradation and hysteretic energy dissipation of the concrete during the loading and unloading. Nevertheless, in view of the time consumption of the concrete03 model, model concrete02 is introduced in the analysis models of the sandwiched concrete and ordinary concrete. The stress–strain relationship of the proposed model is illustrated in Figure 14a.
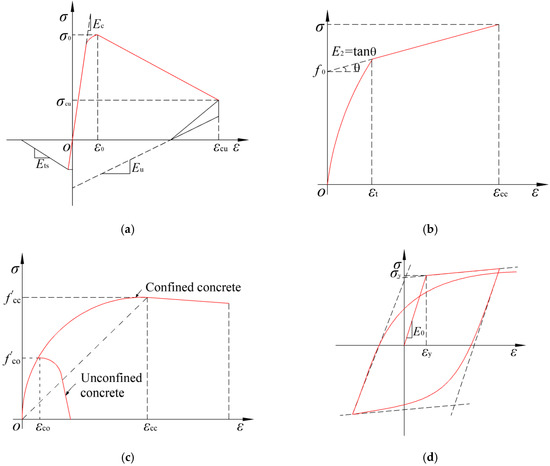
Figure 14.
Material models. (a) Concrete02 model. (b) PVC-FRP confined concrete. (c) Joint core concrete. (d) Steel02 model.
The properties of PVC-FRP confined concrete are defined according to the constitutive model proposed by Fang et al. [13], as shown in Figure 14b. For the joint core concrete, considering it is not only confined by the STC, the confinement produced by the peripheral stirrups confine concrete is also considerable, the steel tube confined concrete model proposed by Han [52] is not applicable for the present test. Thus, for instead, the modified confined concrete constitutive model proposed by Mander [53] is selected, the specific modification is to adjust the improvement factor η from 5 to 5.5 to incorporate the confining effect of the STC, as shown in Figure 14c.
(2) Steel
The simulated results of the ‘steel02’ model are in good agreement with the cyclic loading tests on the steel materials. Meanwhile, the ‘steel02′ model can fully reveal the kinematic hardening effect and nonlinear combined isotropic. Thus, the ‘steel02′ model proposed by Filippou et al. [54] is utilized for the reinforcements and steel tubes, as demonstrated in Figure 14d.
4.2. Fiber Beam-Column Element
The joint core area is modelled with fiber cross sections, as presented in Figure 15. The beam-column element model is composed of four internal joints and four external joints, and all internal and external joints are located at a rigid interface. Each external joint has one degree of freedom for rotation and two degrees of freedom for translation to ensure the compatibility of the frame beam and column elements. Between the two rigid interfaces, eight zero-length slip spring elements are developed to consider the degradation of the stiffness and strength owing to the bond slip between the longitudinal reinforcements and concrete. The degradation of the shear force transmission capacity at the interface around the joints is simulated by four zero-length shear spring elements. Additionally, the degradation of strength and stiffness caused by the joint shear failure is simulated by the plate zone.
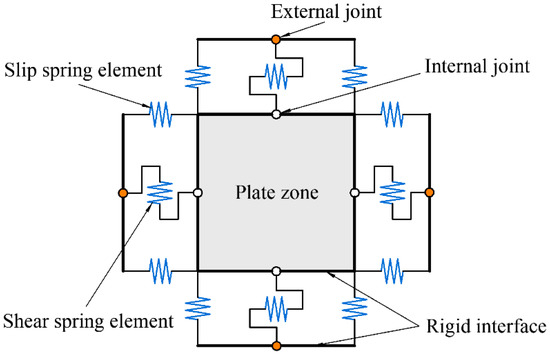
Figure 15.
Analytical model of the joint specimens.
4.3. Modelling of the Shear Behavior in the Joint Core Area
To accurately model the joint core area subjected to low cyclic loading, the shear behavior of the panel zone should be specified. The diagonal strut model [55,56] is suggested to determine the parameters of the shear stress-strain skeleton curves of the plate zone, the height of the diagonal strut is regarded to be constant during the loading process, and the empirical formula is selected to determine its value. Therefore, the geometry of the diagonal strut is calculated as follows.
where, denote the inclination of the diagonal strut. is the confining effect coefficient of the CFRP strips [57]. and are the section height of the frame beam and the PFCC column, respectively. and are the height of compression zone of the frame beam and the PFCC column, respectively.
Meanwhile, owing to the panel zone consists of the joint stirrups, sandwiched concrete and steel tube confined concrete, its shear behavior is distinct from the CFST structures. On the basis of the analytic results in Ref. [36], to completely reveal the doubly confining effect of the joint stirrups and steel tube on the core concrete, the modified confined concrete constitutive model implemented by Mander [53] is adopted, and the shear stress and shear deformation of the panel zone are calculated as follows.
where, , , , and are the area, width, height, axial compressive stress and strain of the diagonal strut, respectively. denote the total area of the joint core area.
4.4. Validation of the FE Model
Through the above modeling steps, the numerical P-Δ skeleton curves are developed, as illustrated in Figure 16. It can be found that the skeleton curves obtained numerically and experimentally present highly overlapped, which verifies the accuracy of the established FE model.
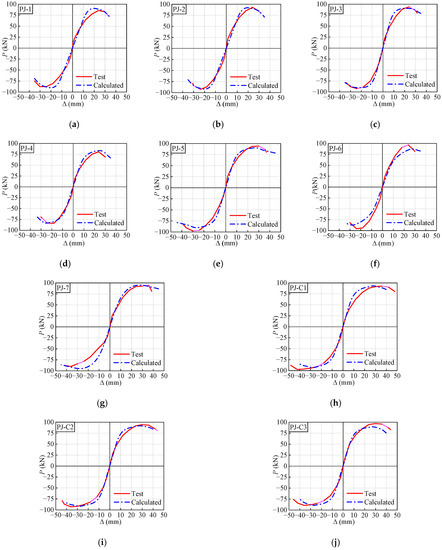
Figure 16.
Comparison between the test and calculated skeleton curves. (a) PJ-1. (b) PJ-2. (c) PJ-3. (d) PJ-4. (e) PJ-5. (f) PJ-6. (g) PJ-7. (h) PJ-C1. (i) PJ-C2. (j) PJ-C3.
4.5. Parameter Analysis
On the basis of the validated FE model, additional parameters which may influence the seismic behavior of the joints are further analyzed, for the purposes of improving the seismic design of this composite structure. The P-Δ skeleton curves with the various parameters are illustrated in Figure 17. The specimen designs for parameter analysis are the same as that of the specimen PJ-2 unless otherwise stated.

Figure 17.
Effects of various parameters on the numerical skeleton curves. (a) Joint heigh. (b) Joint concrete strength. (c) Joint diameter.
As illustrated in Figure 17a, with the joint heigh varies from 400 mm to 550 mm with the increment of 50 mm, the bearing capacity of the simulated specimens does not exhibit distinct differences (Maximum variation is 8%). However, since the height of the frame beam is consistent with the joint, and the larger dimension of the frame beam is disadvantageous for the plastic hinge development, which result in the seismic performances including the deformability and ductility are weakened at different levels as the joint height increases. Additionally, it is worth noting that as the joint height increases from 500 mm to 550 mm, the peak bearing capacity is not improved while the reduction in the peak displacement is observed. Hence, it can be concluded that the joint height below 500 mm appear to be an optimum solution for the proposed joint.
As illustrated in Figure 17b, increasing the joint concrete strength from C20 to C80 improves the corresponding peak bearing capacity by 37.5%, 50.2% and 54.7%, respectively. However, as the concrete strength exceeds C60, the improvement in bearing capacity is negligible, while the stiffness degradation is accelerated. This may be attributed to the fact that concrete with higher strength is more prone to brittle failure. This observation suggests that the joint concrete with strength above C60 may not provide better seismic behavior for the proposed joint.
As illustrated in Figure 17c, the skeleton curves present a consistent trend with increasing joint diameter, i.e., both the bearing capacity and deformability are enhanced accordingly. Noticeably, increasing the joint diameter from 300 mm to 350 mm, the bearing capacity is hardly changed because the joint core is undestroyed, and the strength is not fully utilized when the specimen failure, while the ultimate displacement has a considerable development of 22.2%. Considering the fact that the excessive size of the joint is not conducive to construction and architectural aesthetics, the joint diameter of the proposed joint should not exceed 300 mm.
5. Conclusions
Seismic behaviors were investigated on the RC beam to PFCC column exterior joint with STC through the experiment and numerical simulation in this study. The following conclusions can be obtained:
- The final failure mode exhibited by all specimens is a joint shear failure. The increase in the stirrup ratio of the joint or the decline in the axial compression ratio can effectively confine the crack development of the joint concrete.
- The proposed joint with STC presents a superior seismic performance when compared with the ordinary joint. However, the strength of STC cannot be completely utilized owing to the premature bond failure between the joint concrete and STC.
- By increasing the steel ratio of STC or the stirrup ratio of the joint, the pinching effect of the hysteretic curves is controlled, the ductility and energy dissipation capacity are enhanced, and the strength degradation and stiffness degradation are delayed, while the increase in the reinforcement ratio of the frame beam and axial compression ratio presents the opposite effects.
- The higher stirrup ratio of the joint, axial compression ratio and steel ratio of STC develops a better contribution to the peak bearing capacity. Meanwhile, the peak displacement of the specimens observably increases as the stirrup ratio of the joint increases or the reinforcement ratio of the frame beam decreases.
- The numerical model of the joint is established by OpenSees, and it is verified that the developed model can well simulate the skeleton curves of the proposed joint.
- The parametric numerical analysis indicates that the peak bearing capacity increases with the concrete strength, height or diameter of the joint increase, while the increase in the height of the joint can also result in the reduction of the peak displacement. Considering the bearing capacity, deformability and construction convenience, it is recommended that the joint height be below 500 mm, the joint concrete strength be below C60 and the joint diameter not exceed 300 mm.
Author Contributions
Conceptualization, F.Y.; methodology, F.Y.; software, S.T.; validation, F.Y. and H.B.; formal analysis, S.T.; investigation, Y.G.; resources, F.Y.; data curation, S.T. and Y.G.; writing—original draft preparation, S.T. and Y.G.; writing—review and editing, H.B.; visualization, H.B.; supervision, F.Y. and H.B.; project administration, F.Y.; funding acquisition, F.Y. All authors have read and agreed to the published version of the manuscript.
Funding
This research was funded by the National Natural Science Foundation of China (No. 51878002, 52078001), Outstanding Youth Fund of Anhui Province (No. 2008085J29), Major Science and Technology Project of Anhui Province (No. 202203a07020005), Key Research and Development Project of Anhui Province (No. 2022i01020005) and University Natural Science Research Project of Anhui Province (No. YJS20210351).
Institutional Review Board Statement
Not applicable.
Informed Consent Statement
Not applicable.
Data Availability Statement
The data presented in this study are available on request from the corresponding author.
Conflicts of Interest
The authors declare no conflict of interest.
References
- Samarakkody, D.I.; Thambiratnam, D.P.; Chan, T.H.; Moragaspitiya, P.H. Differential axial shortening and its effects in high rise buildings with composite concrete filled tube columns. Constr. Build. Mater. 2017, 143, 659–672. [Google Scholar] [CrossRef]
- Xu, T.; Zhang, S.; Liu, J.; Wang, X. Design method of concrete filled thin-walled steel tube column-foundation connections. Eng. Struct. 2021, 246, 113033. [Google Scholar] [CrossRef]
- Ozbakkaloglu, T.; Lim, J.C. Axial compressive behavior of FRP-confined concrete: Experimental test database and a new design-oriented model. Compos. Part B Eng. 2013, 55, 607–634. [Google Scholar] [CrossRef]
- Ozbakkaloglu, T.; Lim, J.C.; Vincent, T. FRP-confined concrete in circular sections: Review and assessment of stress–strain models. Eng. Struct. 2013, 49, 1068–1088. [Google Scholar] [CrossRef]
- Alatshan, F.; Osman, S.A.; Hamid, R.; Mashiri, F. Stiffened concrete-filled steel tubes: A systematic review. Thin-Walled Struct. 2020, 148, 106590. [Google Scholar] [CrossRef]
- Hou, C.; Han, L.-H.; Zhao, X.-L. Full-range analysis on square CFST stub columns and beams under loading and chloride corrosion. Thin-Walled Struct. 2013, 68, 50–64. [Google Scholar] [CrossRef]
- Micelli, F.; Mazzotta, R.; Leone, M.; Aiello, M.A. Review Study on the Durability of FRP-Confined Concrete. J. Compos. Constr. 2015, 19, 04014056. [Google Scholar] [CrossRef]
- Toutanji, H.; Saafi, M. Stress-strain behavior of concrete columns confined with hybrid composite materials. Mater. Struct. 2002, 35, 338–347. [Google Scholar] [CrossRef]
- Gupta, P.K. Confinement of concrete columns with unplasticized Poly-vinyl chloride tubes. Int. J. Adv. Struct. Eng. 2013, 5, 19. [Google Scholar] [CrossRef]
- Wang, J.; Yang, Q. Experimental study on mechanical properties of concrete confined with plastic pipe. ACI Mater. J. 2010, 107, 132. [Google Scholar]
- Yu, F.; Niu, D.T.; Wu, P. Research on the concrete filled PVC-FRP tube structure. Build. Sci. 2007, 23, 102–104. [Google Scholar]
- Fakharifar, M.; Chen, G. Compressive behavior of FRP-confined concrete-filled PVC tubular columns. Compos. Struct. 2016, 141, 91–109. [Google Scholar] [CrossRef]
- Fang, Y.; Yu, F.; Chen, A.C.; Wang, S.L.; Xu, G.S. An analytical model for PVC-FRP confined reinforced concrete columns under low cyclic loading. Struct. Eng. Mech. 2021, 77, 179–196. [Google Scholar] [CrossRef]
- Toutanji, H.; Saafi, M. Durability studies on concrete columns encased in PVC–FRP composite tubes. Compos. Struct. 2001, 54, 27–35. [Google Scholar] [CrossRef]
- Thai, H.-T.; Uy, B.; Yamesri; Aslani, F. Behaviour of bolted endplate composite joints to square and circular CFST columns. J. Constr. Steel Res. 2017, 131, 68–82. [Google Scholar] [CrossRef]
- Kharoob, O.; Ghazy, M.; Yossef, N. Behavior of beam-high performance fiber reinforced CFST column joints. Thin-Walled Struct. 2017, 113, 217–227. [Google Scholar] [CrossRef]
- Wang, Y.H.; Jiang, J.F.; Zhou, X.H.; Fu, M.; Guo, Z.H. Experimental study on semi-connected edge joint with core steel tube in CFST. China Civ. Eng. J. 2006, 12, 54–59. [Google Scholar] [CrossRef]
- Fang, X.D.; Li, S.Y.; Chen, A.J. Experimental research on a new type of steel tube confined concrete column joint. J. Build. Struct. 1999, 20, 2–13. [Google Scholar]
- Chen, Q.-J.; Cai, J.; Bradford, M.A.; Liu, X.; Zuo, Z.-L. Seismic behaviour of a through-beam connection between concrete-filled steel tubular columns and reinforced concrete beams. Eng. Struct. 2014, 80, 24–39. [Google Scholar] [CrossRef]
- Han, L.-H.; Qu, H.; Tao, Z.; Wang, Z.-F. Experimental behaviour of thin-walled steel tube confined concrete column to RC beam joints under cyclic loading. Thin-Walled Struct. 2009, 47, 847–857. [Google Scholar] [CrossRef]
- Lim, J.-J.; Eom, T.-S.; Kim, J.-W.; Ha, T.-H. Cyclic loading tests of interior beam–column connections for concrete-filled thin-walled tube columns. Eng. Struct. 2019, 190, 20–30. [Google Scholar] [CrossRef]
- Liu, Y.; Ma, H.; Li, Z.; Wang, W. Seismic behaviour of full-scale prefabricated RC beam–CFST column joints connected by reinforcement coupling sleeves. Structures 2020, 28, 2760–2771. [Google Scholar] [CrossRef]
- Ataei, A.; Bradford, M.A.; Valipour, H.R. Experimental study of flush end plate beam-to-CFST column composite joints with deconstructable bolted shear connectors. Eng. Struct. 2015, 99, 616–630. [Google Scholar] [CrossRef]
- Zha, X.X.; Wan, C.Y.; Yu, H. Seismic behavior study on RC-beam to CFST-column non-welding joints in field construction. J. Constr. Steel Res. 2016, 116, 204–217. [Google Scholar]
- Ding, F.-X.; Yin, G.-A.; Wang, L.-P.; Hu, D.; Chen, G.-Q. Seismic performance of a non-through-core concrete between concrete-filled steel tubular columns and reinforced concrete beams. Thin-Walled Struct. 2017, 110, 14–26. [Google Scholar] [CrossRef]
- Peng, Z.; Dai, S.-B.; Pi, Y.-L.; Li, D.; Zhang, Y.-C.; Huang, J. Seismic behaviour of innovative ring-bar reinforced connections composed of T-shaped CFST columns and RC beams with slabs. Thin-Walled Struct. 2018, 127, 1–16. [Google Scholar] [CrossRef]
- Wang, Q.; Ma, H.; Li, Z.; Tang, Z.; Chen, H.; Li, P. Shear Resistance Capacity of Interface of Plate-Studs Connection between CFST Column and RC Beam. Math. Probl. Eng. 2017, 2017, 9456768. [Google Scholar] [CrossRef]
- Wang, Y.H.; Tang, W.F. Test on discontinuous connection of concrete filled tube in middle column joints. Build. Struct. 2004, 34, 60–63. [Google Scholar] [CrossRef]
- Wang, Y.H.; Lu, X.J.; Zhou, X.H.; Guo, Z.H.; Fu, M. Experimental study on semi-connected corner joint with core steel tube in concrete filled steel tubular. J. Build. Struct. 2008, 29, 51–57. [Google Scholar] [CrossRef]
- Fu, P.B.; Mao, Y.P. Bearing capacity of joint with core steel tube in concrete filled steel tubular under eccentrically load. J. Chang’an Univ. 2006, 61–64. [Google Scholar] [CrossRef]
- Lu, X.J.; Wang, Y.H.; Fu, M.; Guo, Z.H. Nonlinear finite element analysis of semi-connected corner joint with core steel tube in concrete filled steel tube. Build. Struct. 2008, 3, 38–41. [Google Scholar] [CrossRef]
- Gao, L. Finite Element Analysis of Seismic Behavior of Mid-Point Models of CFST with Core Steel Tube. Master’s Dissertation, Chang’an University, Xi’an, China, 2009. [Google Scholar]
- Yu, F.; Bu, S.; Li, D.; Feng, C.; Fang, Y. Experimental investigation and theoretical study on bearing capacity of strong PVC-FRP confined concrete column-weak joint strengthened with core steel tube under axial loading. Constr. Build. Mater. 2020, 271, 121880. [Google Scholar] [CrossRef]
- Yu, F.; Feng, C.; Fang, Y.; Liu, Q.; Hu, Y.; Bu, S. Experimental study on low-strength concrete joint core strengthened with steel meshes for connecting PFCC column and RC beam. Adv. Struct. Eng. 2020, 24, 797–814. [Google Scholar] [CrossRef]
- Yu, F.; Guan, Y.; Liu, Q.; Wang, S.; Fang, Y. Compressive behavior of joint core confined with core steel tube for connection of polyvinyl chloride-carbon fiber reinforced polymer–confined concrete column and reinforced concrete beam. Adv. Struct. Eng. 2020, 23, 2570–2586. [Google Scholar] [CrossRef]
- Yu, F.; Guan, Y.; Fang, Y.; Li, D. Experimental and Numerical Investigations of PVC-FRP Confined Concrete Column-RC Beam Joint Reinforced with Core Steel Tube under Axial Load. KSCE J. Civ. Eng. 2021, 25, 4671–4685. [Google Scholar] [CrossRef]
- Nguyen, T.; Ragueneau, F.; Bahon, D.; Ruaux, N. Macroscopic modeling of reinforced concrete joints: Application to thermal break elements subject to earthquake loadings. Eng. Struct. 2014, 79, 131–141. [Google Scholar] [CrossRef]
- Beskhyroun, S.; Navabian, N.; Wotherspoon, L.; Ma, Q. Dynamic behaviour of a 13-story reinforced concrete building under ambient vibration, forced vibration, and earthquake excitation. J. Build. Eng. 2019, 28, 101066. [Google Scholar] [CrossRef]
- GB/T50081-2002; Standard for Test Method of Mechanical Properties on Ordinary the Concrete Strength of the Concrete. National Standards of People’s Republic of China: Beijing, China, 2002.
- GB/T228.1-2010; Metallic Materials—Tensile Testing—Part 1: Method of Test at Room Temperature. National Standards of People’s Republic of China: Beijing, China, 2010.
- GB/T8804.1-2003; Thermoplastic Pipes—Determination of Tensile Properties. National Standards of People’s Republic of China: Beijing, China, 2003.
- GB/T3354-2014; Test Method for Tensile Properties of Orientational Fiber Reinforced Polymer Matrix Materials. National Standards of People’s Republic of China: Beijing, China, 2014.
- JGJ/T101-2015; Specification for Seismic Test of Building. Architecture and Industry Press of China: Beijing, China, 2015.
- Tang, J.R. Seismic Resistance of Reinforced Concrete Frame Joints; Southeast University Press: Nanjing, China, 1989. [Google Scholar]
- Song, Z.; Yu, F.; Zhang, N.; Fang, Y. A model for predicting load-displacement hysteretic behavior of PVC-CFRP confined concrete column-ring beam interior joints under low cyclic loading. Compos. Struct. 2021, 265, 113769. [Google Scholar] [CrossRef]
- Yurdakul, O.; Avsar, O. Structural repairing of damaged reinforced concrete beam-column assemblies with CFRPs. Struct. Eng. Mech. 2015, 54, 521–543. [Google Scholar] [CrossRef]
- Ostapiuk, M.; Bieniaś, J. Fracture Analysis and Shear Strength of Aluminum/CFRP and GFRP Adhesive Joint in Fiber Metal Laminates. Materials 2019, 13, 7. [Google Scholar] [CrossRef]
- Golias, E.; Zapris, A.; Kytinou, V.; Kalogeropoulos, G.; Chalioris, C.; Karayannis, C. Effectiveness of the Novel Rehabilitation Method of Seismically Damaged RC Joints Using C-FRP Ropes and Comparison with Widely Applied Method Using C-FRP Sheets—Experimental Investigation. Sustainability 2021, 13, 6454. [Google Scholar] [CrossRef]
- Golias, E.; Zapris, A.G.; Kytinou, V.K.; Osman, M.; Koumtzis, M.; Siapera, D.; Chalioris, C.E.; Karayannis, C.G. Application of X-Shaped CFRP Ropes for Structural Upgrading of Reinforced Concrete Beam–Column Joints under Cyclic Loading–Experimental Study. Fibers 2021, 9, 42. [Google Scholar] [CrossRef]
- Qureshi, J. A Review of Fibre Reinforced Polymer Structures. Fibers 2022, 10, 27. [Google Scholar] [CrossRef]
- Yu, F.; Yin, W.; Cheng, A.; Vu, Q.-V.; Wang, S.; Kong, Z. Seismic behavior of PVC-CFRP confined reinforced concrete columns: An experimental study. Structures 2021, 32, 313–328. [Google Scholar] [CrossRef]
- Han, L.H. Concrete Filled Steel Tubular Structures; Science Press: Beijing, China, 2000. [Google Scholar]
- Mander, J.B.; Priestley, M.J.N.; Park, R. Theoretical Stress-Strain Model for Confined Concrete. J. Struct. Eng. 1988, 114, 1804–1826. [Google Scholar] [CrossRef]
- Filippou, F.C.; Popov, E.P.; Bertero, V.V. Effects of Bond Deterioration on Hysteretic Behavior of Reinforced Concrete Joints; Report EERC 83-19; Earthquake Engineering Research Center, University of California: Berkeley, CA, USA, 1983. [Google Scholar]
- Mitra, N.; Lowes, L.N. Evaluation, Calibration, and Verification of a Reinforced Concrete Beam–Column Joint Model. J. Struct. Eng. 2007, 133, 105–120. [Google Scholar] [CrossRef]
- Mitra, N. An Analytical Study of Reinforced Concrete Beam-Column Joint Behavior under Seismic Loading. Doctoral Dissertation, University of Washington, Washington, DC, USA, 2007. [Google Scholar]
- Yu, F. Experimental Study and Theoretical Analysis on Mechanical Behavior of PVC-FRP Confined Concrete Column. Doctoral Dissertation, Xi’an University of Architecture, Xi’an, China, 2007. [Google Scholar]
Publisher’s Note: MDPI stays neutral with regard to jurisdictional claims in published maps and institutional affiliations. |
© 2022 by the authors. Licensee MDPI, Basel, Switzerland. This article is an open access article distributed under the terms and conditions of the Creative Commons Attribution (CC BY) license (https://creativecommons.org/licenses/by/4.0/).