Article

Synthesis of Polyhydroxyurethanes—Experimental Verification of the Box–Behnken Optimization Model

by
Michał J. Zalewski
1,
Mariusz Ł. Mamiński
2 and
Paweł G. Parzuchowski
1,*
1
Faculty of Chemistry, Warsaw University of Technology, 3 Noakowskiego St., 00-664 Warsaw, Poland
2
Institute of Wood Sciences and Furniture, Warsaw University of Life Sciences–WULS, 159 Nowoursynowska St., 02-776 Warsaw, Poland
*
Author to whom correspondence should be addressed.
Polymers 2022, 14(21), 4510; https://doi.org/10.3390/polym14214510
Submission received: 30 September 2022 / Revised: 20 October 2022 / Accepted: 21 October 2022 / Published: 25 October 2022

Abstract

:
Polyurethanes are one of the most important groups of polymers for numerous sectors of industry. Their production involves using dangerous components (diisocyanates), thus, in the search for safer synthetic routes, alternative methods yielding non-isocyanate polyurethanes (NIPU) have been investigated. In this study, the synthesis of polyhydroxyurethane from cyclic carbonates was performed. A three-factor, three-level Box–Behnken experimental design was constructed and the reaction time, temperature and reagents’ molar ratio were the independent variables. The built model revealed that the viscosity was influenced by all three independent factors, while the mechanical properties and glass transition temperature of the PHUs were affected by the reagents’ ratios. An experimental verification of the model proved its accuracy as the mechanical strength and glass transition temperature deviated from the modeled values, by 15% and 7%, respectively.

Graphical Abstract

1. Introduction

Polyurethanes are one of the most important groups of polymers in terms of global production and number of possible applications. The conventional synthesis of PUs uses a step growth polyaddition reaction of polyols with diisocyanates. One of these components, the isocyanates (mainly toluene diisocyanate—TDI and methanediphenyl diisocyanate—MDI) are harmful, carcinogenic and have mutagenic compounds. Moreover, their production involves extremely toxic gas—phosgene, which makes the process hazardous to the environment and to human health [1]. Regardless of those drawbacks, polyurethane materials are widely used in many industrial applications such as the automotive industry, the construction industry, thermal and sound insulation, thermoplastics, textiles, adhesives and coatings [2]. On the other hand, keeping in mind the principles of green chemistry that recommend substitution of harmful raw materials for non-harmful ones wherever technically possible [3], alternative methods of non-isocyanate polyurethanes (NIPU) synthesis via isocyanate-free routes have been described in the literature. Synthesis of NIPU can employ: (1) “AB-type” precursors bearing both hydroxyl and reactive functional groups in the same molecule [4], (2) reaction of alkylene bis(chloroformate)s with diamines [5]; (3) reaction of alkylene bis(phenyl carbonate) with diamine [6].
Additionally, more recent approaches to NIPU are based on (1) thiol-ene self-photopolymerization [7], (2) synthesis from α, ω-aminoalcohols [8], (3) self-polycondensation reaction of hydroxyl-acyl azide moiety [9], or (4) polycondensation of respective dicarbamates with diols [10]. A consecutive search for the greener ways to NIPU provided the polycondensation of bis(methyl dicarbamate)s with diols [11,12] and a specially useful and environmentally benign approach—copolymerization of cyclic carbonates with amine-bearing compounds [13].
What is interesting is that reactions of amines and bis(cyclic carbonate)s can also lead to polyhydroxyurethanes (PHU)—a new class of NIPU that has been paid much attention in recent years due to its environmental benignancy and excellent mechanical properties resulting from the presence of intra- and inter-molecular hydrogen bonding of hydroxyl and carbonyl groups in the polymer structure [14].
Although the industrial application of PHU greatly covers those of the traditional polyurethanes, their synthesis strategy is more convenient, safer and atom-economic. These are (1) the polyaddition of poly(cyclic carbonate)s with polyamines [15], and (2) polyaddition of glycerol-derived carbonates with amines [16,17,18], to name just a few.
A comprehensive review of the synthesis and application of non-isocyanate polyurethanes (NIPU) can be found elsewhere [19].
Cramail et al. analyzed the effect of substitution degree in amine and cyclic carbonates and the temperature on the reaction rate. They found that the degree of substitution of cyclic carbonate lowered the reaction rate towards the amine as well as revealed that internal cyclic carbonate reaction rates increased when the temperature increased [20], however, excessive temperature increase favored substituted urea formation resulting from the subsequent attack of another amine molecule [21]. Webster and Crain found that initial the concentration of amine significantly affected the reaction rate [22].
Hence, the efficient polyaddition and molar mass of the product are determined by the stoichiometric ratio of reagents, the temperature and the time of reaction. The Box–Behnken design is often used in the chemistry of polyurethanes [23,24,25,26].
The aim of this study was the optimization of polyhydroxyurethane synthesis under various conditions according to the three-factor, three-level Box–Behnken experimental plan. The design comprised 15 experimental runs that reflect points positioned at the midpoint of edges of the multi-dimensional cube and the replicated center point in it [27,28].
The variables were reaction time, temperature and the molar ratio of bis(cyclic carbonate)s. Based on the physiochemical properties of the obtained polymers, a mathematical model was made. Then the model was empirically verified.

2. Materials and Methods

The 1,6-hexamethylenediamine (HMDA) (99%) was purchased from Sigma-Aldrich (Poznań, Poland) and used as received. Syntheses of bis(glycerol carbonate) (BGC) and bisphenol A dicarbonate (DCBPA) were performed according to the previously described procedures [29,30].

2.1. PHUs Synthesis

Reagents in amounts as indicated in Table 1 and Table 2 were placed in a 250-mL three-necked flask equipped with a mechanical stirrer, a reflux condenser, a thermometer and an argon inlet. Reactions were performed under argon atmosphere. The temperature and time are shown in Table 3. The obtained viscous liquid was next transferred to a PE vial and cooled down to solidify at ambient temperature.

2.2. Instrumentation

FTIR (Fourier transform infrared) spectra were recorded on a Nicolet iS5 Mid Infrared FT-IR Spectrometer equipped with iD7 ATR optical base (Thermo Scientific®, Waltham, MA, USA). 1H NMR spectra were recorded on a Varian VXR 400 MHz (Palo Alto, Santa Clara, CA, USA) using tetramethyl silane as an internal standard. Samples of 85 mg were dissolved in deuterated DMSO-d6. DSC (Differential scanning calorimetry) measurements were carried out using a Q200 DSC (TA Instruments, New Castle, DE, USA). The heating rate was 10 °C min−1. The measurements were performed on 20 mg samples in closed aluminum trays in the constant flow of argon 10 mL min−1. Viscosity was measured on a Kinexus rheometer (Netzsch, Selb, Germany) with (8-mm diameter) plate–plate geometry at 140 °C and 1/min speed. Mechanical performance of the PHUs was measured on an INSTRON 5566 (Norwood, MA, USA).

2.3. Design of Experiments

Three independent factors were coded on three levels: −1 (low level), 0 (standard level, arithmetic mean of −1 and +1), and +1 (high level). The Box–Behnken design avoids experimental runs with all three factors set at their extremes. Such an approach allows for the determination of polynomial quadratic equations. A three-level, three-factor Box–Behnken design was established by the Design Expert® software (version 6.0.10. Stat-Ease, Minneapolis, MN, USA).
The 15 experiments constructed and performed are shown in Table 1. The three independent variables applied to investigate the responses were: reaction time, temperature and the molar ratio of two bis(cyclic carbonate)s, while viscosity (η), glass transition temperature (Tg) and shear strength (Rt) were the responses. The responses obtained from 15 experimental runs were fed back into Design Expert software to compute the polynomial equations for the interactions. Table 1, Table 2 and Table 3, present coded levels, actual levels for the applied factors, and experimental design matrix, respectively.

2.4. Mechanical Performance of PHUs

Mechanical strength of the obtained PHUs was tested as lap shear strength of the bondline in pinewood specimens of dimensions 100 mm × 20 mm ×1.5 mm (Figure 1). A 0.5-mm thick foil of a PHU was applied between two 1.5-mm thick veneers, so that a lap of the dimensions 20 mm × 12 mm was formed. Next, specimens were bonded in a hot press at 150 °C for 30 s under 0.8 MPa pressure, then immediately transferred to a cold press and kept for 5 min under 0.8 MPa pressure to cool down and set the bondline. Bonded specimens were conditioned at normal conditions (20 ± 2 °C and 65 ± 5% relative humidity) for 24 h before testing. Ten specimens were tested in each series. Shear speed was 20 mm/min.
Shear strength (Rt) was calculated from the Equation (1):
R t = F m a x S
where: Fmax is the maximum force in Newtons and S is lap area in mm2.

3. Results

3.1. Box–Behnken Design

Box–Behnken design is a rotatable plan which means that the prediction variance depends only on the distance of the design point from the center of the design [31]. The greater the absolute value of the coded variable, the greater the variance of the calculated value. The variance is calculated from the last three experiments nos. 13, 14, and 15 in which the independent variables are kept constant at level 0, so the differences in the results of these experiments are not variable. Hence, the difference in the results of these experiments allows the variance to be calculated.
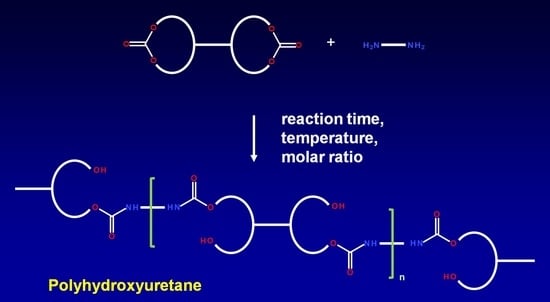
The low level for the reaction time was 60 min, because our initial experiments revealed that such time was sufficient for cyclic carbonates to converse completely, i.e., ~1800 cm−1 band disappeared on the FTIR spectrum. The high level was 120 min as a longer reaction time may cause allophanates formation. The standard level (0) was 90 min which is an arithmetic mean of high- and low-level values (Equation (2)).
x = 120 + 60 2 = 90   min
The low level for the reaction temperature was 120 °C due to the melting point of DCBPA [30]. The high level was 160 °C to avoid favorable allophanate formation at higher temperatures which might reduce the properties of a PHU. The standard level (0) was an arithmetic mean of high and low levels (Equation (3)).
x = 160 + 120 2 = 140   ° C
All experimental runs were performed at constant 1,6-hexamethylenediamine content 0.10 moles, while the variable was BGC/DCBPA carbonates molar ratio. The high level (+1) was coded for 0.10 moles BGC, low level (−1) for 0.10 moles DCBPA and the standard level (0) was coded for 0.05 moles BGC: 0.05 moles DCBPA mixture.

3.2. PHUs Characterization

All the obtained polymers were solids. It is apparent that the carbonates molar ratio (factor 3) affected the PHUs macromolecule structures, and subsequently, their physicochemical properties were different. The reagents’ structures are shown in Figure 2. Actual structures of the obtained PHUs were elucidated by 1H NMR in Figure 3, Figure 4 and Figure 5.
A representative 1H NMR spectrum and macromolecular structure of the PHUs obtained in the runs 1–4 and 13–15, where carbonate mixture composition was kept constant, are presented in Figure 3. The polyurethanes synthesized in the run nos. 5, 6, 9 and 10 at a constant amount of 0.10 moles BGC. 1H NMR spectrum and the molecular structure were presented in Figure 4. In Figure 5, the structure and 1H NMR spectrum of PHU from experiment run nos. 7, 8, 11 and 12 (0.10 moles DCBPA) were shown. All the synthesized PHUs were transparent-to-opaque yellow-green solids.

3.3. Mechanical Performance

The mechanical performance of the PHUs was investigated on the basis of the bonding strength of bondlines in solid wood. Lap shear strengths are presented in Table 4. The variations in the observed strengths result from variations in failure modes: (i) adhesive, (ii) cohesive in adhesive layer, (iii) cohesive in wood or (iv) mixed [2]. Respective failure modes appeared in all the series, regardless of the PHU synthesis conditions (Figure 6). Thus, the determined strengths are averaged, but the values are still in the range typical for thermoplastic adhesives: poly(vinyl acetate) 0.5–3.7 MPa [32], poly(oxetane)s 0.4–1.3 MPa [33] or poly(lactide)-poly(caprolactone)-based and EVA (0.6–1.5 MPa) [34] or HDPE 1.6–2.9 MPa [35]. The computed variation coefficients for the respective series remain at the levels comparable to those found in the literature for hot-melt adhesives (i.e., 20–30%) [36].

3.4. Thermal Properties

In order to determine the synthesis conditions on the thermal properties of the PHUs, the polymers were subjected to DSC analysis. Measurements were performed in the range −50 to 150 °C. Glass transition temperatures (Tgs) are presented in Table 5. A DSC curve recorded for the PHU synthesized in experiment no. 11 is shown in Figure 7, while Tgs of all the obtained PHUs are combined in Figure 8. In the applied temperature range only glass transition occurred in all cases, so it proves that the PHUs are amorphous.
The data in Table 5 and Figure 8 indicate three types of the polymers resulting from the reagents’ compositions. The first group are thermoplastics synthesized in run nos. 5 (120 °C, 90 min), 6 (160 °C, 90 min), 9 (140 °C, 60 min), 10 (140 °C, 120 min), where DCBPA was used, which exhibit Tgs in the range between 0 °C and 10 °C. What is worth noting is that both the temperature increases and prolonged reaction time resulted in just slight increase in the Tg.
The experiment run nos. 1 (120 °C, 60 min), 2 (160 °C, 60 min), 3 (120 °C, 120 min), 4 (160 °C, 120 min), 13, 14 and 15 (140 °C, 90 min) with equimolar mixture of BGC/DCBPA yielded PHUs of Tgs between 40 °C and 50 °C. The effect of reaction temperature increase resulted in a slight decrease in the Tg of the product.
The highest Tgs (60–70 °C) exhibited the polymers obtained in the run nos. 7 (120 °C, 90 min), 8 (160 °C, 90 min), 11 (140 °C, 60 min) and 12 (140 °C, 120 min). Apparently, the significant factor affecting Tg was the temperature, while reaction time was insignificant.
As the lowest Tgs were obtained for purely aliphatic PHUs, the above results are coherent with the commonly agreed knowledge on the influence of polymer structure on its thermal properties.

3.5. Viscosity

Due to the presence of hydroxyl groups in macromolecules, PHUs easily absorb moisture from the air, thus, prior to rheological measurements samples were dried at 50 °C in vacuum. Data collected in Table 5 shows that PHUs from run nos. 7, 8, 11 and 12 exhibited outstandingly high viscosities. A common trait for those polymers is the composition, i.e., the presence of aromatic DCBPA, which apparently contributes to inter- and intra-molecular interactions (i.e., π–π stacking), and brings hard and rigid segments, that subsequently increase the viscosity [37,38]. The observation is also in agreement with studies on the influence of aromatic moieties on the polymer viscosity. Mamiński et al. showed that the viscosity of a bisphenol A-cored polyglycerol with 2, 5 and 10 glycerol carbonate residues were, respectively, 430 Pa·s, 55 Pa·s and 18 Pa·s at 23 °C, which demonstrates that aromatic–aromatic interactions weaken when hindered [39]. On the other hand, the PHUs of purely aliphatic backbone or synthesized from equimolar mixture of BGC/CER exhibited 10–50 times lower viscosity. The phenomenon can be explained by either a plasticizing effect of BGC or remote positions of aromatic rings. On the other hand, the PHUs of purely aliphatic backbone or synthesized from an equimolar mixture of BGC/DCBPA exhibited 10–50 times lower viscosity. The phenomenon can be explained by either a plasticizing effect of BGC and/or remote positions of aromatic rings in the molecule.

3.6. Mathematical Relations between Variables

This work is focused on the analysis of how reaction time, temperature and reagents’ molar ratios affect the properties of products, i.e., PHUs. The Box–Behnken design provides a mathematical relation between the variables in the form of polynomial a quadratic equation (Equation (4)).
The polynomial equation for all the individual responses in terms of coded independent factors is as follows:
y = b 0 + i = 1 k b i x i + i = 1 k j = 1 k b i j x i x j + e i
where: y is the computed response of the system, b is the coefficient of the equation, b0 is the free term, x is the independent variable, k is the number of the independent variables, and e is the constant.
The free term b0 is computed from Equation (5) as the arithmetic mean of values of a given trait, while Equation (6) describes determination of the coefficients in monomials bearing one independent variable in power of one. Equation (7) is used in determination of the coefficients in monomials bearing one independent variable in power of two, and Equation (8) concerns determination of the coefficients in monomials with the product of two independent variables in power of one. The approach yields the interactions between variables.
b 0 = y ¯ 0
b i = A u = 1 N x i u y u i
b i i = B u = 1 N x i u 2 y u + C 1 j = 1 k u = 1 N x j u 2 y u y ¯ 0 w
b i j = D 1 u = 1 N x i u x j u y u
where y ¯ 0 is the arithmetic mean of y results of the population when coded factors are equal 0; N is the experiment number (population); A , B , C 1 , D 1 , w is the constants as shown in Table 6.
The Box–Behnken design allows computing the variations for the determined correlation coefficients. Equation (9) yields the variation for the free term in Equation (5), Equation (10) yields coefficients of the monomials in Equation (6), while Equations (11) and (12) yield the coefficients determined in Equations (7) and (8), respectively.
s b 0 2 = s r e p 2 n 0
s b i 2 = A s r e p 2
s b i i 2 = B + 1 w 2 n 0 s r e p 2
s b i j 2 = D 1 s r e p 2
where: s r e p 2 is the variation determined for y results of the population when the coded factors are equal 0, n 0 is the number of experiments when the coded factors are equal 0.
Next, the computed correlation coefficients and their variations were the subject of the null hypothesis (H0) test (Equation (13)) against the alternative hypothesis (Ha) (Equation (14)). For each of the coefficients t c a l c was computed (Equation (15)) and compared to t c r i t (Equation (16)). If t c r i t < t c a l c , then the null hypothesis was rejected, while bi ≠ 0 condition was accepted at a 95% confidence level. Hence, the variable bound to this coefficient affects a given trait. However, if t c r i t > t c a l c , then the null hypothesis must not be rejected and bi = 0. Then, it can be concluded at a 95% confidence level that the variable bound to this coefficient has no influence on a given trait.
H 0 : b i = 0
H a : b i 0
t c a l c = b i s b i
t c r i t 0.05 ; 2
The abovementioned approach was applied to determine the effect of the independent variables (reaction time, temperature and reagents’ molar ratio) on the properties of PHUs such as viscosity, glass transition temperature and mechanical performance.
The tcrit was calculated using MS Excel T.INV function bounding probability (0.05) and degree of freedom (2), then t c r i t 0.05 ; 2 = 4.303 . The coefficients in polynomial describing Tg’s and their significance are presented in Table 7. The data indicate that b0, b3 and b33 only are significant, hence, the carbonate used in synthesis had a significant effect on the Tg of PHUs. The effect of the other variables, i.e., temperature (b1, b11) and time (b2, b22), was not significant. The null hypothesis was also tested for the monomials describing interactions of the variables (b12, b13, b23). Equation (17) describes relations between significant monomials, and Figure 9 shows the plot of the function in the range between −1 and +1.
y = b 0 + b 3 x 3 + b 33 x 3 = 45.17 + 31.62 x 3 9.78 x 3 2
The calculated coefficients of the polynomial describing the effect on PHUs mechanical properties are presented in Table 8. It is clear that only b0 and b3 had significant effect, i.e., composition of carbonate reagents (b3). The variables temperature (b1, b11) and time (b2, b22) were found to be insignificant. The null hypothesis was tested for the monomials describing interactions between the variables (b12, b13, b23). Equation (18) defines relations between significant monomials, and Figure 10 shows the plot of the function in the range between −1 and +1.
y = b 0 + b 3 x 3 = 2.91 + 0.81 x 3
As the data in Table 9 indicate, the only insignificant monomial was found for the interaction of time and temperature (b12). For the other monomials the alternative hypothesis (Ha) was accepted. The strongest effect on the viscosity was observed for the carbonate(s) used in the syntheses as the respective coefficients are significantly higher. Equation (19 defines relations between significant monomials, and Figure 11 shows the plot of the function in the range between −1 and +1.
Each point was described by 4 variables. The independent variables were ascribed to X, Y and Z axes, while viscosity was illustrated by the color. It is clear that the aromatic DCBPA (coded variable +1) yielded the PHUs of viscosities nearly two orders of magnitude higher when compared to other experiment runs. Additionally, coded variables at levels 0 and −1 result in viscosities differencing by decimals of order of magnitude. In such cases, a quadratic polynomial has an insufficiently flexible function to accurately model the existing relations.
y = b 0 + b 1 x 1 + b 2 x 2 + b 3 x 3 + b 13 x 1 x 3 + b 23 x 2 x 3 + b 11 x 1 2 + b 22 x 2 2 + b 33 x 3 2 = 45.52 78.67 x 1 + 43.32 x 2 + 457.8 x 3 172.98 x 1 x 3 + 96.17 x 2 x 3 114.82 x 1 2 + 114.2 x 2 2 + 433.29 x 3 2
In order to verify the accuracy of the model, synthesis under the optimized conditions was performed. Namely, temperature 120 °C, reaction time 78 min, and carbonate mixture composition: 0.06 moles DCBPA, 0.40 moles BGC and 0.10 moles HMDA. The true properties of the resultant PHU are compared with the modeled ones in Table 10.
As far as the shear strength and the Tg are concerned, the values predicted by the model provided satisfactory coherence with the experiment. Lesser accordance was found for the viscosity. The gap might have been caused by a limited applicability of a quadratic polynomial to that specific interaction. One of the possible explanations is that the viscosity can be affected by moisture absorption [40].

4. Conclusions

A Box–Behnken optimization model was developed for the synthesis of polyhydroxyurethanes from 1,6-hexamethylenediamine, bis(glycerol carbonate) and bisphenol A dicarbonate. The mathematical model indicated that the viscosity was influenced by all three independent factors (reaction time, temperature and reagents’ molar ratio), while the mechanical properties and glass transition temperature of the PHUs were affected by reagents’ ratios only. This is coherent with the commonly recognized fact that the glass transition temperature is closely associated with the structure of the molecular chain.
The experimental verification of the accuracy of the developed model proved its satisfactory accuracy. Shear strength and glass transition temperature deviated from the computed values, by 15% and 7%, respectively, while the viscosity was the outlier.

Author Contributions

Conceptualization, P.G.P.; methodology, P.G.P. and M.Ł.M.; investigation, M.J.Z.; resources, P.G.P. and M.Ł.M.; data curation, P.G.P.; writing—original draft preparation, P.G.P. and M.Ł.M.; writing—review and editing, P.G.P. and M.Ł.M.; visualization, M.J.Z.; supervision, P.G.P.; funding acquisition, P.G.P. All authors have read and agreed to the published version of the manuscript.

Funding

This research was funded by Warsaw University of Technology (Faculty of Chemistry), grant no. 504/04109/1020/44.000000.

Institutional Review Board Statement

Not applicable.

Informed Consent Statement

Not applicable.

Data Availability Statement

The data presented in this study are available on request from the corresponding author.

Acknowledgments

The authors would like to kindly acknowledge G. Rokicki for many helpful leads.

Conflicts of Interest

The authors declare no conflict of interest.

References

  1. Slocombe, R.J.; Hardy, E.E.; Saunders, J.H.; Jenkins, R.L. Phosgene Derivatives. The Preparation of Isocyanates, Carbamyl Chlorides and Cyanuric Acid. J. Am. Chem. Soc. 1950, 72, 1888–1891. [Google Scholar] [CrossRef]
  2. Randall, D.; Lee, S. (Eds.) The Polyurethanes Book; Wiley & Sons Ltd.: New York, NY, USA, 2002. [Google Scholar]
  3. Anastas, P.T.; Warner, J.C. Green Chemistry: Theory and Practice; Oxford University Press: New York, NY, USA, 1998. [Google Scholar]
  4. More, A.S.; Maisonneuve, L.; Lebarbé, T.; Gadenne, B.; Alfos, C.; Cramail, H. Vegetable-based building-blocks for the synthesis of thermoplastic renewable polyurethanes and polyesters. Eur. J. Lipid Sci. Technol. 2013, 115, 61–75. [Google Scholar] [CrossRef]
  5. Morgan, P.W. Low-Temperature Solution Polycondensation. J. Polym. Sci. Polym. Symp. 1963, 4, 1075–1096. [Google Scholar] [CrossRef]
  6. Zahn, H.; Dominik, M. Lineare Oligomere aus Hexamethylendiisocyanat und Butandiol-(1,4). Makromol. Chem. 1961, 44, 290–311. [Google Scholar] [CrossRef]
  7. Calle, M.; Lligadas, G.; Ronda, J.C.; Galia, M.; Cadiz, V. An efficient nonisocyanate route to polyurethanes via thiol-ene self-addition. J. Polym. Sci. Part A Polym. Chem. 2014, 52, 3017–3025. [Google Scholar] [CrossRef]
  8. Arce, S.M.; Kolender, A.A.; Varela, O. Synthesis of ω-amino- α-phenylcarbonate alkanes and their polymerization to [n]-polyurethanes. Polym. Int. 2010, 59, 1212–1220. [Google Scholar] [CrossRef]
  9. More, A.S.; Gadenne, B.; Alfos, C.; Cramail, H. AB-type polyaddition route to thermoplastic polyurethanes from fatty acid derivatives. Polym. Chem. 2012, 3, 1594–1605. [Google Scholar] [CrossRef]
  10. Nowick, J.S.; Powell, N.A.; Nguyen, T.M.; Noronha, G. An improved method for the synthesis of enantiomerically pure amino acid ester isocyanates. J. Org. Chem. 1992, 57, 7364–7366. [Google Scholar] [CrossRef]
  11. Unverferth, M.; Kreye, O.; Prohammer, A.; Meier, M.A.R. Renewable Non-Isocyanate Based Thermoplastic Polyurethanes via Polycondensation of Dimethyl Carbamate Monomers with Diols. Macromol. Rapid Commun. 2013, 34, 1569–1574. [Google Scholar] [CrossRef]
  12. Rokicki, G.; Piotrowska, A. A new route to polyurethanes from ethylene carbonate, diamines and diols. Polymer 2002, 43, 2927–2935. [Google Scholar] [CrossRef]
  13. Schmitz, f.; Keul, H.; Höcker, H. Alternating copolymers of tetramethylene urea with 2,2-dimethyltrimethylene carbonate and ethylene carbonate; preparation of the corresponding polyurethanes. Macromol. Rapid Commun. 1997, 18, 699–706. [Google Scholar] [CrossRef]
  14. Gomez-Lopez, A.; Panchireddy, S.; Grignard, B.; Calvo, I.; Jerome, C.; Detrembleur, C.; Sardon, H. Poly(hydroxyurethane) Adhesives and Coatings: State-of-the-Art and Future Directions. ACS Sustain. Chem. Eng. 2021, 9, 9541–9562. [Google Scholar] [CrossRef]
  15. Maisonneuve, L.; Lamarzelle, O.; Rix, E.; Grau, E.; Cramail, H. Isocyanate-Free Routes to Polyurethanes and Poly(Hydroxy Urethane)s. Chem. Rev. 2015, 115, 12407–12439. [Google Scholar] [CrossRef] [PubMed] [Green Version]
  16. Nohra, B.; Candy, L.; Blanco, J.F.; Guerin, C.; Raoul, Y.; Mouloungui, Z. From Petrochemical Polyurethanes to Biobased polyhydroxyurethanes. Macromolecules 2013, 46, 3771–3792. [Google Scholar] [CrossRef] [Green Version]
  17. van Velthoven, J.L.J.; Gootjes, L.; van Es, D.S.; Noordover, B.A.J.; Meuldijk, J. Poly(hydroxy urethane)s based on renewable diglycerol dicarbonate. Eur. Polym. J. 2015, 70, 125–135. [Google Scholar] [CrossRef]
  18. Helou, M.; Carpentier, J.-F.; Guillaume, S.M. Poly(carbonate-urethane): An isocyanate-free procedure from α,ω-di(cyclic carbonate) telechelic poly(trimethylene carbonate)s. Green Chem. 2011, 13, 266–271. [Google Scholar] [CrossRef]
  19. Rokicki, G.; Parzuchowski, P.G.; Mazurek, M. Non-isocyanate polyurethanes: Synthesis, properties, and applications. Polym. Adv. Technol. 2015, 26, 707–761. [Google Scholar] [CrossRef]
  20. Boyer, E.; Cloutet, T.; Tassaing, B.; Gadenne, C.; Alfos, C.; Cramail, H. Solubility in CO2 and carbonation studies of epoxidized fatty aciddiesters: Towards novel precursors for polyurethane synthesis. Green Chem. 2010, 12, 2205–2213. [Google Scholar] [CrossRef]
  21. Buergel, T.; Fedtke, M. Epoxy resins with cyclic carbonate structures: Model studies for amine curing. Polym. Bull. 1993, 30, 61–68. [Google Scholar] [CrossRef]
  22. Webster, D.C.; Crain, A.L. Synthesis and applications of cyclic carbonate functional polymers in thermosetting coatings. Prog. Org. Coat. 2000, 40, 275–282. [Google Scholar] [CrossRef]
  23. Walbi, I.A.; Ahmad, M.Z.; Ahmad, J.; Algahtani, M.S.; Alali, A.S.; Alsudir, S.A.; Aodah, A.H.; Albarqi, H.A. Development of a Curcumin-Loaded Lecithin/Chitosan Nanoparticle Utilizing a Box-Behnken Design of Experiment: Formulation Design and Influence of Process Parameters. Polymers 2022, 14, 3758. [Google Scholar] [CrossRef] [PubMed]
  24. Abosabaa, S.A.; El Meshad, A.N.; Arafa, M.G. Chitosan Nanocarrier Entrapping Hydrophilic Drugs as Advanced Polymeric System for Dual Pharmaceutical and Cosmeceutical Application: A Comprehensive Analysis Using Box-Behnken Design. Polymers 2021, 13, 677. [Google Scholar] [CrossRef] [PubMed]
  25. Mushtaq, F.; Huang, Z.; Raheel, S.S.A.; Zhang, Y.; Gao, Y.; Azab, M.; Hussain, S.; Anwar, M.K. Performance Optimization Approach of Polymer Modified Asphalt Mixtures with PET and PE Wastes: A Safety Study for Utilizing Eco-Friendly Circular Economy-Based SDGs Concepts. Polymers 2022, 14, 2493. [Google Scholar] [CrossRef] [PubMed]
  26. Kim, Y.; Kim, M.; Hwang, J.; Im, E.; Moon, G.D. Optimizing PET Glycolysis with an Oyster Shell-Derived Catalyst Using Response Surface Methodology. Polymers 2022, 14, 656. [Google Scholar] [CrossRef] [PubMed]
  27. Ferreira, S.L.C.; Bruns, R.E.; Ferreira, H.S.; Matos, G.D.; David, J.M.; Brandão, G.C.; da Silva, E.G.P.; Portugal, L.A.; Dos Reis, P.S.; Souza, A.S. Box-Behnken design: An alternative for the optimization of analytical methods. Anal. Chim. Acta 2020, 597, 179–186. [Google Scholar] [CrossRef] [PubMed]
  28. Goos, P.; Jones, B. Optimal Design of Experiments a Case Study Approach; Wiley Online Library: New York, NY, USA, 2011. [Google Scholar]
  29. Tryznowski, M.; Świderska, A.; Żołek-Tryznowska, Z.; Gołofit, T.; Parzuchowski, P.G. Facile route to multigram synthesis of environmentally friendly non-isocyanate polyurethanes. Polymer 2015, 80, 228–236. [Google Scholar] [CrossRef]
  30. Parzuchowski, P.G.; Jurczyk-Kowalska, M.; Ryszkowska, J.; Rokicki, G. Epoxy resin modified with soybean oil containing cyclic carbonate groups. J. Appl. Polym. Sci. 2006, 102, 2904–2914. [Google Scholar] [CrossRef]
  31. PennState, Eberly Colleage of Science. Available online: https://online.stat.psu.edu/stat503/lesson/11/11.2/11.2.2 (accessed on 22 September 2022).
  32. Kariž, M.; Tomec, D.K.; Dahle, S.; Kuzman, M.K.; Šernek, M.; Žigon, J. Effect of sanding and plasma treatment of 3D-printed parts on bonding to wood with PVAc adhesive. Polymers 2021, 13, 1211. [Google Scholar] [CrossRef]
  33. Parzuchowski, P.; Mamiński, M.Ł. Poly-(3-ethyl-3-hydroxymethyl)oxetanes—Synthesis and Adhesive Interactions with Polar Substrates. Polymers 2020, 12, 222. [Google Scholar] [CrossRef] [Green Version]
  34. Viljanmaa, M.; Södergård, A.; Törmälä, P. Lactic acid based polymers as hot melt adhesives for packaging applications. Int. J. Adhes. Adhes. 2002, 22, 219–226. [Google Scholar] [CrossRef]
  35. Bekhta, P.; Sedliačik, J. Environmentally-friendly high-density polyethylene-bonded plywood panels. Polymers 2019, 11, 1166. [Google Scholar] [CrossRef] [PubMed] [Green Version]
  36. Mamiński, M.Ł.; Novák, I.; Mičušík, M.; Małolepszy, A.; Toczyłowska-Mamińska, R. Discharge Plasma Treatment as an Efficient Tool for Improved Poly(lactide) Adhesive–Wood Interactions. Materials 2021, 14, 3672. [Google Scholar] [CrossRef] [PubMed]
  37. Kilic, S.; Enick, R.S.; Beckman, E.J. Fluoroacrylate-aromatic acrylate copolymers for viscosity enhancement of carbon dioxide. J. Supercrit. Fluids 2019, 146, 38–46. [Google Scholar] [CrossRef]
  38. Billiau-Loreau, M.; Durand, G.; Tersac, G. Structural effects of diacidic and glycolic moieties on physicochemical properties of aromatic polyesterdiols from glycolysis/esterification of poly(ethylene terephthalate) wastes. Polymer 2002, 43, 21–28. [Google Scholar] [CrossRef]
  39. Mamiński, M.Ł.; Szymański, R.; Parzuchowski, P.; Antczak, A.; Szymona, K. Hyperbranched polyglycerols with bisphenol A core as glycerol-derived components of polyurethane wood adhesives. BioResources 2012, 7, 1440–1451. [Google Scholar] [CrossRef] [Green Version]
  40. Subroto, E.; Sitha, N.; Filianty, F.; Indiarto, R.; Sukri, N. Freeze Moisture Treatment and Ozonation of Adlay Starch (Coix lacryma-jobi): Effect on Functional, Pasting, and Physicochemical Properties. Polymers 2022, 14, 3854. [Google Scholar] [CrossRef]
Figure 1. Lap specimen used in bondline strength measurements.
Polymers 14 04510 g001
Figure 2. Structures of the reagents.
Polymers 14 04510 g002
Figure 3. 1H NMR spectrum of PHU synthesized in experiment run nos. 1–4, 13–15.
Polymers 14 04510 g003
Figure 4. A representative 1H NMR spectrum of PHU obtained in experiment run nos. 5, 6, 9 and 10.
Polymers 14 04510 g004
Figure 5. A representative 1H NMR spectrum of PHU obtained in experiment run nos. 7, 8, 11 and 12.
Polymers 14 04510 g005
Figure 6. Failure modes observed in the tested specimens: (a)—adhesive at the binder/wood interface, (b)—cohesive in wood, (c)—cohesive in PHU layer, and (d)—mixed.
Polymers 14 04510 g006
Figure 7. An exemplary DSC curve of PHU run no. 11.
Polymers 14 04510 g007
Figure 8. Glass transition temperatures (Tg) of the obtained PHUs.
Polymers 14 04510 g008
Figure 9. The plot of the function described by Equation (17).
Polymers 14 04510 g009
Figure 10. The plot of the function described by Equation (18).
Polymers 14 04510 g010
Figure 11. The plot of the function described by Equation (19) (the values below 0 have no physical meaning).
Polymers 14 04510 g011
Table 1. Three-level factorial design in the Box–Behnken experimental plan.
Run No.Factor 1Factor 2Factor 3
1−1−10
2+1−10
3−1+10
4+1+10
5−10−1
6+10−1
7−10+1
8+10+1
90−1−1
100+1−1
110−1+1
120+1+1
13000
14000
15000
Table 2. Applied levels of the factors.
Coded Factor LevelTime [mins]Temperature [°C]Carbonate Molar Ratio
−1601200.10 BGC
0901400.05 BGC: 0.05 DCBPA
+11201600.10 DCBPA
Table 3. Experimental design matrix with actual levels of the factors applied in the experiments.
Run No.Time [mins]Temperature [°C]Carbonate Molar Ratio
1601200.05 BGC: 0.05 DCBPA
2601600.05 BGC: 0.05 DCBPA
31201200.05 BGC: 0.05 DCBPA
41201600.05 BGC: 0.05 DCBPA
5901200.10 BGC
6901600.10 BGC
7901200.10 DCBPA
8901600.10 DCBPA
9601400.10 BGC
101201400.10 BGC
11601400.10 DCBPA
121201400.10 DCBPA
13901400.05 BGC: 0.05 DCBPA
14901400.05 BGC: 0.05 DCBPA
15901400.05 BGC: 0.05 DCBPA
Table 4. Lap shear strengths of PHUs bondlines in pinewood.
PHU No.Shear Strength [MPa]Standard Deviation [MPa]Variation Coefficient [%]
12.310.3816.4
22.270.3816.7
32.500.6927.6
42.720.7226.5
51.430.3222.4
61.690.4325.4
73.320.8726.2
82.670.7829.2
91.010.610.60
101.910.6433.5
112.130.8640.4
123.100.309.7
133.320.8525.6
143.440.7020.3
153.190.6420.0
Table 5. Glass transition temperatures (Tgs) and viscosity at 140 °C for the investigated PHUs.
PHU No.Tg [°C]Viscosity [mPa·s]
145.557
243.346
344.051
440.754
51.74
63.826
760.51020
867.8378
90.015
106.09
1167.5984
1268.61363
1344.253
1445.343
1546.041
Table 6. The values of the constants.
Number of
Variables
ABC1D1w
30.1250.25−0.06250.252
Table 7. The coefficients of polynomials found for Tg and significance.
bisbtcalcSignificance
b045.170.5090.16+
b10.490.311.59
b20.370.311.20
b331.620.31103.06+
b11−1.920.454.24
b220.120.450.26
b33−9.780.4521.65+
b12−0.270.430.61
b131.310.433.01
b23−1.240.432.86
+ significant; − insignificant.
Table 8. The coefficients of polynomials found for mechanical properties of the PHUs.
bisbtcalcSignificance
b02.910.2611.03+
b10.030.160.17
b20.270.161.69
b30.810.164.98+
b11−0.310.241.31
b22−0.220.240.94
b33−0.510.242.13
b12−0.010.230.05
b13−0.540.232.37
b23−0.120.230.54
+ significant; − insignificant.
Table 9. The coefficients of polynomials found for the viscosity of the PHUs.
bisbtcalcSignificance
b045.523.5712.75+
b1−78.672.1935.99+
b243.322.1919.82+
b3457.802.19209.46+
b11−114.823.2235.69+
b22114.203.2235.50+
b33433.293.22134.68+
b12−3.553.091.15
b13−172.983.0955.96+
b2396.173.0931.11+
+ significant; − insignificant.
Table 10. A comparison of actual and modeled properties of an optimized PHU.
Viscosity [mPa·s]Shear Strength [MPa]Tg [°C]
modeled1463.0741.7
experimental642.6244.9
Publisher’s Note: MDPI stays neutral with regard to jurisdictional claims in published maps and institutional affiliations.

