1. Introduction
Polymer or paint coatings have been used for decades to protect metals against corrosion, and this strategy is the most effective. It is best to use water-borne (WB) and solvent-borne (SB) paint coatings to protect metals against corrosion. An essential factor in paint coating protection is the inclusion of specific additives to the base film, such as anti-corrosive pigments and corrosion inhibitors, in the paint coating formulation process. Corrosion-inhibiting components in the paint may be separated into organic and inorganic substances.
Corrosion-inhibiting agents of the adsorption or oxidative type are more often utilized in WB than in SB [
1,
2,
3,
4]. An essential quality of any paint is its ability to adhere to various surfaces [
5,
6]. With the addition of a bifunctional chemical, the adherence of polymer films to metal may be enhanced. One functional half of a molecule interacts with the polymer or paint components (i.e., undergoing polymerization). One is also engaged in building a chemical connection simultaneously with the metal [
5,
7]. Polymers from thermoplastic are used in various coated systems, including powder coatings [
7], automobile anti-corrosive paints, and clean room applications [
8].
For example, polyethylene (homopolymers and copolymers ethylene-propylene), polyamide (PA66), polyester (PET, PBT), and polycarbonate (PC) have been extensively employed. Solvent-borne paints are most often utilized in alkyd resins [
9]. Alkyd and epoxy resin’s corrosion resistance has been improved using conductive polymers such as polyaniline. The passivation of the metal’s surface is proposed as the mechanism for polyaniline’s protective action [
10,
11]. Field and laboratory testing by Iribarren et al. [
12] investigated the corrosion of CS in coastal and urban settings. The availability of an equal period in the laboratory accelerated for field tests proved a satisfactory connection. Three thermoplastic systems (vinyl copolymer, a mix of two acrylic polymers, and the phenoxy resin) were chosen to test corrosion resistance and compare the results with an alkyd polymer modified with polyaniline as a conductive polymer, according to J.I. Iribarren and coworkers [
13]. Developing corrosion-resistant materials is complicated because the polymer composition raises new challenges [
14,
15]. Molecular design components for excellent adhesion, good barrier qualities, and efficient pigment utilization in organic coatings are often at odds, as discussed earlier in this study. There is no theoretical foundation for resolving these competing issues. Corrosion-control product development requires an empirical balance of attributes to be made. Unsurprisingly, the composition specifics important to performance frequently remain confidential or only surface in the patent literature. Corrosion is a natural electrochemical phenomenon that damages materials over time and causes significant financial losses for various companies [
16,
17]. In 2016, NACE calculated the global cost of corrosion to be USD 2.5 trillion (3.4% of global output) [
18,
19]. For example, it has been predicted that using current corrosion prevention techniques can save 15% to 35% [
20]. Figures like these show the importance of corrosion prevention measures in improving metallic structures’ service lives and lowering the need for repairs in industries [
21].
The construction sites for most of the world’s gas pipelines are exposed to typical weather and topographical conditions. Conventional laying methods are still used, and even though the various construction processes have remained unchanged for many years, progressive improvements have been made in their implementation: trenching, pipe welding, track preparation, maintenance, etc. However, improvements have been made throughout their execution, such as better pipe coating operations, welding techniques, and weld inspection procedures (X-ray, ultrasound, etc.). Tube production techniques and steel with rated qualities have undergone extensive development to ensure high product quality and low failure rates.
One environmental factor that affects soil corrosion is the amount of water in the soil. The quantity of water in the soil affects the gas-to-liquid phase ratio. Because of the gas phase, O
2 may be able to spread through the soil. Electrochemical reactions occur in the liquid phase at the steel-to-soil contact. Aside from being an electrolyte in the case of localized corrosion, it may also be used as a catalyst. Soil moisture content and corrosion rate have been the subject of several investigations [
22,
23,
24]. CS corrodes the fastest, as much as 60% of its water-holding capacity [
5]. The relationship between corrosion rate and soil moisture content was examined [
25]. Depending on the saturation level, the research found that sand, silt, and clay had maximum corrosion rates of 50%, 70%, and 80%, respectively. Electrochemical and weight loss data were used to estimate typical study corrosion rates [
26,
27]. For this reason, metal surfaces in the soil come into direct contact with all three phases: solid soil particles, liquid groundwater, and gaseous air (air). Sometimes, the metal/soil contact area and the bulk soil may not be evenly saturated with water.
Additionally, the surface area in contact with water may be rather small in soil with a minimal volume. In any part of the world, aridity is never an issue. According to research [
27,
28], a CS-grade X52’s corrosion resistance in damp soil ranged from 10% to 45%, with X52’s corrosion rate peaking at 20% to 25%. It is passivated with a moisture level of 45%. We are interested in three parts of the GK140 pipeline in Ali MendjeliConstantine (A), Hamadi Krouma Skikda (B), and Bouzaroura Skikda (C). This conclusion is backed by the location in exceptionally hostile settings, leading to significant corrosion, pipe perforation, and serious safety and financial consequences.
2. Materials and Methods
2.1. Materials
In this work, the steel specimens were cut from a X52 steel pipe line with the chemical composition (wt%): C (0.24%), Si (0.45%), Mn (1.4%), P (0.025%), Cu (0.16%), Cr (0.5%), S (0.015%), v (0.10%), (T0.04%), (Nb0.05%), and Fe balance.
2.2. Surface Coating
The samples were prepared as follows.
2.2.1. Sanding
The air supplied by a compressor used for sanding must be free of all traces of oil and water. It must provide a continuous airflow of 7 bar. The use of good-quality sand and the origin and quality of the abrasives shall be set as a minimum as follows: river silica sand washed, dried with sharp edges, and of a size corresponding to the 20 to 40 mesh of the U.S. standards, whose granulometry allows obtaining a roughness of about 25 to 50 micro or iron shot. Before painting, the metallic substances were stripped by blasting with abrasives type AS 2.5, according to the standard ISO 8501-1, up to a degree of roughness (medium G) according to the standards NFEN-ISO 8503-2. The treated surfaces were cleaned immediately before applying the primer.
2.2.2. Coating System
The paint system was deposited on the steel substrate and used for long-term immersion tests under different protection conditions, a commercial epoxy paint. The epoxy paint system is an epoxy coating that hardens at a temperature of 80 °C (
Table S1).
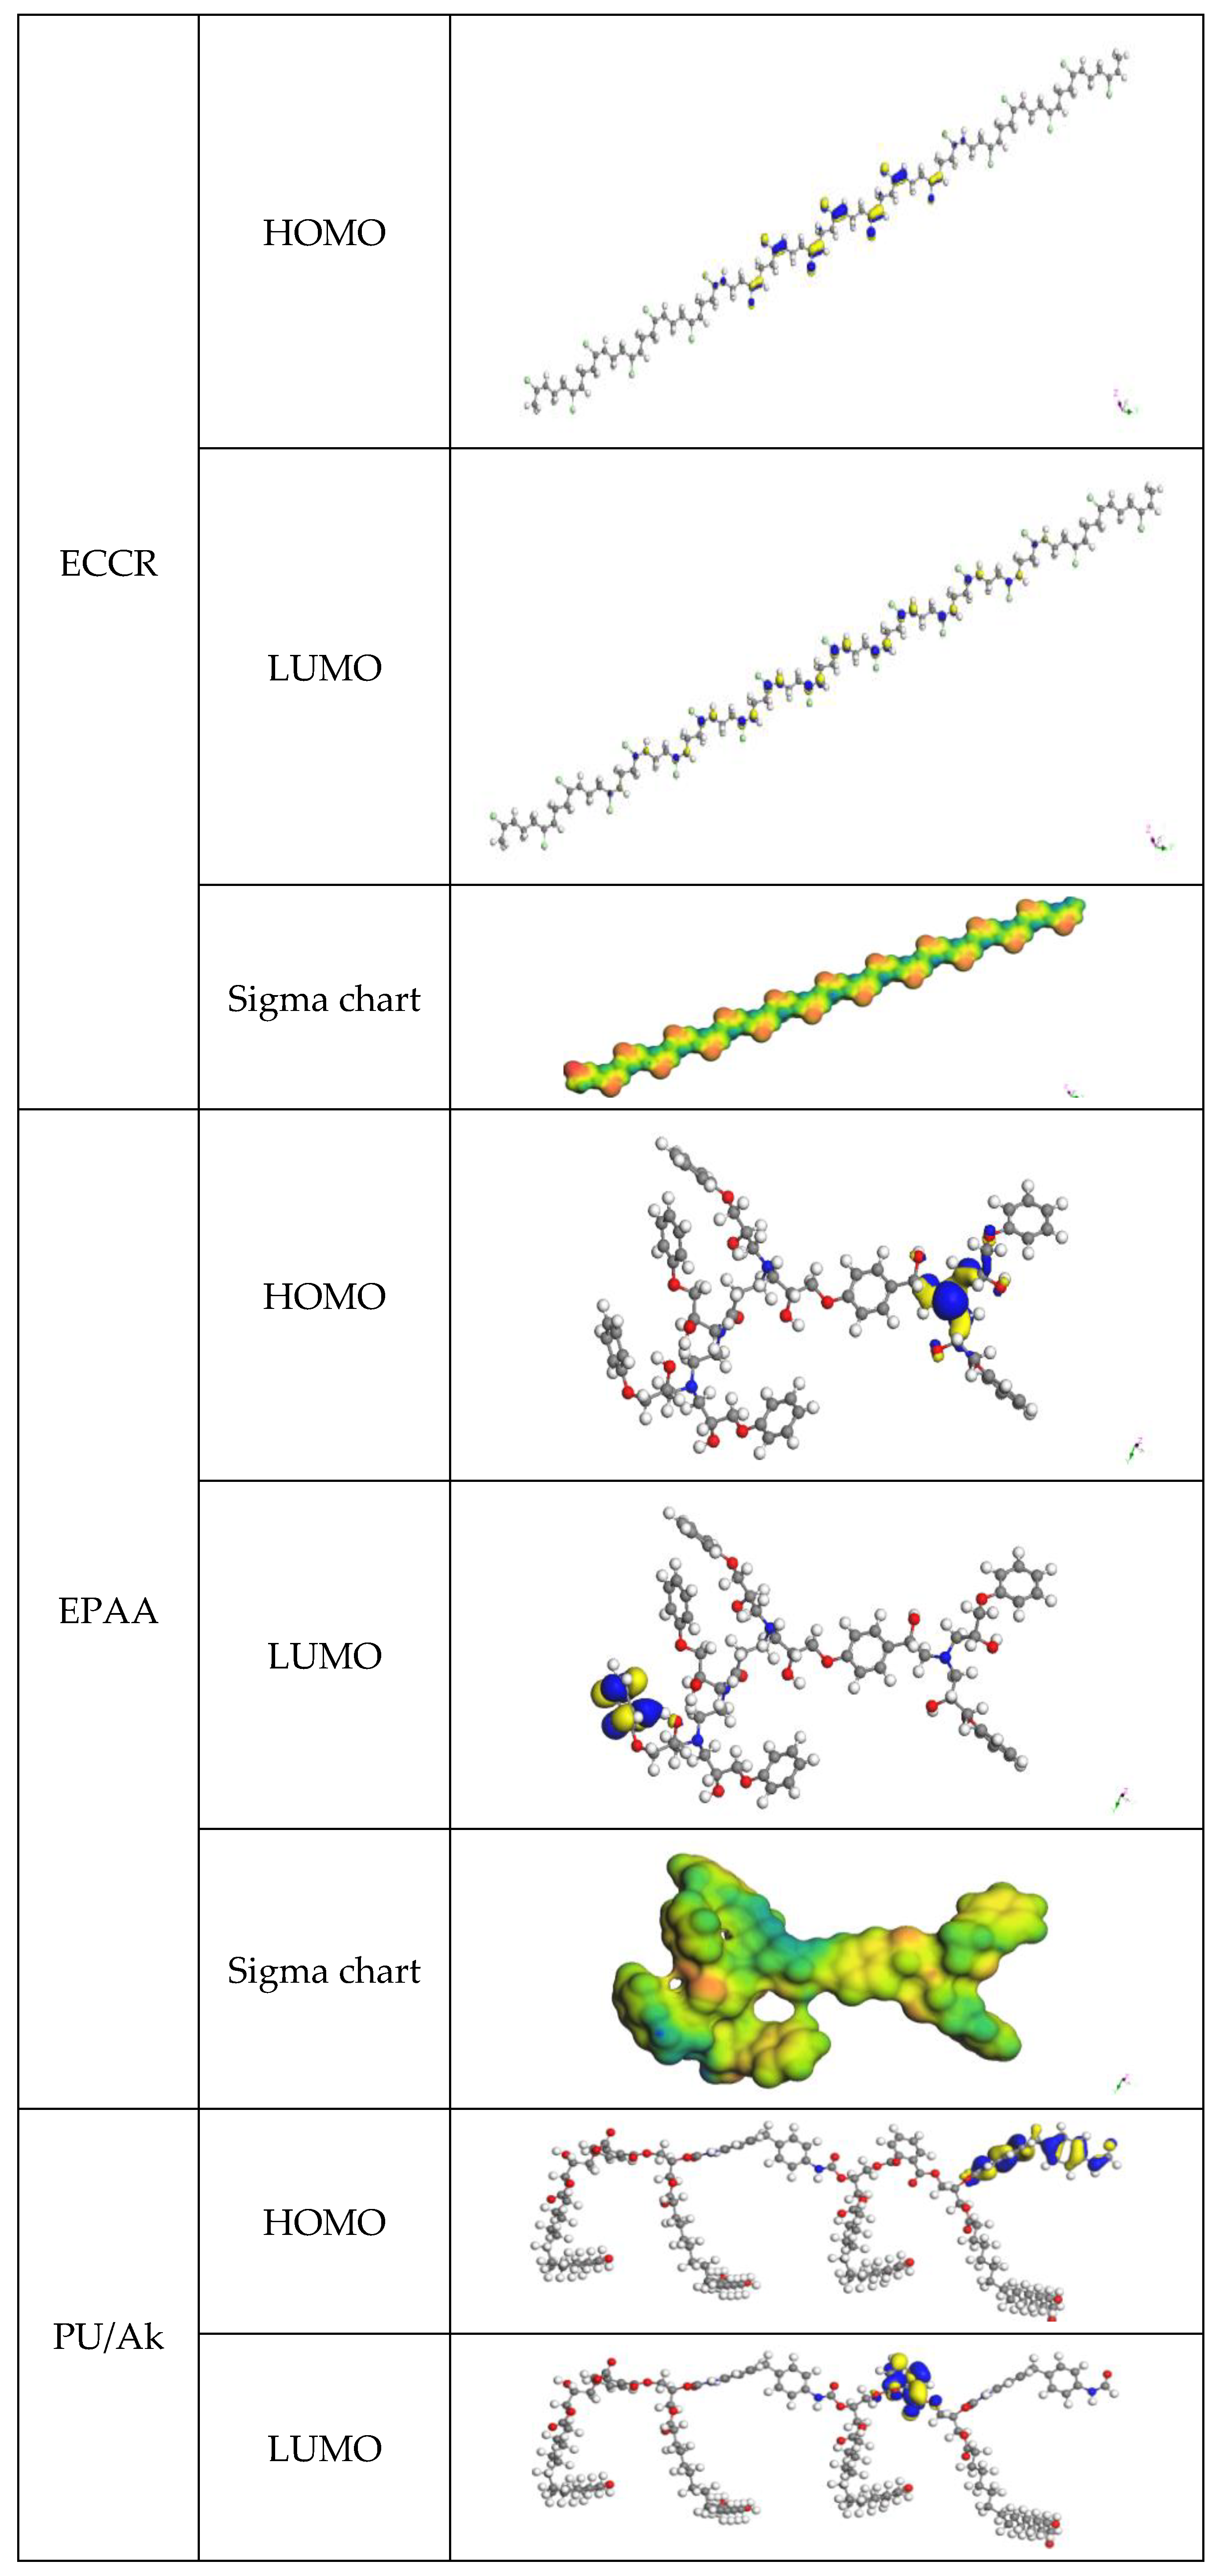
Primer layer (PL): epoxy/chloric chlorinated rubber (ECCR) marine paint, applied as an undercoat (first layer) anticorrosion, rich in zinc powder (
Figure 1). After preparing the steel surface (Sa 2.5 sandblasting), the PL is applied immediately by brush or roller with a thickness of 35 µm.
Intermediate layer (IL): The IL is a white epoxy/polyaminoamide (EPAA), reinforcing the system’s corrosion resistance. After the PL has dried in two 40 µm layers, they are applied by a roller or a pneumatic spray gun. Their primary role is to protect the PL against the access of water, oxygen, and ions. Hence, their name is synonymous with the sealing layer.
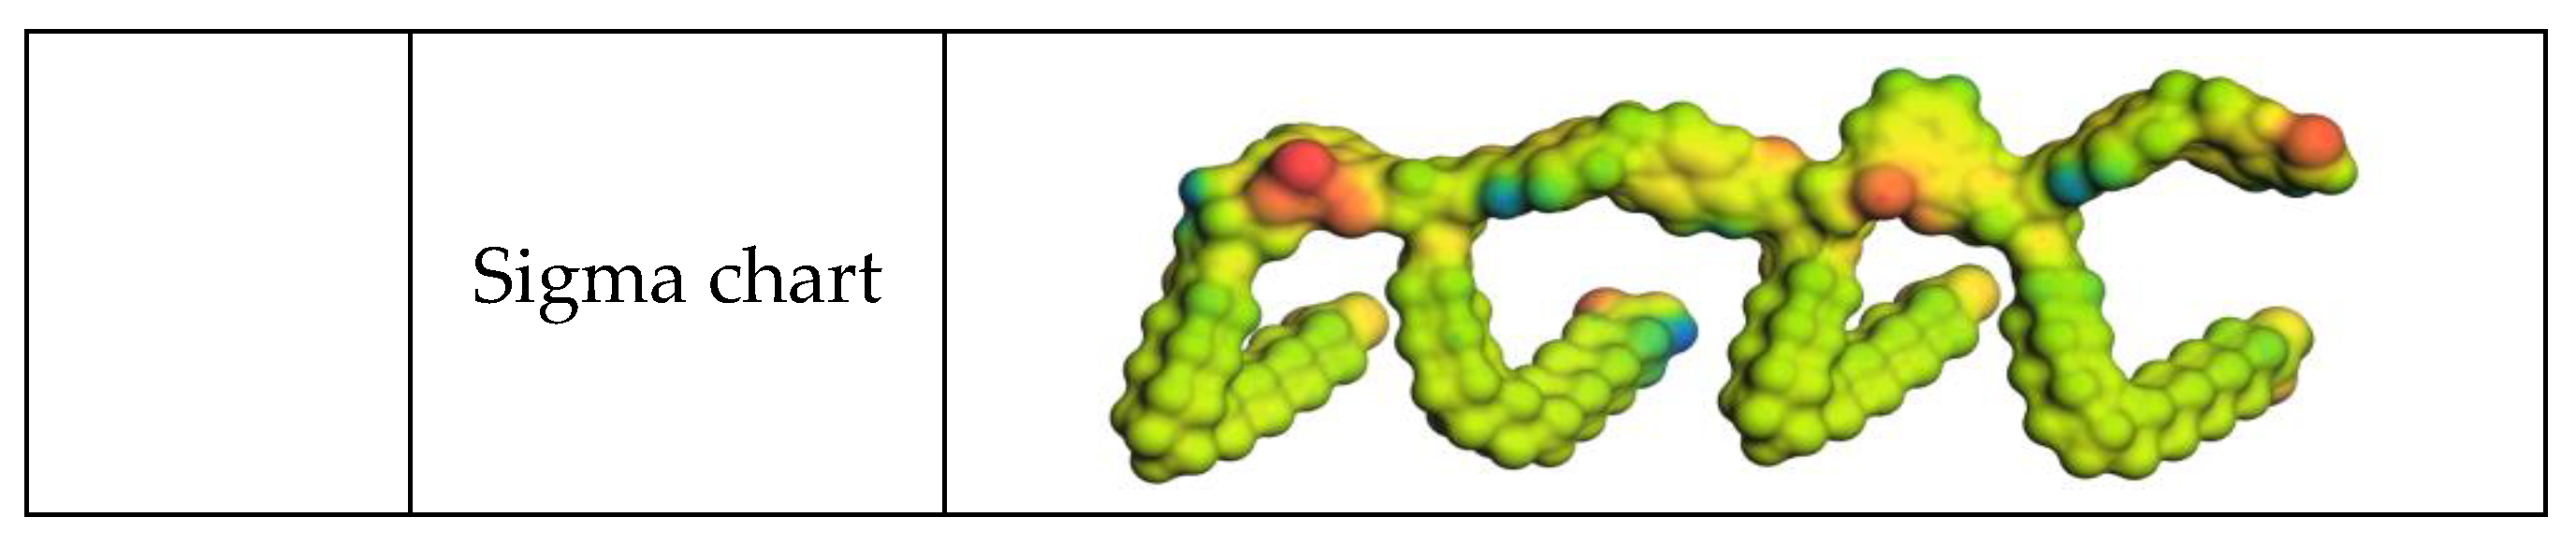
Final layer (FL): The FL consists of a two-component topcoat for the industrial epoxy system composed of polyurethane and alkyd (PUAk). After the IL coat has dried, it is applied in two 50 µm coats by brush, roller, or spray gun.
2.2.3. Soil Sampling Procedure:
The pipe was placed at 1.60 m from the lower generatrix based on its diameter. The soil layer from the surface to the upper generatrix, covering the tube, is between 53 and 73 cm. Therefore, taking soil samples (
Table 1) at a depth greater than or equal to 50 cm is recommended.
The solution we used for our experiments is an extract of soils taken from different sites: Ali Mendjelli (Constantine), Hamadi Krouma (Skikda), and Larbi ben M’hidi (Skikda).
Drying the soil sample in an oven at 105 °C for 2 h. Sieving of the soil to obtain a fineness suitable for uniform volumetric measurement. The volume of soil obtained is diluted in an equivalent volume of water (dissolution of salts). The mixture obtained is stirred for 1 h. The mixture was filtered using the gravitation method with filter papers or the vacuum method with a vacuum pump. The soil extract was prepared according to the procedure (Afnor standard A-05250P.278).
2.3. Surface Characterization
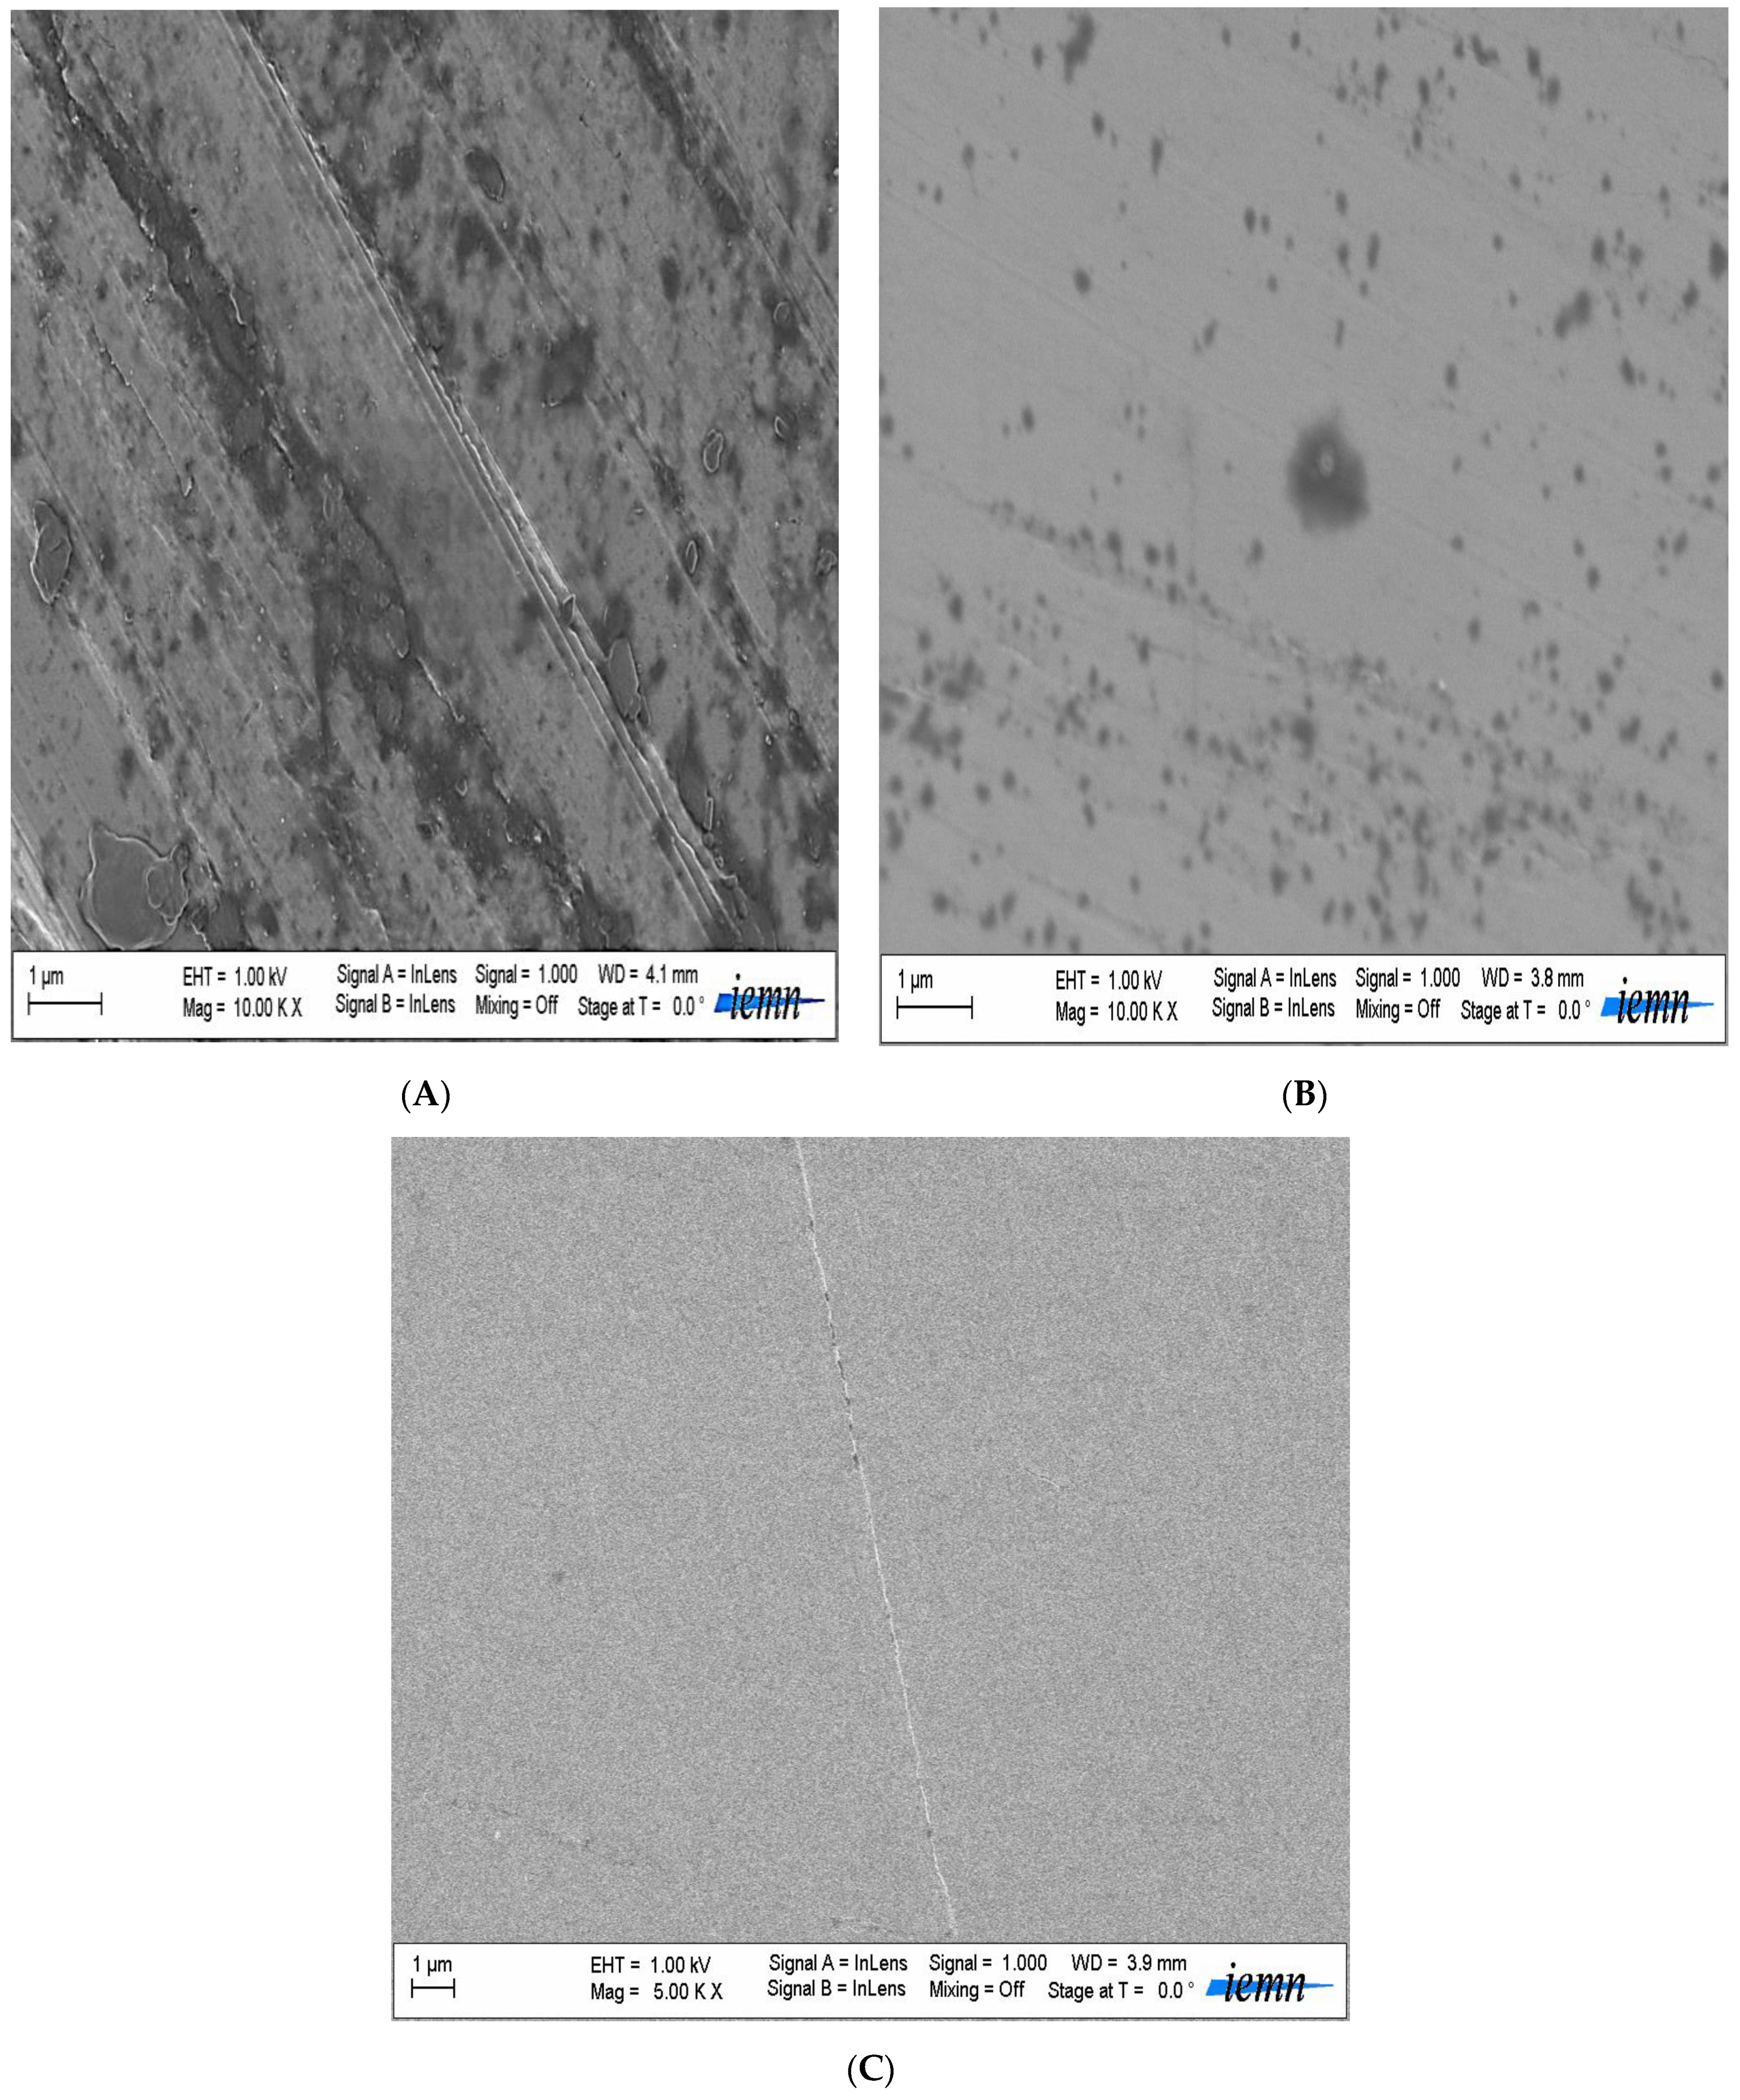
2.3.1. Scanning Electron Microscopy
SEM images were captured using a Zeiss ULTRA 55 electron microscope with a thermal field emission emitter and three detectors (ESB detector with filter grid, high-efficiency In-lens SE detector, Everhart–Thornley secondary electron detector).
2.3.2. Ellipsometry
A Jobin Yvon Horiba Spectroscopic Ellipsometer equipped with DeltaPsi 2 data processing software was used to collect spectroscopic ellipsometry data in the visible range. The apparatus captured a spectrum with 0.05 eV (or 7.5 nm) intervals spanning from 2 to 4.5 eV (equivalent to 300 to 750 nm). The angle of incidence was set at 70°, and the compensator was adjusted to 45° for the measurements. We found that the film thicknesses and the two complicated refractive indices best represented a film-on-substrate model.
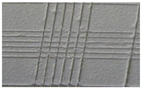
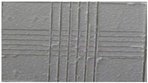
2.3.3. Adhesion
The performance of painted systems depends on the adhesion (See
Supplementary Materials) between the substrate and the different layers of the paint system. The standard French ISO: 2409-1994 [
29] gives all the details on the method known as the grid method. This destructive test makes it possible to measure the breaking strength: paint/substrate. The average paint thickness is calculated from 10 measurements on each sample with the ELCOMETER 345 FNF S-MKI gauge according to ISO: 2409-1994.
The paint consists of three layers that are 200 µm thick.
The degree of roughness was measured by the total height of the formed roughness during surface preparation. The value of the full amplitude between the peak and valley, which is 25 to 50 µm, is acceptable.
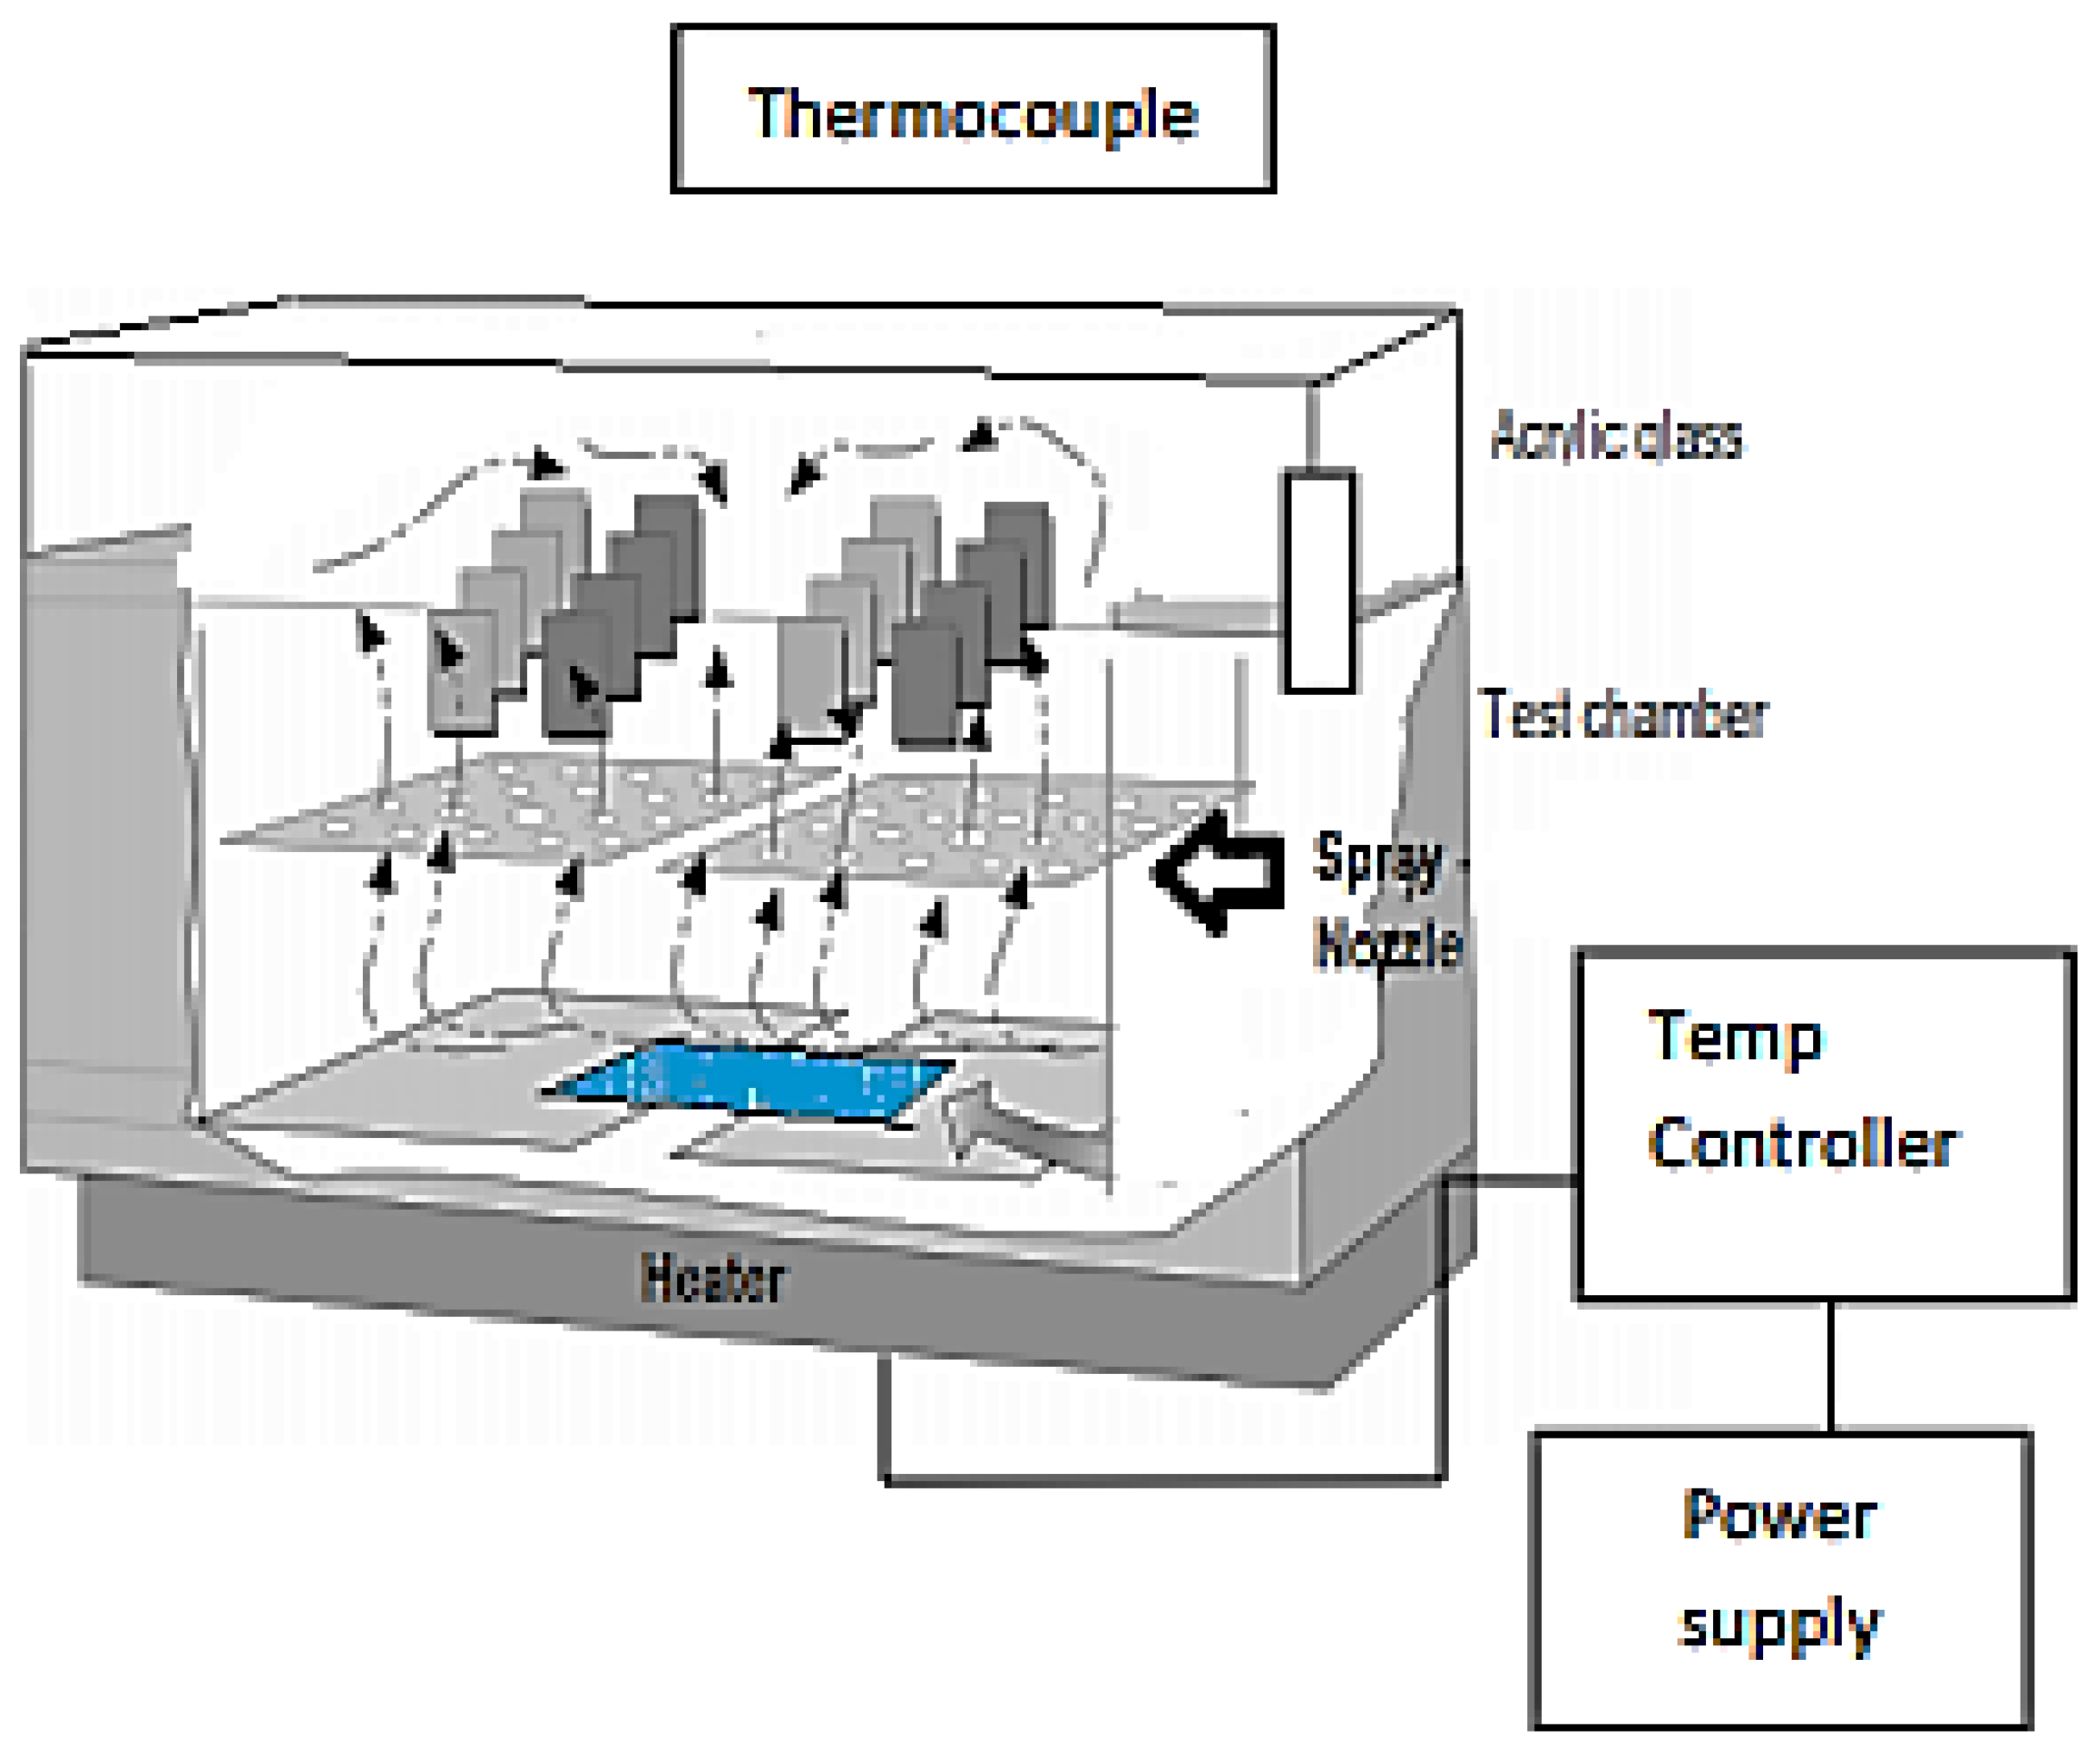
2.3.4. Chamber of the Salt Spray
This permits the realization of the resistance tests at the salt spray following the French norm AFNOR X41-002 [
11]. It is entirely constituted by a test tank in armed polyester glass and unattackable to the salt spray. The outer body is in rigid steel sheet metal, lacquered gray and hammered. The cover in the shape of the roof is transparent; the Plexiglas permits the direct observation of the pieces in the test. It includes a thermometer to control the internal temperature and supports studying the pieces. The heating of the tank was ensured by an electric resistance surrounding it and controlled by a thermometer (
Figure 2). The test simulates the atmospheric conditions near the sea while being based on the rules of actual correlation (1 h of the salt spray corresponds to 15 days inside the sea). The witness’s plates, were put to the test with the saline fog for 340 h.
2.4. Electrochemical Measurements
A saturated calomel reference electrode (SCE) and a platinum grid counter electrode were used in the Potentiostat/Galvanostat Model Solatron 1255B frequency response analyzer for electrochemical research. Polytetrafluoroethylene tape (PTFE) was used to insulate a cylindrical C38 steel rod, resulting in an A = 7.5 cm
2 surface area exposed to the solution. Uncoated and coated CS samples were immersed in soil extract from different locations at 30 °C for corrosion testing. The applied potential was scanned at 0.5 Mv per second [
30,
31]. Recordings of both anodic and cathodic fields were made.
At open-circuit potential (OCP), a Solartron SI1287 electrochemical interface was used for electrochemical impedance spectroscopy (EIS) from 2 mHz to 100 kHz, with an amplitude of 10 mV. View 2 software was used to model the impedance data.
2.5. Control Tests
The degree of care is defined to evaluate the surface condition required for good paint adhesion. It is the most common way to check the surface condition after Sa2.5 sandblasting. This compares the surface in question with photos according to ISO 8501, making it possible to determine the required degree of care and characterizing the more or less thorough removal of impurities.
The salt spray test is a standardized evaluation of the corrosion resistance of metallic materials, whether with or without a temporary or permanent corrosion protection coating. However, the salt spray test is a widely used method of quality control layers. The conducting of these tests is described by various standards (ASTM B1171, EN ISO 92273). In all cases, the parts to be evaluated are placed in a test chamber where a salt solution is sprayed at a specific temperature. The test can run continuously from six to over a thousand hours. The most corrosion-resistant materials can be tested for more extended periods. The salt spray test will give different results than corrosion under normal conditions. Corrosion is indeed a complex phenomenon.
2.6. Theoretical Study
2.6.1. Quantum Chemical Calculations
The ORGS and Fe
18 cluster structures were optimized using the DFT-B3LYB functional and the Turbomole package’s TZVP basis set [
32]. The Conductor-like Screening Model for Real Solutions (COSMO-RS) was computed using the COSMOTherm program [
32,
33,
34]. Quantum chemical methods are rather helpful in elucidating the relationship between electronic structure and reactivity. Thus, quantum chemical calculations have been widely used in corrosion inhibition studies. Chemical reactivity descriptors such as electronegativity, softness, chemical potential, chemical hardness, and the HOMO–LUMO energy gap were calculated.
From the ionization (
I) and electron affinity (
A) ground states, we can deduce the hardness (
η) and chemical potential (
μ) or electronegativity (
χ) equations, respectively.
and
represent the energy of the
HOMO and
LUMO orbitals, respectively.
The electronegativity and hardness values determine an ion’s, atom’s, or molecule’s electrophilicity index (
ω). [
35]
The percentage of electrons transported from the ORGS molecule to the CS sample’s surface is computed as follows [
34]:
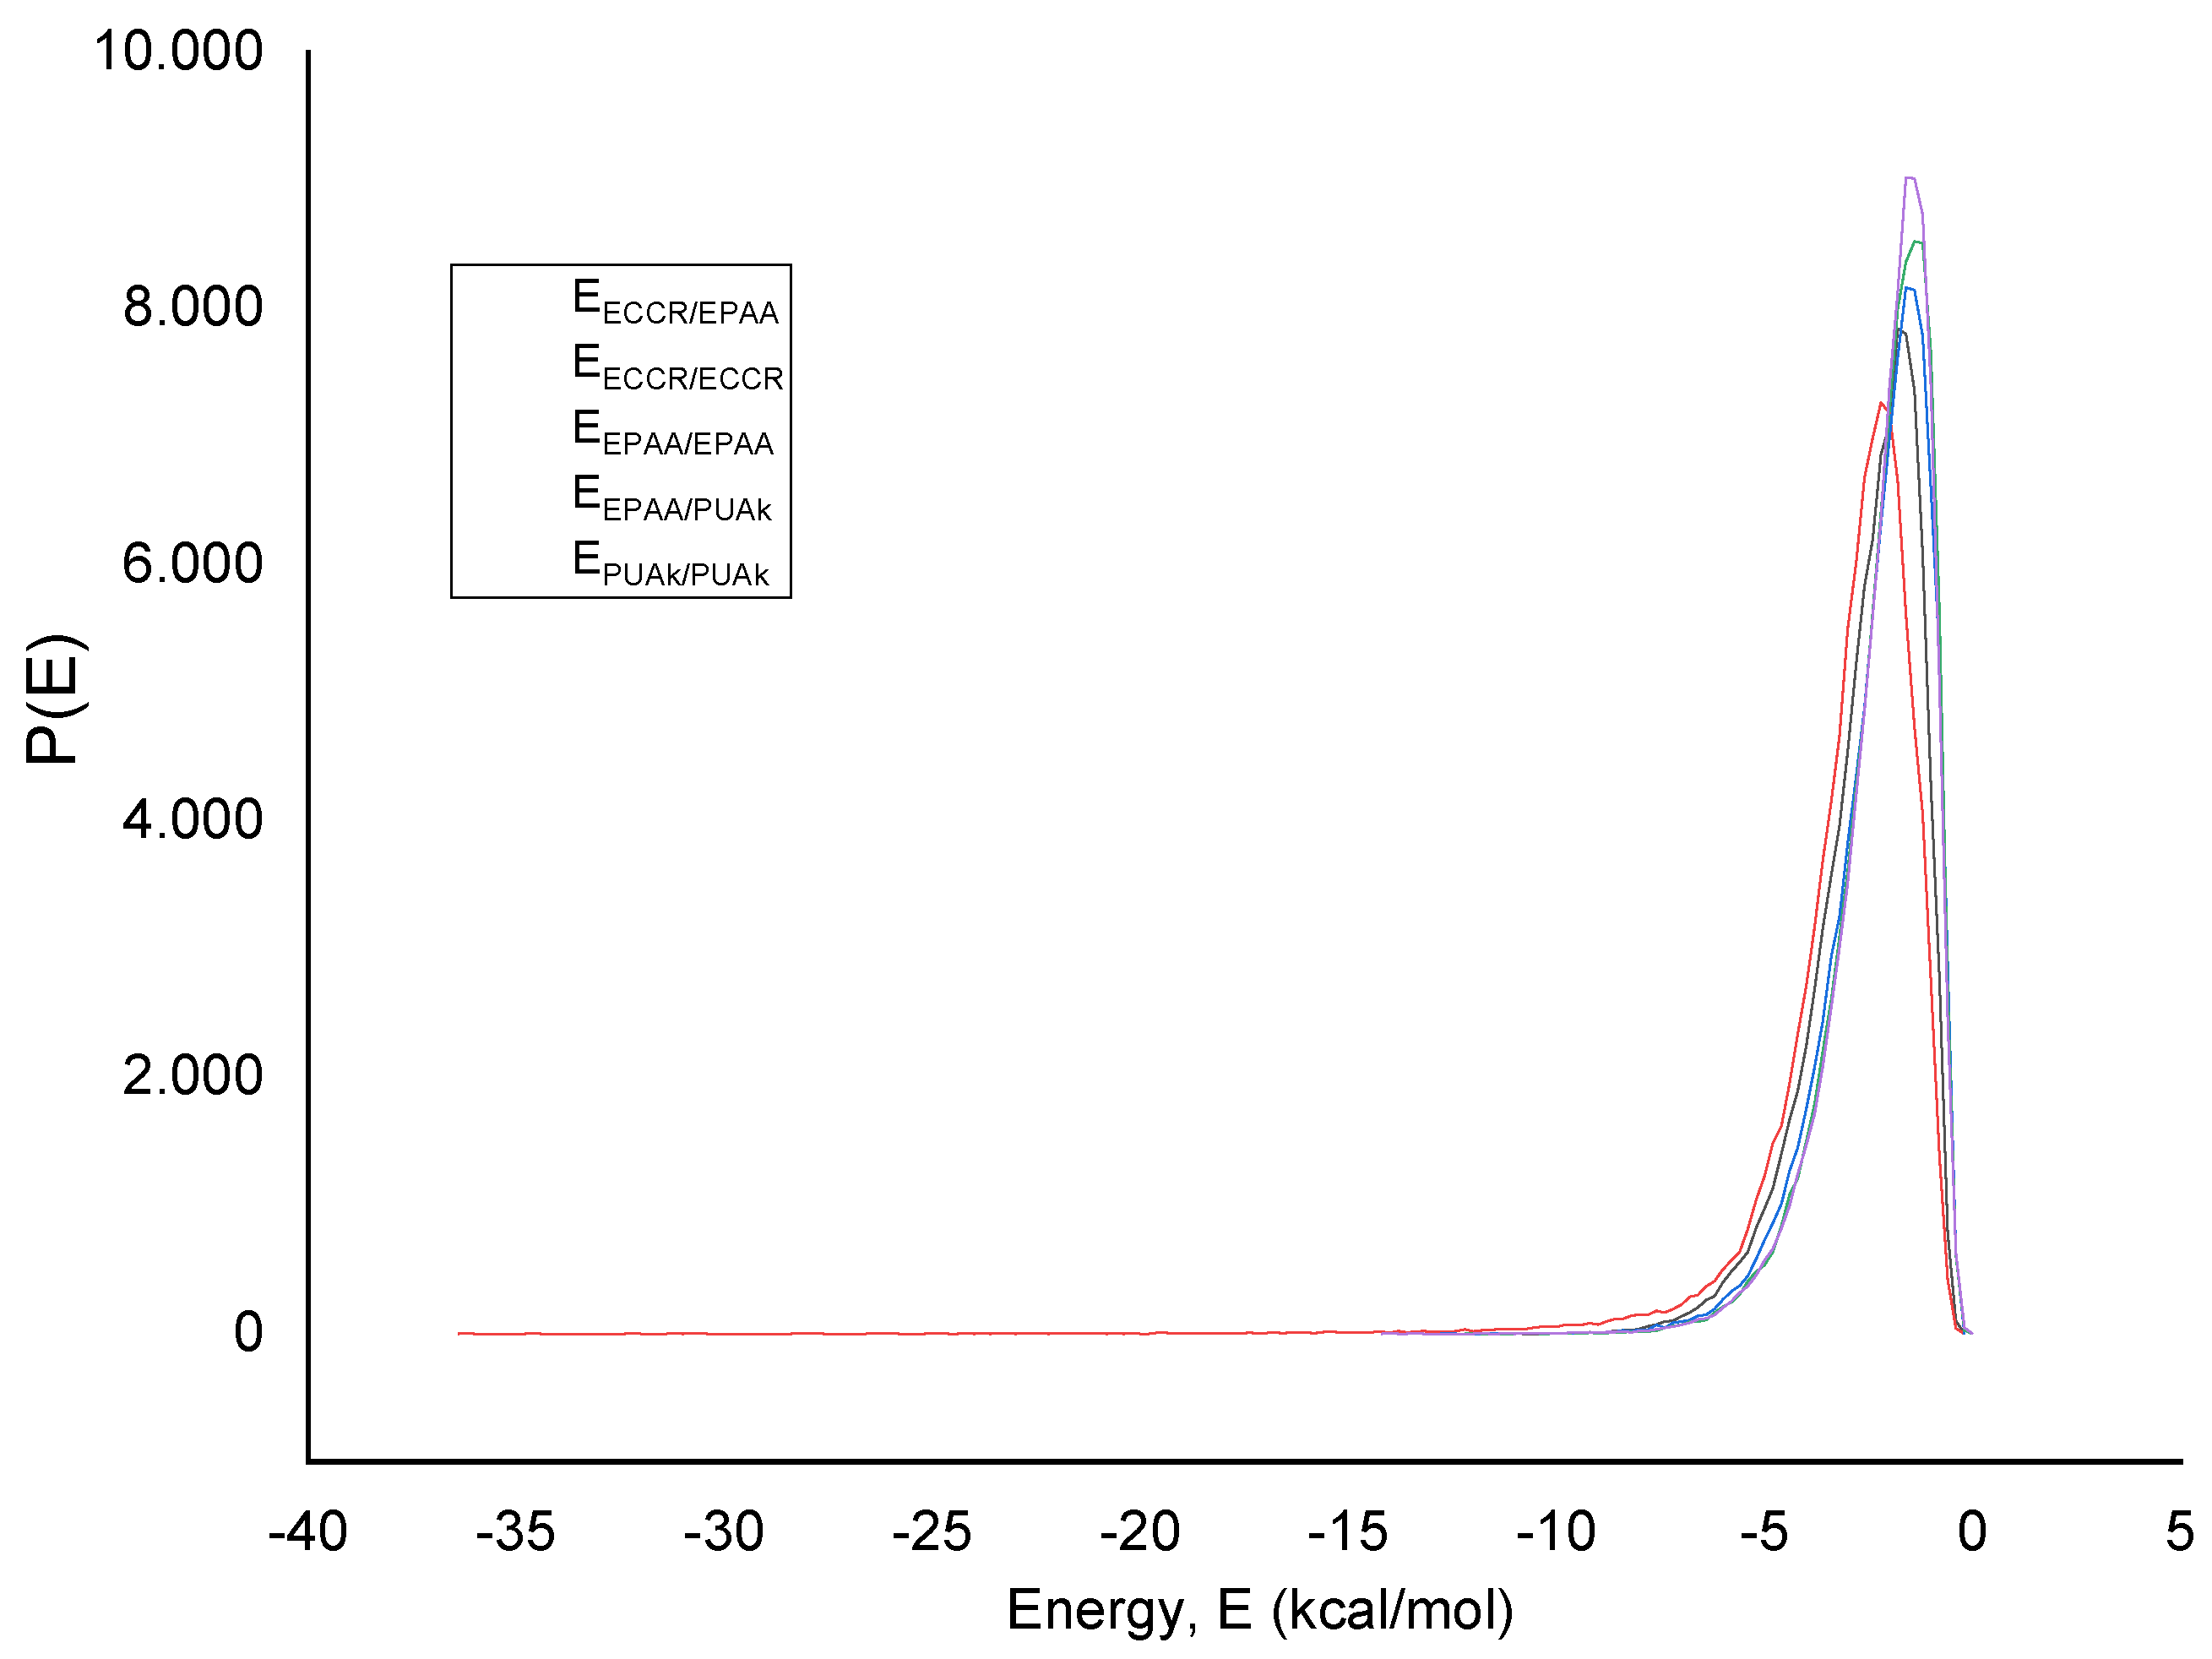
2.6.2. Polymer Blends
The polymer’s miscibility was investigated with the help of the Material Studio Blends module. The thermodynamics of different materials may be estimated directly from their chemical structures. A force field and molecule structures are all needed to run the mixture simulation [
36].
The thermodynamic definition of miscibility in mixes of various materials may be given. It is possible to follow the Flory and Huggins theory, which is based on the calculation of free energy for mixing, which defines the state of a mixture. It describes the compounds as either soluble or insoluble [
36,
37]:
nA and
nB are the mol numbers of the two components and their corresponding
and
volume fractions. The first two terms give the mixture’s combinatorial entropy, always negative [
38]. Flory–Huggins’s (
χ) parameter is defined as follows [
39]:
The mixing energy,
Emix, is calculated by dividing the free energy of the mixture by the sum of the pure component energies (base (
b) and screen (
s)) [
40,
41].
Ebb, Ess, Esb, Ebs: binding energies of two molecules
b and
a, where
b refers to “base” and
s to “screen”.
Z denotes the coordinate number [
40].
4. Conclusions
CS was coated with three layers of polymers known for their remarkable corrosion resistance as a preventative measure.
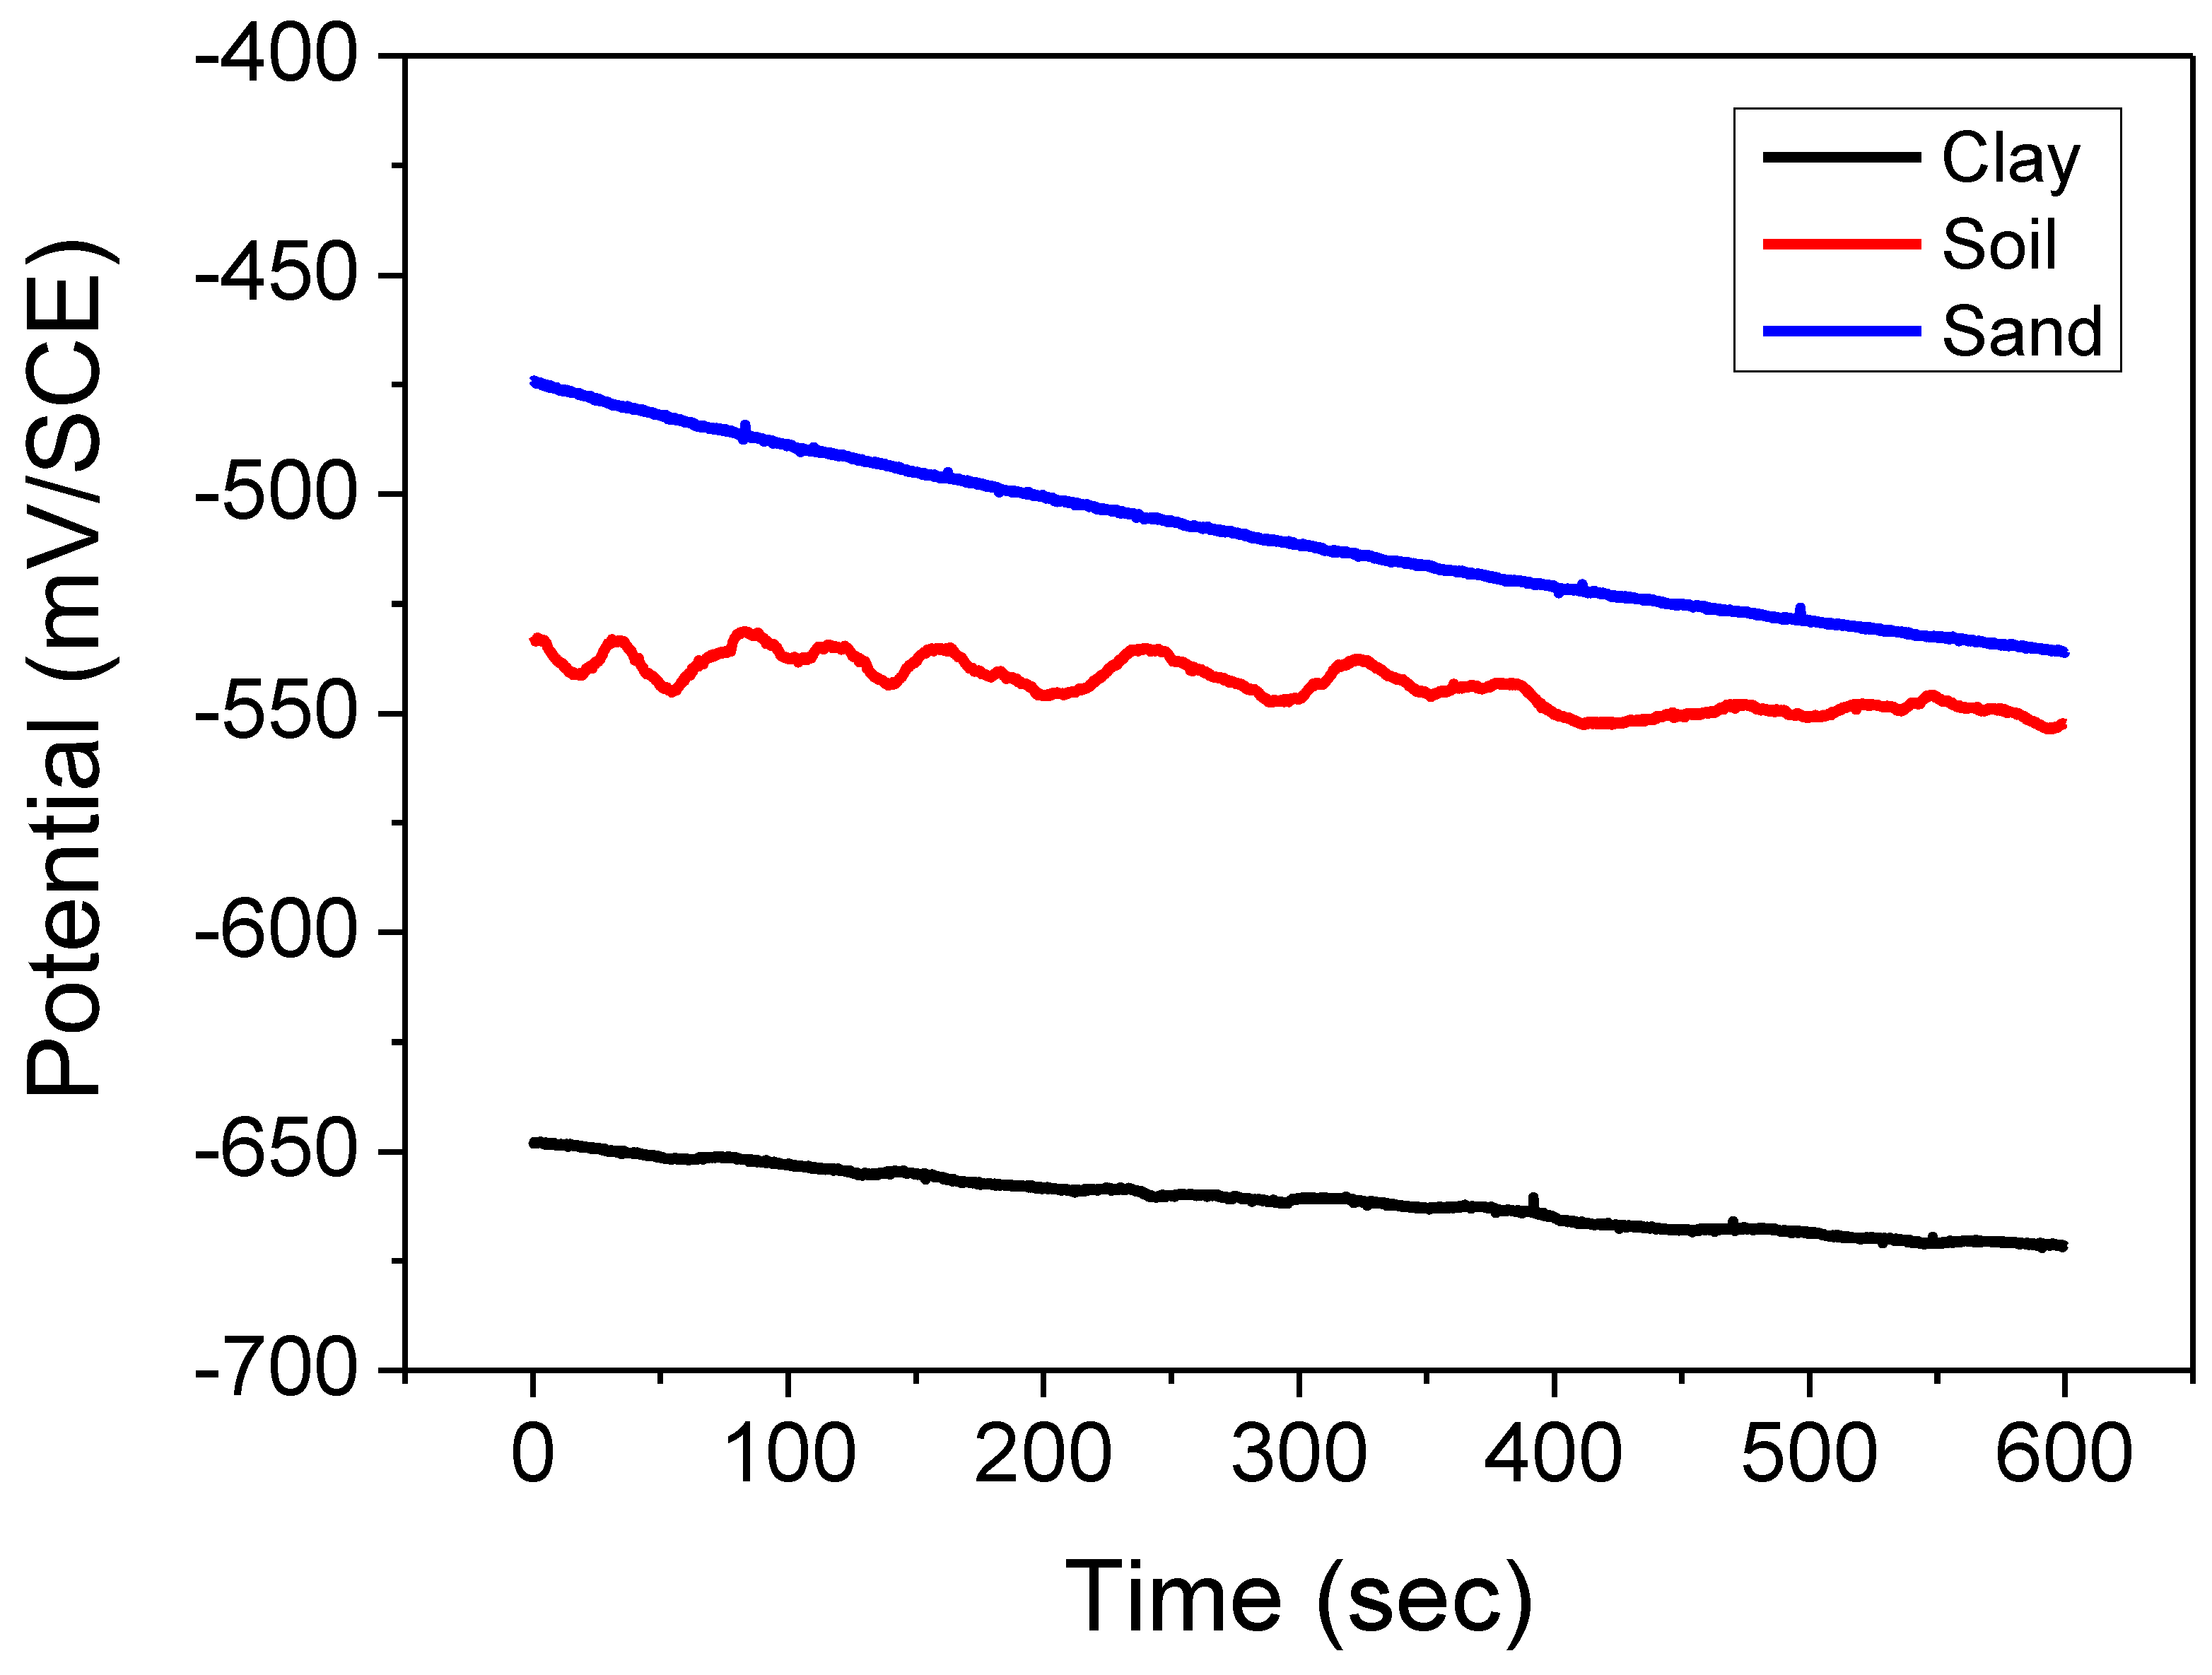
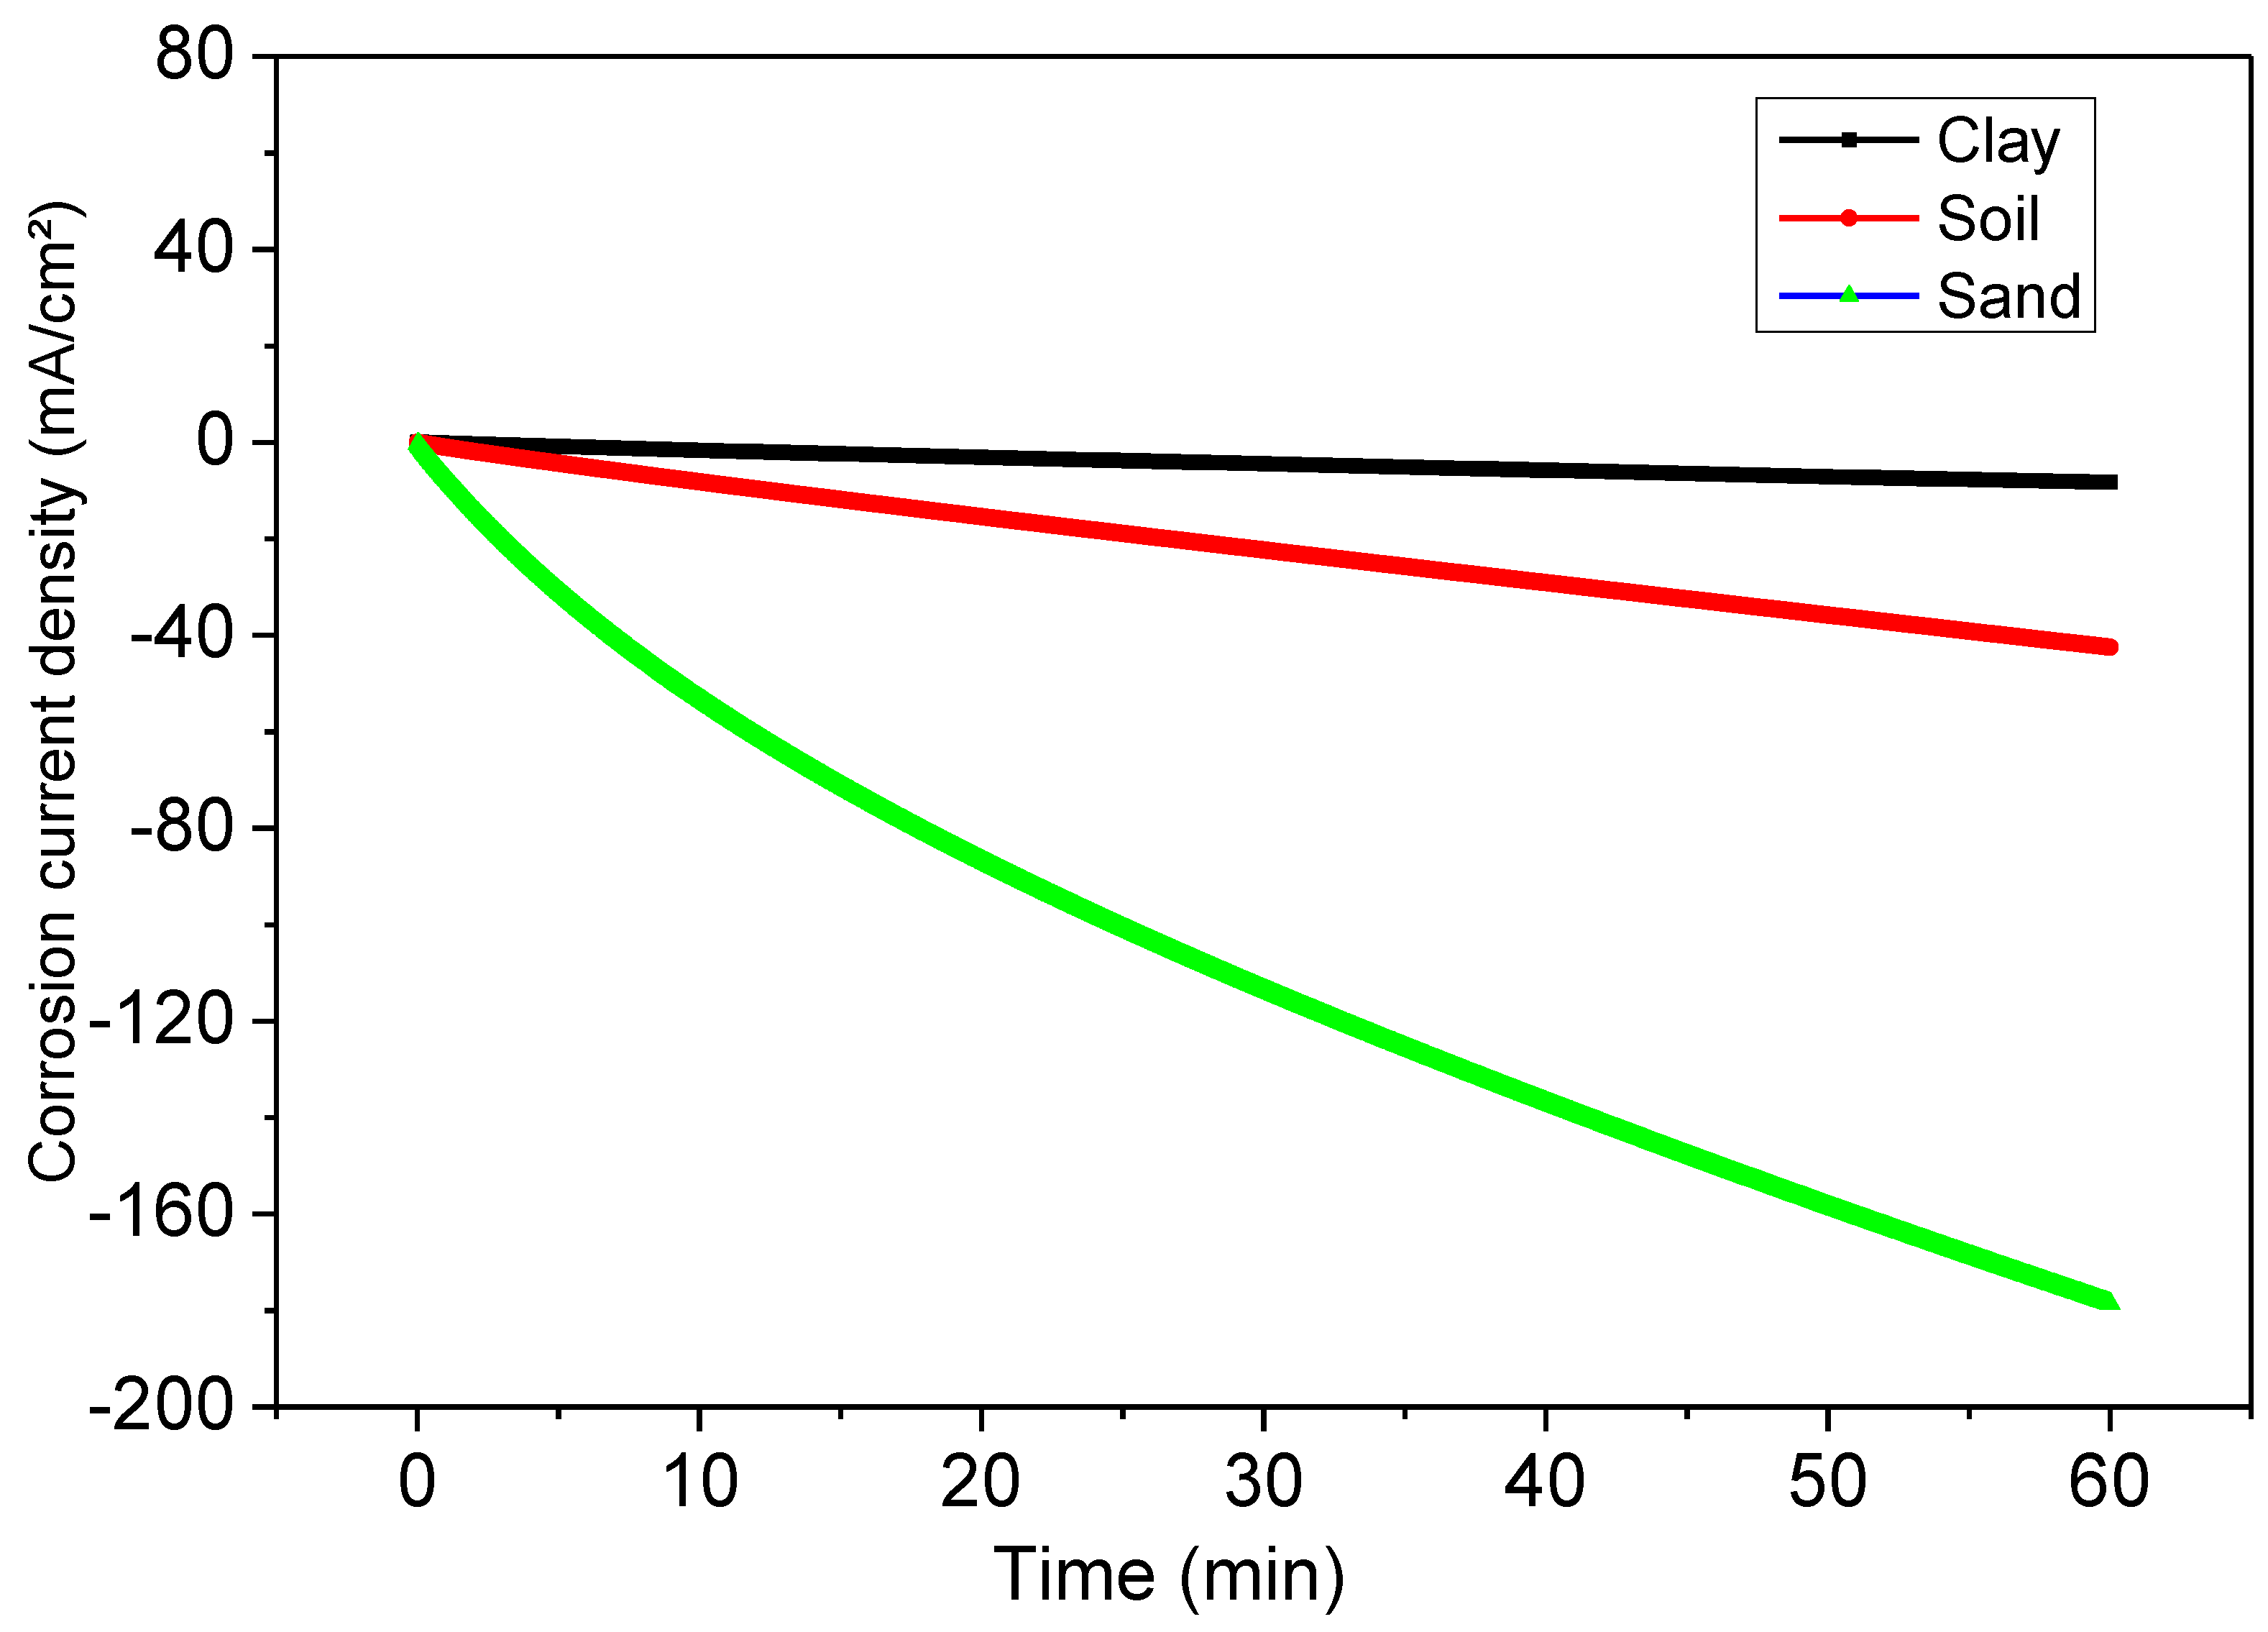
Evidence from electrochemical investigations showed without a doubt that the polymer improved the corrosion resistance of steel coatings in soil extract over 60 days and under external polarization circumstances. A more excellent barrier creates a protective layer effect, which is why such a medium resists corrosion better than the others.
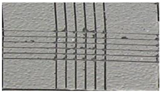
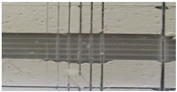
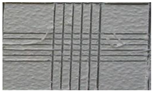
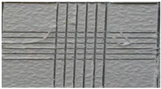
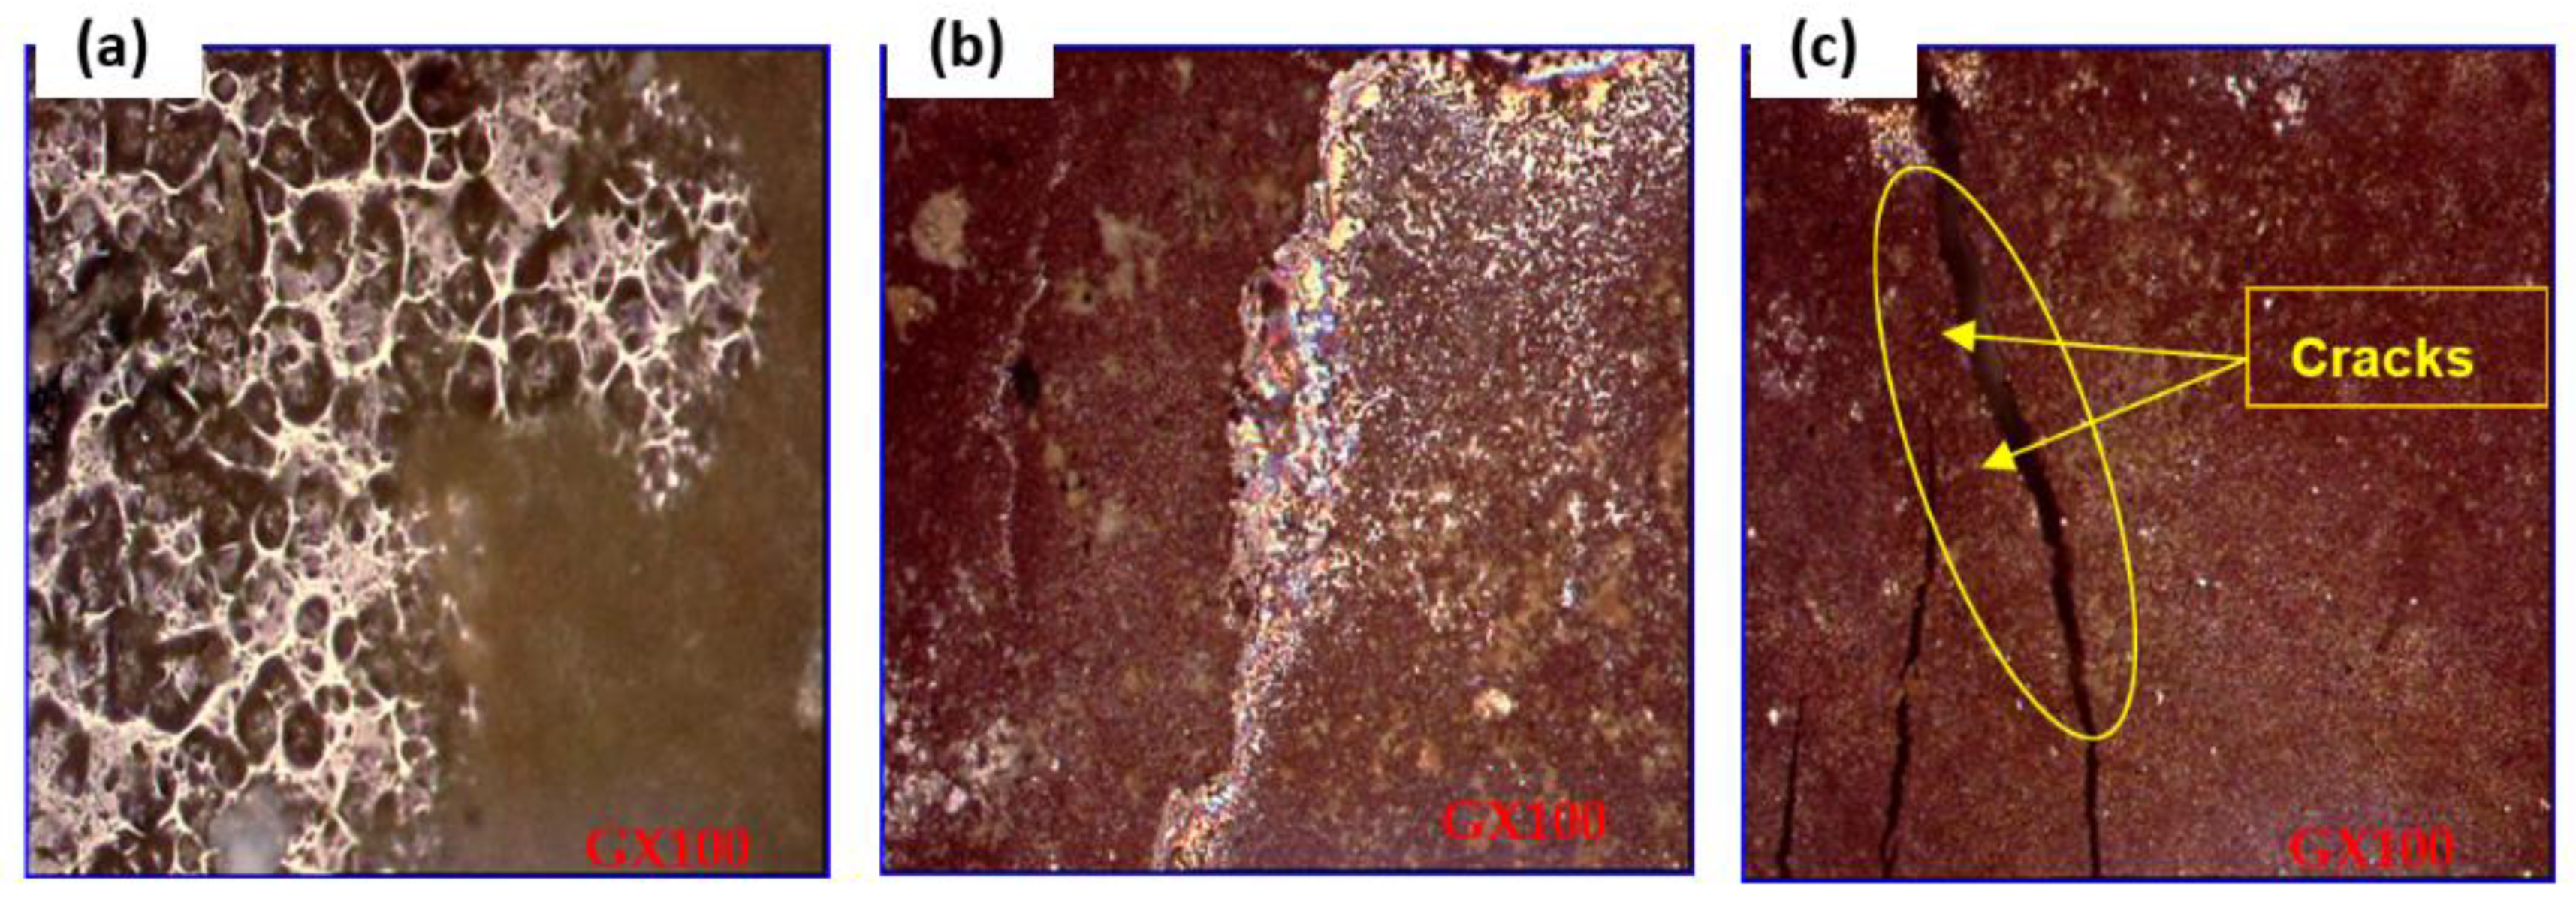
Blistering, spalling, and cracking are all damage that may be linked to specific physical occurrences in soil. Thanks to scanning electron microscopy, this is now much easier to determine.
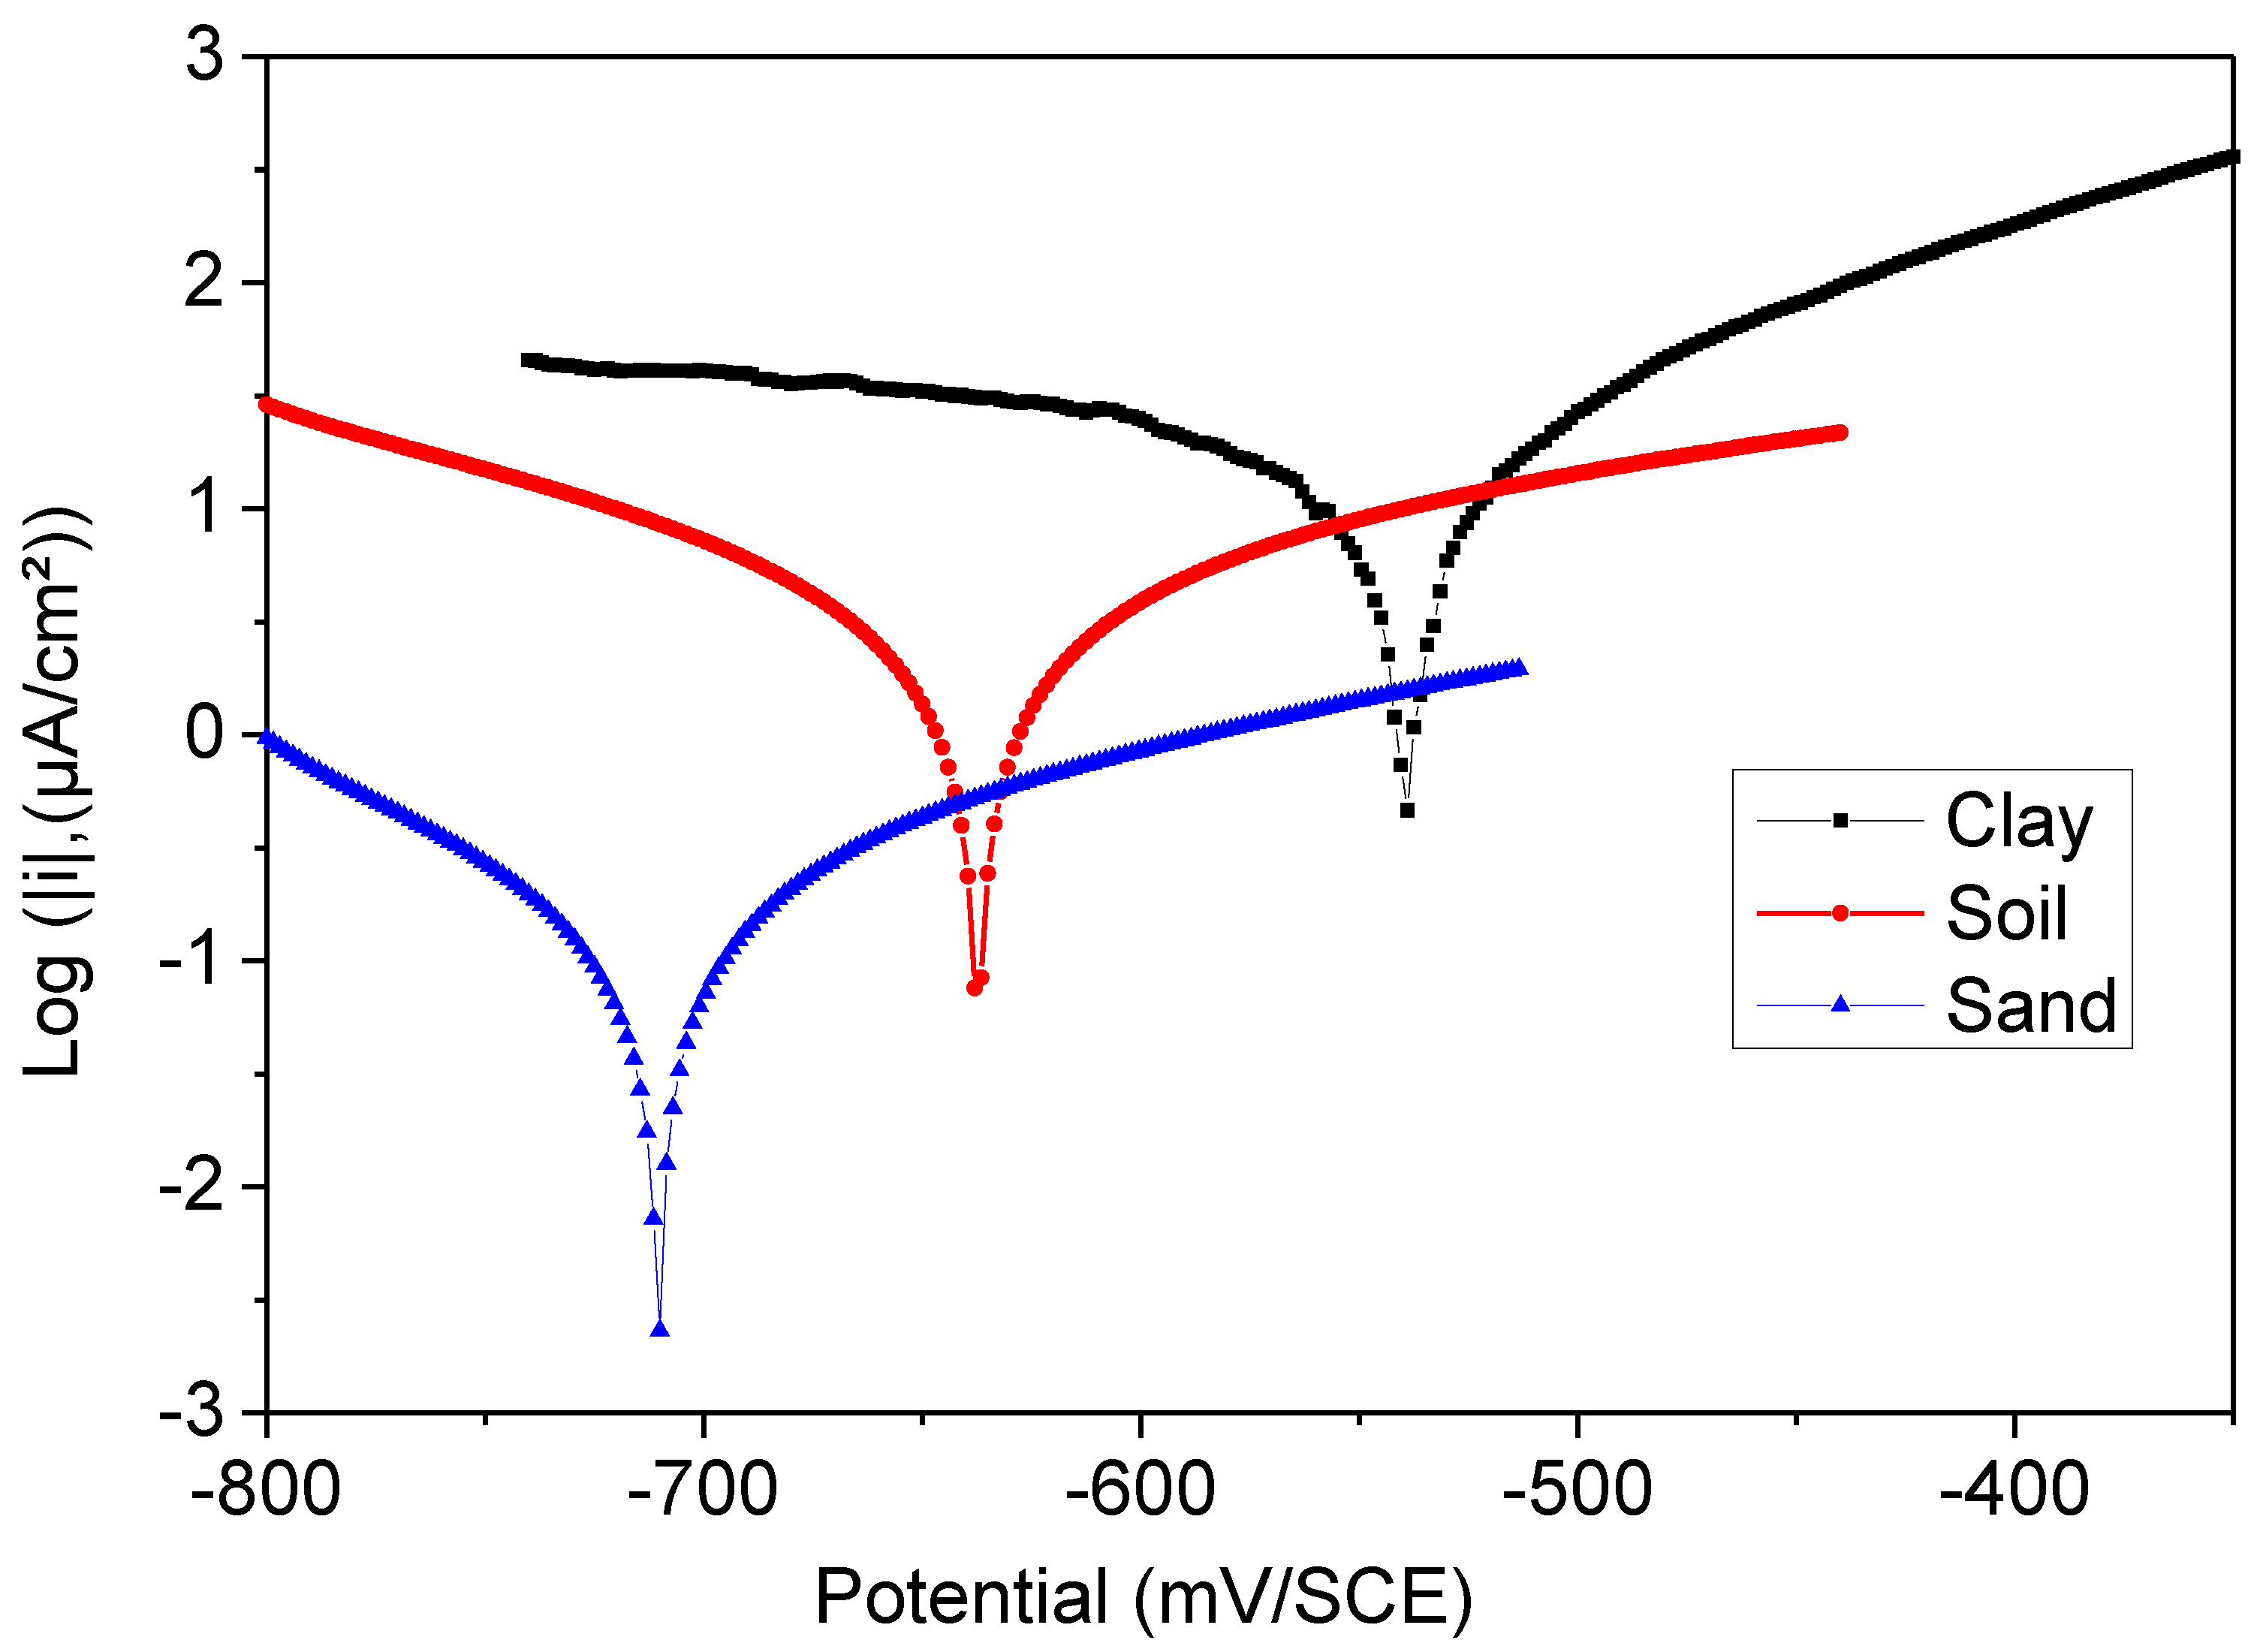
The maximum (56 µAcm−2) average corrosion current density (icorr) of the total electrode surface area measured by PD occurred at an estimated efficiency of 89.9% for sand extract, and maximum (97 and 74 µAcm−2) aggressivity occurred between 82% and 86.6%.
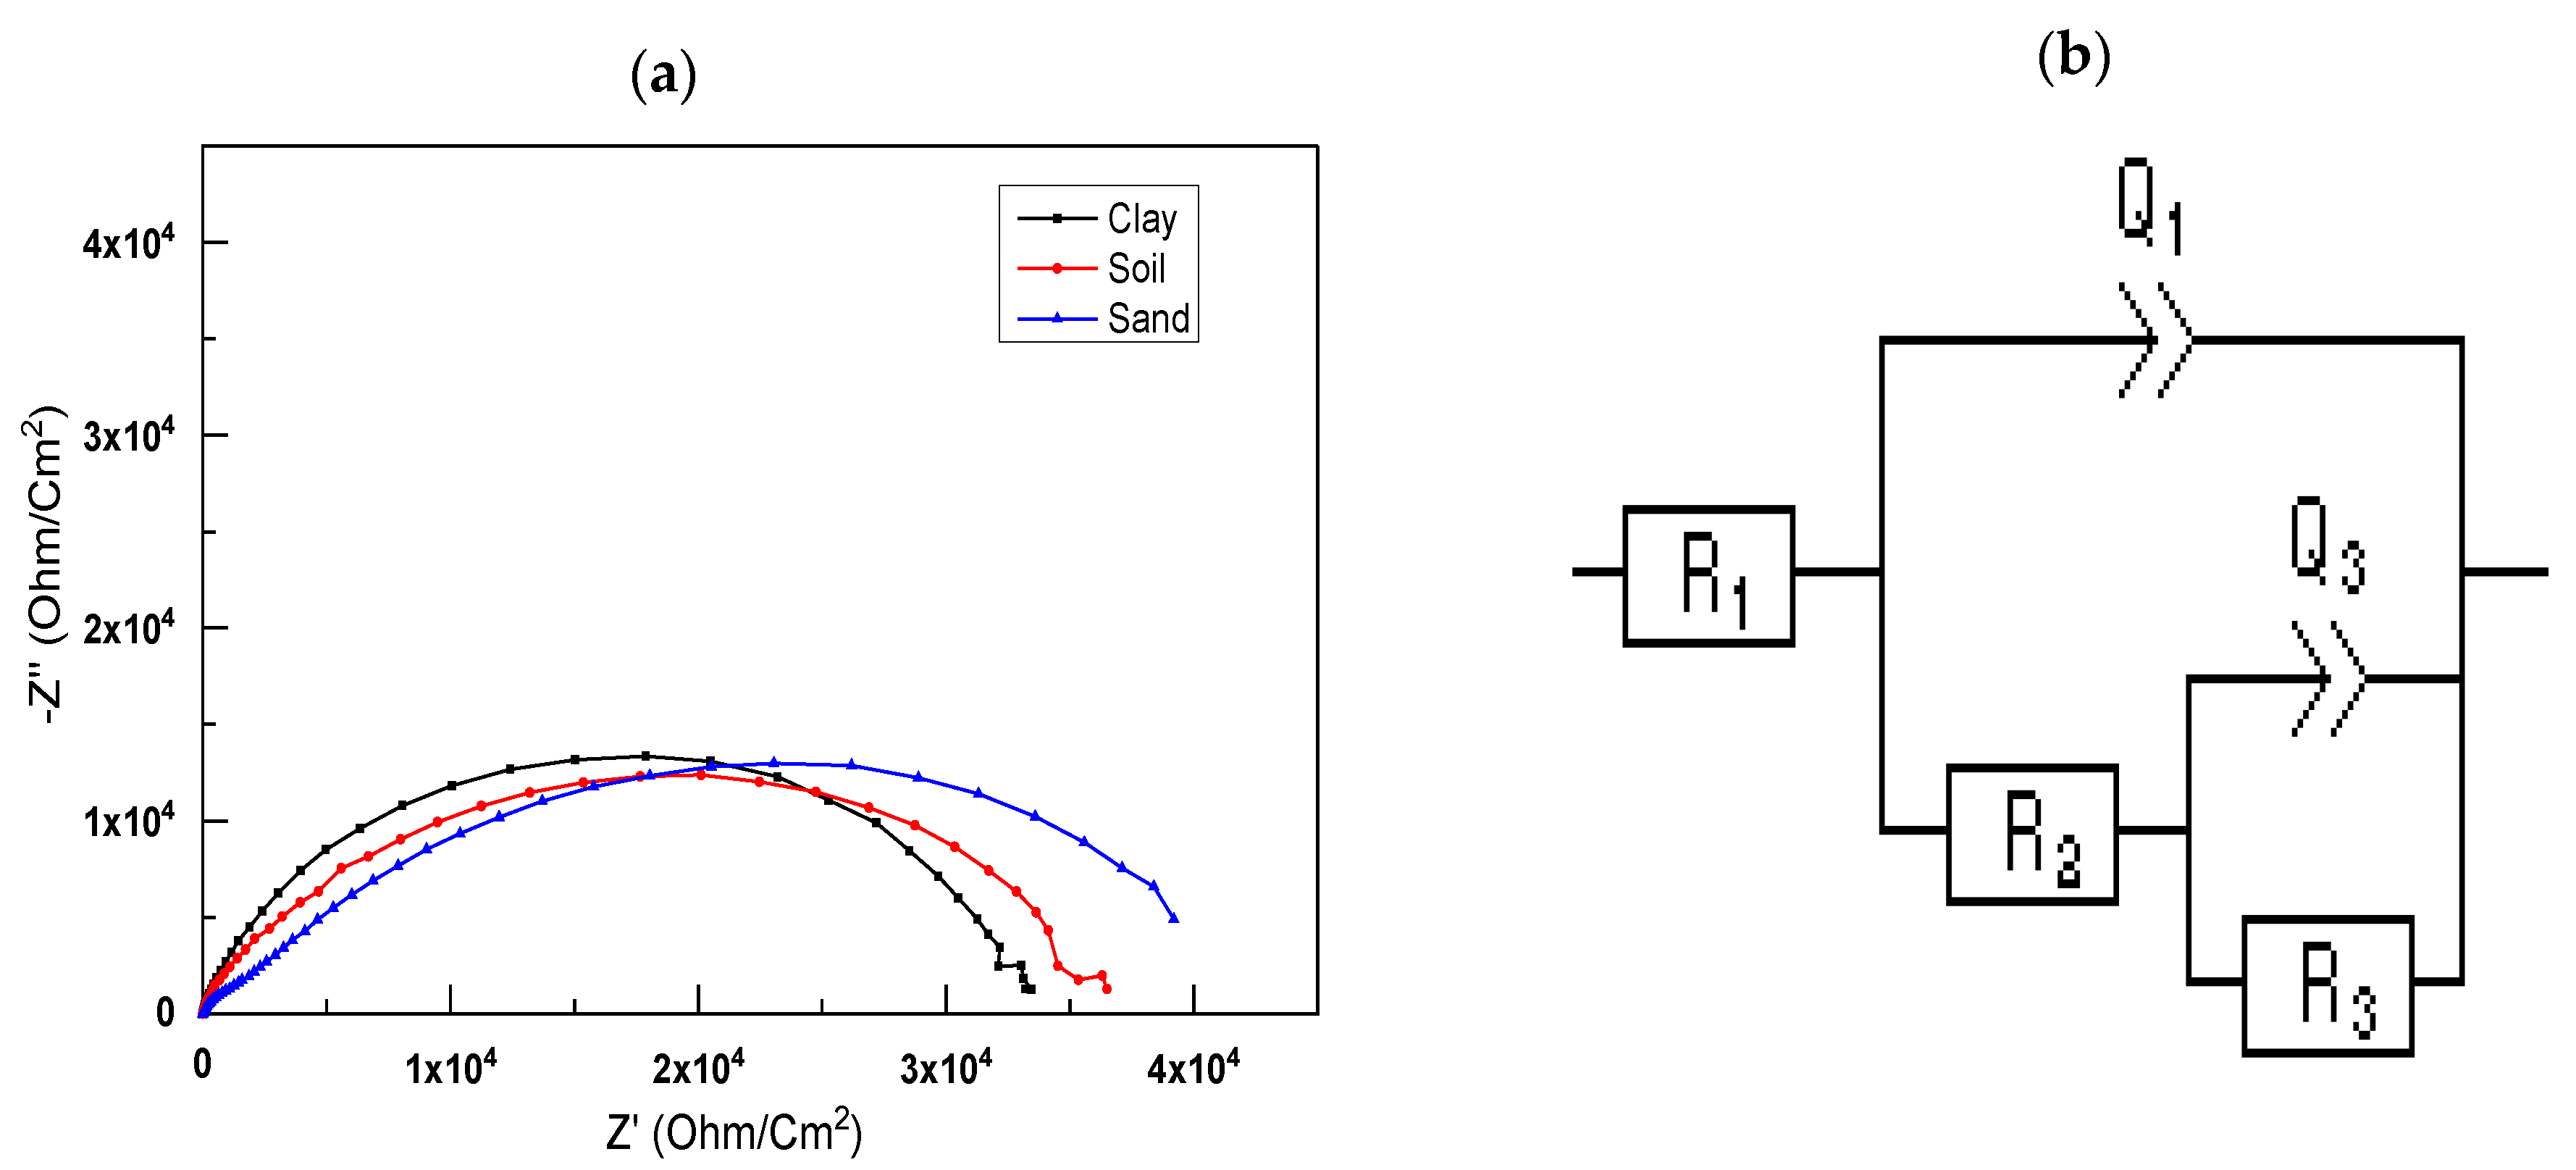
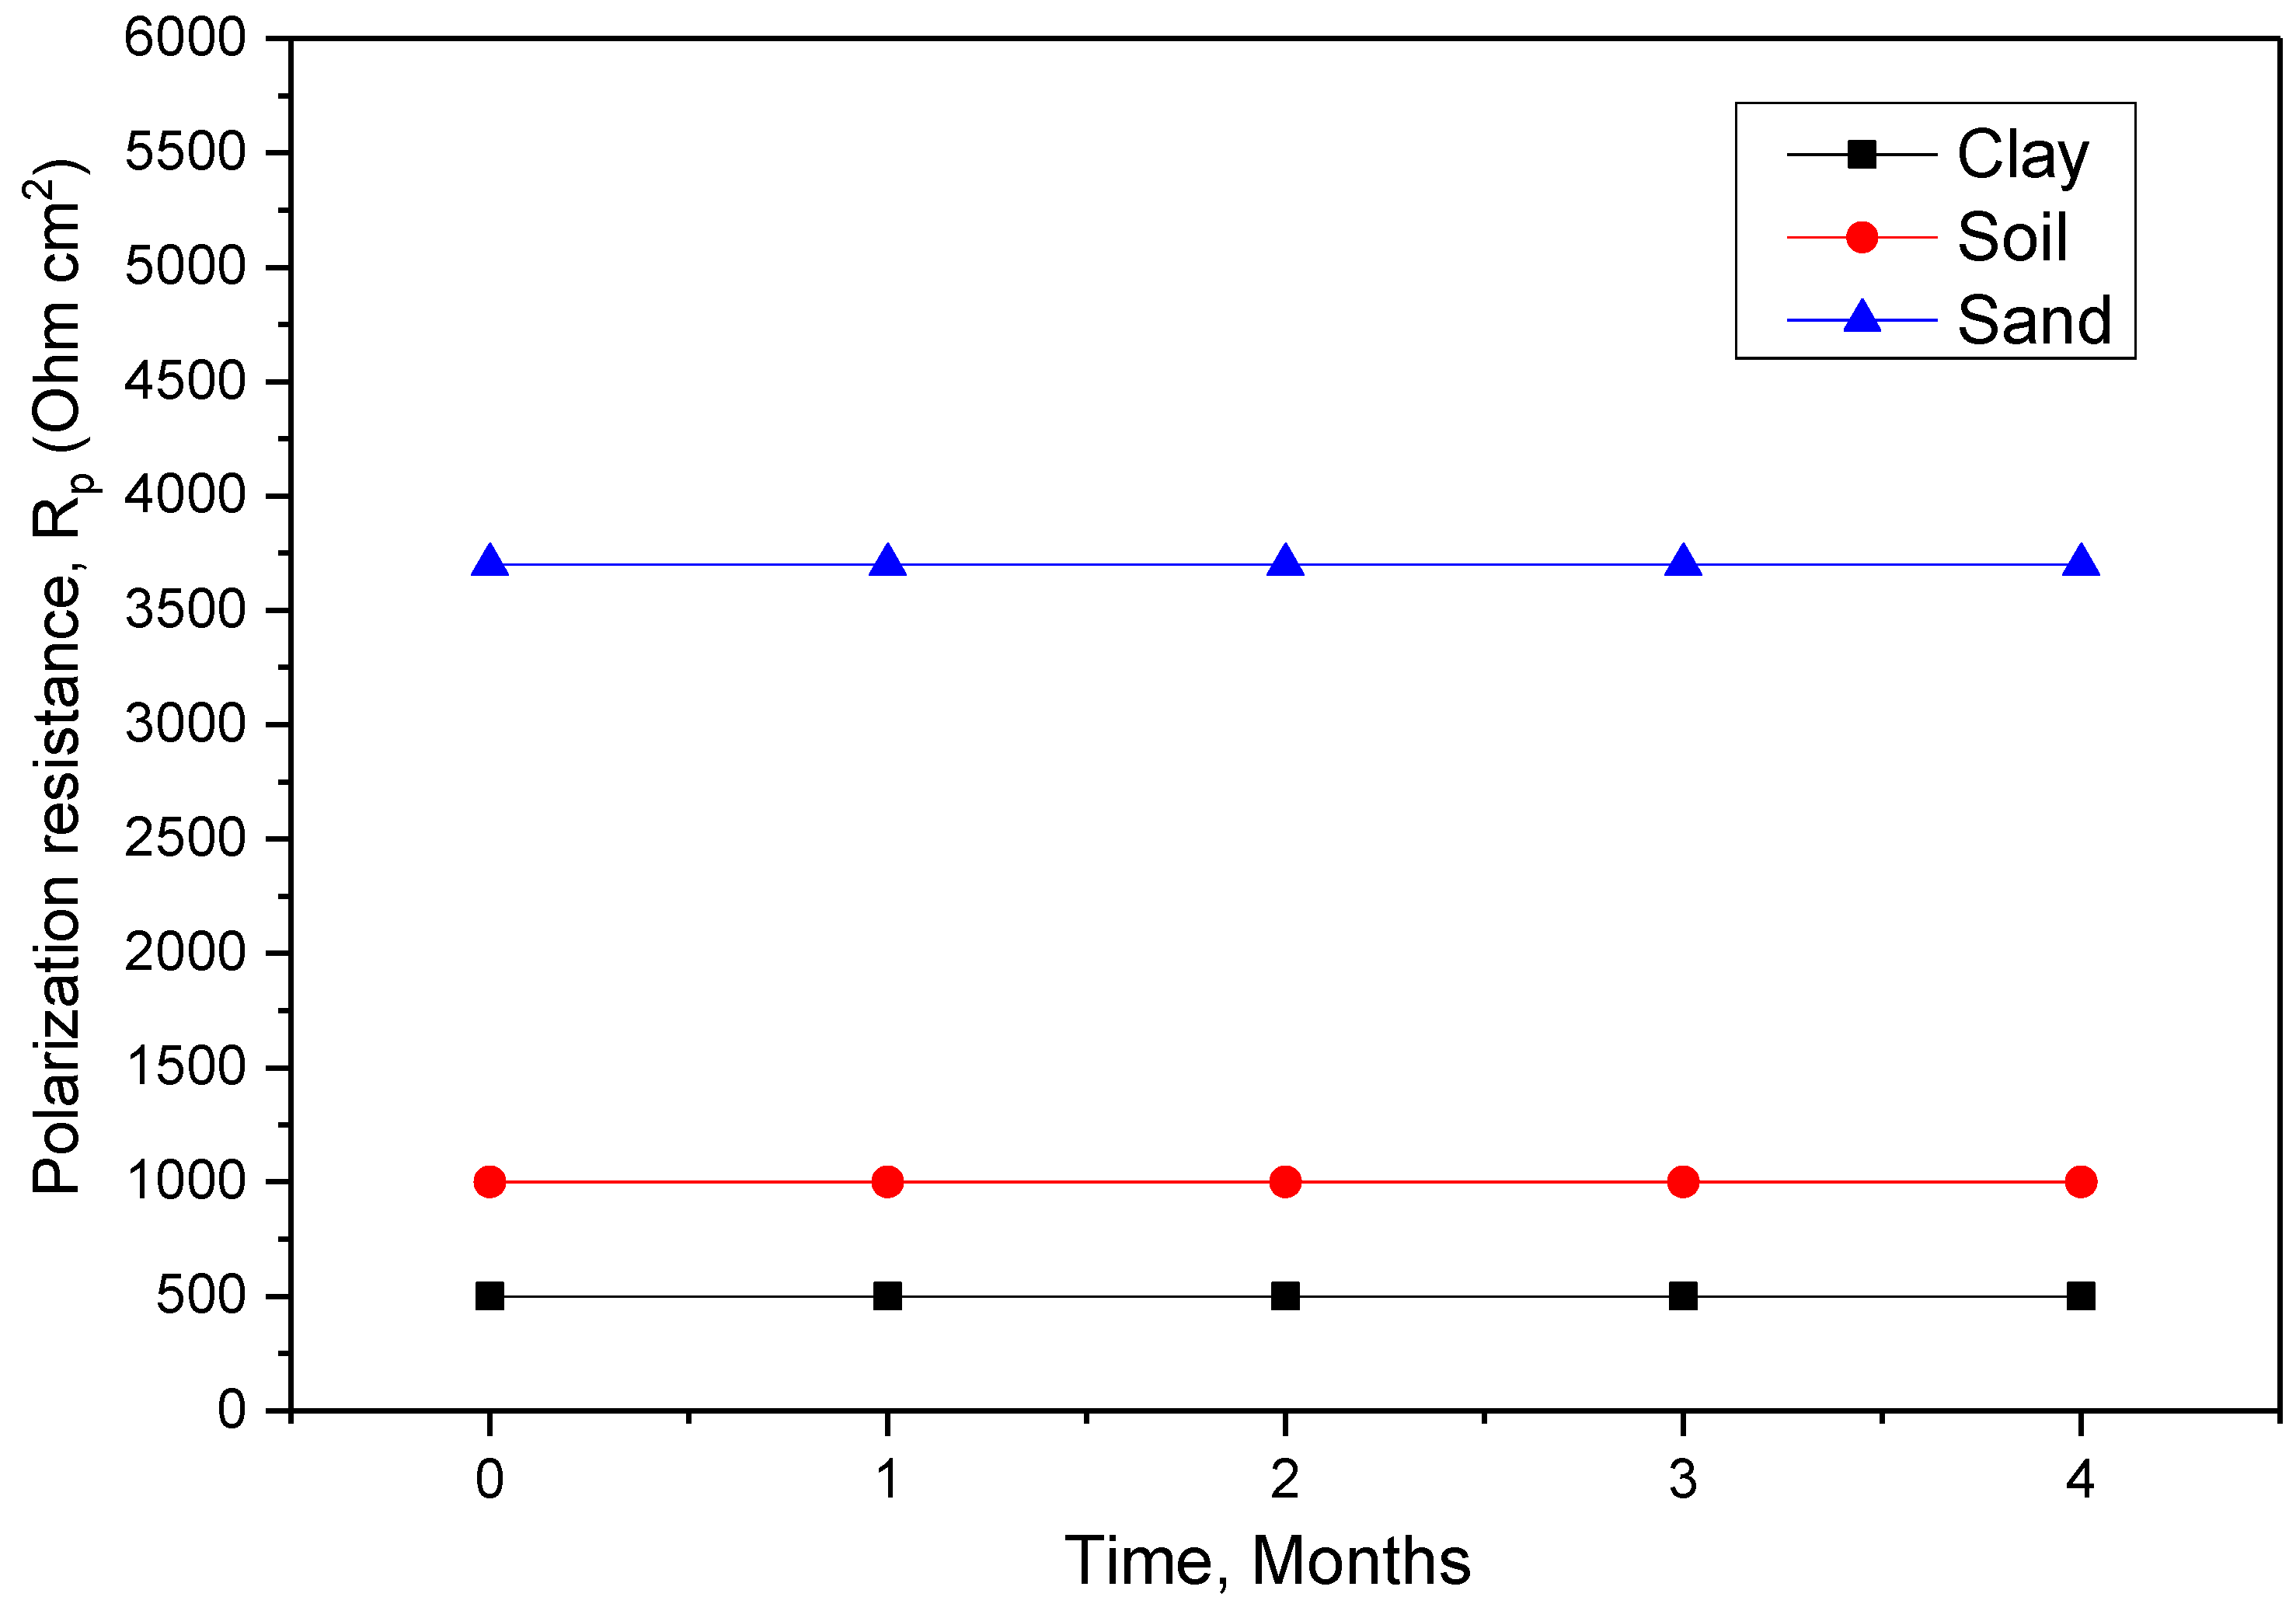
The electrochemical impedance spectroscopy experiments showed that the impedance changed significantly with the immersion time. According to the results, there is always a capacitive and resistive interaction between the material and medium. The longer one is immersed, the less resistant one becomes. The aggressive species in the medium impregnated the protective layer formed by the porosity of the coatings, causing the process to occur. The results of the EIS polarization resistance also confirmed these findings.


 ,
, 


