
Determination of Interlaminar Shear Properties of Fibre-Reinforced Composites under Biaxial Loading: A New Experimental Approach


Abstract
:1. Introduction
2. Materials and Methods
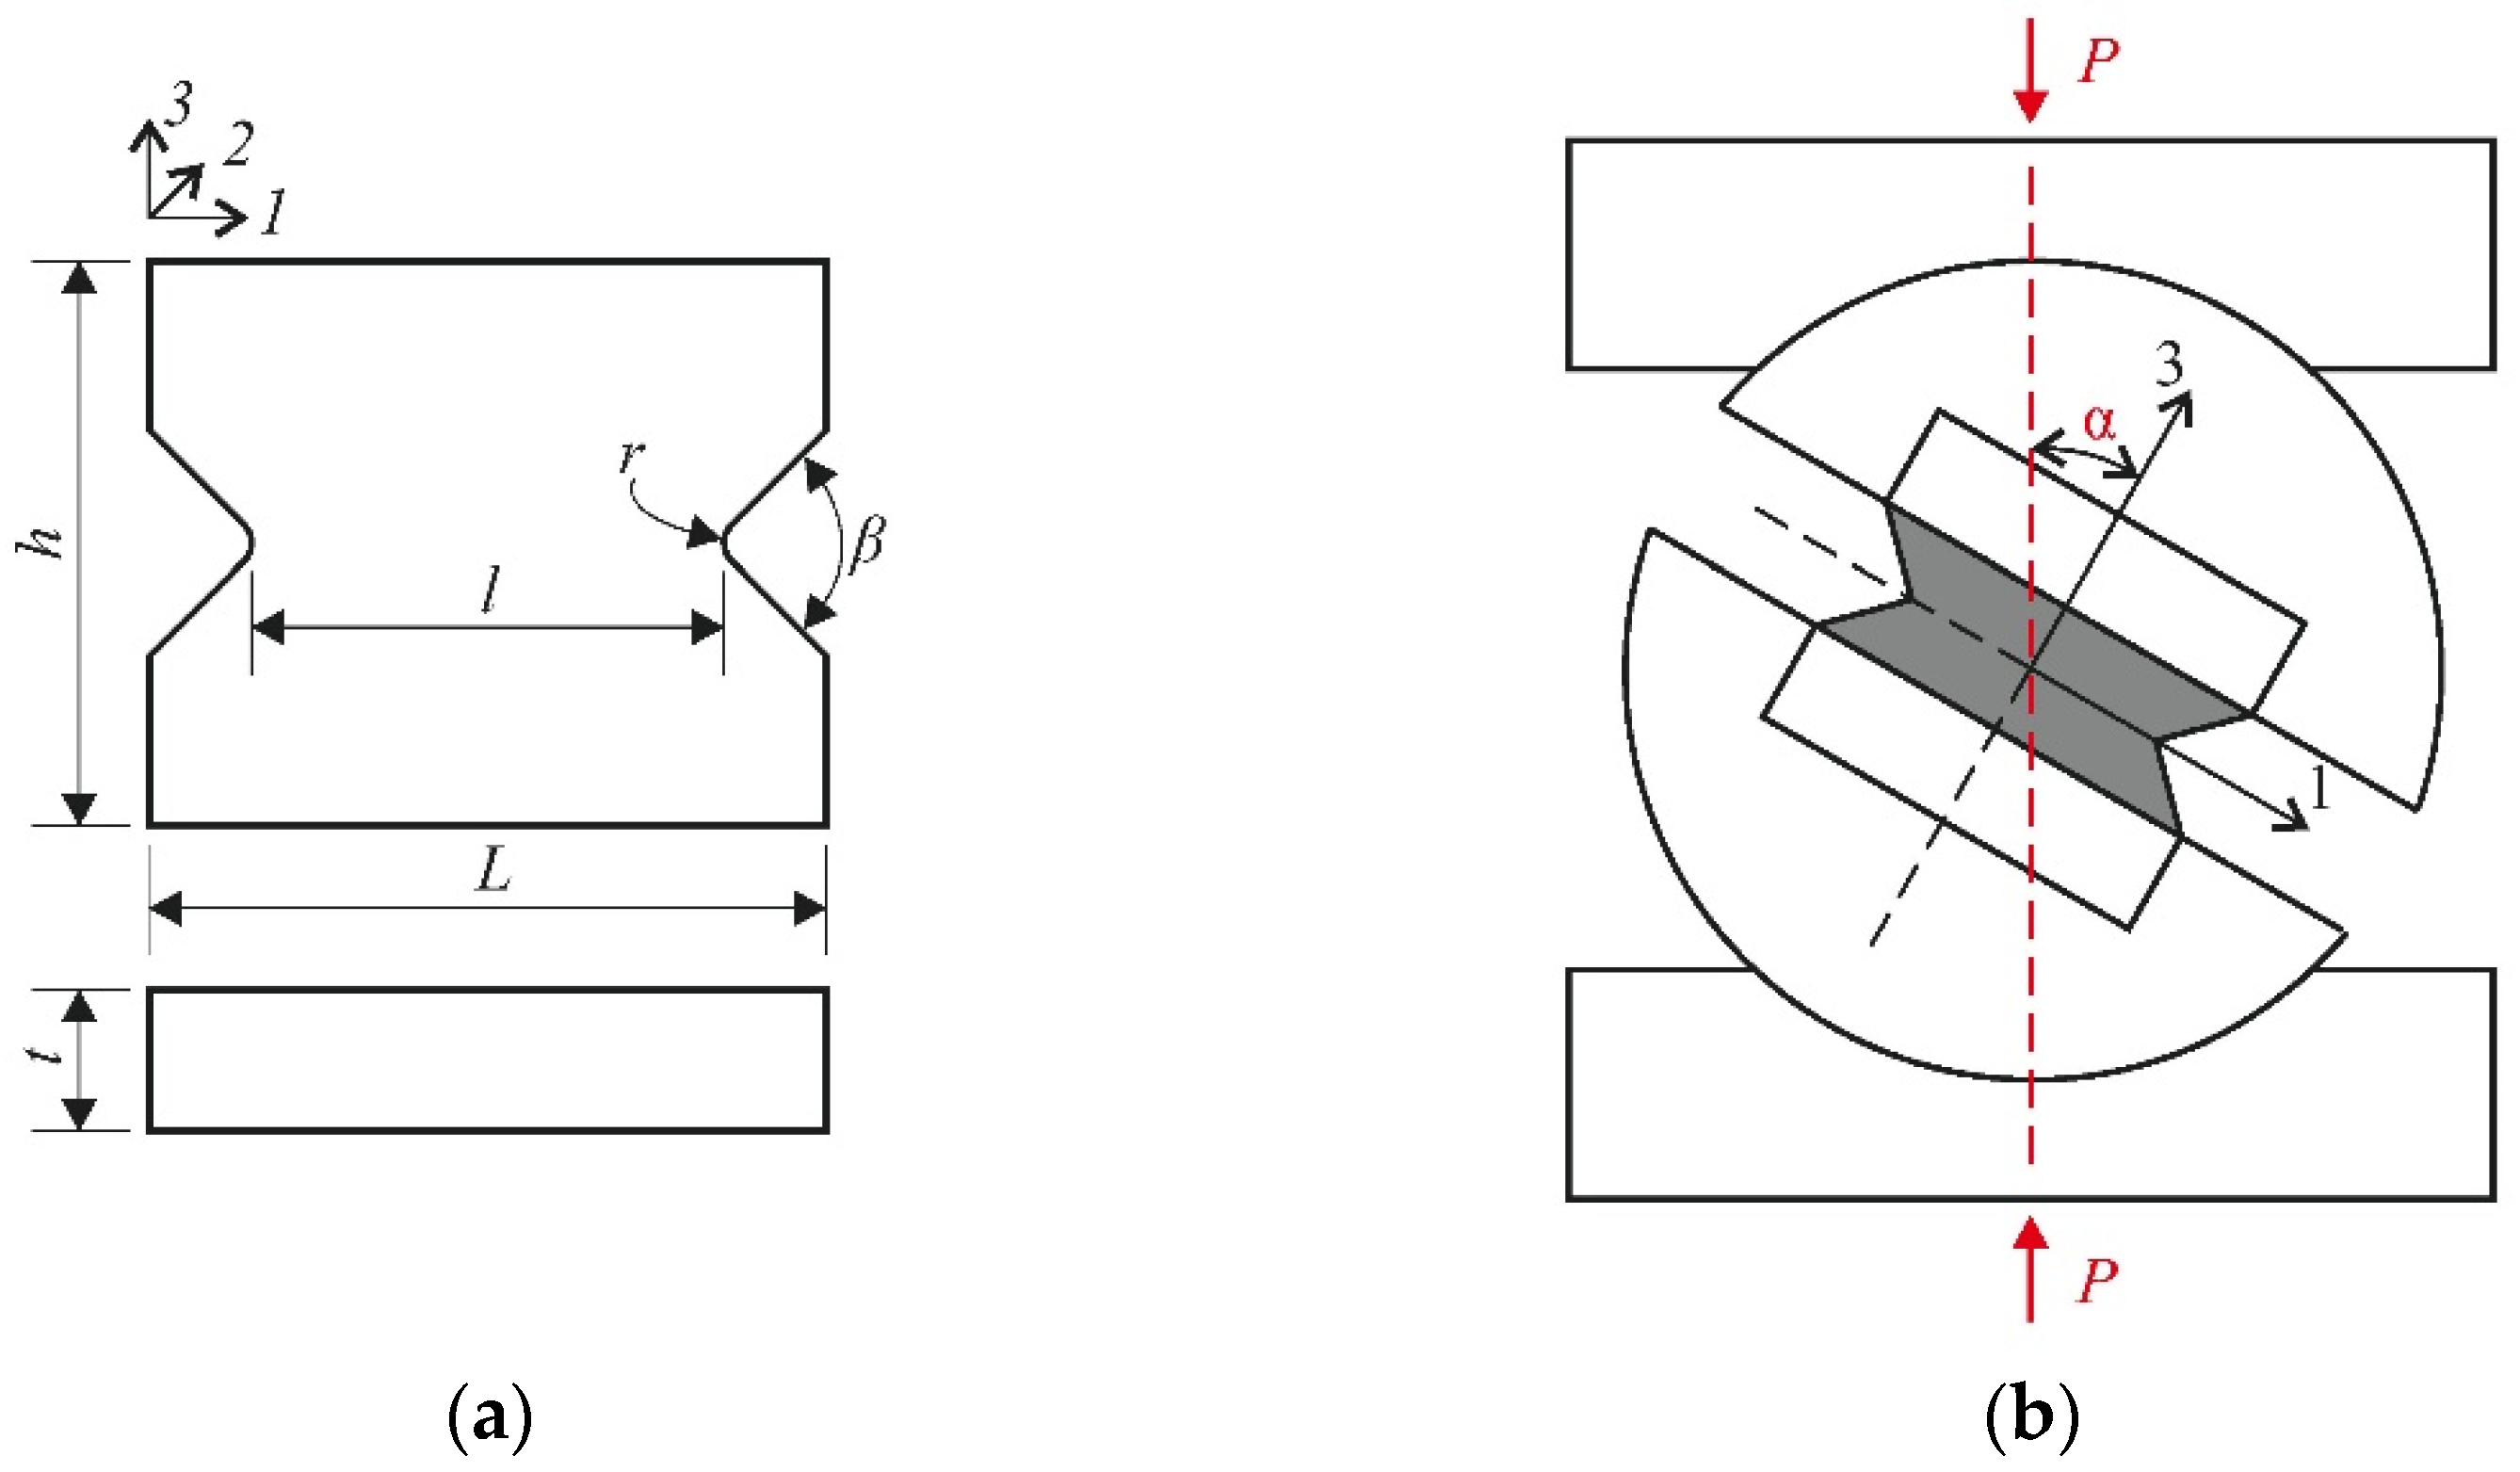
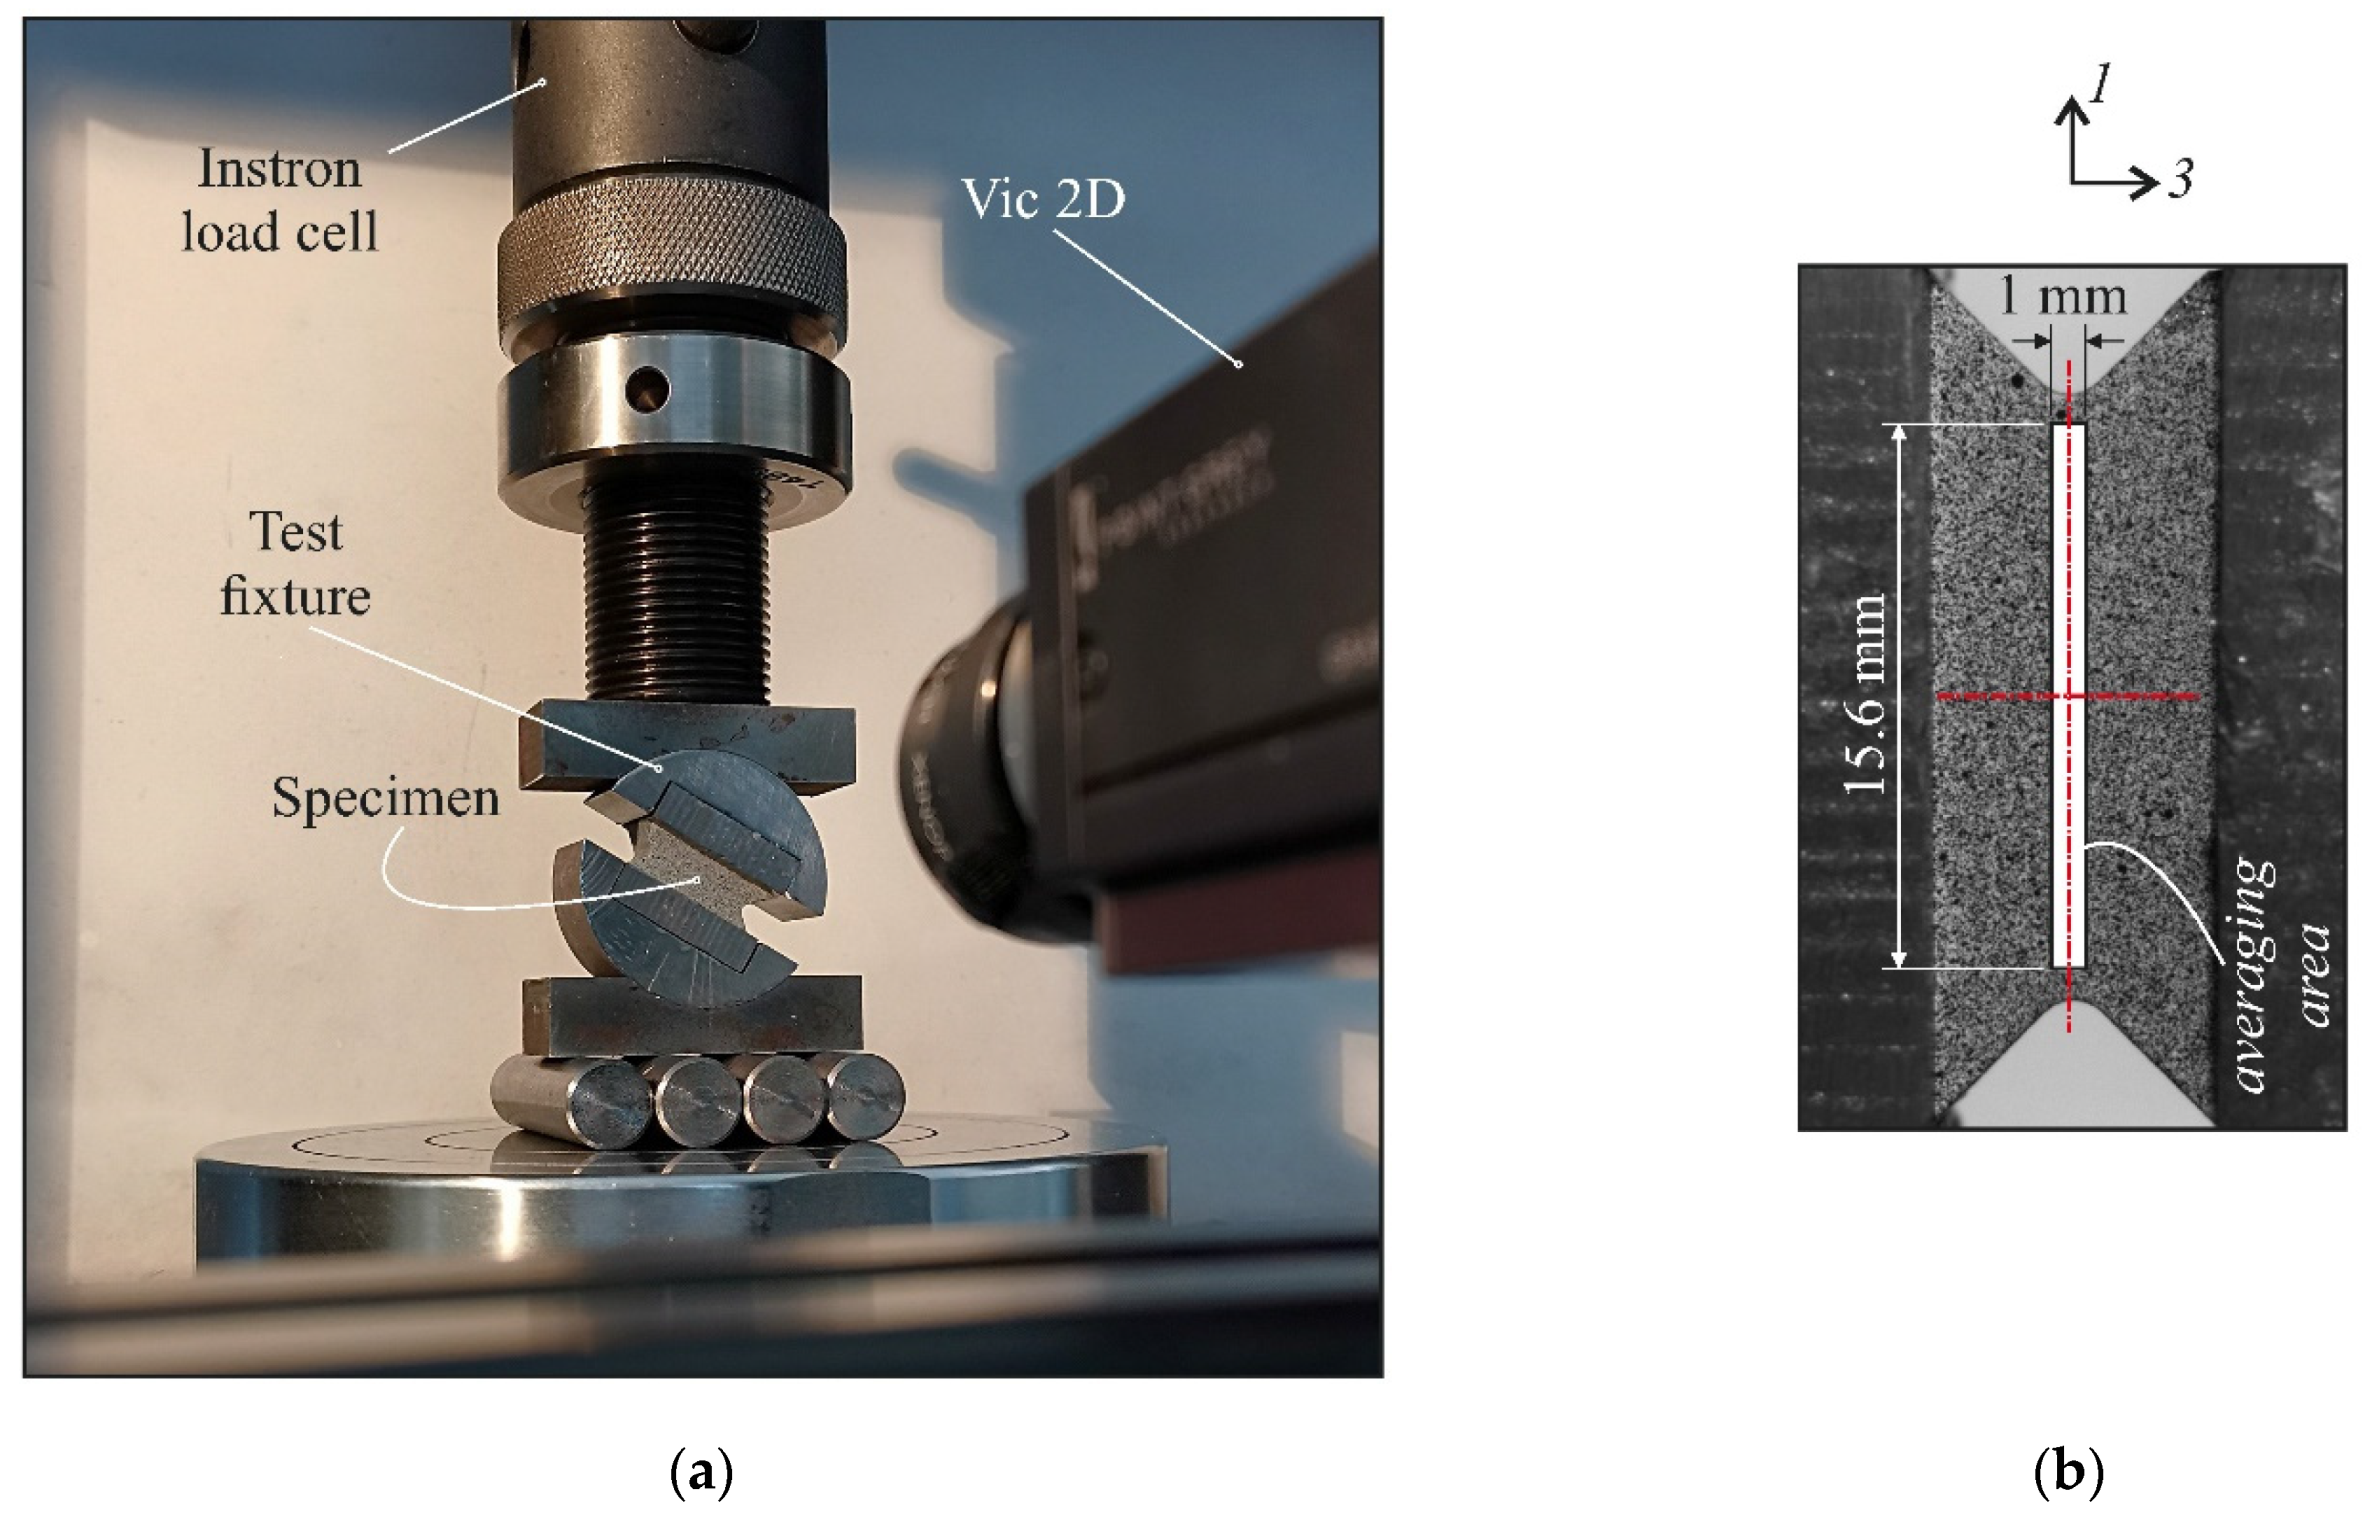
2.1. Experimental Setup and Design of the Specimen
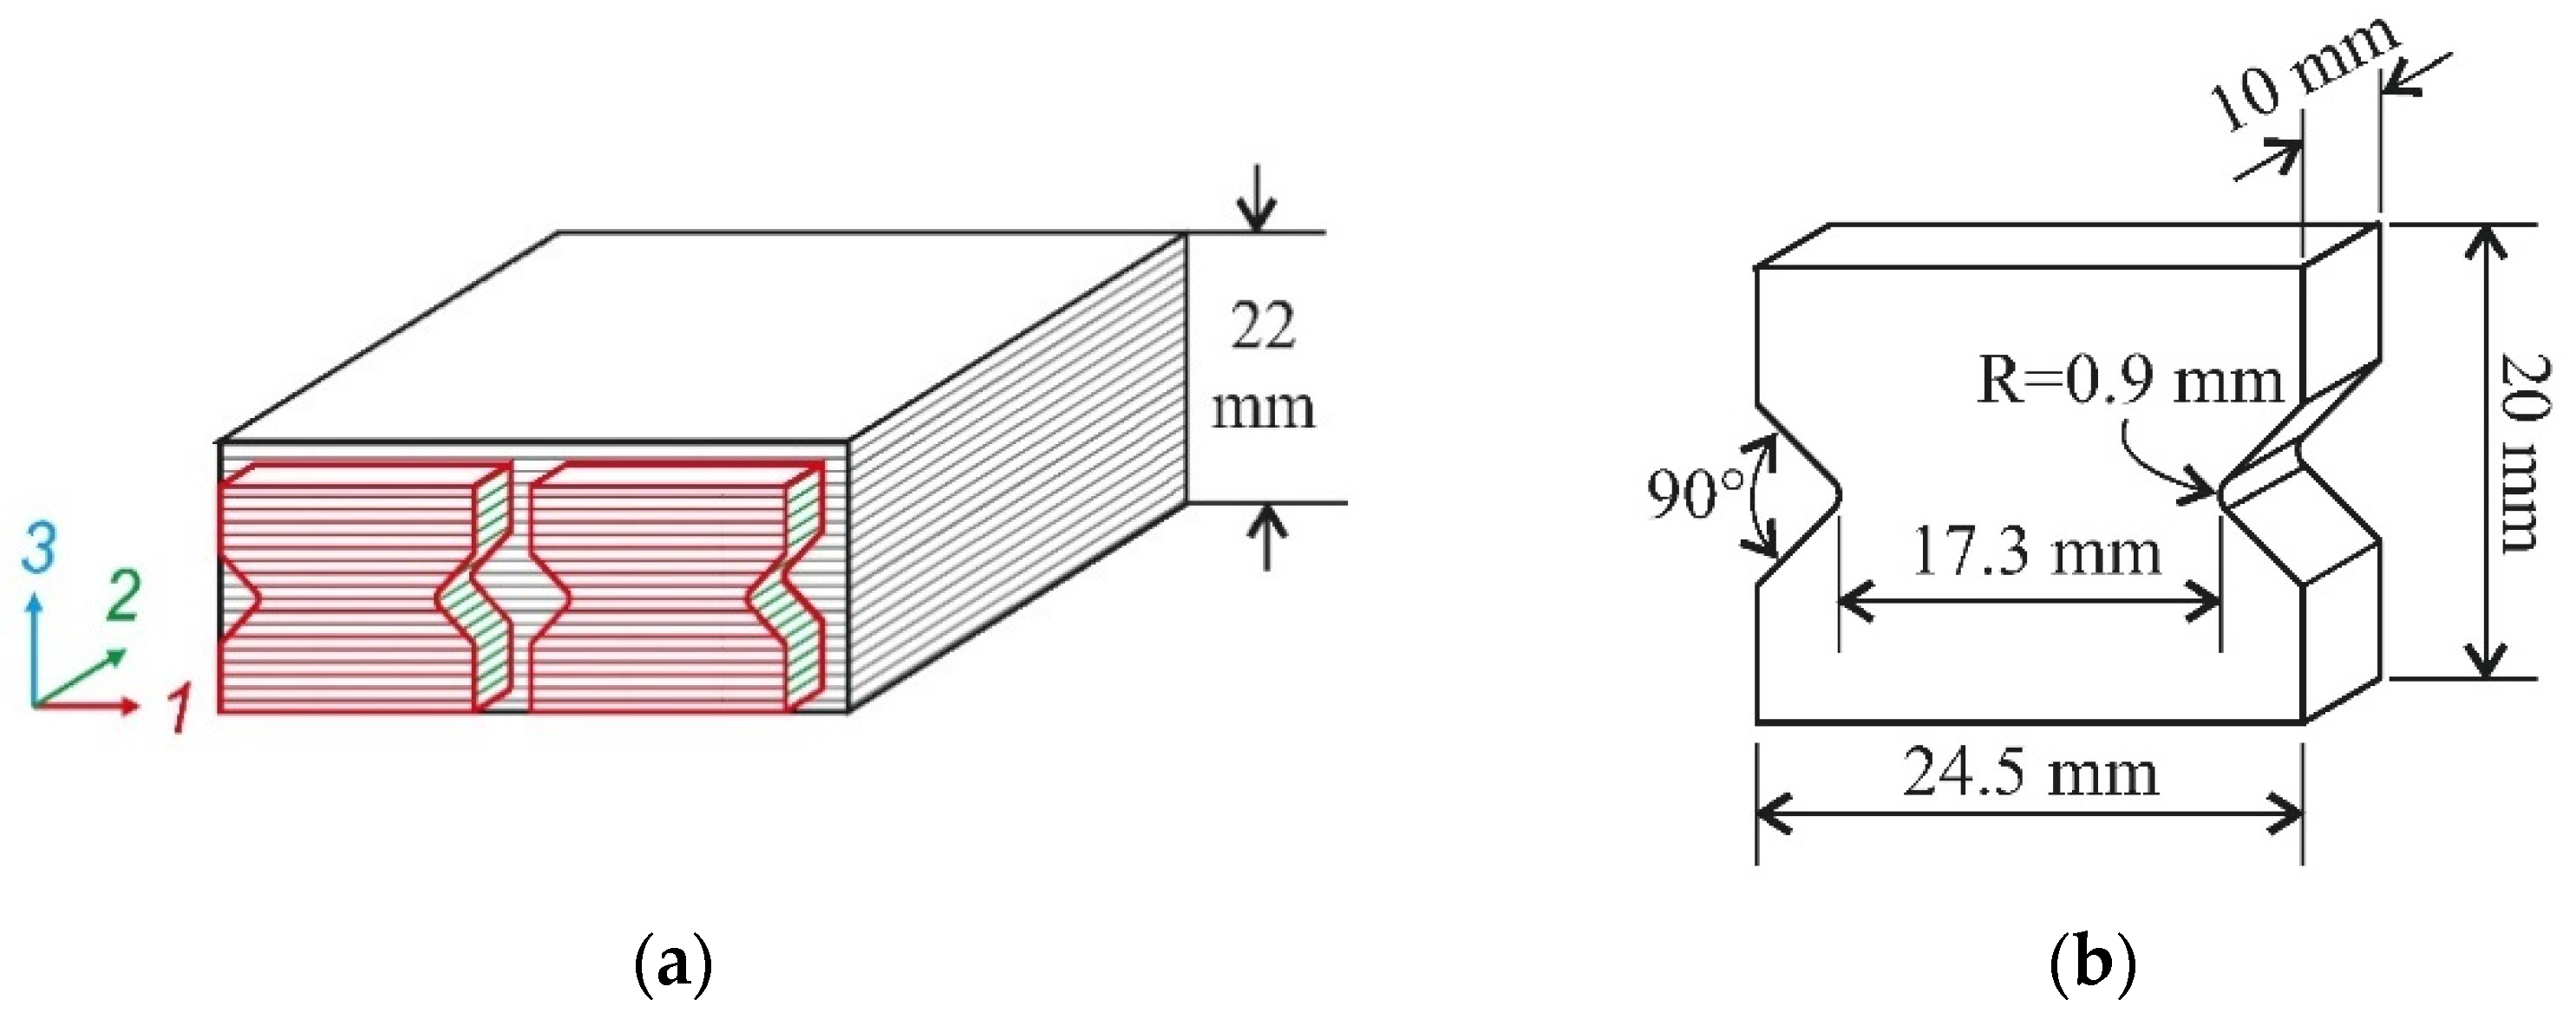
2.2. Materials and Specimens
2.3. Numerical Model
2.4. Test Procedure
3. Results and Discussion
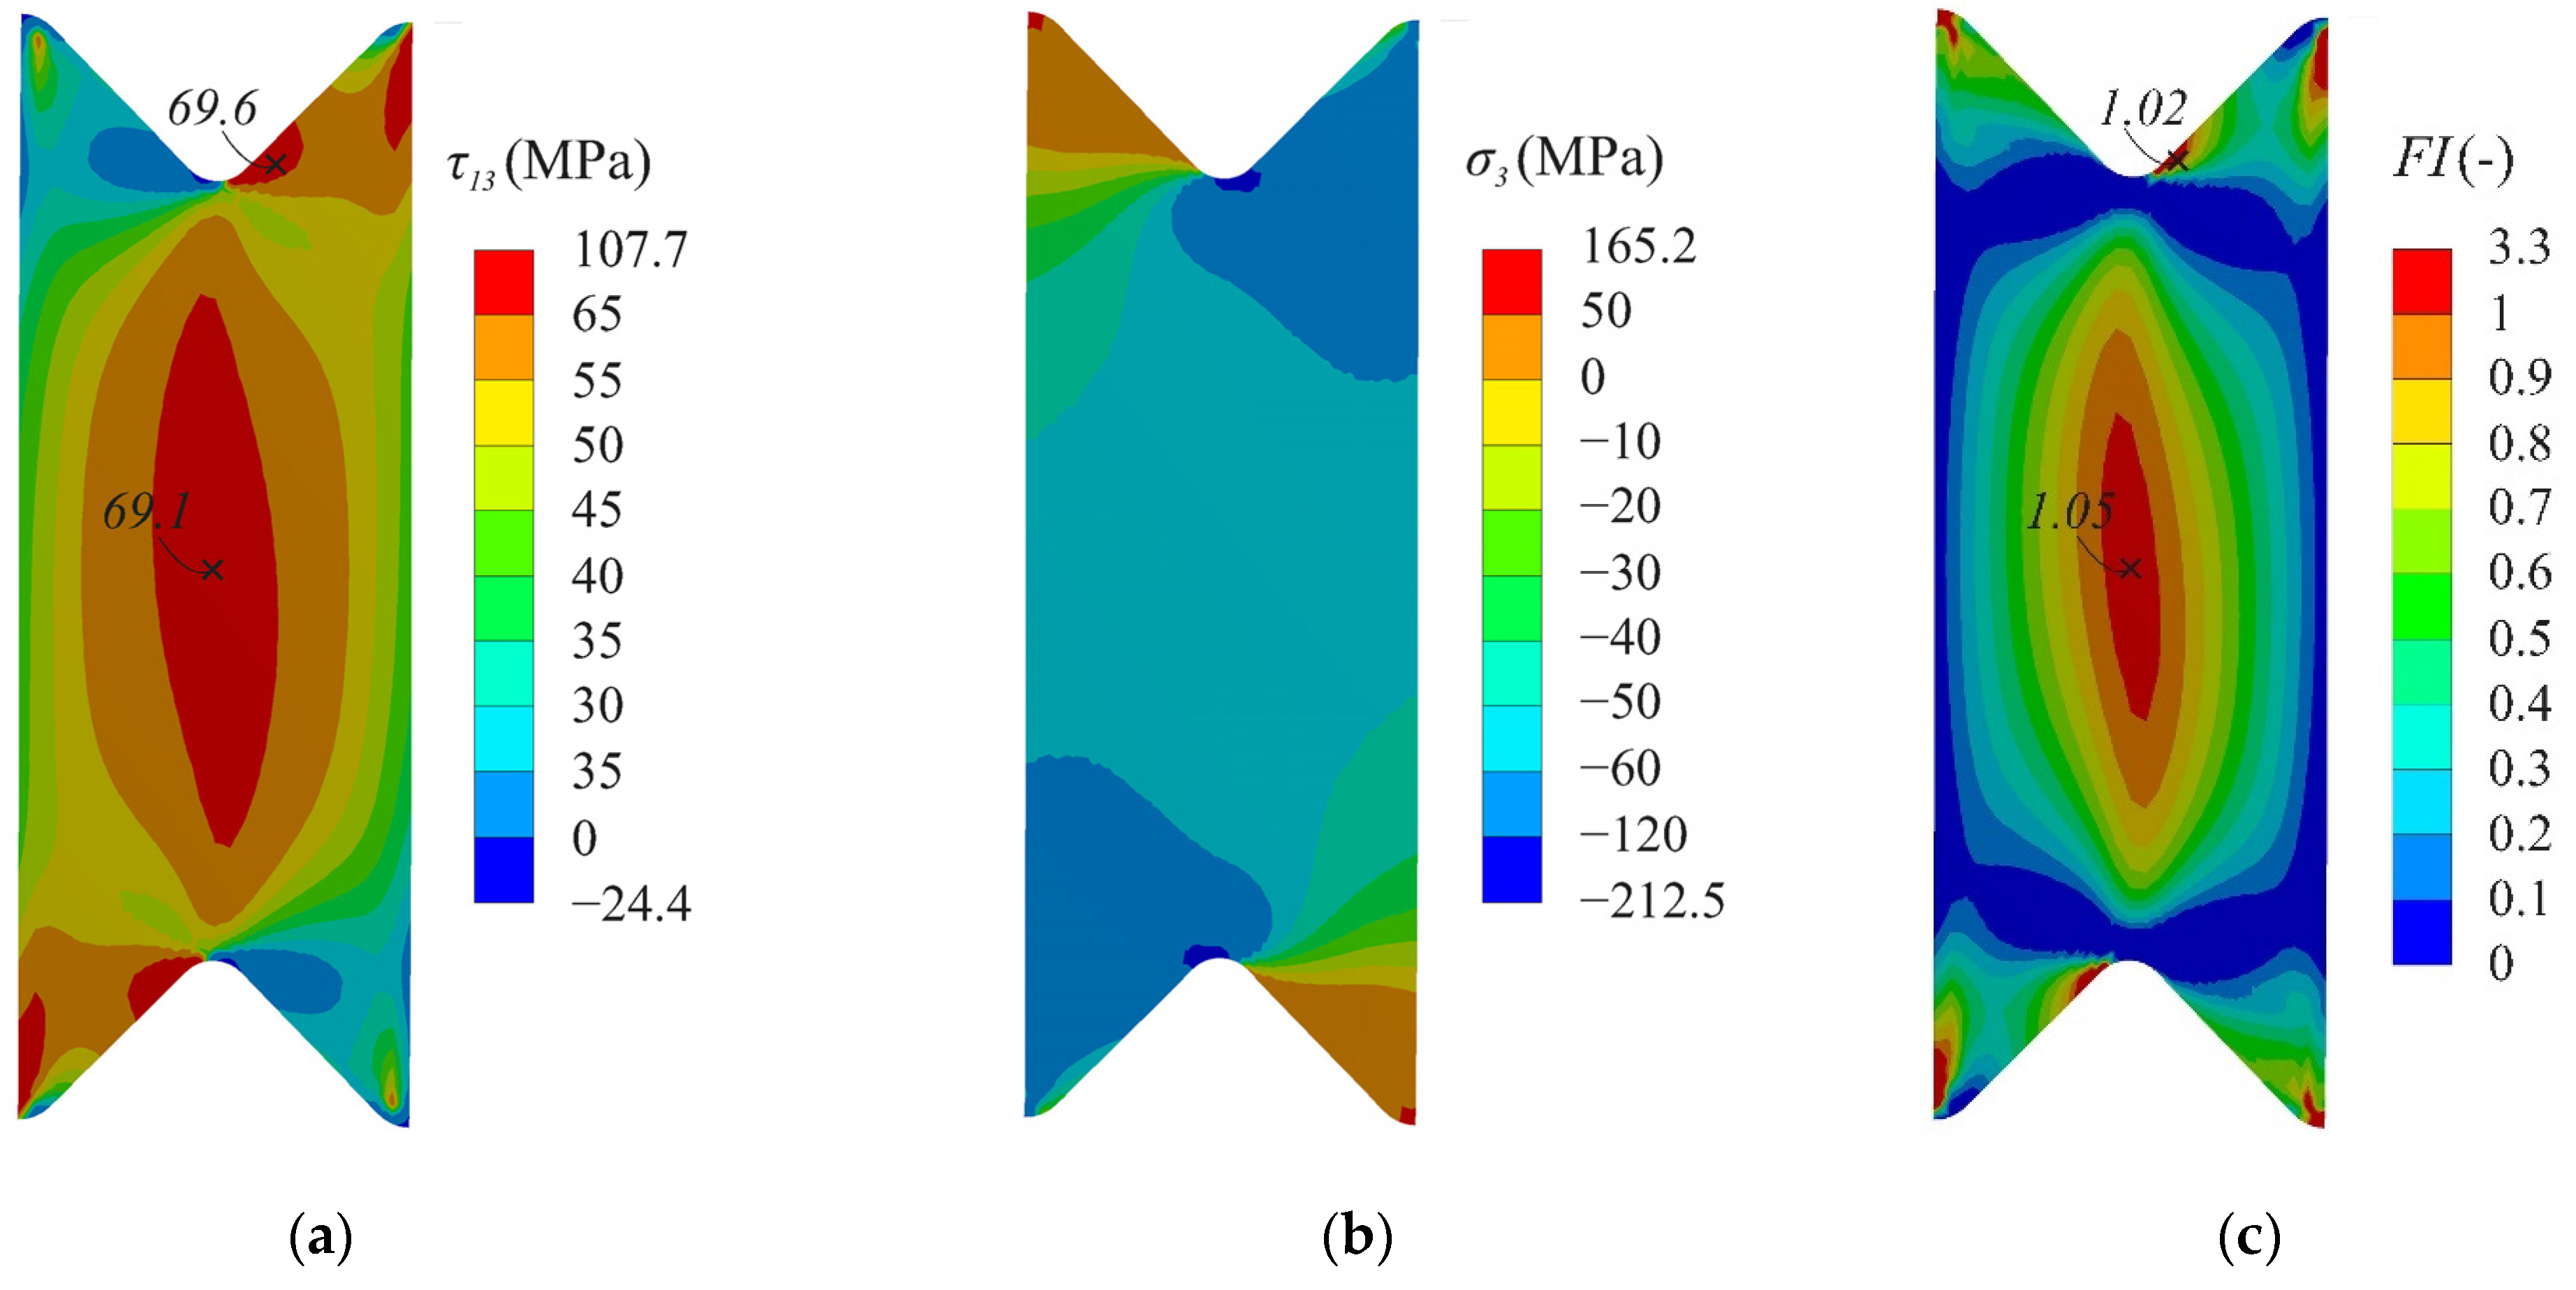
3.1. Numerical Analysis
3.2. Failure and Strain Distribution Analysis
3.3. Analysis of Stress–Strain Response
3.4. Analysis of Strength Properties
4. Conclusions
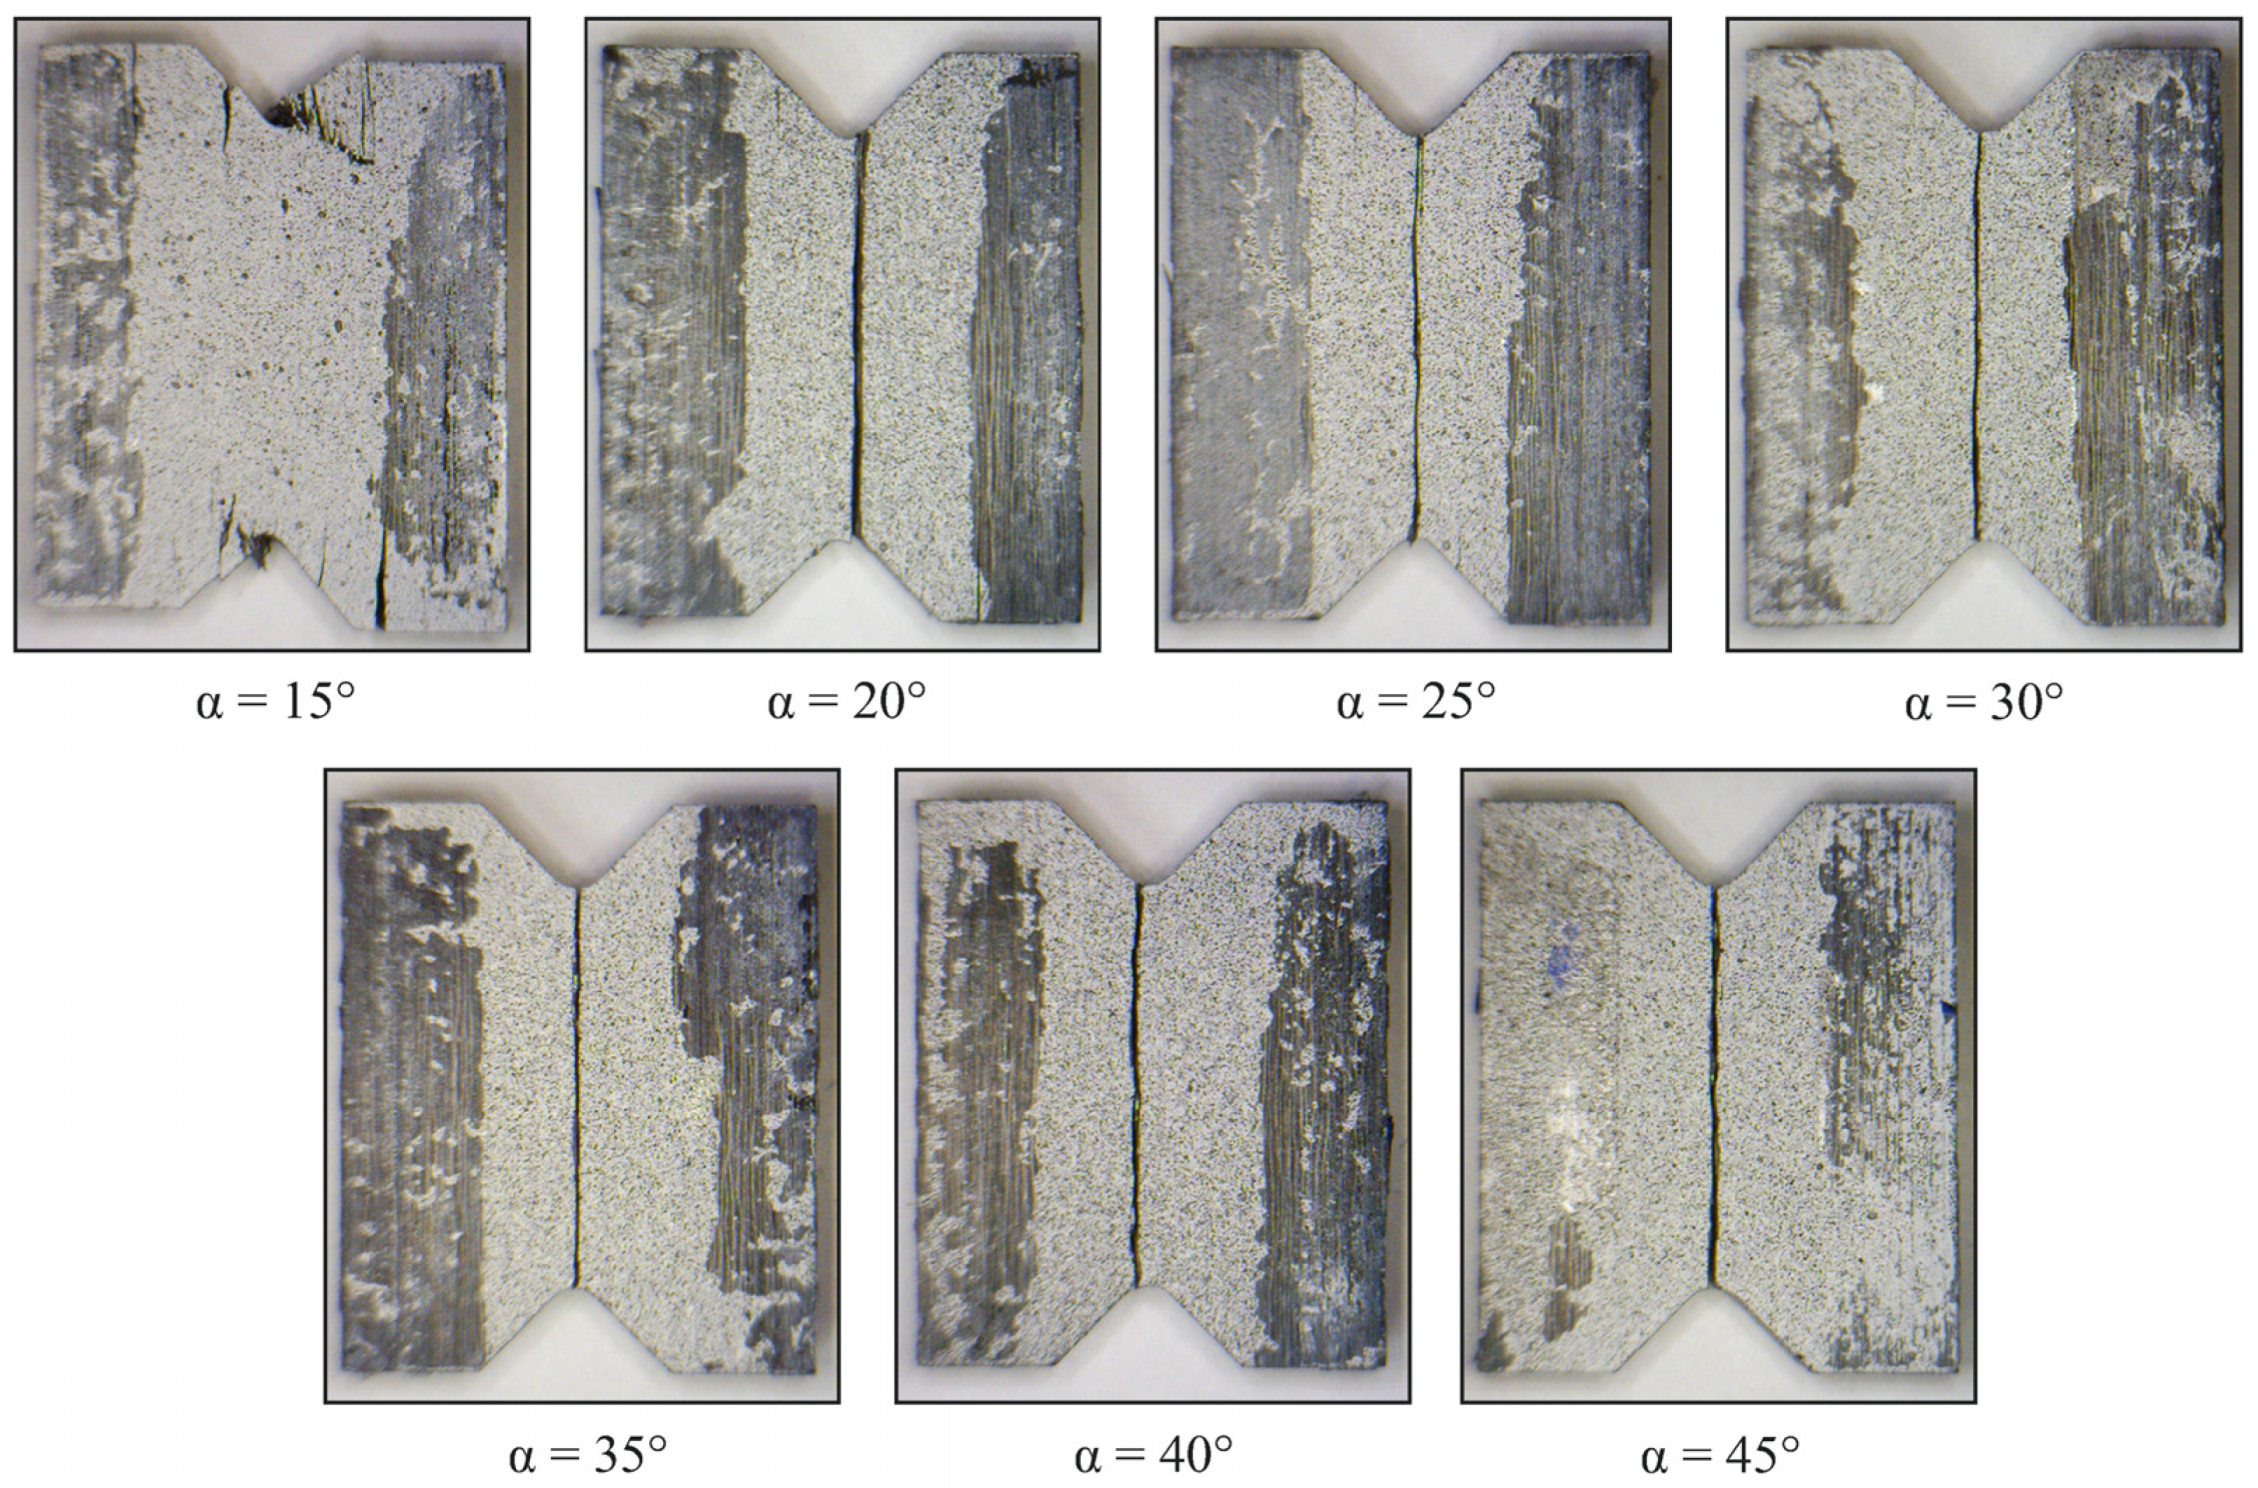
- The range of α = 20–45° corresponded to delamination in the gauge section of the specimen. The fracture mechanism changed at loading angles of 15° or less.
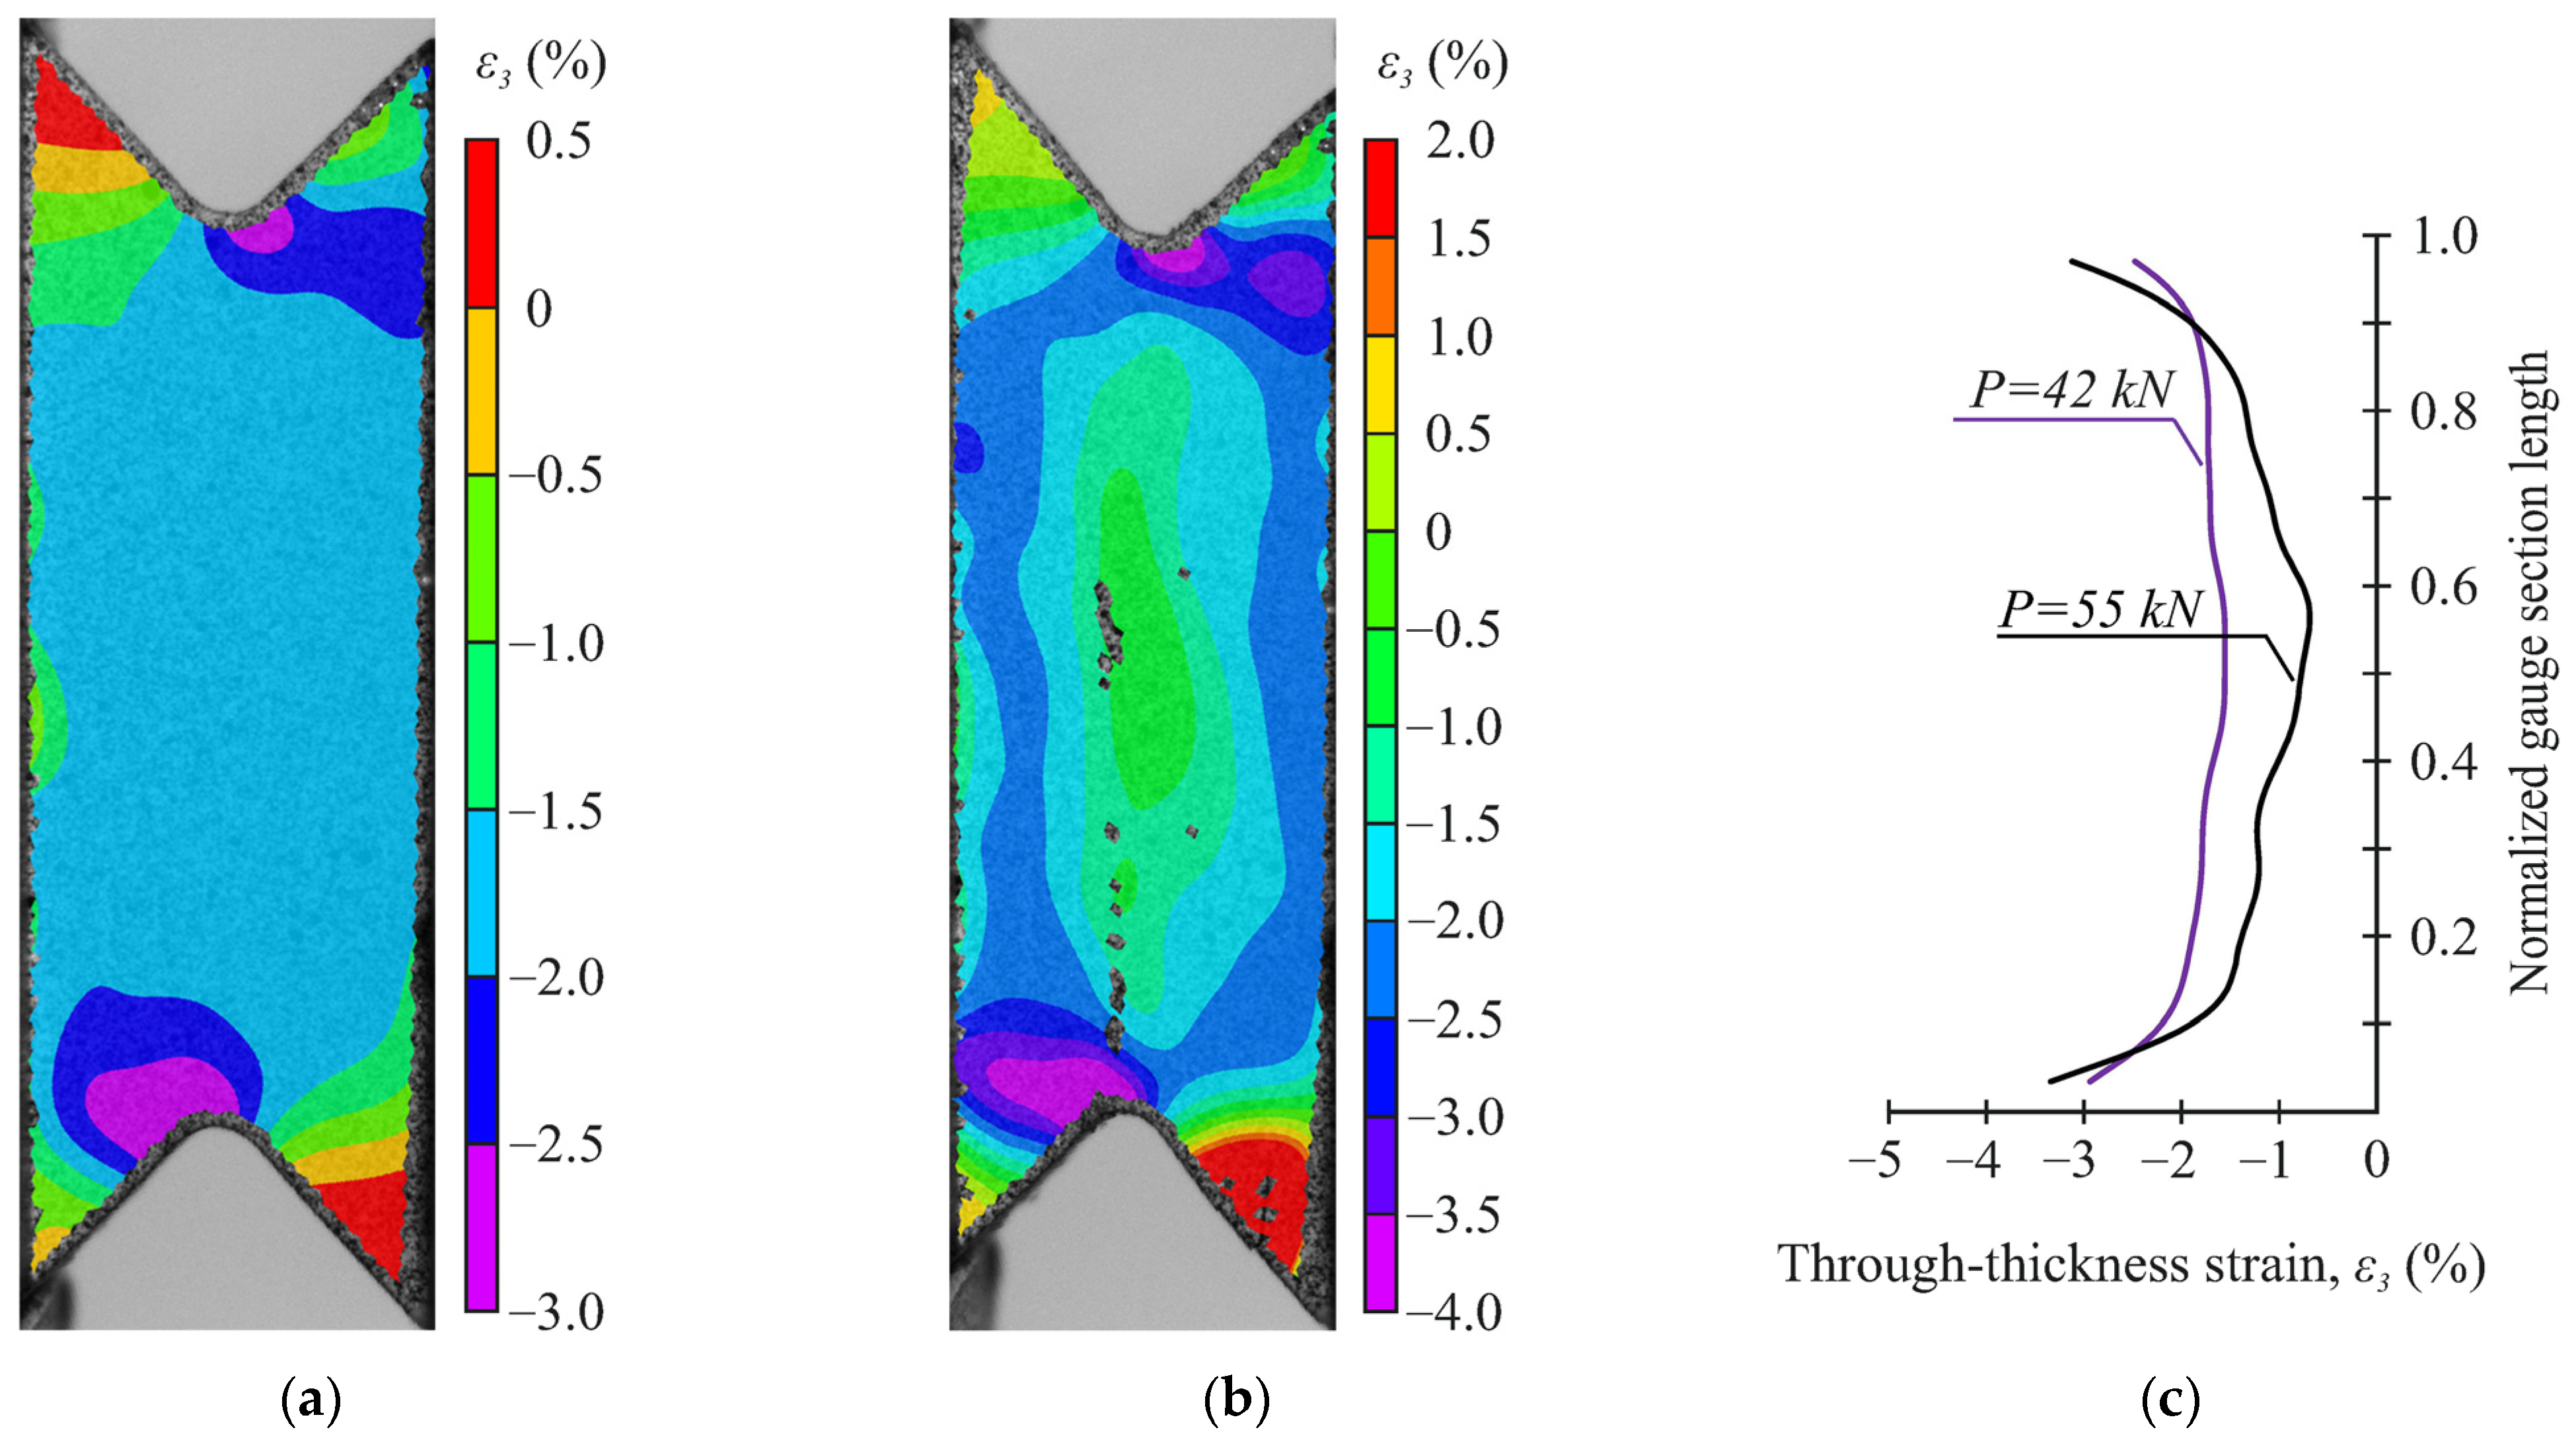
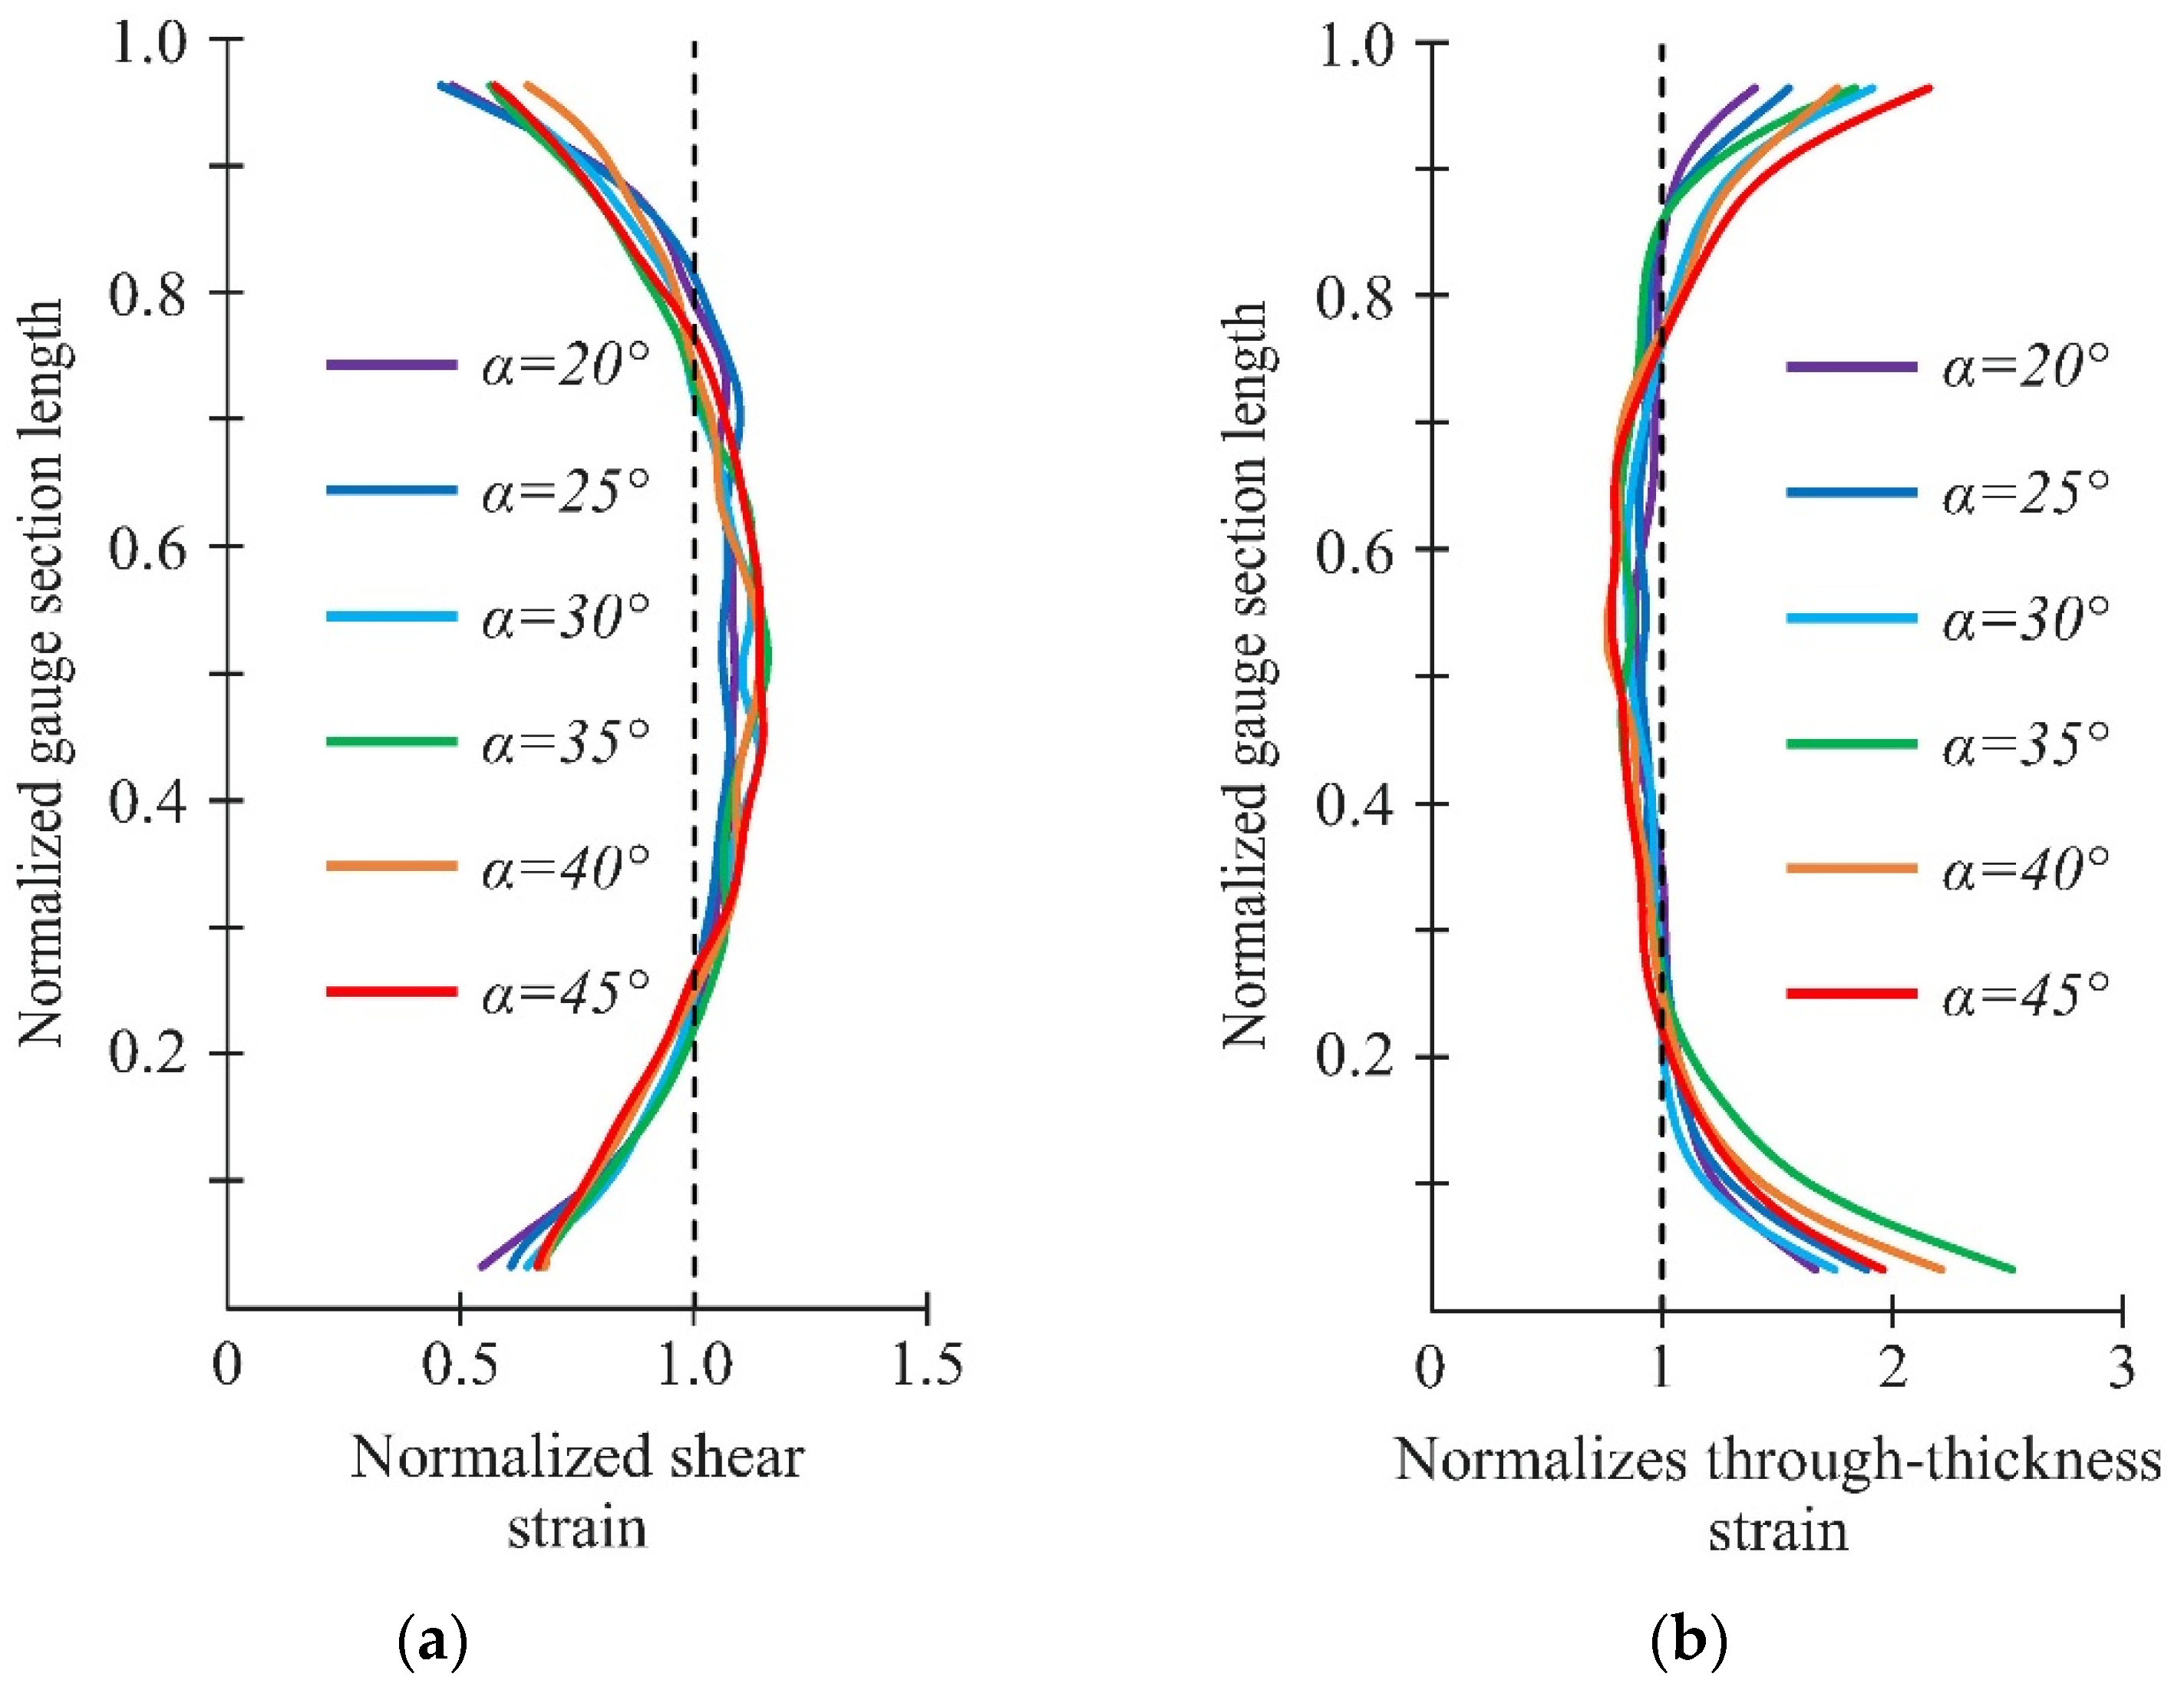
- At angles α < 35°, the through-thickness strains were uniformly distributed over the gauge section at the elastic deformation stage of the specimen. With further load increases, a significant decrease in the through-thickness compressive strain was observed in the central part of the gauge section before failure due to damage accumulation.
- The interlaminar shear modulus and the through-thickness compressive modulus insignificantly changed under different compression-shear loadings. The average values of these parameters were 3.5 GPa and 13 GPa, respectively.
- The value of the maximum compression strain on the stress–strain curve at α = 20–30° corresponded to the moment at which composite structure discontinuity occurred.
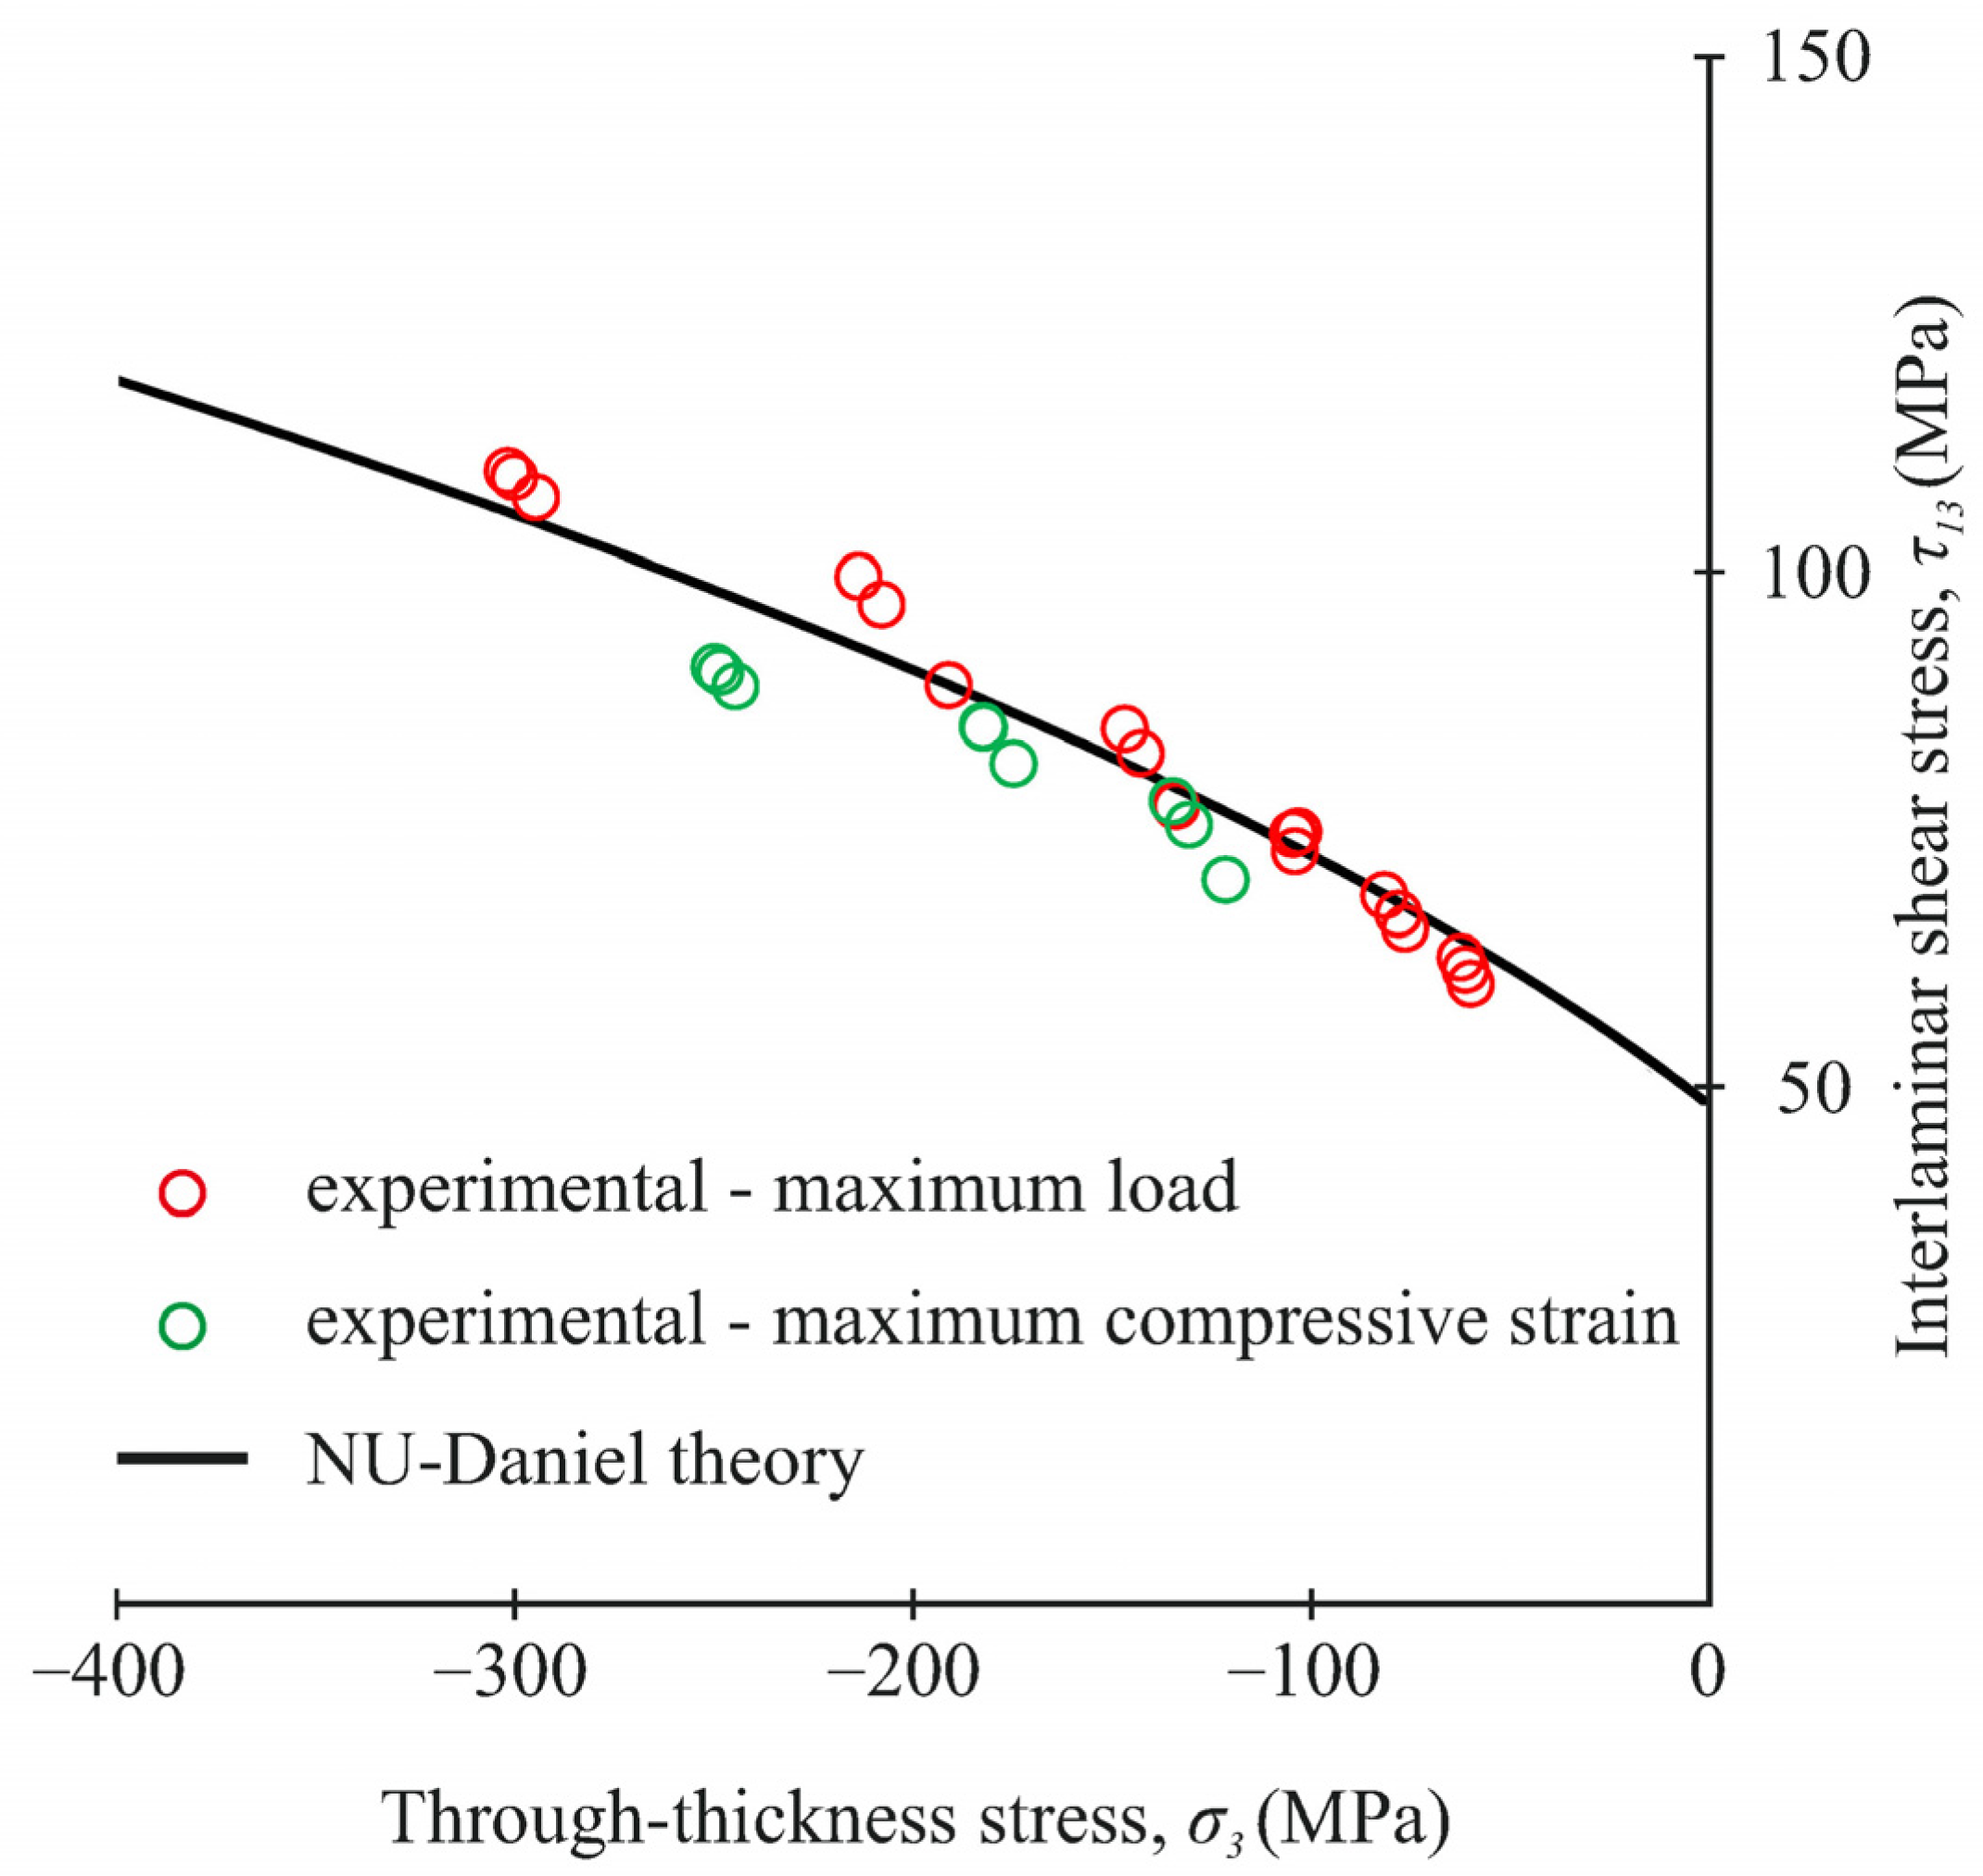
- With the increase in through-thickness compression stresses, the difference between the shear strength values, determined by the maximum load and the maximum compressive strain, increased up to 20% at the loading angle α = 20°.
Author Contributions
Funding
Institutional Review Board Statement
Informed Consent Statement
Data Availability Statement
Conflicts of Interest
References
- Liu, H.; Falzon, B.G.; Tan, W. Experimental and numerical studies on the impact response of damage-tolerant hybrid unidirectional/woven carbon-fibre reinforced composite laminates. Compos. Part B Eng. 2018, 136, 101–118. [Google Scholar] [CrossRef] [Green Version]
- Li, C.; Yin, X.; Liu, Y.; Guo, R.; Xian, G. Long-term service evaluation of a pultruded carbon/glass hybrid rod exposed to elevated temperature, hydraulic pressure and fatigue load coupling. Int. J. Fatigue 2020, 134, 105480. [Google Scholar] [CrossRef]
- Lomakin, E.V.; Fedulov, B.N. Nonlinear anisotropic elasticity for laminate composites. Meccanica 2015, 50, 1527–1535. [Google Scholar] [CrossRef]
- Sapozhnikov, S.B.; Cheremnykh, S.I. The strength of fibre-reinforced polymer under a complex loading. J. Compos. Mater. 2013, 47, 2525–2552. [Google Scholar] [CrossRef]
- Schaefer, J.D.; Daniel, I.M. Strain-rate-dependent yield criteria for progressive failure analysis of composite laminates based on the northwestern failure theory. Exp. Mech. 2018, 58, 487–497. [Google Scholar] [CrossRef]
- Swanson, S.R.; Messick, M.J.; Tian, Z. Failure of carbon/epoxy lamina under combined stress. J. Compos. Mater. 1987, 21, 619–630. [Google Scholar] [CrossRef]
- Makeev, A.; Ignatius, C.; He, Y.; Shonkwiler, B. A test method for assessment of shear properties of thick composites. J. Compos. Mater. 2009, 43, 3091–3105. [Google Scholar] [CrossRef]
- DeTeresa, S.J.; Freeman, D.C.; Groves, S.E. The effects of through-thickness compression on the interlaminar shear response of laminated fiber composites. J. Compos. Mater. 2004, 38, 681–697. [Google Scholar] [CrossRef]
- Guseinov, K.; Kudryavtsev, O.A.; Sapozhnikov, S.B. Effectiveness of 2-D and 3-D modelling of dovetail joint of composite fan blade for choosing rational reinforcement schemes. PNRPU Mech. Bull. 2021, 1, 5–11. [Google Scholar] [CrossRef]
- Daniel, I.M. Failure of composite materials. Strain 2007, 43, 4–12. [Google Scholar] [CrossRef]
- Daniel, I.M.; Luo, J.J.; Schubel, P.M. Three-dimensional characterization of textile composites. Compos. Part B Eng. 2008, 39, 13–19. [Google Scholar] [CrossRef]
- Christensen, R.M.; DeTeresa, S.J. Delamination failure investigation for out-of-plane loading in laminates. J. Compos. Mater. 2004, 38, 2231–2238. [Google Scholar] [CrossRef] [Green Version]
- Puck, A.; Schürmann, H. Failure analysis of FRP laminates by means of physically based phenomenological models. Compos. Sci. Technol. 2002, 62, 1633–1662. [Google Scholar] [CrossRef]
- Bazhenov, S.L.; Kozey, V.V. Transversal compression fracture of unidirectional fibre-reinforced plastics. J. Mater. Sci. 1991, 26, 2677–2684. [Google Scholar] [CrossRef]
- Chatterjee, S.N. A Coulomb-Mohr type criterion for matrix mode failure in a lamina. In ASTM Special Technical Publication; ASTM: West Conshohocken, PA, USA, 1997; Volume 1242, pp. 237–256. [Google Scholar]
- Wolf, C.H.; Böcker, M.; Düreth, C.; Ackermann, S.; Henkel, S.; Thieme, M.; Böhm, R.; Koch, I.; Gude, M.; Biermann, H.; et al. Development of a novel testing device for fabric reinforced carbon fibre composites under cyclic biaxial load applications. In IOP Conference Series: Materials Science and Engineering; IOP Publishing: Bristol, UK, 2018; Volume 388, p. 012019. [Google Scholar]
- Gan, K.W.; Hallett, S.R.; Wisnom, M.R. Measurement and modelling of interlaminar shear strength enhancement under moderate through-thickness compression. Compos. Part A Appl. Sci. Manuf. 2013, 49, 18–25. [Google Scholar] [CrossRef]
- Horta Muñoz, S.; Serna Moreno, M.D.C. Advances in Cruciform Biaxial Testing of Fibre-Reinforced Polymers. Polymers 2022, 14, 686. [Google Scholar] [CrossRef]
- Koerber, H.; Xavier, J.; Camanho, P.P. High strain rate characterisation of unidirectional carbon-epoxy IM7-8552 in transverse compression and in-plane shear using digital image correlation. Mech. Mater. 2010, 42, 1004–1019. [Google Scholar] [CrossRef]
- Cui, H.; Melro, A.R.; Yasaee, M. Inter-fibre failure of through-thickness reinforced laminates in combined transverse compression and shear load. Compos. Sci. Technol. 2018, 165, 48–57. [Google Scholar] [CrossRef] [Green Version]
- Gan, K.W.; Laux, T.; Taher, S.T.; Dulieu-Barton, J.M.; Thomsen, O.T. A novel fixture for determining the tension/compression-shear failure envelope of multidirectional composite laminates. Compos. Struct. 2018, 184, 662–673. [Google Scholar] [CrossRef] [Green Version]
- Hao, P.; Din, I.U.; Panier, S. Development of Modified Arcan Fixture for biaxial loading response of fiber-reinforced composites. Polym. Test. 2019, 80, 106148. [Google Scholar] [CrossRef]
- Din, I.U.; Hao, P.; Panier, S.; Khan, K.; Aamir, M.; Franz, G.; Akhtar, K. Design of a new Arcan fixture for in-plane pure shear and combined normal/shear stress characterization of fiber reinforced polymer composites. Exp. Tech. 2020, 44, 231–240. [Google Scholar] [CrossRef]
- Sutton, M.A.; McNeill, S.R.; Helm, J.D.; Chao, Y.J. Advances in two-dimensional and three-dimensional computer vision. In Photomechanics; Springer: Berlin/Heidelberg, Germany, 2000; pp. 323–372. [Google Scholar]
- Pan, B.; Qian, K.; Xie, H.; Asundi, A. Two-dimensional digital image correlation for in-plane displacement and strain measurement: A review. Meas. Sci. Technol. 2009, 20, 062001. [Google Scholar] [CrossRef]
- Düreth, C.; Weck, D.; Böhm, R.; Thieme, M.; Gude, M.; Henkel, S.; Wolf, C.H.; Biermann, H. Determining the Damage and Failure Behaviour of Textile Reinforced Composites under Combined In-Plane and Out-of-Plane Loading. Material 2020, 13, 4772. [Google Scholar] [CrossRef] [PubMed]
- ASTM D5379/D5379M-12; Standard Test Method for Shear Properties of Composite Materials by the V-Notched Beam Method. ASTM: West Conshohocken, PA, USA, 2019.
- Arcan, M.; Hashin, Z.; Voloshin, A. A method to produce uniform plane-stress states with applications to fiber-reinforced materials. Exp. Mech. 1978, 18, 141–146. [Google Scholar] [CrossRef]
- Stojcevski, F.; Hilditch, T.; Henderson, L.C. A modern account of Iosipescu testing. Compos. Part A Appl. Sci. Manuf. 2018, 107, 545–554. [Google Scholar] [CrossRef]
- Gning, P.B.; Delsart, D.; Mortier, J.; Coutellier, D. Through-thickness strength measurements using Arcan’s method. Compos. Part B Eng. 2010, 41, 308–316. [Google Scholar] [CrossRef]
- Hinton, M.J.; Soden, P.D.; Kaddour, A.S. Failure Criteria in Fibre Reinforced Polymer Composites: The World-Wide Failure Exercise; Elsevier: Amsterdam, The Netherlands, 2004. [Google Scholar]
- Kaddour, A.S.; Hinton, M.J. Input data for test cases used in benchmarking triaxial failure theories of composites. J. Compos. Mater. 2012, 46, 2295–2312. [Google Scholar] [CrossRef]
- Abot, J.L.; Gabbai, R.D.; Harsley, K. Effect of woven fabric architecture on interlaminar mechanical response of composite materials: An experimental study. J. Reinf. Plast. Compos. 2011, 30, 2003–2014. [Google Scholar] [CrossRef]
- Zou, Z.; Lee, H. A cohesive zone model taking account of the effect of through-thickness compression. Compos. Part A Appl. Sci. Manuf. 2017, 98, 90–98. [Google Scholar] [CrossRef] [Green Version]
- Laux, T.; Gan, K.W.; Tavares, R.P.; Furtado, C.; Arteiro, A.; Camanho, P.P.; Thomsen, O.T.; Dulieu-Barton, J.M. Modelling damage in multidirectional laminates subjected to multi-axial loading: Ply thickness effects and model assessment. Compos. Struct. 2021, 266, 113766. [Google Scholar] [CrossRef]
- Li, X.; Hallett, S.R.; Wisnom, M.R. Predicting the effect of through-thickness compressive stress on delamination using interface elements. Compos. Part A Appl. Sci. Manuf. 2008, 39, 218–230. [Google Scholar] [CrossRef]
- Vyas, G.M.; Pinho, S.T. Computational implementation of a novel constitutive model for multidirectional composites. Comput. Mater. Sci. 2012, 51, 217–224. [Google Scholar] [CrossRef]
- Laux, T.; Gan, K.W.; Dulieu-Barton, J.; Thomsen, O.T. A simple nonlinear constitutive model based on non-associative plasticity for UD composites: Development and calibration using a Modified Arcan Fixture. Int. J. Solids Struct. 2019, 162, 135–147. [Google Scholar] [CrossRef] [Green Version]
- Bru, T.; Olsson, R.; Gutkin, R.; Vyas, G.M. Use of the Iosipescu test for the identification of shear damage evolution laws of an orthotropic composite. Compos. Struct. 2017, 174, 319–328. [Google Scholar] [CrossRef]
- ASTM D2344/2344M-16; Standard Test Method for Short-Beam Strength of Polymer Matrix Composite Materials and Their Laminates. ASTM: West Conshohocken, PA, USA, 2016.


| Material Parameters | Value |
|---|---|
| Warp modulus E1 (GPa) | 69.4 [26] |
| Weft modulus E2 (GPa) | 69.4 [26] |
| Through-thickness modulus E3 (GPa) | 11.5 [26] |
| In-plane shear modulus G12 (GPa) | 5.0 [26] |
| Interlaminar shear moduli G13 = G23 (GPa) | 3.4 [33] |
| Major Poisson’s ratio ν12 | 0.08 [26] |
| Through-thickness Poisson’s ratios ν13 = ν23 | 0.53 [26] |
| Through-thickness tensile strength F3t (MPa) | 63 [32] |
| Through-thickness compressive strength F3c (MPa) | 907 [26] |
| Interlaminar shear strength F13 (MPa) | 54.3 [33] |
| Camera | Point Grey GRAS 50S5M-C |
| Sensor | 8-bit, 2048 × 2048 px |
| Lenses | Schneider Kreuznach Xenoplan 1.4/17 |
| DIC Software | VIC 2D |
| Subset size | 13 × 13 px |
| Angle | Interlaminar Shear at Maximum Load | Interlaminar Shear at Maximum Compressive Strain | Through-Thickness Stresses at Maximum Load | Through-Thickness Stresses at Maximum Compressive Strain | Difference in Interlaminar Shear Stresses | Difference in Through-Thickness Stresses |
|---|---|---|---|---|---|---|
| 20 | 109.02 ± 1.01 | 90.34 ± 0.73 | 299.52 ± 2.78 | 248.2 ± 2.0 | 20.67 | 20.67 |
| 25 | 95.48 ± 4.1 | 84.1 ± 1.57 | 204.78 ± 8.8 | 180.34 ± 3.4 | 13.47 | 13.49 |
| 30 | 81.84 ± 2.79 | 74.79 ± 2.89 | 141.74 ± 4.83 | 129.54 ± 5.01 | 9.45 | 9.45 |
| 35 | 74.73 ± 0.8 | 104.47 ± 0.45 | - | - | ||
| 40 | 67.27 ± 1.12 | 79.24 ± 1.95 | - | - | ||
| 45 | 61.7 ± 0.87 | 61.7 ± 0.87 | - | - | ||
Publisher’s Note: MDPI stays neutral with regard to jurisdictional claims in published maps and institutional affiliations. |
© 2022 by the authors. Licensee MDPI, Basel, Switzerland. This article is an open access article distributed under the terms and conditions of the Creative Commons Attribution (CC BY) license (https://creativecommons.org/licenses/by/4.0/).
Share and Cite
Guseinov, K.; Kudryavtsev, O.; Bezmelnitsyn, A.; Sapozhnikov, S. Determination of Interlaminar Shear Properties of Fibre-Reinforced Composites under Biaxial Loading: A New Experimental Approach. Polymers 2022, 14, 2575. https://doi.org/10.3390/polym14132575
Guseinov K, Kudryavtsev O, Bezmelnitsyn A, Sapozhnikov S. Determination of Interlaminar Shear Properties of Fibre-Reinforced Composites under Biaxial Loading: A New Experimental Approach. Polymers. 2022; 14(13):2575. https://doi.org/10.3390/polym14132575
Chicago/Turabian StyleGuseinov, Kirill, Oleg Kudryavtsev, Alexander Bezmelnitsyn, and Sergei Sapozhnikov. 2022. "Determination of Interlaminar Shear Properties of Fibre-Reinforced Composites under Biaxial Loading: A New Experimental Approach" Polymers 14, no. 13: 2575. https://doi.org/10.3390/polym14132575
APA StyleGuseinov, K., Kudryavtsev, O., Bezmelnitsyn, A., & Sapozhnikov, S. (2022). Determination of Interlaminar Shear Properties of Fibre-Reinforced Composites under Biaxial Loading: A New Experimental Approach. Polymers, 14(13), 2575. https://doi.org/10.3390/polym14132575