
A Design of Experiments (DoE) Approach to Optimize Cryogel Manufacturing for Tissue Engineering Applications

 ,
,  ,
,  ,
, 

Abstract
:
1. Introduction
2. Materials and Methods
2.1. Materials
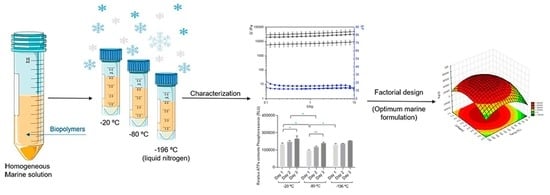
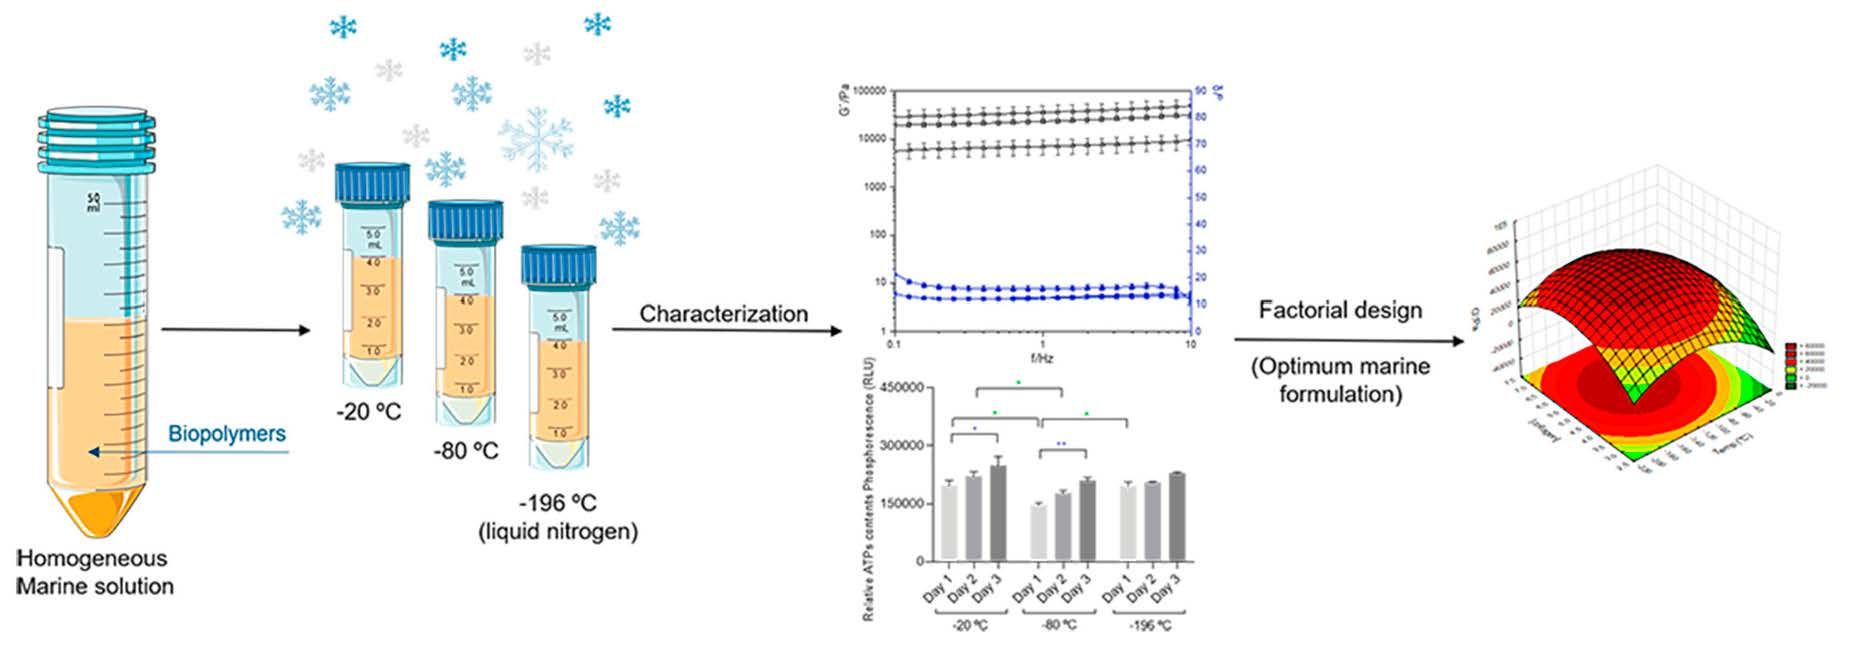
2.2. Marine Cryogel Preparation
2.3. Rheological Measurements
2.4. Antioxidant Assay
2.5. ATP Measurements
2.6. Statistics
3. Results and Discussion
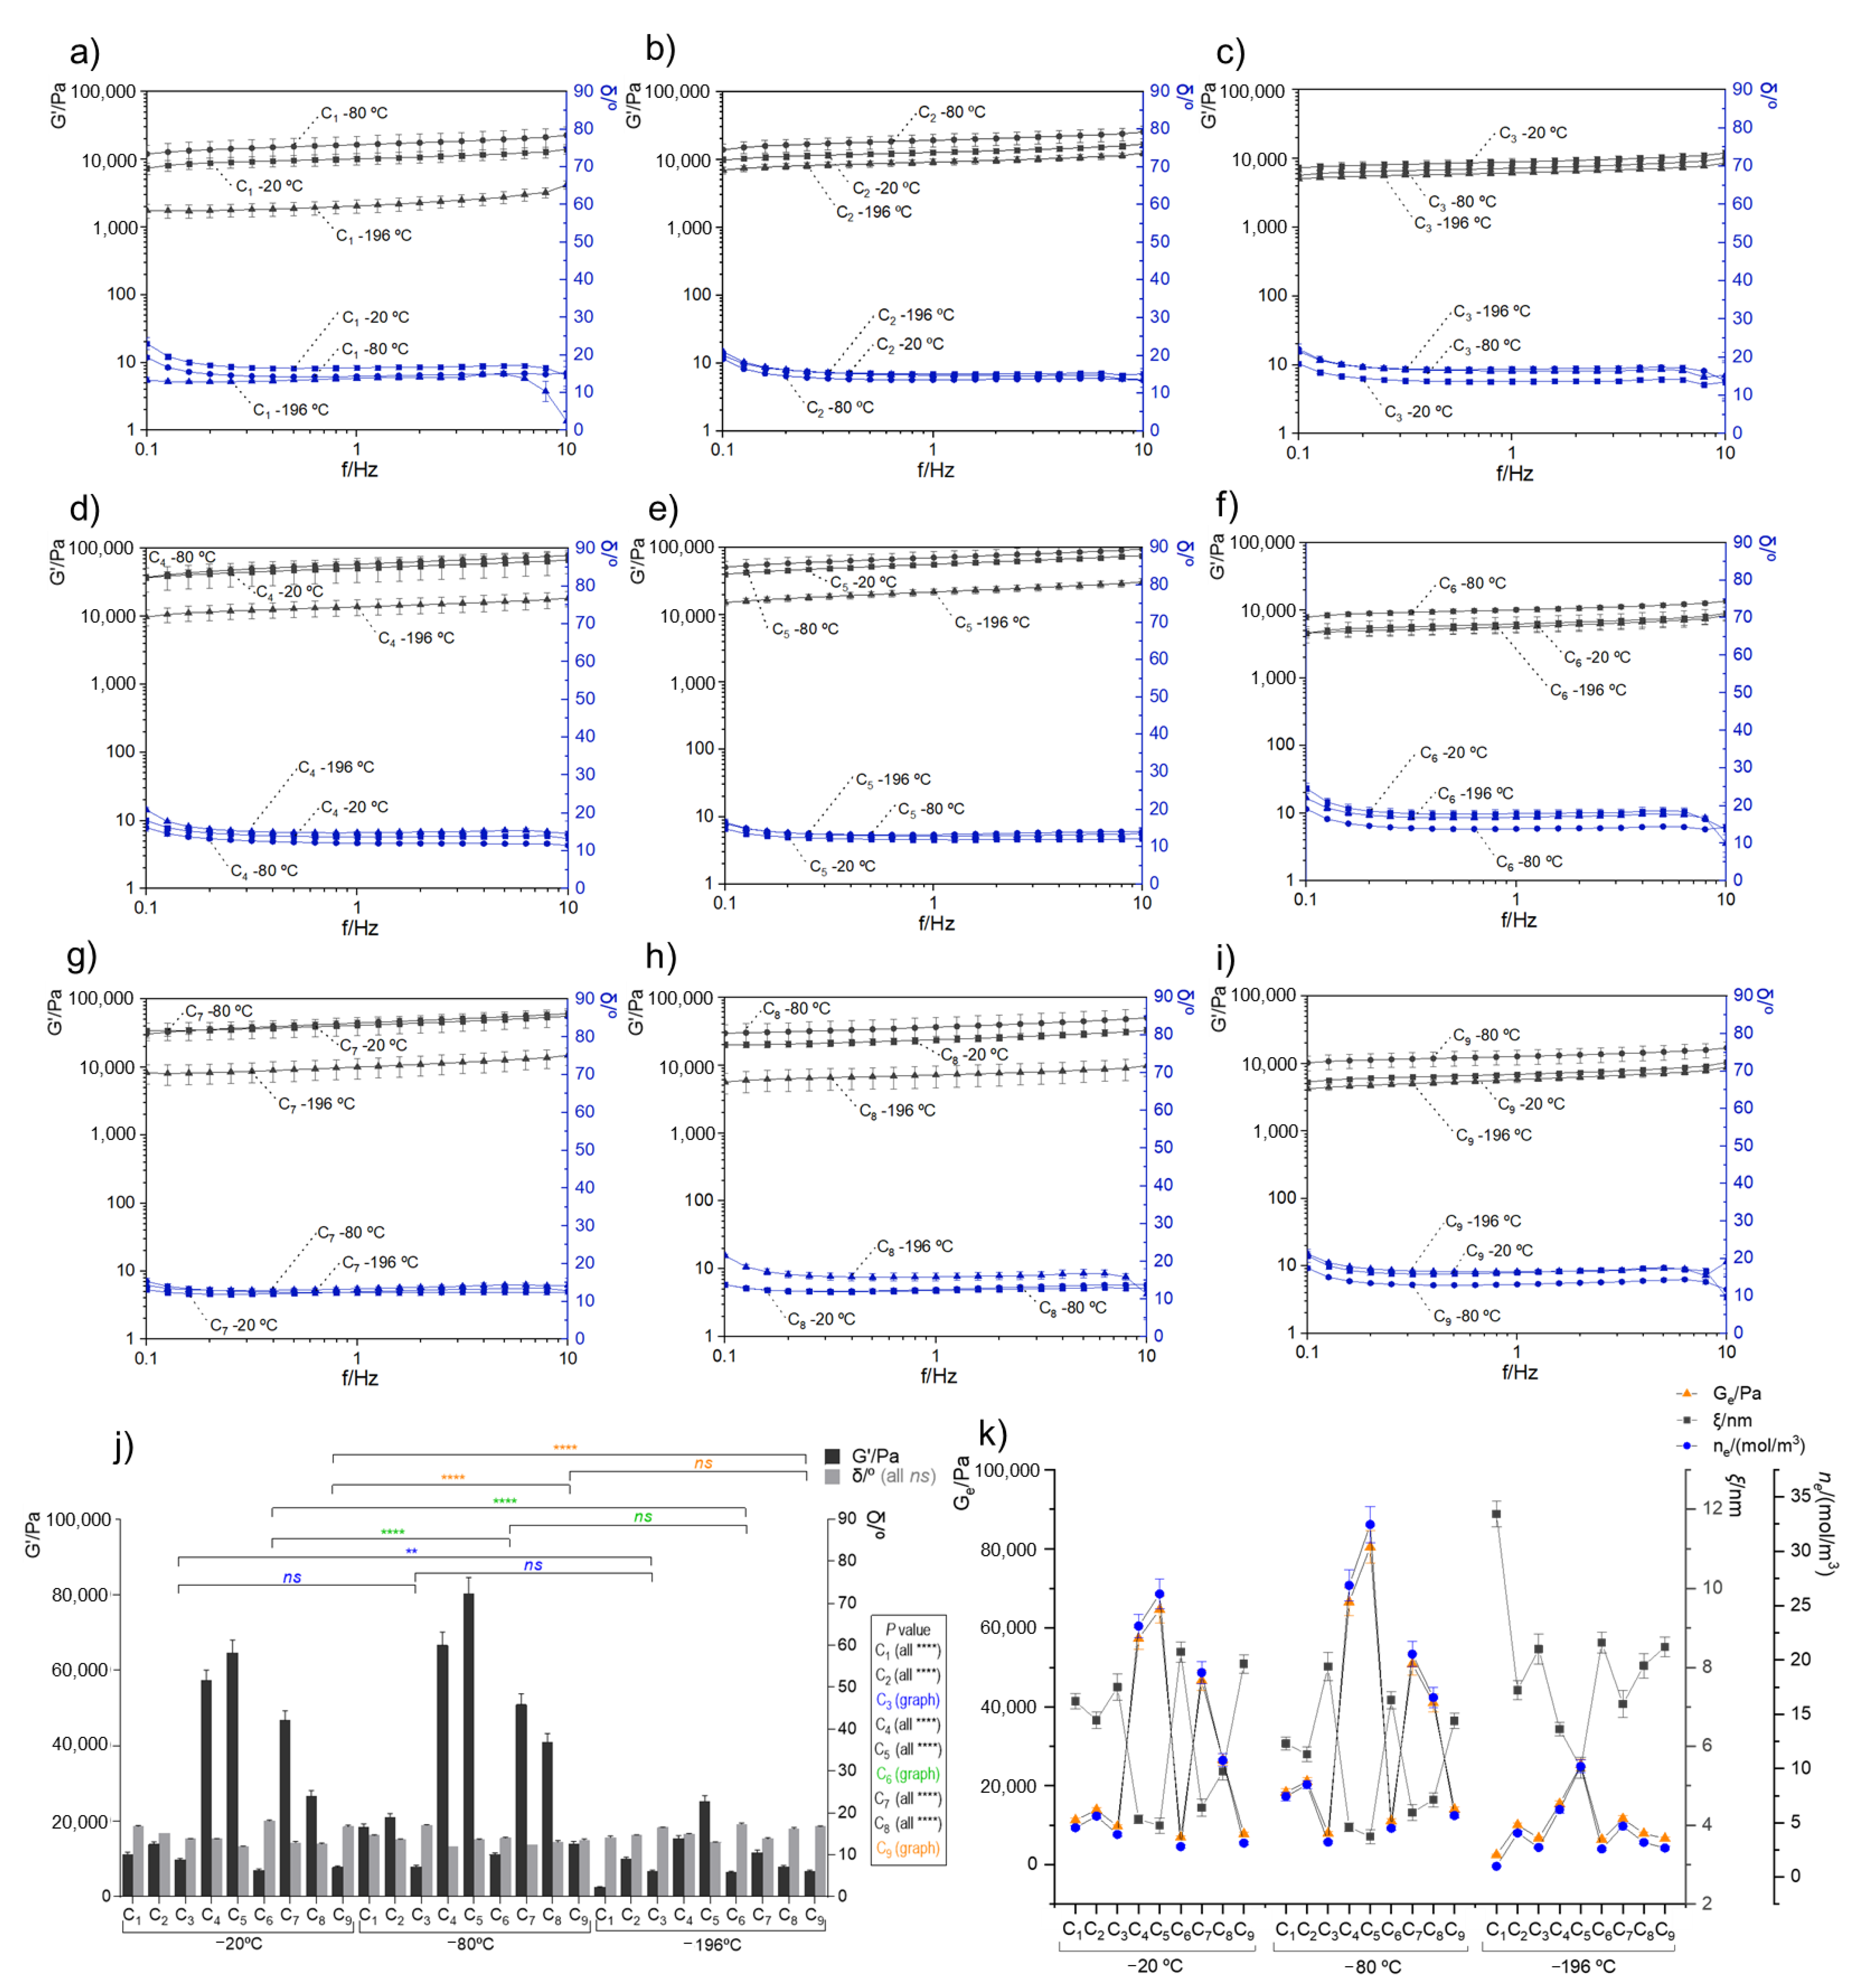
3.1. Rheology Oscillatory Behavior
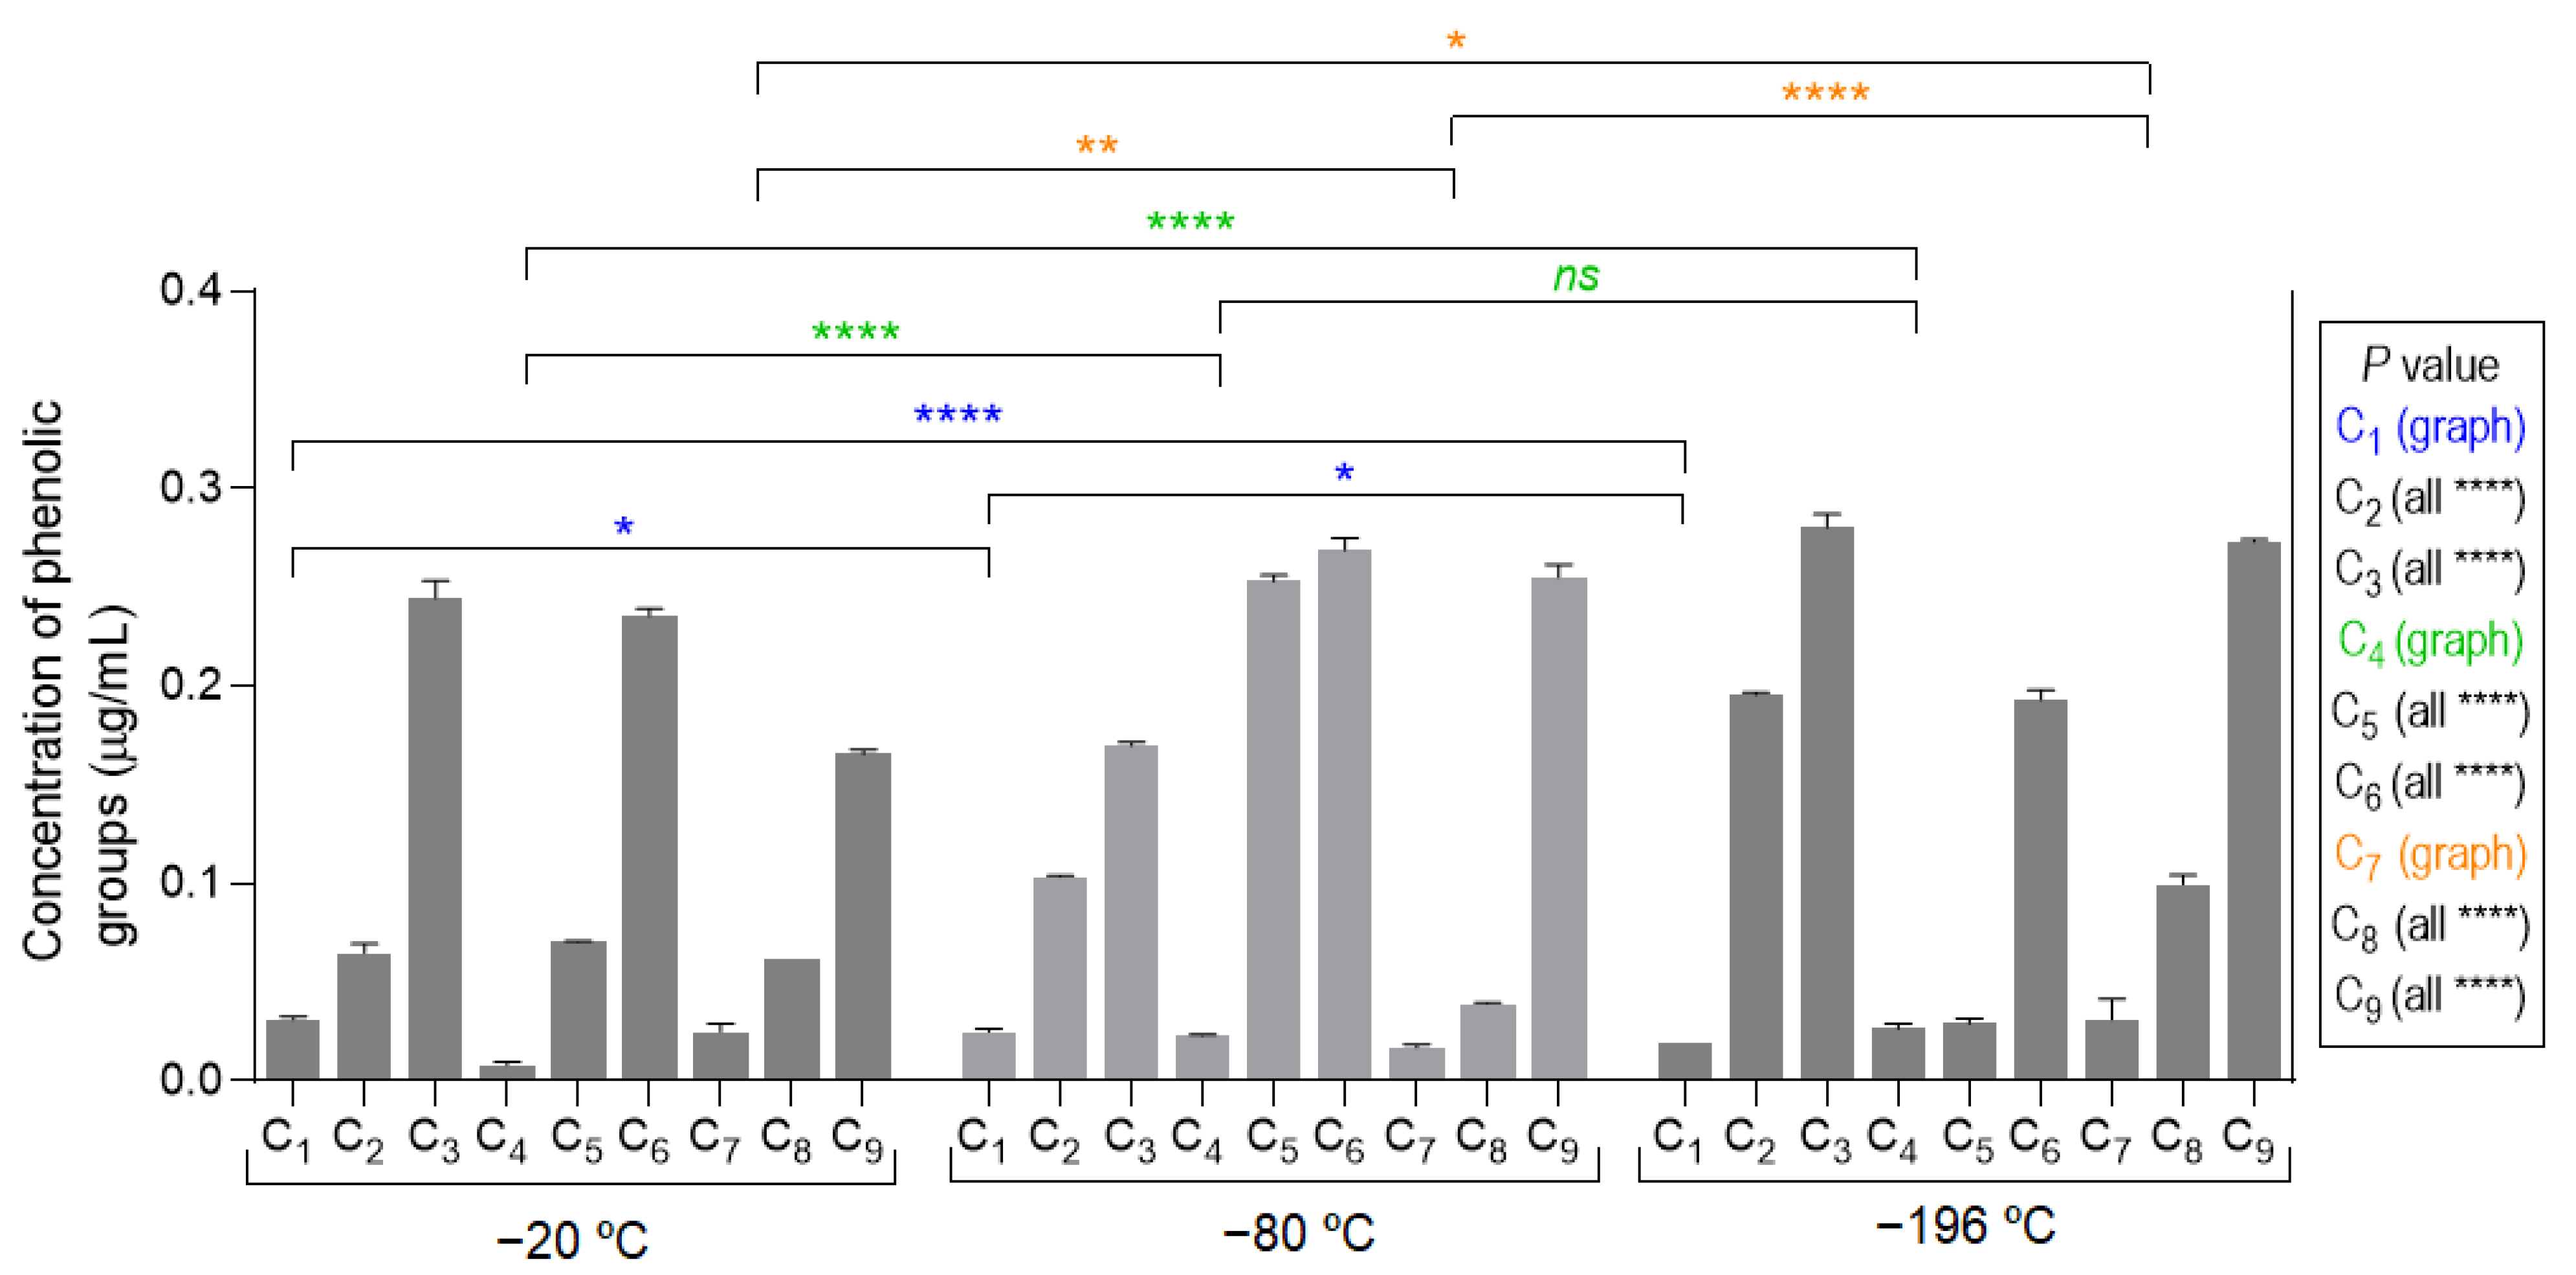
3.2. Antioxidant Activities
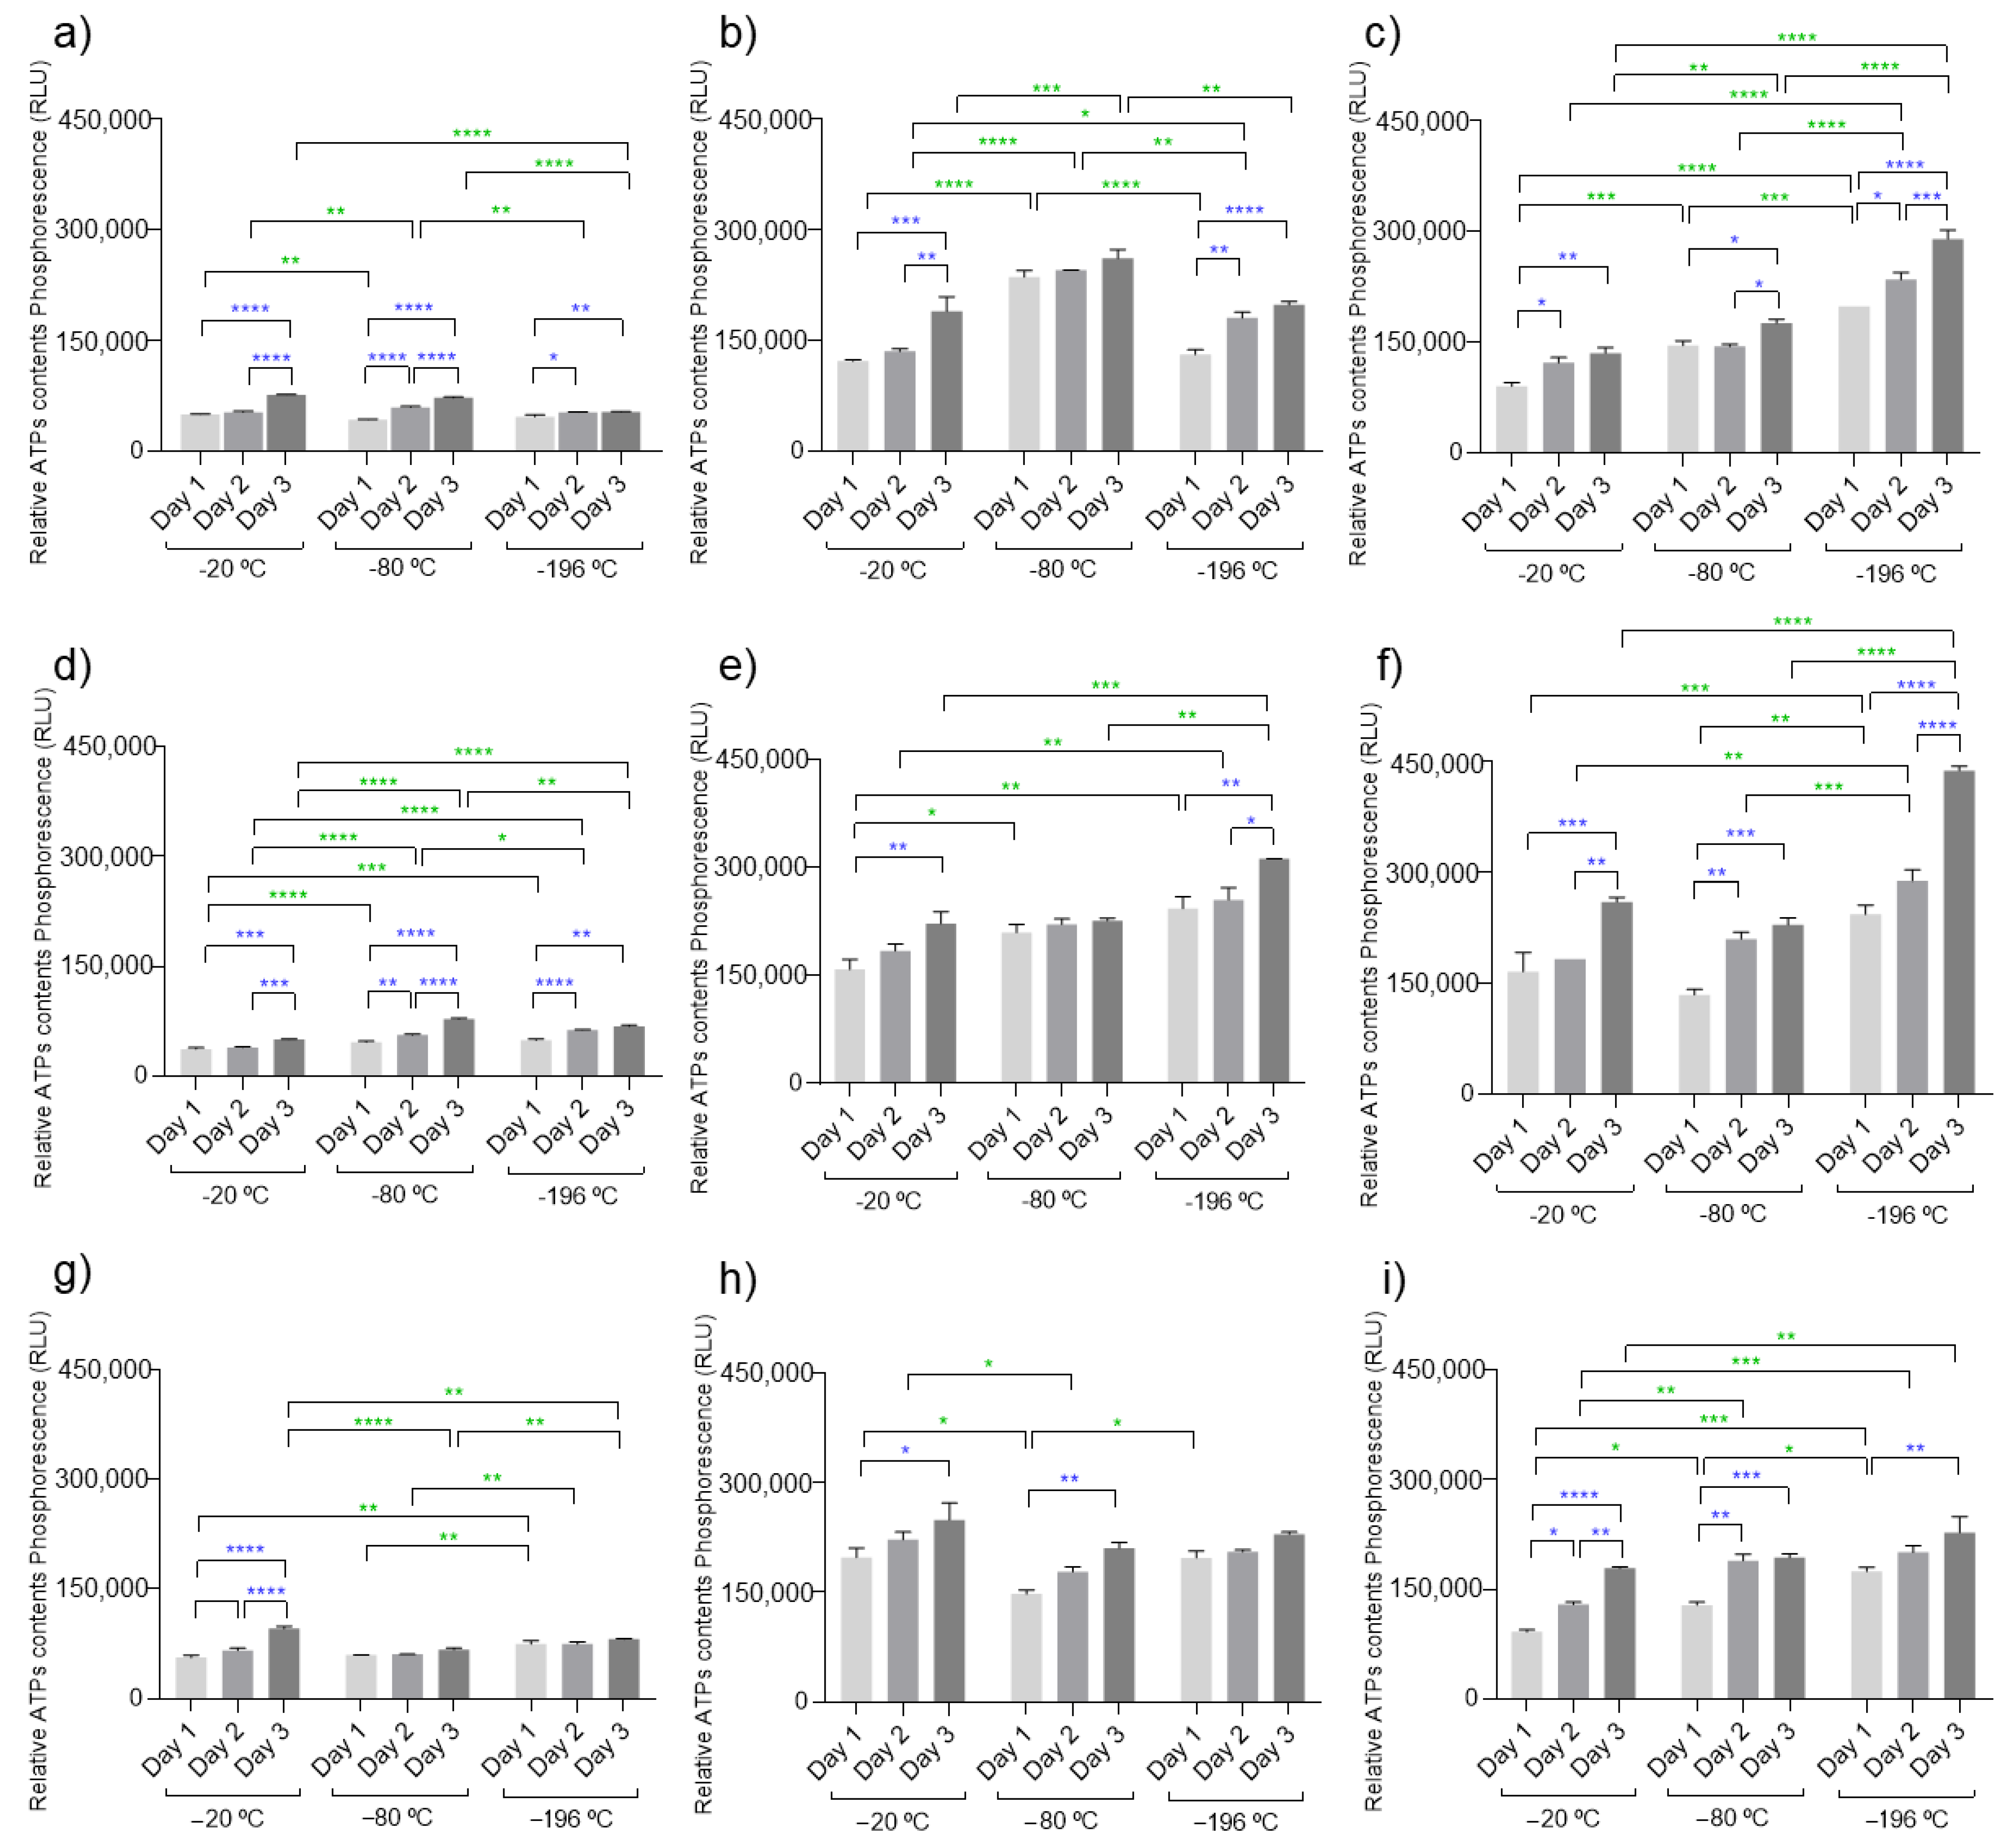
3.3. ATP Activity
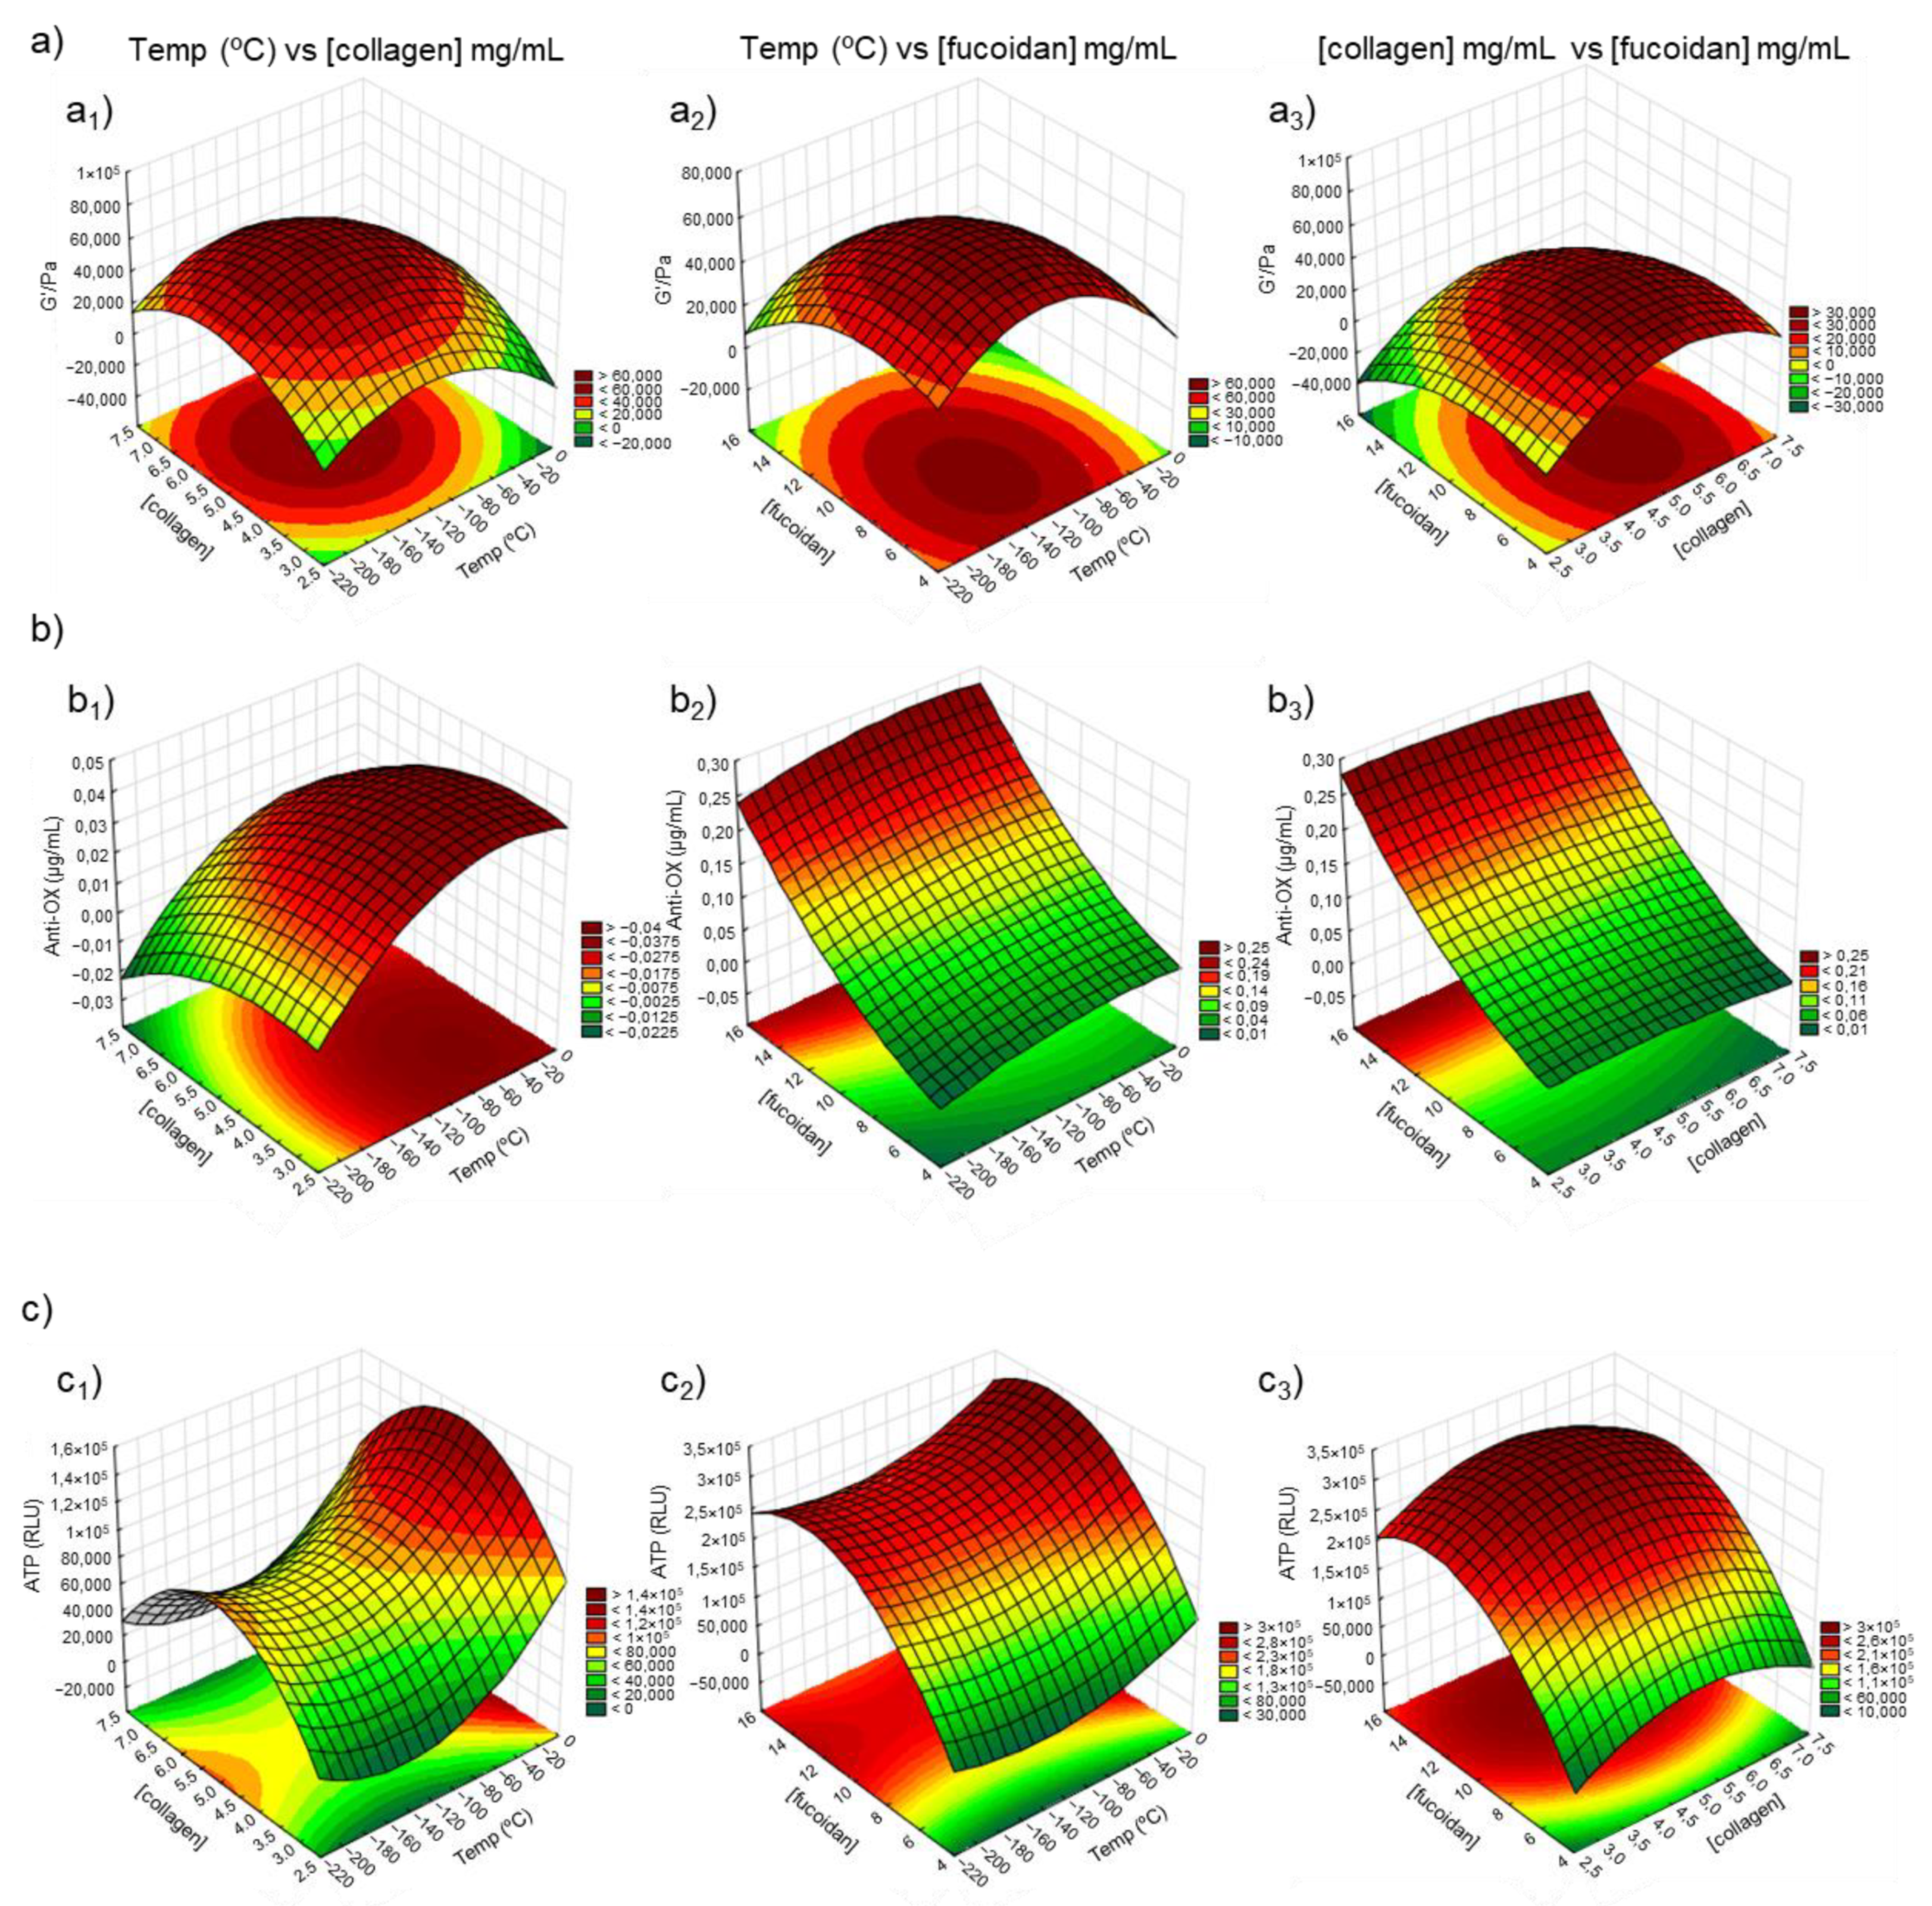
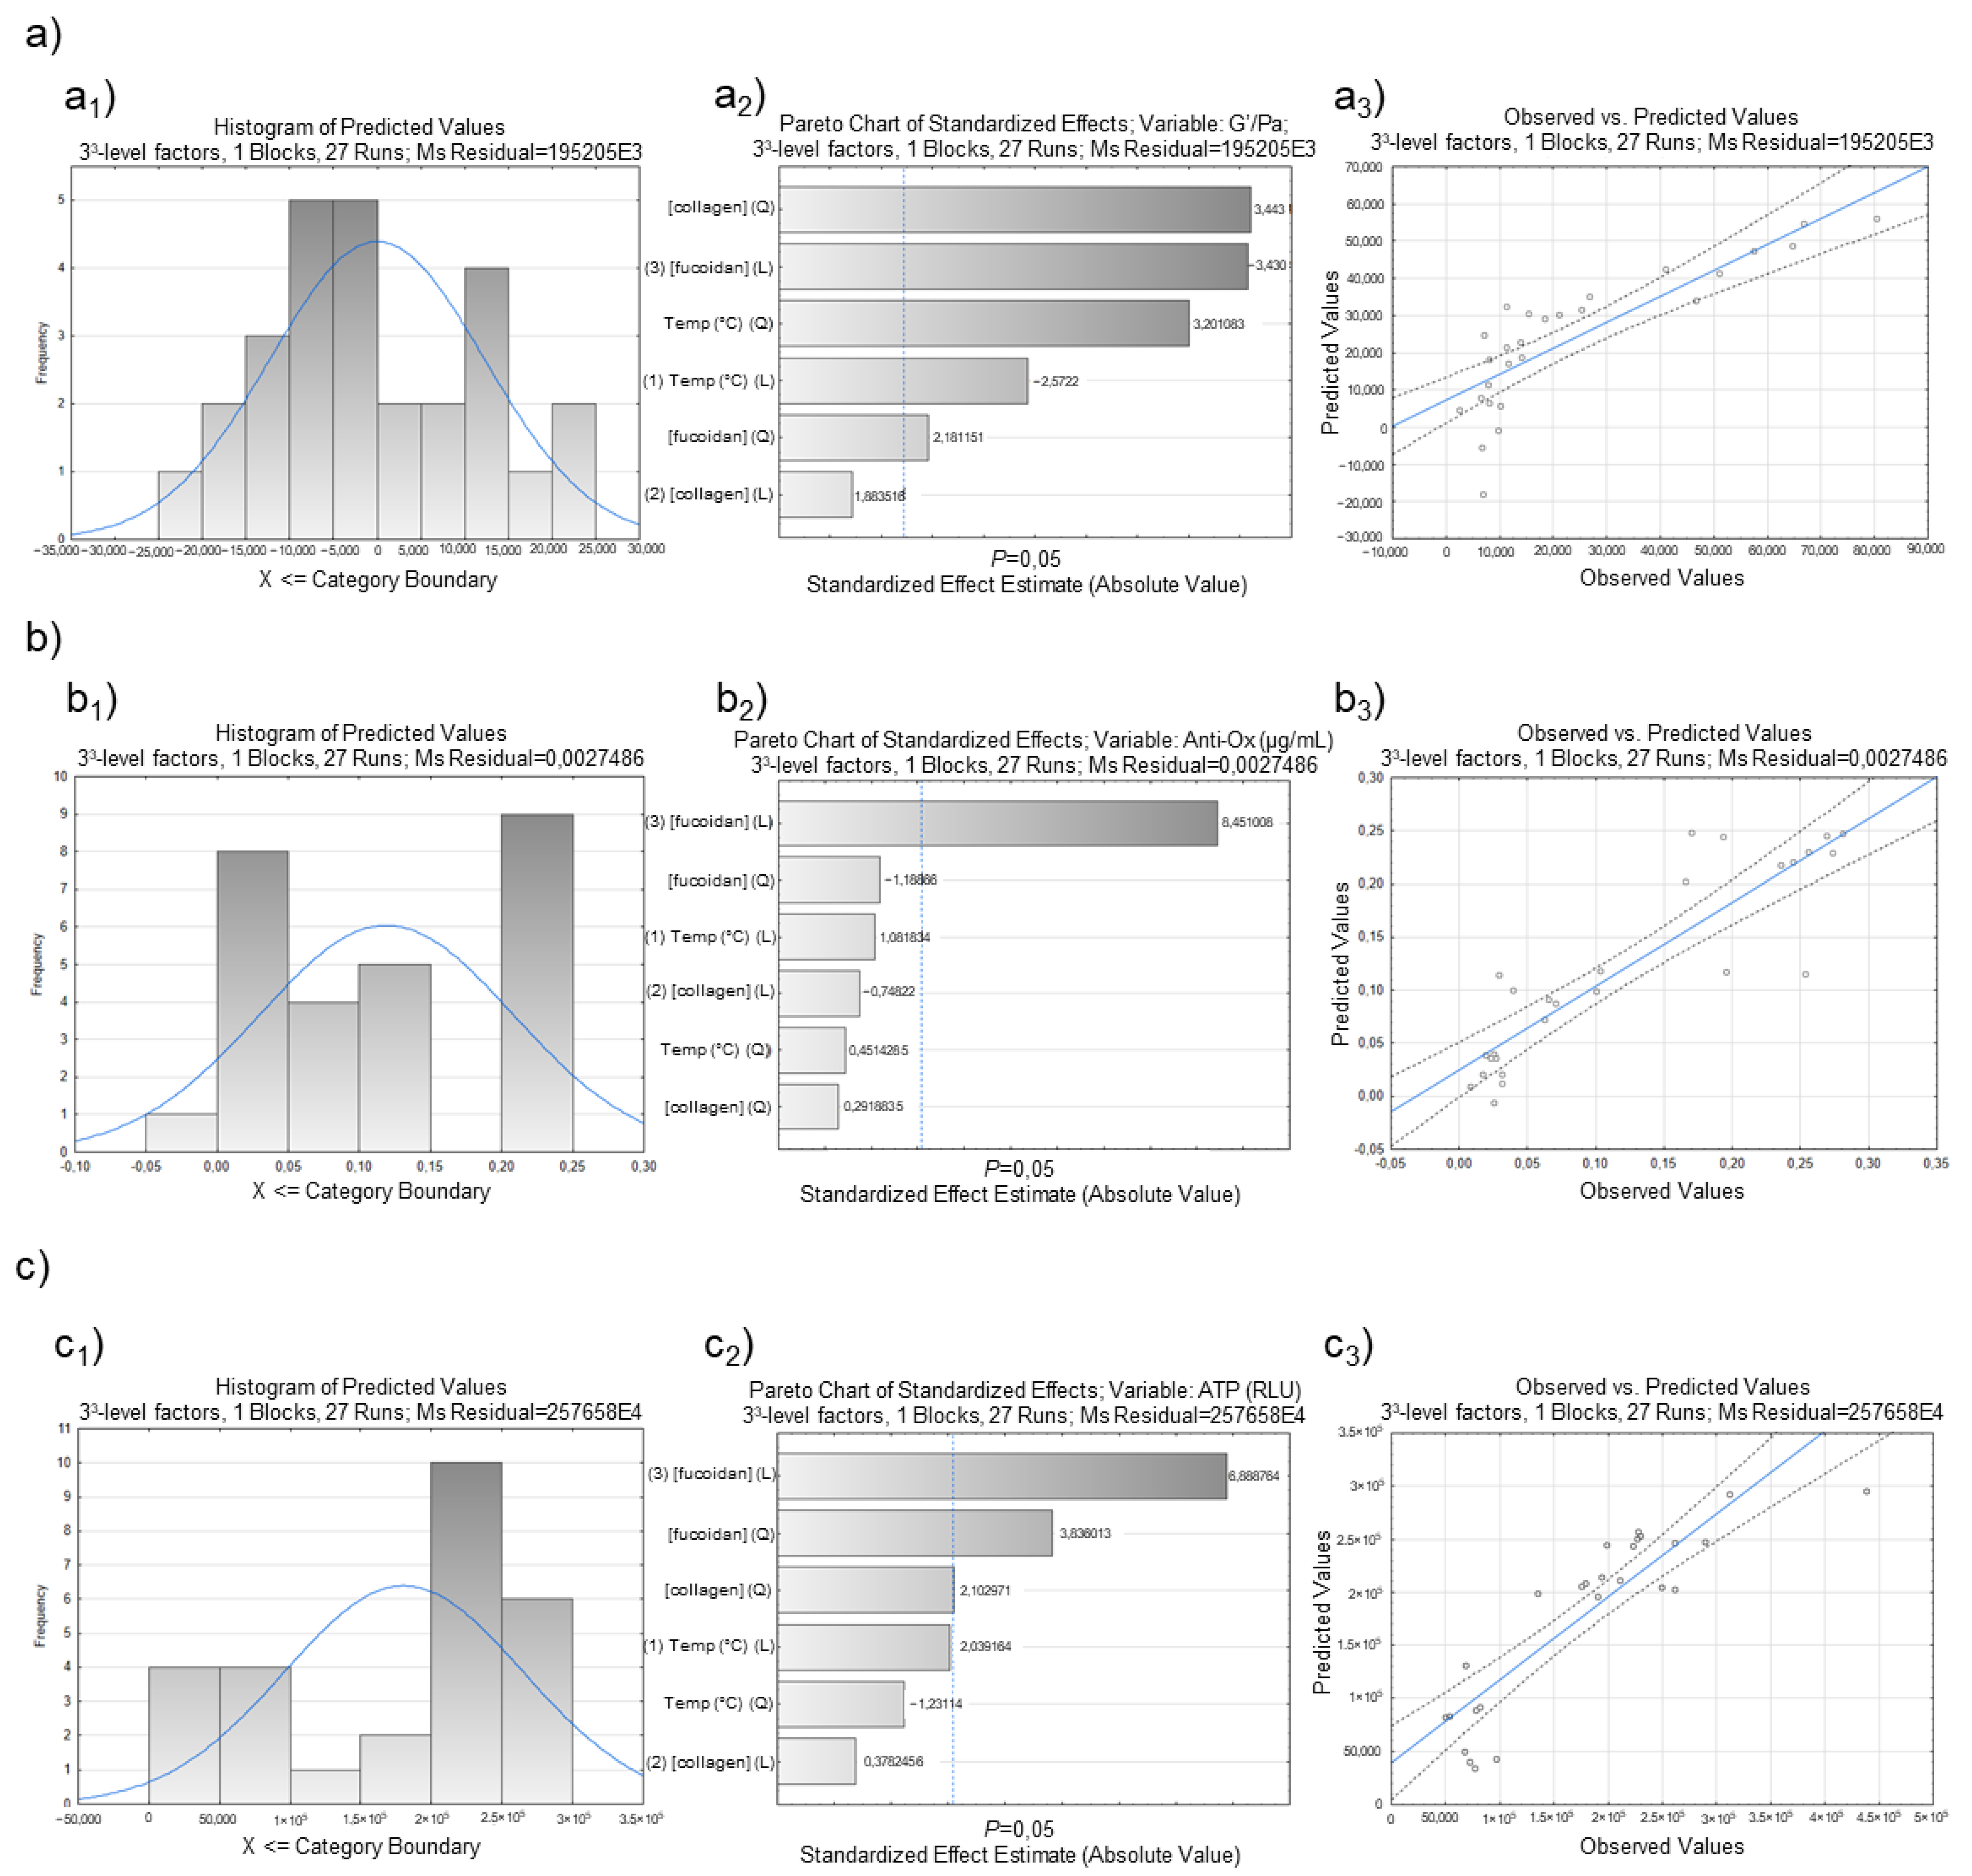
4. Factorial Design
5. Conclusions
Author Contributions
Funding
Institutional Review Board Statement
Informed Consent Statement
Data Availability Statement
Acknowledgments
Conflicts of Interest
References
- Zhang, Y.; Zhou, D.; Chen, J.; Zhang, X.; Li, X.; Zhao, W.; Xu, T. Biomaterials Based on Marine Resources for 3D Bioprinting Applications. Mar. Drugs 2019, 17, 555. [Google Scholar] [CrossRef] [PubMed] [Green Version]
- Lalzawmliana, V.; Anand, A.; Mukherjee, P.; Chaudhuri, S.; Kundu, B.; Nandi, S.K.; Thakur, N.L. Marine organisms as a source of natural matrix for bone tissue engineering. Ceram. Int. 2018, 45, 1469–1481. [Google Scholar] [CrossRef]
- Sumayya, A.S.; Kurup, G.M.; G, M.K.; A S, S. Marine macromolecules cross-linked hydrogel scaffolds as physiochemically and biologically favorable entities for tissue engineering applications. J. Biomater. Sci. Polym. Ed. 2017, 28, 807–825. [Google Scholar] [CrossRef] [PubMed]
- Dhandayuthapani, B.; Yoshida, Y.; Maekawa, T.; Kumar, D.S. Polymeric Scaffolds in Tissue Engineering Application: A Review. Int. J. Polym. Sci. 2011, 2011, 290602. [Google Scholar] [CrossRef]
- Ha, T.L.B.; Quan, T.M.; Vu, D.N.; Si, D.M. Naturally derived biomaterials: Preparation and application. In Regenerative Medicine and Tissue Engineering; IntechOpen: London, UK, 2013. [Google Scholar] [CrossRef] [Green Version]
- Bakhshpour, M.; Idil, N.; Perçin, I.; Denizli, A. Biomedical Applications of Polymeric Cryogels. Appl. Sci. 2019, 9, 553. [Google Scholar] [CrossRef] [Green Version]
- Kutlusoy, T.; Oktay, B.; Apohan, N.K.; Süleymanoğlu, M.; Kuruca, S.E. Chitosan-co-Hyaluronic acid porous cryogels and their application in tissue engineering. Int. J. Biol. Macromol. 2017, 103, 366–378. [Google Scholar] [CrossRef]
- Carvalho, D.N.; López-Cebral, R.; Sousa, R.O.; Alves, A.L.; Reys, L.L.; Silva, S.S.; Oliveira, J.M.; Reis, R.L.; Silva, T.H. Marine collagen-chitosan-fucoidan cryogels as cell-laden biocomposites envisaging tissue engineering. Biomed. Mater. 2020, 15, 055030. [Google Scholar] [CrossRef]
- Iswariya, S.; Velswamy, P.; Uma, T.S. Isolation and Characterization of Biocompatible Collagen from the Skin of Puffer Fish (Lagocephalus inermis). J. Polym. Environ. 2017, 26, 2086–2095. [Google Scholar] [CrossRef]
- Lim, Y.-S.; Ok, Y.-J.; Hwang, S.-Y.; Kwak, J.-Y.; Yoon, S. Marine Collagen as A Promising Biomaterial for Biomedical Applications. Mar. Drugs 2019, 17, 467. [Google Scholar] [CrossRef] [Green Version]
- Zhang, L.; Hu, J.; Athanasiou, K.A. The Role of Tissue Engineering in Articular Cartilage Repair and Regeneration. Crit. Rev. Biomed. Eng. 2009, 37, 1–57. [Google Scholar] [CrossRef]
- Almouemen, N.; Kelly, H.M.; O’Leary, C. Tissue Engineering: Understanding the Role of Biomaterials and Biophysical Forces on Cell Functionality through Computational and Structural Biotechnology Analytical Methods. Comput. Struct. Biotechnol. J. 2019, 17, 591–598. [Google Scholar] [CrossRef] [PubMed]
- Hixon, K.R.; Lu, T.; Sell, S.A. A comprehensive review of cryogels and their roles in tissue engineering applications. Acta Biomater. 2017, 62, 29–41. [Google Scholar] [CrossRef] [PubMed]
- Reys, L.; Silva, S.; Pirraco, R.; Marques, A.; Mano, J.; da Silva, T.H.; Reis, R.L. Influence of freezing temperature and deacetylation degree on the performance of freeze-dried chitosan scaffolds towards cartilage tissue engineering. Eur. Polym. J. 2017, 95, 232–240. [Google Scholar] [CrossRef]
- Shah, R.; Saha, N.; Saha, P. Influence of temperature, pH and simulated biological solutions on swelling and structural properties of biomineralized (CaCO3) PVP-CMC hydrogel. Prog. Biomater. 2015, 4, 123–136. [Google Scholar] [CrossRef] [PubMed] [Green Version]
- Myers, R.H.; Montgomery, D.C.; Anderson-Cook, C.M. Response Surface Methodology: Process and Product Optimization Using Designed Experiments, 2nd ed.; John Wiley & Sons: Hoboken, NJ, USA, 2012; ISBN 9781118916025. [Google Scholar]
- Dean, A.M.; Voss, D.T. Design and Analysis of Experiments; Springer: New York, NY, USA, 1999; Volume 1, pp. 1–742. [Google Scholar]
- Fisher, R.A. The arrangement of field experiments. J. Minist. Agric. Great Br. 1926, 33, 503–513. [Google Scholar]
- Gutierrez-Gonzalez, M.; Farías, C.; Tello, S.; Pérez-Etcheverry, D.; Romero, A.; Zúñiga, R.; Ribeiro, C.H.; Lorenzo-Ferreiro, C.; Molina, M.C. Optimization of culture conditions for the expression of three different insoluble proteins in Escherichia coli. Sci. Rep. 2019, 9, 16850–16861. [Google Scholar] [CrossRef]
- Blanco, M.; Vázquez, J.A.; Pérez-Martín, R.I.; Sotelo, C.G. Collagen Extraction Optimization from the Skin of the Small-Spotted Catshark (S. canicula) by Response Surface Methodology. Mar. Drugs 2019, 17, 40. [Google Scholar] [CrossRef] [Green Version]
- Kiew, P.L.; Mat Don, M. Screening of significant factors in collagen extraction from hybrid Clarias sp. using astatistical tool. Int. Food Res. J. 2013, 20, 1913–1920. [Google Scholar]
- Ruiter, F.A.; Alexander, C.; Rose, F.R.A.J.; Segal, J.I. A design of experiments approach to identify the influencing parameters that determine poly-D,L-lactic acid (PDLLA) electrospun scaffold morphologies. Biomed. Mater. 2017, 12, 055009. [Google Scholar] [CrossRef] [Green Version]
- Gadomska-Gajadhur, A.; Kruk, A.; Wierzchowski, K.; Ruśkowski, P.; Pilarek, M. Design of experiments-based strategy for development and optimization of polylactide membranes preparation by wet inversion phase method. Polym. Adv. Technol. 2021, 32, 3028. [Google Scholar] [CrossRef]
- Lam, J.; Carmichael, S.T.; Lowry, W.E.; Segura, T. Hydrogel design of experiments methodology to optimize hydrogel for iPSC-NPC culture. Adv. Healthc. Mater. 2015, 4, 534–539. [Google Scholar] [CrossRef] [PubMed] [Green Version]
- López-Cebral, R.; Quinteros Lopes Henriquez da Silva, T.J.; Antunes Correia de Oliveira, J.M.; Novoa Carballal, R.; Gonçalves dos Reis, R.L. High Molecular Weight Chitosan, Process for Obtaining and Uses Thereof. US Patent US20200262937A1, 11 November 2019. [Google Scholar]
- Karvinen, J.; Ihalainen, T.O.; Calejo, M.T.; Jönkkäri, I.; Kellomäki, M. Characterization of the microstructure of hydrazone crosslinked polysaccharide-based hydrogels through rheological and diffusion studies. Mater. Sci. Eng. C 2019, 94, 1056–1066. [Google Scholar] [CrossRef] [PubMed]
- Welzel, P.B.; Prokoph, S.; Zieris, A.; Grimmer, M.; Zschoche, S.; Freudenberg, U.; Werner, C. Modulating Biofunctional starPEG Heparin Hydrogels by Varying Size and Ratio of the Constituents. Polymers 2011, 3, 602–620. [Google Scholar] [CrossRef] [Green Version]
- Suriano, R.; Griffini, G.; Chiari, M.; Levi, M.; Turri, S. Rheological and mechanical behavior of polyacrylamide hydrogels chemically crosslinked with allyl agarose for two-dimensional gel electrophoresis. J. Mech. Behav. Biomed. Mater. 2014, 30, 339–346. [Google Scholar] [CrossRef] [PubMed]
- Munteanu, I.G.; Apetrei, C. Analytical Methods Used in Determining Antioxidant Activity: A Review. Int. J. Mol. Sci. 2021, 22, 3380–3410. [Google Scholar] [CrossRef]
- Singleton, V.L.; Rossi, J.A. Colorimetry of total phenolics with phosphomolybdic-phosphotungstic acid reagents. Am. J. Enol. Vitic. 1965, 16, 144–158. [Google Scholar]
- Slinkard, K.; Singleton, V.L. Total phenol analysis: Automation and comparison with manual methods. Am. J. Enol. Vitic. 1977, 28, 49–55. [Google Scholar]
- Rimann, M.; Laternser, S.; Gvozdenovic, A.; Muff, R.; Fuchs, B.; Kelm, J.M.; Graf-Hausner, U. An in vitro osteosarcoma 3D microtissue model for drug development. J. Biotechnol. 2014, 189, 129–135. [Google Scholar] [CrossRef]
- Maran, J.P.; Manikandan, S. Response surface modeling and optimization of process parameters for aqueous extraction of pigments from prickly pear (Opuntia ficus-indica) fruit. Dye. Pigment. 2012, 95, 465–472. [Google Scholar] [CrossRef]
- Palanikumar, K.; Davim, J.P. Electrical discharge machining: Study on machining characteristics of WC/Co composites. Mach. Mach. Tools 2013, 135–168. [Google Scholar] [CrossRef]
- Gloria, A.; Borzacchiello, A.; Causa, F.; Ambrosio, L. Rheological Characterization of Hyaluronic Acid Derivatives as Injectable Materials Toward Nucleus Pulposus Regeneration. J. Biomater. Appl. 2012, 26, 745–759. [Google Scholar] [CrossRef] [PubMed]
- Zuidema, J.M.; Rivet, C.J.; Gilbert, R.J.; Morrison, F.A. A protocol for rheological characterization of hydrogels for tissue engineering strategies. J. Biomed. Mater. Res. Part B Appl. Biomater. 2014, 102, 1063–1073. [Google Scholar] [CrossRef] [PubMed]
- Slaughter, B.V.; Khurshid, S.S.; Fisher, O.Z.; Khademhosseini, A.; Peppas, N.A. Hydrogels in Regenerative Medicine. Adv. Mater. 2009, 21, 3307–3329. [Google Scholar] [CrossRef] [PubMed] [Green Version]
- Carvalho, D.N.; Goncalves, C.; Oliveira, J.M.; Williams, D.S.; Mearns-Spragg, A.; Reis, R.L.; Silva, T.H. Innovative methodology for marine collagen–chitosan–fucoidan hydrogels production, tailoring rheological properties towards biomedical application. Green Chem. 2021, 23, 7016–7029. [Google Scholar] [CrossRef]
- Citkowska, A.; Szekalska, M.; Winnicka, K. Possibilities of Fucoidan Utilization in the Development of Pharmaceutical Dosage Forms. Mar. Drugs 2019, 17, 458. [Google Scholar] [CrossRef] [Green Version]
- Horinaka, J.-I.; Kimura, A.; Takigawa, T. Rheological properties of concentrated solutions of fucoidan in water and in an ionic liquid. Polymer 2020, 211, 123090. [Google Scholar] [CrossRef]
- Hentati, F.; Pierre, G.; Ursu, A.V.; Vial, C.; Delattre, C.; Abdelkafi, S.; Michaud, P. Rheological investigations of water-soluble polysaccharides from the Tunisian brown seaweed Cystoseira compressa. Food Hydrocoll. 2020, 103, 105631. [Google Scholar] [CrossRef]
- Kordjavi, M.; Etemadian, Y.; Shabanpour, B.; Pourashouri, P. Chemical composition antioxidant and antimicrobial activities of fucoidan extracted from two species of brown seaweeds (Sargassum ilicifolium and Sargassum angustifolium) around Qeshm Island. Iran. J. Fisheires Sci. 2018, 18, 457–475. [Google Scholar]
- Cheung, B.; Kwan, M.; Chan, R.; Sea, M.; Woo, J. Potential of Asian natural products for health in aging. Mol. Basis Nutr. Aging 2016, 659–676. [Google Scholar]
- Cikoš, A.-M.; Jokić, S.; Šubarić, D.; Jerković, I. Overview on the Application of Modern Methods for the Extraction of Bioactive Compounds from Marine Macroalgae. Mar. Drugs 2018, 16, 348. [Google Scholar] [CrossRef] [Green Version]
- Murray, M.; Dordevic, A.L.; Ryan, L.; Bonham, M.P. The Impact of a Single Dose of a Polyphenol-Rich Seaweed Extract on Postprandial Glycaemic Control in Healthy Adults: A Randomised Cross-Over Trial. Nutrients 2018, 10, 270. [Google Scholar] [CrossRef] [PubMed] [Green Version]
- Palanisamy, S.; Vinosha, M.; Marudhupandi, T.; Rajasekar, P.; Prabhu, N.M. In vitro antioxidant and antibacterial activity of sulfated polysaccharides isolated from Spatoglossum asperum. Carbohydr. Polym. 2017, 170, 296–304. [Google Scholar] [CrossRef] [PubMed]
- Lamuela-Raventós, R.M. Folin–Ciocalteu method for the measurement of total phenolic content and antioxidant capacity. Meas. Antioxid. Act. Capacit. Recent Trends Appl. 2018, 107–115. [Google Scholar]
- Prior, R.L.; Wu, X.; Schaich, K. Standardized Methods for the Determination of Antioxidant Capacity and Phenolics in Foods and Dietary Supplements. J. Agric. Food Chem. 2005, 53, 4290–4302. [Google Scholar] [CrossRef]
- Cotas, J.; Leandro, A.; Monteiro, P.; Pacheco, D.; Figueirinha, A.; Gonçalves, A.M.M.; Da Silva, G.J.; Pereira, L. Seaweed Phenolics: From Extraction to Applications. Mar. Drugs 2020, 18, 384. [Google Scholar] [CrossRef]
- Zimmerman, J.J.; Saint André-von Arnim, A.; McLaughlin, J. Cellular respiration. Pediatric Crit. Care 2011, 1059–1072. [Google Scholar]
- Campbell, A.K. Darwin shines light on the evolution of bioluminescence. Luminescence 2012, 27, 447–449. [Google Scholar] [CrossRef]
- Conti, E.; Franks, N.P.; Brick, P. Crystal structure of firefly luciferase throws light on a superfamily of adenylate-forming enzymes. Structure 1996, 4, 287–298. [Google Scholar] [CrossRef]
- Casem, M.L. Cell metabolism, in Case Studies. Cell Biol. 2016, 263–281. [Google Scholar] [CrossRef]
- Khalili, A.A.; Ahmad, M.R. A Review of Cell Adhesion Studies for Biomedical and Biological Applications. Int. J. Mol. Sci. 2015, 16, 18149–18184. [Google Scholar] [CrossRef] [Green Version]
- Beg, S.; Akhter, S. Box–Behnken Designs and Their Applications in Pharmaceutical Product Development. Des. Exp. Pharm. Prod. Dev. 2021, 77–85. [Google Scholar] [CrossRef]
- Mason, R.L.; Gunst, R.F.; Hess, J.L. Designs and analyses for fitting response surfaces. In Statistical Design and Analysis of Experiments: With Applications to Engineering and Science, 2nd ed.; John Wiley & Sons, Inc.: Hoboken, NJ, USA, 2003; pp. 568–606. [Google Scholar]
- Sabela, M.I.; Suvardhan, K.; Bathinapatla, A.; Krishna, B. A Box-Behnken Design and Response Surface Approach for the Simultaneous Determination of Chromium (III) and (VI) Using Catalytic Differential Pulse Polarography. Int. J. Electrochem. Sci. 2004, 2, 140–146. [Google Scholar]
- Cristóvão, R.O.; Gonçalvesa, C.; Botelhoa, C.M.; Martinsab, R.J.E.; Boaventura, R.A.R. Chemical oxidation of fish canning wastewater by Fenton’s reagent. J. Environ. Chem. Eng. 2014, 2, 2372–2376. [Google Scholar] [CrossRef]
- Tayeb, A.M.; Tony, M.A.; Mansour, S.A. Application of Box–Behnken factorial design for parameters optimization of basic dye removal using nano-hematite photo-Fenton tool. Appl. Water Sci. 2018, 8, 138. [Google Scholar] [CrossRef] [Green Version]
- Abbott, R.D.; Kaplan, D.L. Engineering Biomaterials for Enhanced Tissue Regeneration. Curr. Stem Cell Rep. 2016, 2, 140–146. [Google Scholar] [CrossRef] [Green Version]
- Satman, I.; Omer, B.; Tutuncu, Y.; Kalaca, S.; Gedik, S.; Dinccag, N.; Karsidag, K.; Genc, S.; Telci, A.; Canbaz, B.; et al. Twelve-year trends in the prevalence and risk factors of diabetes and prediabetes in Turkish adults. Eur. J. Epidemiol. 2016, 28, 169–180. [Google Scholar] [CrossRef] [Green Version]
- Vlierberghe, S.V.; Dubluel, P.; Schachet, E. Effect of cryogenic treatment on the rheological properties of gelatin hydrogels. J. Bioact. Compat. Polym. 2010, 25, 1–24. [Google Scholar] [CrossRef] [Green Version]


| Hydrogel Abbreviationratio 1:1:1 (100%) | % of Polymer in the Original Solution | Freezing Temperature | ||
|---|---|---|---|---|
| Collagen | Chitosan | Fucoidan | ||
| C1 (T °C) | 3; (27.27) | 3; (27.27) | 5; (45.46) | −20 °C −80 °C −196 °C (liquid nitrogen) |
| C2 (T °C) | 3; (18.75) | 3; (18.75) | 10; (62.5) | |
| C3 (T °C) | 3; (14.29) | 3; (14.29) | 15; (71.42) | |
| C4 (T °C) | 5; (38.46) | 3; (23.08) | 5; (38.46) | |
| C5 (T °C) | 5; (27.78) | 3; (16.67) | 10; (55.55) | |
| C6 (T °C) | 5; (21.74) | 3; (13.04) | 15; (65.22) | |
| C7 (T °C) | 7; (46.67) | 3; (20) | 5; (33.33) | |
| C8 (T °C) | 7; (35) | 3; (15) | 10; (50) | |
| C9 (T °C) | 7; (28) | 3; (12) | 15; (60) | |
| Variable | Factors | Level | ||
|---|---|---|---|---|
| x | −1 | 0 | 1 | |
| Temperature (°C) | x1 | −20 | −80 | −196 |
| [collagen] (% w/v) | x2 | 3 | 5 | 7 |
| [fucoidan] (% w/v) | x3 | 5 | 10 | 15 |
| Run | Coded Level | Factors | Response Data | ||||||
|---|---|---|---|---|---|---|---|---|---|
| x1 | x2 | x3 | Temp (°C) | [jCOL] | [aFUC] | Rheological (G′) | Antiox (µg/mL) | ATPs (RLU) | |
| 1 | −1 | −1 | −1 | −20 | 3 | 5 | 1.13 × 10⁴ | 3.14 × 10⁻² | 7.67 × 10⁴ |
| 2 | −1 | −1 | 0 | 10 | 139 × 104 | 6.51 × 10⁻² | 1.90 × 10⁵ | ||
| 3 | −1 | −1 | 1 | 15 | 9.73 × 10³ | 2.45 × 10⁻¹ | 1.35 × 10⁵ | ||
| 4 | −1 | 0 | −1 | 5 | 5 | 5.73 × 10⁵ | 8.22 × 10⁻³ | 5.00 × 10⁴ | |
| 5 | −1 | 0 | 0 | 10 | 6.46 × 10⁴ | 7.04 × 10⁻² | 2.22 × 10⁵ | ||
| 6 | −1 | 0 | 1 | 15 | 6.96 × 10³ | 2.36 × 10⁻¹ | 2.61 × 10⁵ | ||
| 7 | −1 | 1 | −1 | 7 | 5 | 4.67 × 10⁴ | 2.51 × 10⁻² | 9.62 × 10⁴ | |
| 8 | −1 | 1 | 0 | 10 | 2.67 × 10⁴ | 6.19 × 10⁻² | 2.49 × 10⁵ | ||
| 9 | −1 | 1 | 1 | 15 | 7.78 × 10³ | 1.66 × 10⁻¹ | 1.79 × 10⁵ | ||
| 10 | 0 | −1 | −1 | −80 | 3 | 5 | 1.84 × 10⁴ | 2.51 × 10⁻² | 7.26 × 10⁴ |
| 11 | 0 | −1 | 0 | 10 | 2.11 × 10⁴ | 1.04 × 10⁻¹ | 2.61 × 10⁵ | ||
| 12 | 0 | −1 | 1 | 15 | 7.97 × 10³ | 1.70 × 10⁻¹ | 1.75 × 10⁵ | ||
| 13 | 0 | 0 | −1 | 5 | 5 | 6.66 × 10⁴ | 2.30 × 10⁻² | 7.79 × 10⁴ | |
| 14 | 0 | 0 | 0 | 10 | 8.04 × 10⁴ | 2.53 × 10⁻¹ | 2.27 × 10⁵ | ||
| 15 | 0 | 0 | 1 | 15 | 1.11 × 10⁴ | 2.69 × 10⁻¹ | 2.30 × 10⁵ | ||
| 16 | 0 | 1 | −1 | 7 | 5 | 5.09 × 10⁴ | 1.72 × 10⁻² | 6.75 × 10⁴ | |
| 17 | 0 | 1 | 0 | 10 | 4.10 × 10⁴ | 3.93 × 10⁻² | 2.11 × 10⁵ | ||
| 18 | 0 | 1 | 1 | 15 | 1.40 × 10⁴ | 2.55 × 10⁻¹ | 1.93 × 10⁵ | ||
| 19 | 1 | −1 | −1 | −196 | 3 | 5 | 2.46 × 10³ | 1.93 × 10⁻² | 5.36 × 10⁴ |
| 20 | 1 | −1 | 0 | 10 | 1.01 × 10⁴ | 1.96 × 10⁻¹ | 1.99 × 10⁵ | ||
| 21 | 1 | −1 | 1 | 15 | 6.78 × 10³ | 2.81 × 10⁻¹ | 2.89 × 10⁵ | ||
| 22 | 1 | 0 | −1 | 5 | 5 | 1.54 × 10⁴ | 2.67 × 10⁻² | 6.82 × 10⁴ | |
| 23 | 1 | 0 | 0 | 10 | 2.53 × 10⁴ | 2.92 × 10⁻² | 3.12 × 10⁵ | ||
| 24 | 1 | 0 | 1 | 15 | 6.41 × 10³ | 1.93 × 10⁻¹ | 4.38 × 10⁵ | ||
| 25 | 1 | 1 | −1 | 7 | 5 | 1.16 × 10⁴ | 3.14 × 10⁻² | 8.14 × 10⁴ | |
| 26 | 1 | 1 | 0 | 10 | 7.91 × 10³ | 9.99 × 10⁻² | 2.30 × 10⁵ | ||
| 27 | 1 | 1 | 1 | 15 | 6.66 × 10³ | 2.73 × 10⁻¹ | 2.27 × 10⁵ | ||
| Response | Factors | Optimum Values | Predicted Value |
|---|---|---|---|
| G′/Pa | Temp (°C) | −126 | 6.47 × 10⁴ |
| [collagen] mg/mL | 5.3 | ||
| [fucoidan] mg/mL | 7.7 | ||
| Anti-oxidants (µg/mL) | Temp (°C) | −54 | 0.13 |
| [collagen] mg/mL | 3.5 | ||
| [fucoidan] mg/mL | NF | ||
| ATPs (RLU) | Temp (°C) | −145 | 2.56 × 10⁵ |
| [collagen] mg/mL | 5.1 | ||
| [fucoidan] mg/mL | 12.5 |
| Variable of G′/Pa | |||||
|---|---|---|---|---|---|
| Factor | Sum of Squares (SS) | df | Mean Square (MS) | F-Value | p-Value |
| (1) [fucoidan] (L) | 2.29 × 10⁹ | 1 | 2.29 × 10⁹ | 11.766 | 0.002 |
| [fucoidan] (Q) | 9.28 × 10⁸ | 1 | 9.28 × 10⁸ | 4.757 | 0.041 |
| (2) [collagen] (L) | 6.92 × 10⁸ | 1 | 6.92 × 10⁸ | 3.547 | 0.074 |
| [collagen] (Q) | 2.31 × 10⁹ | 1 | 2.31 × 10⁹ | 11.855 | 0.002 |
| (3) Temp (°C) (L) | 1.29 × 10⁹ | 1 | 1.29 × 10⁹ | 6.616 | 0.018 |
| Temp (°C) (Q) | 2.00 × 10⁹ | 1 | 2.00 × 10⁹ | 10.246 | 0.004 |
| Error | 3.90 × 10⁹ | 20 | 1.95 × 10⁸ | ||
| Total SS | 1.29 × 10¹⁰ | 26 | |||
| R2 = 0.69; adj R2 = 0.61; MS = 195 × 103 | |||||
| Variable of Anti-oxidant (µg/mL) | |||||
| Factor | Sum of squares (SS) | df | Mean square (MS) | F-value | p-value |
| (1) Temp (°C) (L) | 0.003 | 1 | 0.003 | 1.170 | 0.292 |
| Temp (°C) (Q) | 0.000 | 1 | 0.000 | 0.203 | 0.656 |
| (2) [collagen] (L) | 0.001 | 1 | 0.001 | 0.560 | 0.462 |
| [collagen] (Q) | 0.000 | 1 | 0.000 | 0.085 | 0.773 |
| (3) [fucoidan] (L) | 0.196 | 1 | 0.196 | 71.419 | 0.000 |
| [fucoidan] (Q) | 0.003 | 1 | 0.003 | 1.412 | 0.248 |
| Error | 0.054 | 20 | 0.002 | ||
| Total SS | 0.261 | 26 | |||
| R2 = 0.78; adj R2 = 0.72; MS = 0.00 | |||||
| Variable of ATPs (RLU) | |||||
| Factor | Sum of squares (SS) | df | Mean square (MS) | F-value | p-value |
| (1) Temp (°C) (L) | 1.07 × 10¹⁰ | 1 | 1.07 × 10¹⁰ | 4.158 | 0.054 |
| Temp (°C) (Q) | 3.90 × 10⁹ | 1 | 3.90 × 10⁹ | 1.515 | 0.232 |
| (2) [collagen] (L) | 3.68 × 10⁸ | 1 | 3.68 × 10⁸ | 0.143 | 0.709 |
| [collagen] (Q) | 1.13 × 10¹⁰ | 1 | 1.13 × 10¹⁰ | 4.422 | 0.048 |
| (3) [fucoidan] (L) | 1.22 × 10¹¹ | 1 | 1.22 × 10¹¹ | 47.455 | 0.000 |
| [fucoidan] (Q) | 3.79 × 10¹⁰ | 1 | 3.79 × 10¹⁰ | 14.715 | 0.001 |
| Error | 5.15 × 10¹⁰ | 20 | 2.57 × 10⁹ | ||
| Total SS | 2.36 × 10¹¹ | 26 | |||
| R2 = 0.78; adj R2 = 0.71; MS = 257 × 104 | |||||
Publisher’s Note: MDPI stays neutral with regard to jurisdictional claims in published maps and institutional affiliations. |
© 2022 by the authors. Licensee MDPI, Basel, Switzerland. This article is an open access article distributed under the terms and conditions of the Creative Commons Attribution (CC BY) license (https://creativecommons.org/licenses/by/4.0/).
Share and Cite
Carvalho, D.N.; Gonçalves, C.; Oliveira, J.M.; Williams, D.S.; Mearns-Spragg, A.; Reis, R.L.; Silva, T.H. A Design of Experiments (DoE) Approach to Optimize Cryogel Manufacturing for Tissue Engineering Applications. Polymers 2022, 14, 2026. https://doi.org/10.3390/polym14102026
Carvalho DN, Gonçalves C, Oliveira JM, Williams DS, Mearns-Spragg A, Reis RL, Silva TH. A Design of Experiments (DoE) Approach to Optimize Cryogel Manufacturing for Tissue Engineering Applications. Polymers. 2022; 14(10):2026. https://doi.org/10.3390/polym14102026
Chicago/Turabian StyleCarvalho, Duarte Nuno, Cristiana Gonçalves, Joaquim Miguel Oliveira, David S. Williams, Andrew Mearns-Spragg, Rui L. Reis, and Tiago H. Silva. 2022. "A Design of Experiments (DoE) Approach to Optimize Cryogel Manufacturing for Tissue Engineering Applications" Polymers 14, no. 10: 2026. https://doi.org/10.3390/polym14102026
APA StyleCarvalho, D. N., Gonçalves, C., Oliveira, J. M., Williams, D. S., Mearns-Spragg, A., Reis, R. L., & Silva, T. H. (2022). A Design of Experiments (DoE) Approach to Optimize Cryogel Manufacturing for Tissue Engineering Applications. Polymers, 14(10), 2026. https://doi.org/10.3390/polym14102026