Abstract
As a non-metallic composite material, widely applied in industry, rigid polyurethane (PUR) foams require knowledge of their dielectric properties. In experimental determination of PUR foams’ dielectric properties protection of one-side capacitive sensor’s active area from adverse effects caused by the PUR foams’ test objects has to be ensured. In the given study, the impact of polytetrafluoroethylene (PTFE) films, thickness 0.20 mm and 0.04 mm, in covering or simulated coating the active area of one-side access capacitive sensor’ electrodes on the experimentally determined true dielectric permittivity spectra of rigid PUR foams is estimated. Penetration depth of the low frequency excitation field into PTFE and PUR foams is determined experimentally. Experiments are made in order to evaluate the difference between measurements on single PUR foams’ samples and on complex samples “PUR foams + PTFE film” with two calibration modes. A modification factor and a small modification criterion are defined and values of modifications are estimated in numerical calculations. Conclusions about possible practical applications of PTFE films in dielectric permittivity measurements of rigid PUR foams with one-side access capacitive sensor are made.
1. Introduction
Rigid polyurethane foams (PUR foams) exhibit a low dielectric interference, their permittivity is nearly non-dispersive therefore a good dielectric performance can be ensured in a wide frequency range. That makes PUR foams an appropriate material for components of mechanical engineering, machine building, aerospace vehicles, electronics’ packaging, electric insulators, radomes—the shielding structures for out-door telescopes, locators, antennas, etc., providing a radio-frequency transparent layer along with dimensional stability [1,2,3].
As a non-metallic composite material, widely applied in industry, PUR foams require knowledge of their dielectric properties. Several values of dielectric permittivity (permittivity) are reported in an experimental investigation of rigid PUR foams with a capacitor at frequencies 100 Hz and 10 MHz according to ASTM D1673 [4]. In [5] a one-side access (OSA) capacitive sensor was used to determine permittivity at low frequencies 10 Hz–0.33 MHz for (1) petrochemically-rigid PUR foams, density 32–539 kg/m3: 1.059 ≤ ε ≤ 2.067 and for (2) monolithic petrochemical-origin polyurethane, density 1280 kg/m3: 3.47 ≥ ε ≥ 3.31. To characterise the dielectric dispersion, the dropping factor was introduced and calculated for the investigated PUR foams of densities up to 400–450 kg/m3 as F ≤ 5.0% and F ≈ 6.0% for monolithic petrochemical polyurethane.
Experimental determination of rigid PUR foams dielectric properties with capacitive sensors meats several problems. PUR foams release gasses from foaming process [1,2] that may cause oxidation or other chemical processes in the metal of the capacitive sensor’s active area (e.g., brass or copper). PUR foams can carry considerable static electricity (caused by exploitation and processing conditions) that damages the electronic system of sensors [5]. The daylight degraded and mechanically-processed surfaces of PUR foams’ drop plastic micro-particles [1,2], leading to mechanical contamination of the sensor’s active area, thus the accuracy of the permittivity measurements is reduced.
Protection of the capacitive sensor’s active area from adverse side effects caused by the PUR foams’ test objects has to be ensured. Different solutions for protection of capacitive sensor’s electrodes exist in experimental investigation of other dielectric materials. In [6] the copper plates of the electrodes are covered with a protecting varnish to avoid the oxidation from contact with the test object (The soil) and to eliminate effect of electric load conduction through the dielectric. A protective layer is often placed over the electrodes in a capacitance sensor to prevent the direct contact to the test object [7]. The issues in sensor construction include the choice of materials for the electrodes, insulation layer, substrate etc. When the active area of sensor’s electrodes is coated with a protective layer, the coating has to satisfy certain requirements. The permittivity value for the material of protective layer should be chosen close to the value of material of the test object to reduce modification of the electric field [8]. The thicknesses of the protective layer can influence the signal strength and the sensitivity distribution therefore it has to be optimised [9]. The material of the layer has to have a nearly constant real part of the complex permittivity with respect to the frequency of electric field (non-depressiveness) and small imaginary part of the same not to cause dielectric losses. Since the test object comes into a direct contact with the sensor’s surface, the protective layer has to withstand certain mechanical wear as well. An analysis of scientific information sources revealed a lack of investigations and reliable experimental data on OSA capacitive sensor’s protective coverage and coating in permittivity measurements of cellular plastics, including rigid PUR foams. The major technical difficulties, connected to the plastics foams themselves, lie in extremely low permittivity values; e.g., rigid PUR foams of density 31 kg/m3 exhibit permittivity ≈ 1.065 (1 kHz), that is only ≈ 6% higher than the permittivity of vacuum [5].
When looking for a high-performance coating that offers exceptional temperature, chemical, friction, and abrasion resistance, the fluoropolymer coatings are often the solution. A fluoropolymer coating application is a generic term for xylan or polytetrafluoroethylene (PTFE) coatings. PTFE is a semi-crystalline non-polar polymer with the main chain [CF2-CF2]n; the brand name of PTFE-based formulas is “Teflon”. PTFE is reported to have frequency practically non-dependent permittivity ε and low dissipation factor tgδ. Those features of PTFE resins are also relatively independent of fabrication conditions. In [10] PTFE is reported to exhibit absence of significant dielectric losses up to its first order transition point at temperature T = 327 °C. At T = 23 °C and frequencies f = 102, 103, 104, and 105 Hz: ε′ = 2.001–2.002 and tgδ = 1–2 × 10⁻⁴. In [11] the low loss tangent of PTFE is explained as a consequence of the symmetrical conformation of the polymer backbone, which neutralizes the dipole forces of the C–F bonds yielding a net zero dipole moment. At 1 MHz dielectric constant of PTFE is determined as 2.1 and dissipation factor tgδ < 0.0002. In [12] a wide range of experimental data of PTFE investigations is reported. At room temperature T = 300 K, at frequencies 75 Hz and 500 Hz: tgδ < 1 × 10⁻⁴, at 1 kHz: tgδ < 1–6 × 10⁻⁴. At 5 kHz–2.2 MHz: tgδ < 1 × 10⁻⁴, at 1 kHz–316,000 Hz: tgδ = 2–6 × 10⁻⁴, 1 kHz–100 kHz: tgδ = 1.5–5.5 × 10⁻⁴. Dielectric permittivity at 100 Hz–1 MHz is given as ε′ = 2.2–2.0. Matis [13] reports values of dielectric permittivity and loss tangent of PTFE at two frequencies f = 100 Hz and 1 MHz: ε = 2.1 = const. and tgδ = 0.0005 and 0.0002. The lack of dependence of ε and tgδ on frequency is explained by PTFE having non-polar molecules and exhibiting only elastic polarization. Naidu [14] gives the following values at frequencies f = 50 Hz–1 MHz: ε = 2.3–2.8 and tgδ < 0.0002. Askeland [15] provides the data at 60 Hz–1 MHz: ε = 2.1 and 2.1 and tgδ = 0.00007 at 1 MHz. Jiang [16] reports dielectric constant of PTFE at 1 MHz as ε = 2.2 and dissipation factor tgδ < 0.00012.
The unique dielectric characteristics permit to use PTFE as thin wall insulation, as jacketing for computer wires and special control wires, for tubing and sleeving of capacitors, resistors, terminal junctions and solder sleeves. Due to small modifications caused by PTFE in the measured values of the dielectric properties of sample materials, PTFE spacers are used to adjust the gaps between electrodes in liquid parallel plate sample cells in the BDS-1308 broadband dielectric spectrometer (Novocontrol Technologies GmbH and Company KG (Montabaur, Germany)). Advanced technologies as a liquid spray or as a powder coating are developed for coating PTFE on metals, including brass that is often used for sensor’s electrodes.
The value of PTFE’s permittivity ε ≈ 2.1 coincides with that of rigid PUR foams of density 600 kg/m3 that corresponds to the middle of PUR foams’ full range of densities: at 31 kg/m3 permittivity ≈ 1.065; at 550 kg/m3 ε ≈ 2.1 and for monolithic polyurethane, density 1280 kg/m3, permittivity ≈ 3.3 (1 kHz) [5]. PTFE is nonreactive, it reduces mechanical friction and wear (PTFE’s static frictional coefficient ≈ 0.04), therefore, a longer service time of the protective coating can be expected. The dielectric and mechanical properties suggest PTFE’s usage in protection of OSA capacitive sensor’s active area in PUR foams’ permittivity measurements.
For OSA capacitive sensors the intensity maximum of low-frequency excitation field is situated in the direct vicinity to the active area of the electrodes [17]. Penetration depth of excitation field into the test object determines its thickness appropriate for permittivity measurements. Different criteria have been proposed for definition of penetration depth. In [18] the control depth of an OSA capacitive sensor is defined as distance to a conductive plane, parallel to the working surfaces of electrodes, placed in air, at which the capacitance, implemented by the conductive plane equals to a certain, predetermined quantity from the working capacitance of the capacitor. In [19] the overall capacitance of the system of two OSA sensors is measured and a half of the smallest distance between the planes of electrodes of the two sensors, starting from which the overall capacitance of the system remains constant, is taken as the depth of control zone of the OSA capacitive sensor. In [20] penetration depth of a concentric coplanar capacitive sensor is defined by identifying the test object thickness for which the capacitance is 10% smaller than its value when in contact with a similar, but infinitely thick, test-piece. When this condition is satisfied, the sensor penetration depth is equal to the test object’s thickness and is dependent on the permittivity of the test object. To determine thickness of PUR foams’ test object, appropriate for accurate permittivity measurements, penetration depth of excitation field into PTFE and rigid PUR foams has to be investigated.
In the given interdisciplinary research impact of PTFE films, thickness 0.20 mm and 0.04 mm, in covering or simulated coating of the active area of OSA capacitive sensor’ electrodes on the true dielectric permittivity spectra of rigid petrochemical- and bio-origin PUR foams is estimated by means of (1) a modification factor and (2) a small modification criterion. Single and complex samples, comprising PUR foams and PTFE films, are investigated experimentally at two calibration modes. Numerical estimations of the modifications in the true permittivity spectra are acquired for both PTFE films, thickness 0.20 mm and 0.04 mm, covering or coating the active area of OSA capacitive sensor’ electrodes. Conclusions about possible applications of PTFE film, thickness 0.04 mm, in protection of one-side capacitive sensor’s active area from adverse effects caused by the PUR foams’ test objects during dielectric permittivity measurements are made.
2. Materials and Methods
2.1. PUR Materials
Rigid closed-cell petrochemical PUR foams were made in laboratory conditions in a range of apparent core density 80 kg/m3 ≤ ρ ≤ 850 kg/m3, in blocks, in (a) open, free-rise moulds (25 cm × 25 cm × 20 cm) and (b) closed cylindrical polypropylene moulds (height = 8.0 cm and inner diameter = 10.0 cm) according to the technology and formulations given in [5]. Responding to the needs of bioeconomy, biopolyol was synthesized from Latvia-grown rapeseed oil by the trans-esterification method with triethanolamine (molar ratios 1 M:2.5 M and 1 M:2.9 M), in an environmentally friendly process, without emission of harmful substances, at temperatures T = 175 °C ± 5 °C and rigid closed-cell polyurethane biofoams were made in a range of apparent core density 80 kg/m3 ≤ ρ ≤ 450 kg/m3. Apparent core density of PUR foams (density) were determined according to ISO 845:2006. Differences in densities were achieved by varying the amount of physical or chemical blowing agents.
To make monolithic petrochemical polyurethane, a liquid mixture of the same formulation as for PUR foams was poured in polyethylene ampoules with an inner diameter 25.4 mm and length of 115 mm; no foaming agent was added. The ampoules were centrifuged for ~20 min at 5000 rpm in a centrifuge Sigma 3-30KS (Sigma Laborzentrifugen GmbH (Osterode am Harz, Germany)) to eliminate air inclusions created by mechanical mixing [5]. The PUR rods were removed from ampoules and samples were made. The developed technology ensured ≈ 2/3 of the length of cylindrical part free from gaseous inclusions.
Industrially manufactured rigid petrochemical PUR foams from a European producer Sika JSC (Baar, Switzerland) and General Plastics Manufacturing Company, (Tacoma, USA), were investigated as well to compare the results of the four groups of PUR foams.
2.2. Test Objects and Experiments
Permittivity was measured with an innovative, experimental dielectric spectrometer equipped with a capacitive sensor of OSA type [21]. Stray-immune capacitance measurements were carried out by using active guarding of the sensing electrode to increase the sensitivity and accuracy of the measurements. The test object was placed on the active area of the OSA capacitive sensor (OSA sensor), the diameter of the annular outer electrode D0 = 43 mm, Figure 1, and was excited via electrodes, by an electrical field generated by sinusoidal voltage signals. The amplitude value of the sinusoidal excitation signals U0 = 20 V. The signals were generated at discrete frequencies, increasing in a geometric progression:
where n is the ordeal number of frequency. The accuracy of the dielectric spectrometer in permittivity measurements, in conditions of repeatability, was estimated with the expanded uncertainty U95.45% = 0.01. The following test objects were investigated: (1) single samples of PUR foams and monolithic polyurethane, diameter D = 45 mm, thickness h = 20–25 mm, Figure 1, and (2) complex samples “A single PUR foams’ sample + PTFE film”. The true dielectric permittivity spectra εt were measured on single samples, when calibration of the spectrometer was made before the measurement series, with regard to the measurement value, delivered by the OSA sensor in air [21].
fn = f1, 2f1, ..., 2(n − 1)f1 Hz, where f1 = 10 Hz, n = 1, 2, ..., 16;
f = 10, 20, …, 327,680 Hz,
f = 10, 20, …, 327,680 Hz,
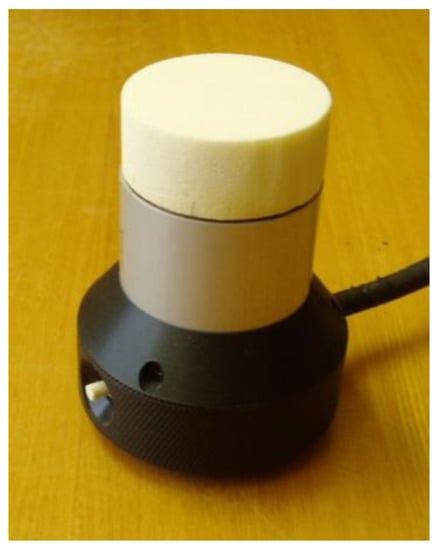
Figure 1.
OSA sensor and a PUR foams’ sample.
The true permittivity spectra, measured with the OSA capacitive sensor were compared to those measured with a Broadband Dielectric Spectrometer BDS-50, comprising a parallel plate capacitor, supplier: Novocontrol Technologies GmbH and Company KG (Montabaur, Germany), operating frequencies: 3 μHz–40 MHz, samples: discs of diameter 20–21 mm or 30–31 mm and thickness 0.1–2.0 mm. PUR foams in density range 95–1280 kg/m3 were tested. The relative difference between data provided by the two apparatuses remains ≤4% in the entire frequency range.
The measured value of dielectric permittivity was determined in two kinds of experiments: (1) for complex samples “A single PUR foams’ sample + PTFE film”, when calibration was made before the measurement series, with regard to the measurement value, delivered by the OSA sensor in air and (2) for complex samples “A single PUR foams’ sample + PTFE film”, when calibration was made before the corresponding measurement series, with regard to the measurement value, delivered by the OSA sensor in air, but covered with a PTFE film. The impact of PTFE films of thickness 0.20 mm and 0.04 mm was investigated.
In experiment no. 1, the OSA sensor’s active area is covered with a protective PTFE film temporarily during the measurement, and the film is removed during calibration. It gives the measured value of permittivity of a complex sample “A single PUR foams’ sample + PTFE film”. The value is denoted as the measured value of permittivity of a PUR foams’ sample εT. Experiment no. 2 simulates the case when OSA sensor’s active area is coated with a protective PTFE film permanently. It gives the measured value of permittivity of a complex sample “A single PUR foams’ sample + PTFE film”, when the measurement as well as calibration have to be made with a PTFE film on the OSA sensor. The value is denoted as the measured value of permittivity of a PUR foams’ sample εT′.
For measurements with PTFE films, a film element, length ≈ 30 cm and width ≈ 6 cm, was fixed in the horizontal plane between two massive dielectric parallelepiped posts at each side. The OSA sensor was placed beneath the film, the film was stretched to ensure a smooth adjoining to the OSA sensor’s active area and the measurement was made. Then a complex sample was formed: A single sample was put on the film and the measurement was made.
Due to limited transversal and lateral dimensions of the lab-made monolithic polyurethane (Rods of diameter ≈ 25 mm, length of the cylindrical part ≈ 60 mm), permittivity of monolithic polyurethane was measured on two semi-cylinders, cut from a polyurethane rod, ρ = 1280 kg/m3. Side-by-side the two semi-cylinders form a round cylinder, thickness h = 12 mm, diameter D = 45 mm, fully covering the active area of the OSA sensor. It was proved in [5] that the relative error between the values of permittivity of a cylindrical sample and two semi-cylinders does not exceed 0.5%.
A density gradient may exist in the moulded PUR foams’ blocks along rise direction, especially in a free rise [1,2]. To reduce its impact, samples were picked from the most homogeneous parts of the blocks. Air gaps between the active surface of the sensor and the sample may reduce the measured value of permittivity [3,13,17], therefore, surfaces of the samples were processed to ensure an appropriate degree of smoothness. Triboelectricity that accumulated on the samples at grinding was channelled away by placing samples on a conductive, grounded surface. Prior to measurements the samples were conditioned by storing at temperature T = 21 °C ± 1 °C and relative humidity RH = 45% ± 5% for a minimum of 24 h. Three successive measurements were made for each permittivity data point.
2.3. Dielectric Losses
The dielectric loss part ε′′(f) of the complex permittivity (jf) = ε′(f) − jε′′(f) was evaluated for PUR foams and bulk PTFE, based on data from direct experiments as well as scientific information sources. Dielectric losses of PUR foams were measured on Broadband Dielectric Spectrometer BDS-50 (Novocontrol Technologies GmbH and Company KG (Montabaur, Germany)), comprising a parallel plate capacitor, on samples of thickness 2 mm and diameter 30 mm. Five measurements were made for each data point. For lab-made PUR foams of densities 95–222 kg/m3 dielectric losses were measured as ε′′ = 0.0022–0.0063 at 1 kHz and ε′′ = 0.0032–0.0084 at 0.1 MHz. For monolithic lab-made polyurethane ε′′ = 0.042 at 1 kHz and ε′′ = 0.088 at 0.1 MHz. The acquired values are in a good correspondence with the experimental data reported in [22].
Dissipation factor for bulk PTFE at frequencies f = 50 Hz–1 MHz, at room temperature, is reported in [13,14,15,16] as tgδ < 0.0002. Taking into account ε′′ = ε′tgδ, ε′′ < 0.00042. BDS-50 gave the following results at 1280 Hz–81,920 Hz ε′′ = 0.00026–0.00027. For both materials the loss part is small in the considered frequency range, (jf) ≈ ε′(f) and ε′(f) = ε(f) is further referred to as permittivity.
2.4. Penetration Depth
Intensity maximum of the dielectric spectrometer’s low-frequency excitation field is situated in the direct vicinity to the active area of the OSA capacitive sensor’s electrodes [17]. Figure 2 gives the measured permittivity spectra of a PTFE film, thickness 0.20 mm, determined with (a) dielectric spectrometer equipped with the OSA sensor and (b) BDS-50. The homogeneous electric field of BDS-50 provides a spectrum of the measured permittivity values closer to those of the bulk PTFE ε ≈ 2.1 than the inhomogeneous and fast-attenuating electric field of the OSA sensor.
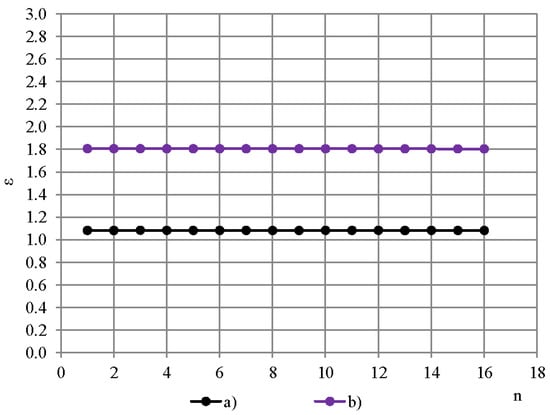
Figure 2.
Measured permittivity spectra of a PTFE film, 0.20 mm: (a) OSA sensor and (b) BDS-50.
Penetration depth of the excitation field is a crucial characteristic for a OSA capacitive sensor in determination of appropriate thickness of a single sample, depending on the parameters of the sensor and dielectric material of the sample [17,20]. To estimate penetration depth into PUR foams and PTFE films, first the measured value of permittivity of PTFE in dependence of thickness of cylindrical samples, diameter D0 ≈ 45 mm, thickness h = 0.04–24.6 mm, was determined experimentally with the OSA sensor, Figure 3. Layers were cut from the top of ~ 25 mm thick PTFE sample; permittivity of the remaining sample was measured and plotted against its thickness. Three measurements were made for each data point. Average density of the samples was calculated as 2177 ± 38 kg/m3 (±1.8%) that corresponds with the density values, reported in [12].
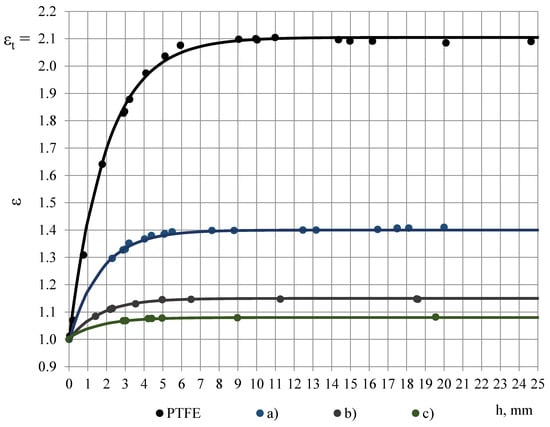
Figure 3.
Measured value of permittivity in dependence of sample’s thickness: PTFE and lab-made PUR foams, density (a) 228, (b) 88 and (c) 50 kg/m3 (experimental data and model functions, 1 kHz).
For thickness 11 mm ≤ h ≤ 25 mm the average permittivity was calculated 2.10 ± 0.011 (the expanded uncertainty U95%), at 1 kHz, and it is considered as the true value of PTFE’s permittivity εt, not depending on thickness. The value εt = 2.10 is in a good correspondence with the values reported in [13,15,16]. The experimental data is modelled with an exponential function, Figure 3:
ε = εt − e(0.1 − 0.5 h).
At other frequencies f1, f2, …, f16 the relationship ε = ε(h) remains practically the same due to insignificant dispersion of PTFE’s permittivity.
The measured value of permittivity in dependence of sample’s thickness was determined for the lab-made PUR foams in the same way, modelling the experimental data with the exponential function ε = εt − (A+Bh), where εt—the true value of PUR foams permittivity, A and B—numerical coefficients, depending on the PUR foams’ density. To define penetration depth, the measured value of electric susceptibility is considered:
χ = ε − 1.00.
It permits defining the penetration depth for extremely light-weight PUR foams having permittivity value, close to that of vacuum; for any reduction percentage, e.g. if, in order to determine the penetration depth, a criterion of a 10% reduction of the true permittivity [20] is applied directly to the true permittivity of rigid PUR foams of density 50 kg/m3 (εt = 1.08 at 1 kHz), then:
where ε0 = 1.00 is permittivity of vacuum. That does not correspond to the definition of the true permittivity as a quantity always having values ≥ε0. Applying the mentioned criterion to the electric susceptibility solves the contradiction. In the given investigation the penetration depth of electric field is defined as the thickness h3% of a sample, at which the measured value of electric susceptibility χ is 3% less than the true value of electric susceptibility χt of an infinitely thick sample. Then for PTFE:
ε10% = εt − 10% εt = 0.97 < ε0;
χ = [χt − e(0.1–0.5 h) − 1.0 and
χ3% = χt − 0.03χt = 0.97χt = 1.07.
χ3% = χt − 0.03χt = 0.97χt = 1.07.
Then penetration depth h3% for PTFE is calculated as:
h = −2.0 [ln(χt − χ(h)) − 0.1];
h3% = −2.0 [ln(χt − χ3%) − 0.1] = 7.0 mm.
h3% = −2.0 [ln(χt − χ3%) − 0.1] = 7.0 mm.
Thickness of the PTFE films 0.20 and 0.04 mm << h3%, hence it can be concluded that the electric field, generated by sinusoidal voltage signal at frequencies f1, f2, …, f16 fully penetrates the PTFE films and reaches PUR foams’ sample.
For PUR foams of densities 50–228 kg/m3 and εt = 1.14–1.42 (1 kHz), penetration depth was determined as 5.72 mm ≤ h3% ≤ 5.87 mm ± 0.02 mm. That corresponds to the conclusions in [20]: In the meaning of the given penetration depth definition, penetration depth of a concentric coplanar capacitive OSA sensor increases as the permittivity of the sample increases. In order to achieve the same 3% difference, samples with high εt values need to have bigger penetration depth h3%, whereas samples with low εt values can have smaller h3% to achieve the same percentage of difference [20]. The PUR foams’ single samples have to be thick enough to provide the true value of permittivity, therefore, 3–4 times higher thickness than the penetration depth h3% was taken as appropriate for PUR foams’ samples of densities 50–1280 kg/m3: h ≈ 20–25 mm.
2.5. Dropping Factor
Dielectric dispersion is the dependence of permittivity of a dielectric material on the frequency of an applied electric field. Because there is a lag between changes in the external electric field and changes in polarization in a dielectric, the permittivity of a dielectric is a complicated function of frequency of the electric field [3]. Dielectric dispersion of both components of the complex sample (PTFE and PUR foams) has to be evaluated. PTFE is known to have a small frequency dependence of permittivity in frequency range 100 Hz–10 MHz [10,11,12,13,14,15,16]. To evaluate frequency dependence of PTFE’s permittivity in the frequency band f = 10, 20, …, 327,680 Hz, permittivity spectra of PTFE samples of different thickness h were measured with the OSA sensor, Figure 4A,B. Three repeated measurements were made for each sample.
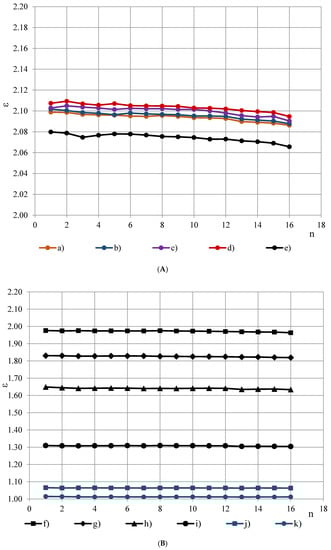
Figure 4.
(A) Permittivity spectra of PTFE samples of thickness (a) 24.64, (b) 20.10, (c) 16.18, (d) 10.99 and (e) 5.94 mm. (B) Permittivity spectra of PTFE samples of thickness (f) 4.10, (g) 2.90, (h) 1.77 mm, (i) 0.77 and PTFE films of thickness (j) 0.20 mm and (k) 0.04 mm.
The spectra ε(fn) were approximated with 2-nd order polynomials, e.g., for the PTFE films, Figure 4B, (j) and (k):
where the ordinal number n of the frequency is calculated from Equation (1) as n = (logfn − 1)/log2 + 1. To characterise the dielectric dispersion, the dropping of permittivity φ was calculated from the most monotonous part f3, f4, …, f14 of the approximated spectra as:
where ε(f3) and ε(f14)—permittivity at f3 = 40 Hz and f14 = 81 920 Hz. For PTFE films φ ≈ 0.09% at thickness h = 0.20 mm and φ ≈ 0.12% at h = 0.04 mm, Figure 5. Starting from a certain value of h ≈ 5 mm, dropping becomes independent of thickness. The thickness-independent value of dropping is denoted as dropping factor φ0. Then the relationship φ = φ(h) can be described with an exponential function:
ε = 0.000003n2 − 0.000136n + 1.064500 and
ε = 0.000017n2 − 0.000411n + 1.013888,
ε = 0.000017n2 − 0.000411n + 1.013888,
φ = [ε(f3) − ε(f14)]/ε(f3),
φ(h) = φ0 − e[(0.85 − h) − 1.0].
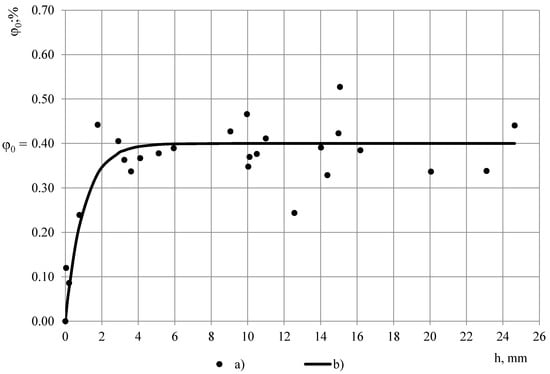
Figure 5.
Dropping in dependence of PTFE sample’s thickness: (a) Experimental data and (b) model function.
For the investigated PTFE dropping factor was calculated as φ0 = 0.40% ± 0.73% (U95%) that shows a small dielectric dispersion of PTFE’s permittivity and corresponds to the requirements set for the material of protective coverage/coating. In comparison, even the most light-weight foams from the investigated ones PUR foams LAST-A-FOAM® FR-3703, density ρ ≈ 48 kg/m3, porosity ηg = 1 − ρ/ρp = 96% and εt = 1.08 (1 kHz), exhibit nearly two times higher dropping factor φ0 ≈ 0.7%, where ρp = 1280 kg/m3 is density of monolithic polyurethane. Dropping factor, calculated from the approximated permittivity spectra of PUR foams, is given in dependence of PUR foams’ density in Table 1 and Figure 9.

Table 1.
Data of the permittivity spectra εt, εT and εT′.
2.6. Permittivity Spectra
The true permittivity spectra εt of (a) light-weight PUR foams LAST-A-FOAM® FR-3703, ρ = 48 kg/m3, (b) PUR foams Sika-150, ρ = 144 kg/m3 and (c) monolithic lab-made polyurethane, density 1280 kg/m3 are given in Figure 6, Figure 7 and Figure 8 together with permittivity spectra εT and εT′. The permittivity spectra are approximated with the third order polynomials of frequency ordeal number n.
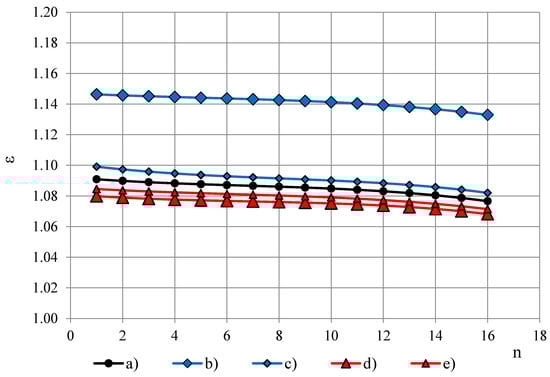
Figure 6.
Permittivity spectra of PUR foams LAST-A-FOAM® FR-3703, ρ = 48 kg/m3: (a) εt, (b) εT at PTFE film 0.20 mm, (c) εT at PTFE film 0.04 mm, (d) εT′ at PTFE film 0.20 mm and (e) εT′ at PTFE film 0.04 mm.
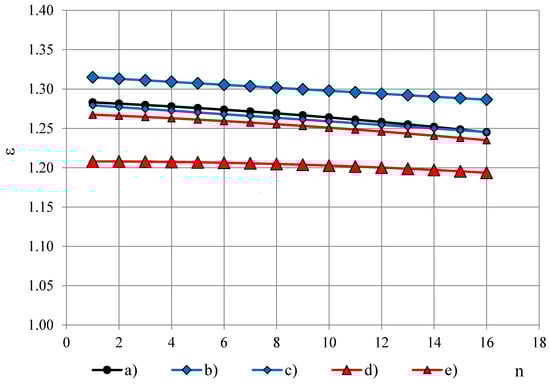
Figure 7.
Permittivity spectra of PUR foams Sika-150, ρ = 144 kg/m3: (a) εt, (b) εT at PTFE film 0.20 mm, (c) εT at PTFE film 0.04 mm, (d) εT′ at PTFE film 0.20 mm and (e) εT′ at PTFE film 0.04 mm.
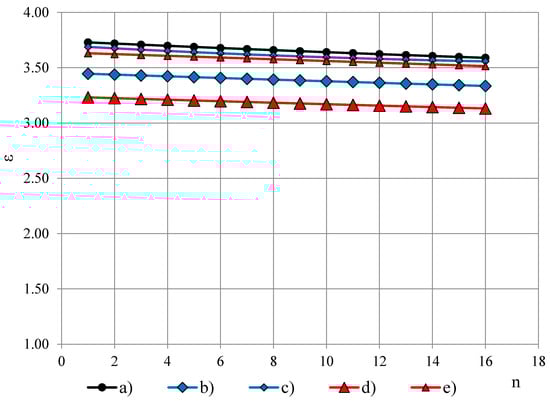
Figure 8.
Permittivity spectra of lab-made monolithic polyurethane, ρp = 1280 kg/m3: (a) εt, (b) εT at PTFE film 0.20 mm, (c) εT at PTFE film 0.04 mm, (d) εT′ at PTFE film 0.20 mm and (e) εT′ at PTFE film 0.04 mm.
Experimental data of the true permittivity εt is summarized in Table 1, at 1 kHz, where U95%—the expanded uncertainty. The εt values of the same density PUR foams are similar for the four groups that correlate with results in [5].
Table 1 gives data of dropping factor φ0, calculated from the approximated permittivity spectra. Figure 9 depicts φ0 in dependence of density of (a) lab-made PUR foams, (b) lab-made PUR biofoams, (c) Sika JSC PUR foams and (d) General Plastics Manufacturing Company PUR foams. For the light-weight PUR foams the dependence φ0(ρ) is nearly linear, φ0 ≤ 1.5%, up to densities 100 kg/m3 for all four groups of PUR foams. The highest dropping factor is exhibited by Sika JSC PUR foams and the lab-made PUR biofoams at densities 550–650 kg/m3: φ0 ≈ 4.0–4.5%. After the maximum the value of φ0 decreases to the dropping factor value of monolithic polyurethane. All the values of PUR foams’ dropping factor are 10–40 times higher than dropping of PTFE films 0.02/0.04 mm: 0.09% and 0.12%, which facilitates small modifications of permittivity spectra caused by a PTFE film on the OSA sensor’s active area.
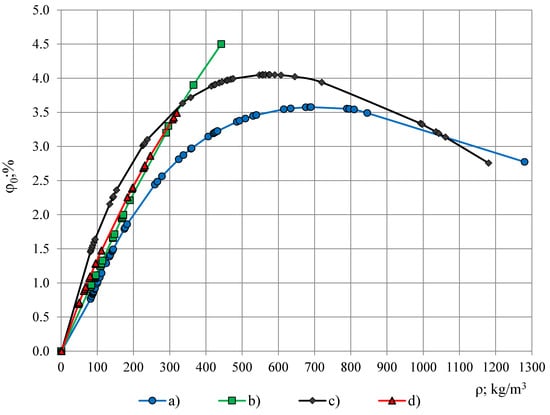
Figure 9.
Dropping factor in dependence of PUR foams’ density: (a) lab-made foams, (b) lab-made biofoams, (c) Sika JSC foams and (d) General Plastics Manufacturing Company foams.
The measured values of permittivity εT and εT′ are also summarized in Table 1, at 1 kHz. Values of εT characterise the overall impact of the PTFE film on the true value of PUR foams’ permittivity. Values of εT′ give the measured permittivity value of PUR foams’ when coating with a PTFE film of OSA sensor’s active area is simulated and calibration has to be made with a PTFE film.
2.7. Estimation of Modifications
To estimate impact of the PTFE films on the PUR foams’ true permittivity spectra εt(fn), the average modification factor ηTaver is defined for permittivity spectra εT(fn) and εT′(fn):
ΔεtT(fn) = [εt(fn) − εT(fn)]/εt(fn),
ΔεtT′(fn) = [εt(fn) − εT′(fn)]/εt(fn), n = 1, 2, …, 16;
ΔεtT′(fn) = [εt(fn) − εT′(fn)]/εt(fn), n = 1, 2, …, 16;
When the entire measured permittivity spectrum εT(fn) or εT′(fn) lies above the true permittivity spectrum εt(fn), ηTaver < 0.0; when it lies below εt(fn), ηTaver > 0.0. If spectrum εT(fn) or εT′(fn) intersects the spectrum εt(fn), absolute values of differences |ΔεtT(fn)| and |ΔεtT′(fn)| have to be taken in Equation (10).
The spectra εt(fn) and εT′(fn) are evaluated towards a criterion of small modifications as well:
where η0 is a small modification parameter. Modification of the true permittivity spectrum εt by presence of a PTFE film is considered as small when the measured values of permittivity εT or εT′ at each frequency fn differ from the true permittivity values εt no more than by a pre-defined value ±Δεt, calculated as a η0 fraction from the average value εtaver of the true permittivity spectrum values εtn:
i.e., the entire spectrum εT(fn) or εT′(fn) has to be situated inside a zone around the true permittivity spectrum εt(fn) defined by Equation (12). The value of η0 depends on the required accuracy of measurements.
|εt(fn) − εT(fn)| ≤ Δεt, |εt(fn) − εT′(fn)| ≤ Δεt, n = 1, 2, ..., 16;
εt(fn) − η0 εtaver ≤ εT(fn) ≤ εt(fn) + η0 εtaver;
εt(fn) − η0 εtaver ≤ εT′(fn) ≤ εt(fn) + η0 εtaver.
εt(fn) − η0 εtaver ≤ εT′(fn) ≤ εt(fn) + η0 εtaver.
The impact of PTFE films on the PUR foams’ true permittivity spectra εt(fn) was estimated for PUR foams of Table 1, according to the following methodology. First, the numerical value of average modification factor was calculated for εT(fn) and εT′(fn). Depending on the required accuracy, a certain limit value for the average modification factor is set. As an example, ηlim was set to 3.5%, the calculated ηTaver and ηT′aver values were compared to ηlim and conclusions made. Then the average permittivity value of the true permittivity spectra εtaver was calculated, the small modification parameter was set to values η0 = 1, 2, ..., 5% and satisfaction of the criterion of small modifications by the spectra εT(fn) and εT′(fn) was tested. A PC code was compiled for numerical calculations.
3. Results
3.1. Average Modification Factor
Numerical calculations of the average modification factor ηTaver for permittivity spectra εT(fn), corresponding to the coverage with a PTFE film, thickness 0.20 mm, gave the following results, Table 1: (1) Lab-made PUR foams: −4.0% ≤ ηTaver ≤ 7.3% at PUR foams’ density 84–1280 kg/m3; (2) lab-made PUR biofoams: −4.3% ≤ ηTaver ≤ 1.6% at 84–442 kg/m3; (3) Sika JSC PUR foams: −4.9% ≤ ηTaver ≤ 7.1% at 85–1181 kg/m3 and (4) Gen. Plast. PUR foams −5.2% ≤ ηTaver ≤ −0.7% at 85–320 kg/m3.
Numerical calculations of ηT′aver for permittivity spectra εT′(fn), corresponding to simulating coating with a PTFE film, thickness 0.20 mm, gave the following results, Table 1: (1) lab-made PUR foams ηT’aver = 2.8–14.0% at 84–1280 kg/m3, (2) lab-made PUR biofoams ηT’aver = 3.1–9.5% at 84–442 kg/m3, (3) Sika JSC PUR foams ηT’aver = 2.6–13.6% at 85–1181 kg/m3 and (4) Gen. Plast. PUR foams ηT’aver = 0.9–5.2% at 48–320 kg/m3. It can be concluded that the average modifications caused by the PTFE film of thickness 0.20 mm are quite high in both cases: up to 10–14% and exceed ηlim = 3.5%.
For permittivity spectra εT(fn), corresponding to the coverage with a PTFE film, thickness 0.04 mm, the following numerical values of ηTaver were acquired, Table 1: (1) Lab-made PUR foams ηTaver = −0.4–1.2% at 84–1280 kg/m3, (2) lab-made PUR biofoams ηTaver = −0.5–0.4% at 84–442 kg/m3, (3) Sika JSC PUR foams ηTaver = −0.5–1.3% at 85–1181 kg/m3 and (4) Gen. Plast. PUR foams ηTaver = −0.6–0.4% at 48–320 kg/m3. It can be concluded that the |ηTaver| remains less than 1.3% as well as less than ηlim = 3.5% in density range of PUR foams 84–1280 kg/m3, which might be acceptable for certain practical applications, depending on the required accuracy, e.g., to perform a quick evaluation of rigid PUR foams’ permittivity in field conditions (Thermal insulation, shielding structures, etc.). Calibration of the spectrometer can be made in air, but the permittivity measurements of the rigid PUR foams’ test object—with a PTFE film temporarily covered underneath the test object, on the OSA sensor’s active area, to protect the OSA sensor’s electrodes from the adverse side effects caused by the PUR foams’ test object. Thus, an operational flexibility can be retained, since the OSA sensor does not have to be permanently coated with the PTFE film.
For permittivity spectra εT′(fn), corresponding to simulating coating with a PTFE film, thickness 0.04 mm, the dependence of ηT′aver on PUR foams’ density, Table 1, is depicted in Figure 10.
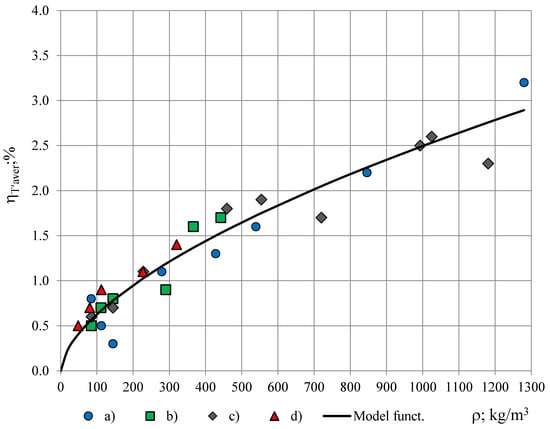
Figure 10.
Average modification factor ηT′aver in dependence of PUR foams’ density: (a) Lab-made petrochemical, (b) lab-made biofoams, (c) Sika JSC and (d) General Plastics Manufacturing Company.
The relationship ηT′aver = ηT′aver(ρ) follows a similar trend for all four groups of PUR foams and can be described with a function:
ηT′aver(ρ) = Kρ0.60, where K = 0.04.
It can be concluded that with a PTFE film, thickness 0.04 mm, the average modification factor of the true permittivity spectra remains less than ηlim = 3.5% for density range of rigid PUR foams 48–1280 kg/m3. For the light- to medium-weight PUR foams of density ρ ≤ 220 kg/m3, applied in shielding structures, building, heat and cold insulation etc. [23,24,25,26], the average modification factor is even smaller: ηT′aver ≤ 1.0%. At similar densities the values of ηT′aver are similar for the four investigated groups of PUR foams: (a) lab-made petrochemical, (b) lab-made biofoams, (c) Sika JSC and (d) General Plastics Manufacturing Company. It can be concluded that the modifications, caused by a simulated permanent coating of a PTFE film, thickness 0.04 mm, on the active area of the OSA sensor, might be acceptable for certain practical applications, depending on the required accuracy.
3.2. Small Modification Criterion
Numerical calculations, made for the lab-made and Sika JSC PUR foams showed that for a temporary coverage with a PTFE film, thickness 0.20 mm, the criterion of small modifications is satisfied by permittivity spectra εT(fn) for small values of η0 = 1.0%, 1.5% and 2.0% only in a narrow density range 250–550 kg/m3 and, thus, represent no practical interest.
When PTFE film is of thickness 0.04 mm, the criterion is satisfied by permittivity spectra εT(fn) of the lab-made PUR foams when η0 = 1.0% in a density range 84–550 kg/m3 and when η0 = 1.5–5.0% in a density range 84–1280 kg/m3. The trend is similar for lab-made PUR biofoams, Sika JSC and Gen. Plast. PUR foams, too. Such modifications might be acceptable for certain practical applications, depending on the required accuracy.
Numerical calculations, made for the lab-made and Sika JSC PUR foams, showed that in the simulation of a permanent PTFE film’s coating, thickness 0.20 mm, the criterion is satisfied by permittivity spectra εT′(fn) only starting from η0 = 3.0%, up to densities ρ ≈ 100 kg/m3, at η0 = 4.0%, up to ρf ≈ 250 kg/m3 and at η0 = 5.0%, up to ρf ≈ 350 kg/m3. At the small values η0 = 1.0%, 1.5% and 2.0% the criterion is not satisfied by the spectra εT′(fn) in density range 85 kg/m3–1280 kg/m3. The trend is similar for lab-made PUR biofoams and Gen. Plast. PUR foams. The modifications caused by the PTFE film of thickness 0.20 mm are quite high and likely unacceptable for practical applications.
When the PTFE film is of thickness 0.04 mm, the criterion is satisfied by permittivity spectra εT′(fn) of the lab-made PUR foams at: (a) η0 = 1.0%, up to densities ρ ≈ 200 kg/m3, (b) η0 = 1.5%, up to ρf ≈ 430 kg/m3, (c) η0 = 2.0%, up to ρf ≈ 700 kg/m3, (d) η0 = 3.0%, up to ρ ≈ 1 100 kg/m3 and (e) η0 = 4.0 and 5%, up to ρ ≈ 1280 kg/m3. The trend is similar for lab-made PUR biofoams, Sika JSC and Gen. Plast. PUR foams. The modifications might be acceptable for certain practical applications, depending on the required accuracy.
4. Evaluation of Measurement Uncertainties
4.1. Measurement Uncertainties Due to Air Gaps
Measurement uncertainties due to air gaps (gaps) between active surface of the OSA sensor and bottom of the cylindrical samples (PUR foams and PTFE) are evaluated. The gaps are formed by cavities in the bottom surface of a sample from one side and active surface of the sensor, from the other. The active surface of the sensor was evaluated and assumed to be ideally smooth. The cavities in the bottom surface of the cylindrical samples are caused mainly by (1) foaming defects—spherical/ellipsoidal segments of gaseous macro-bubbles and (2) surface-smoothing, etc., processing. Samples with macro-segments of diameter > 3 mm, significantly exceeding the average diameter of the cells were excluded from experiments. To reduce processing cavities, the samples were cut from the central part of parallelepipeds, having area of the bottom surfaces at least two times as large as the area of a sample’s bottom.
Gaps between bottom surface of the sample and active surface of the sensor were investigated with steel indicators, thickness 0.03–0.50 mm. The sample was placed on the sensor and indicators of thickness 0.50, 0.40, ..., 0.10 mm and 0.09, 0.08, ..., 0.03 mm were slid around the perimeter of the contact surface. When the indicator entered the gap without resistance, it was assumed that its height is equal to the thickness of indicator. An indicator of the least thickness 0.03 mm was applied to determine width and depth of a gap.
It was identified that PUR foams’ samples of densities 40–200 kg/m3 each had 1–3 cavities of height h = 0.03–0.06 mm, width w = 7–22 mm and depth d = 1–3 mm. PUR foams’ samples, ρf > 200 kg/m3 and PTFE samples have only comparatively small cavities of h < 0.03 mm and w < 7 mm that are not taken into account further. All cavities are situated along the perimeter of sample’ bottom surface.
Gaps are assumed to have shape of a cylindrical wedge, Figure 11, where w = 2a = , b = R(1 − cosψ), ψ—polar angle and R—radius of the sample’s bottom. Volume of the wedge:
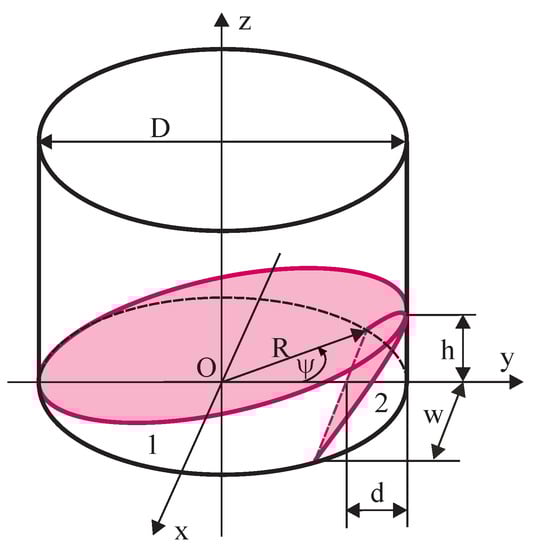
Figure 11.
Gaps between the bottom surface of a sample and active area of the sensor: 1) a penetrating gap and 2) a perimetral gap.
Two types of wedge-shaped gaps are considered: perimetral (ψ ≪ π/2) and penetrating (ψ = π). A penetrating gap is formed when a sample is put with one end of its bottom diameter on a PTFE spacer of thickness hs, while the other end is built on the perimeter of the sensor, in a point-contact. Volume of a penetrating gap at hs = 1.0 mm equals V0 = 795.2 mm3.
Table 2 gives numerical values of volumes V of the perimetral gaps and of proportion K = V/V0. Modelling the limit case when each sample of density below 200 kg/m3 has three largest perimetral cavities of dimensions h = 0.06 mm, w = 22 mm and d = 2.9 mm, k is calculated:
Table 2.
Parameters of perimetral gaps.
To estimate influence of a penetrating air gap (εair ≈ 1.00059) on the measured value of true permittivity εt, a spacer—a PTFE strip of thickness hs = 1.0 mm and width 2 mm was placed on the perimeter of the sensor at depth ~ 2 mm. A sample was built on the spacer and the sensor, forming a penetrating gap. The true permittivity εt and the measured value of the true permittivity εtpn with a penetrating gap was measured for PUR foams’ samples, ρf = 48 and 144 kg/m3, Table 3. Three measurements were made for each sample. The change in the value of the true permittivity due to a penetrating gap is calculated as:
Δεtpn = εt − εtpn.
Table 3.
Influence of a penetrating air gap on the true permittivity, 1 kHz.
The change Δεtpn due to gaps is assumed to be proportional to the total volume and location of gaps. Even with the maximum amount of the biggest perimetral gaps their total volume is ≈ 260 times less than the volume V0 of a penetrating gap of height 1 mm, Equation (15). A penetrating gap is situated above the whole active surface of the sensor, therefore Δεtpn characterises an averaged influence of location. On the contrary, the experimentally identified gaps are perimetral gaps, situated along the perimeter of sensor’s active surface, where intensity of the excitation field is the weakest. It is concluded that for PUR foams, ρf < 200 kg/m3, the upper boundary of the change in the value of the true permittivity caused by the identified perimetral gaps is ΔεUtpm = Δεtpn/k, Table 4. A sample with no cavities provides the lower boundary: ΔεLtpm = 0.0.
Table 4.
Boundaries of changes caused by perimetral gaps, 1 kHz.
It is expected that all the values of εt for a PUR foams’ sample, ρf < 200 kg/m3, with perimetral cavities, fall in the mentioned limits, therefore:
where U95%g is the expanded uncertainty of measurement, based on a standard uncertainty multiplied by a coverage factor k = 2, which for a normal distribution corresponds to a coverage probability of approximately 95% [27,28].
U95%g = 1/3(ΔεUtpm − ΔεLtpm);
4.2. Measurements Uncertainty of εt
The measurement uncertainty of true permittivity εt is evaluated for lab-made PUR foams, ρf = 50, 112, 144, 427, 846 kg/m3, monolithic polyurethane 1280 kg/m3 and PTFE according to ISO Guide to the Expression of Uncertainty in Measurement (GUM) [27,28]. The accuracy of the dielectric spectrometer in conditions of reproducibility was evaluated with expanded uncertainty U95%S = ± 0.01. In Type A evaluation series of n = 3–4 statistically independent, non-destructive observations are made for each sample of PUR foams and monolithic polyurethane; for the PTFE sample n = 18. Measurement uncertainty arises mainly due to inhomogeneous density of the samples, air gaps between the sample and active surface of the sensor etc. Since the expanded uncertainty of true permittivity due to perimetral gaps U95%g is several orders smaller than U95%S due to the limited accuracy of the spectrometer (Table 4), the air gaps are not taken into account. Estimate of the input quantity and sensitivity coefficient are calculated: and c1 = 1.0. Attributing normal distribution to the measurand, effective degrees of freedom νeff of the combined standard uncertainty uc(εt) associated with the output estimate are estimated from the Welch—Satterthwaite formula:
where N is the number of the input quantities. The numerical results for standard uncertainty u(εt) for Type A evaluation at frequencies f1, f7 and f16 are given in Table 5.
Table 5.
Measurement uncertainties of the true permittivity spectra εt.
The measurement uncertainty due to limited accuracy of dielectric spectrometer and digital calliper is considered in Type B evaluation. Measurements of sample’s thickness were made with a digital calliper of limited resolution δh and accuracy δδh. However, taking into account the high allowance for thickness: 2.0–2.5 times larger than the penetration depth, δh and δδh practically have no influence on the measured value of εt and are not taken into account. That yields the standard uncertainty u(εt) = U95%S/2 = ± 0.05.
The combined standard uncertainty is calculated from Type A and Type B uncertainty budget , where N = 2. When a number of distributions of whatever form are combined it can be shown that, apart from in exceptional cases, the resulting probability distribution tends to the normal form in accordance with the Central Limit Theorem [28]. Then for a normal distribution the expanded uncertainty is calculated as U95% = kuc(εt), where k = 2 is the coverage factor.
For PUR foams, ρf = 427 kg/m3 and f7 = 640 Hz, the measurement result for a series is εt = 1.865 ± 0.011. The reported expanded uncertainty U95% of εt measurement is stated as the standard uncertainty of measurement multiplied by the coverage factor k = 2, which for a normal distribution corresponds to a coverage probability of approximately 95%.
Due to technological processes at foaming the heavier PUR foams are more inhomogeneous, especially lab-made ones. That increases the standard uncertainty u(εt) in Type A type evaluation, characterising the repeatability. For the most of the PUR foams input of Type A uncertainties is smaller or comparable to the input of Type B uncertainties. No significant difference in values of uc(εt) and U95% was identified for true permittivity spectra as measured and the approximated ones. It is concluded that approximation smooths out fluctuations in experimental data, retaining the dominating trend.
4.3. Measurement Uncertainty of Dropping Factor
The measurement uncertainty of dropping factor φ0 is evaluated for lab-made PUR foams, ρf = 50, 112, 144, 427, 846 kg/m3, monolithic polyurethane 1280 kg/m3 and PTFE according to GUM. In Type A type evaluation series of n = 3–4 statistically independent, non-destructive observations are made for each sample of PUR foams and monolithic polyurethane; for the PTFE sample n = 5. The permittivity spectra are approximated with the 3rd-order polynomials for PUR foams and with the 2nd-order polynomials for PTFE. The model function:
where ε(f3) and ε(f14)—input quantities. Estimates of ε3 = ε(f3) and ε14 = ε(f14) and corresponding sensitivity coefficients are calculated:
φ0 = [ε(f3) − ε(f14)]/ε(f3) = 1 − ε(f14)/ε(f3),
The measurement uncertainty due to limited accuracy of dielectric spectrometer is considered in Type B evaluation that yields the standard uncertainty u(ε3) = u(ε14) = U95%S/2 = ± 0.05. Uncertainty contribution of input quantities is expressed as u1(φ) = c1u(ε3) and u2(φ) = c2u(ε14) and the combined standard uncertainty is calculated from Type A and Type B uncertainty budget. Then for a normal distribution the expanded uncertainty U95% = kuc(φ0), where k = 2.
For PUR foams, ρf = 427 kg/m3 the measurement result for a series is φ0 = 0.037 ± 0.011. The reported expanded uncertainty U95% of εt measurement is stated as the standard uncertainty of measurement multiplied by the coverage factor k = 2, which for a normal distribution corresponds to a coverage probability of approximately 95%.
For PTFE the measurement result for a series is φ0 = 0.40% ± 0.68%, Table 6. Uncertainties larger than measured values are common in measurements where the measurand value is expected to be zero or close to it, as the dropping factor of PTFE.
Table 6.
Measurement uncertainties of dropping factor φ0.
No significant difference in values of uc(φ0) and U95% was identified for dropping factor φ0 calculated from the permittivity spectra as measured and the approximated ones.
4.4. Measurement Uncertainty of Complex Samples
The Type A measurement uncertainty of the measured permittivity spectra εT and ε′T is evaluated for lab-made PUR foams, ρf = 50, 112, 144, 427, 846 kg/m3 and monolithic polyurethane 1280 kg/m3 according to GUM. In Type A type evaluation series of n = 3–4 statistically independent, non-destructive observations are made for each PUR foams sample and monolithic polyurethane, Table 7. Measurement uncertainty arises mainly due to inhomogeneous density and structure of the samples, air gaps between the sample, the PTFE films and active surface of the sensor, etc.
Table 7.
Measurement uncertainties of the measured permittivity spectra (at f7, permittivity spectra as measured).
Experimental investigation with the indicators showed no significant difference in the dimensions of the gaps in the case of the PTFE films of thickness 0.04 mm in comparison to single samples. With PTFE film of thickness 0.20 mm the gaps between the sample, the PTFE films and active surface of the sensor were around two times higher and wider than in case of single samples. Since the same spectrometer is used, the uncertainties of εT and ε′T can be expected to be of the same order as those of εt. Additional experimental and theoretical research is necessary to evaluate the uncertainties of the measured permittivity spectra εT and ε′T more precisely.
5. Discussion
The impact of PTFE films, thickness 0.20 mm and 0.04 mm, in covering and simulated coating of the active area of OSA capacitive sensor’ electrodes on the true dielectric permittivity spectra of rigid petrochemical- and bio-origin PUR foams is estimated by means of (1) a modification factor and (2) a small modification criterion. Although the quantitative results for estimation of impact of PTFE films are valid for the given OSA sensor with its topography of electric field, the developed methodology can be applied for OSA capacitive sensors of other configuration and dimensions of electrodes, independent of the sensor’s particular technical solution.
The methodology can be applied for solving similar problems in dielectric permittivity measurements of other cellular plastics: polyvinyl chloride, polyethylene, polystyrene, polypropylene, polyolefin, etc., foams as well as for impact estimation of other plastic films, e.g., polyethylene. For practical realisation of the PTFE protective coating, further investigations are needed on the relevant technologies, sustainability of the coating against mechanical rupture, wear and de-lamination during exploitation, etc.
The PTFE films’ protection can be useful in dielectric permittivity measurements of rigid PUR foams’ samples as well as in the non-destructive evaluation of PUR foams’ industrial items.
Author Contributions
Conceptualization: I.B.; methodology: I.B. and U.C.; software: I.B.; validation: I.B. and S.G.; formal analysis: I.B., U.C. and S.G.; investigation: I.B., U.C. and S.G.; resources: I.B., U.C. and S.G.; data curation: I.B.; writing—original draft preparation: I.B.; writing—review and editing: I.B. and U.C.; visualization: I.B. All authors have read and agreed to the published version of the manuscript.
Funding
This research received no external funding.
Institutional Review Board Statement
Not applicable.
Informed Consent Statement
Not applicable.
Data Availability Statement
Data is contained within this article.
Conflicts of Interest
The authors declare no conflict of interest.
References
- Klempner, D.; Frisch, K.C. (Eds.) Handbook of Polymeric Foams and Foam Technology; Hanser Publishers: Munich, Germany, 1991; 413p. [Google Scholar]
- Берлин, А.А.; Шутoв, Ф.А. Химия и Технoлoгия Газoнапoлненных Высoкoпoлимерoв; Science: Moscow, Russia, 1980; 503p. (In Russian) [Google Scholar]
- Kremer, F.; Schonhals, A. (Eds.) Broadband Dielectric Spectroscopy; Springer-Verlag: Berlin/Heidelberg, Germany, 2003; 730p. [Google Scholar]
- Traeger, R. Physical properties of rigid polyurethane foams. J. Cell. Plast. 1967, 3, 405–418. [Google Scholar] [CrossRef]
- Beverte, I.; Shtrauss, V.; Kalpinsh, A.; Lomanovskis, U.; Cabulis, U.; Sevastyanova, I.; Gaidukovs, S. Permittivity of Rigid Rapeseed Oil Polyol Polyurethane Biofoams and Petrochemical Foams at Low Frequencies. J. Ren. Mat. J. Renew. Mater. 2020, 8, 1151–1170. [Google Scholar] [CrossRef]
- Rende, A.; Biage, M. Characterization of capacitive sensors for measurements of the moisture in irrigated soils. J. Braz. Soc. Mech. Sci. 2002, 24, 226–233. [Google Scholar] [CrossRef]
- Hu, X.; Yang, W. Planar capacitive sensors—Designs and applications. Sens. Rev. 2010, 30, 24–39. [Google Scholar] [CrossRef]
- Xie, C.G.; Stott, A.L.; Plaskowski, A.; Beck, M.S. Design of capacitance electrodes for concentration measurement of two-phase flow. Meas. Sci. Technol. 1990, 1, 65–78. [Google Scholar] [CrossRef]
- Li, X.B.; Larson, S.D.; Zyuzin, A.S.; Mamishev, A.V. Design principles for multichannel fringing electric field sensors. IEEE Sens. J. 2006, 6, 434–440. [Google Scholar] [CrossRef]
- Ehrlich, P. Dielectrical Properties of Teflon from Room Temperature to 314 °C and from Frequencies of 102 to 105 c/s. J. Res. Nat. Bur. Stand. 1953, 51, 185–188. [Google Scholar] [CrossRef]
- Joseph, T.; Uma, S.; Philip, J.; Sebastian, M.T. Electrical and thermal properties of PTFE-Sr2ZnSi2O7 composites. J. Mater. Sci. Mater. Electron. 2010, 22, 1000–1009. [Google Scholar] [CrossRef]
- Schramm, R.E.; Clark, A.F.; Reed, R.P. A Compilation and Evaluation of Mechanical, Thermal and Electrical Properties of Selected Polymers; National Bureau of Standards, Lawrence Livermore Laboratory: Livermore, CA, USA, 1973; 843p. [Google Scholar]
- Матис, И.Г. Электрическoе Пoле на Службе Неразрушающегo Кoнтрoля, 2nd ed.; Science: Riga, Russia, 1978; 81p. (In Russian) [Google Scholar]
- Naidu, M.S.; Kamaraju, V. High Voltage Engineering; Tata McGraw-Hill Education: New York, NY, USA, 2004; 462p. [Google Scholar]
- Askeland, D.R.; Wright, W.J. The Science and Engineering of Materials, 7th ed.; Cengage Learning: Boston, MA, USA, 2015; 819p. [Google Scholar]
- Jiang, P.; Bian, J. Low dielectric loss BST/PTFE composites for microwave applications. Int. J. Appl. Ceram. Technol. 2018, 16, 152–159. [Google Scholar] [CrossRef]
- Матис, И.Г. Электрoемкoстные Преoбразoватели для Неразрушающегo Кoнтрoля; Science: Riga, Russia, 1982. (In Russian) [Google Scholar]
- Матис, И.Г. К вoпрoсу oпределения глубины и ширины зoны материала, кoнтрoлируемoгo накладным кoнденсатoрoм. Мет. Приб. Авт. Кoнтр. 1973, 10, 49–50. (In Russian) [Google Scholar]
- Джежoра, А.А. Спoсoб oпределения глубины зoны кoнтрoля плoских накладных измерительных кoнденсатoрoв. A. Belorussian patent N11238, 30 October 2008. (In Russian). [Google Scholar]
- Chen, T. Capacitive sensors for measuring complex permittivity of planar and cylindrical structures. Ph.D. Thesis, Iowa State University, Ames, IA, USA, 2012. Available online: https://lib.dr.iastate.edu/etd/12294 (accessed on 31 January 2021).
- Kalpinsh, A.; Shtrauss, V.; Lomanovskis, U. Digital Emulation of Dielectric Relaxation Functions for Capacitive Sensors of Non-Destructive Dielectric Spectrometry. Comp. Meth. Exp. Meas. 2019, XIX PI, 111–119. [Google Scholar] [CrossRef]
- Domeier, L.; Hunter, M. Epoxy Foam Encapsulants: Processing and Dielectric Characterization. 1999. Available online: https://www.osti.gov (accessed on 5 April 2021).
- Beverte, I. Determination of Highly Porous Plastic Foams’ Structural Characteristics by Processing LM Images Data. J. Appl. Polym. Sci. 2014, 131, art. N39477. [Google Scholar] [CrossRef]
- Beverte, I. Elastic constants of monotropic plastic foams. 1. Deformation parallel to foam rise direction. A mathematical model. Mech. Comp. Mat. 1997, 33, 505–516. [Google Scholar]
- Lagzdiņš, A.; Zilaucs, A.; Beverte, I.; Andersons, J. Estimation of the elastic constants of highly porous cellular plastics reinforced with fibres embedded in foam struts. J. Comp. Mat. 2016, 50, 1169–1180. [Google Scholar] [CrossRef]
- Beverte, I.; Kregers, A. Stiffness of Light Open-Cell Plastic Foams. Mech. Comp. Mat. 1987, 25, 30–37. [Google Scholar]
- Evaluation of Measurement Data—Guide to the Expression of Uncertainty in Measurement JCGM 100:2008 GUM 1995 with Minor Corrections, 120p. Available online: https://www.bipm.org/utils/common/documents/jcgm/JCGM_100_2008_E.pdf (accessed on 5 April 2021).
- International Vocabulary of Metrology—Basic and General Concepts and Associated Terms (VIM), 3rd Edition 2008 Version with Minor Corrections. JCGM 200:2012, 91p. Available online: https://www.bipm.org/utils/common/documents/jcgm/JCGM_200_2012.pdf (accessed on 5 April 2021).
Publisher’s Note: MDPI stays neutral with regard to jurisdictional claims in published maps and institutional affiliations. |
© 2021 by the authors. Licensee MDPI, Basel, Switzerland. This article is an open access article distributed under the terms and conditions of the Creative Commons Attribution (CC BY) license (https://creativecommons.org/licenses/by/4.0/).