
An Integrated Approach to Design and Develop High-Performance Polymer-Composite Thermal Interface Material


Abstract
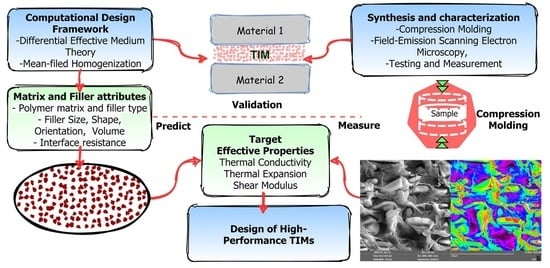
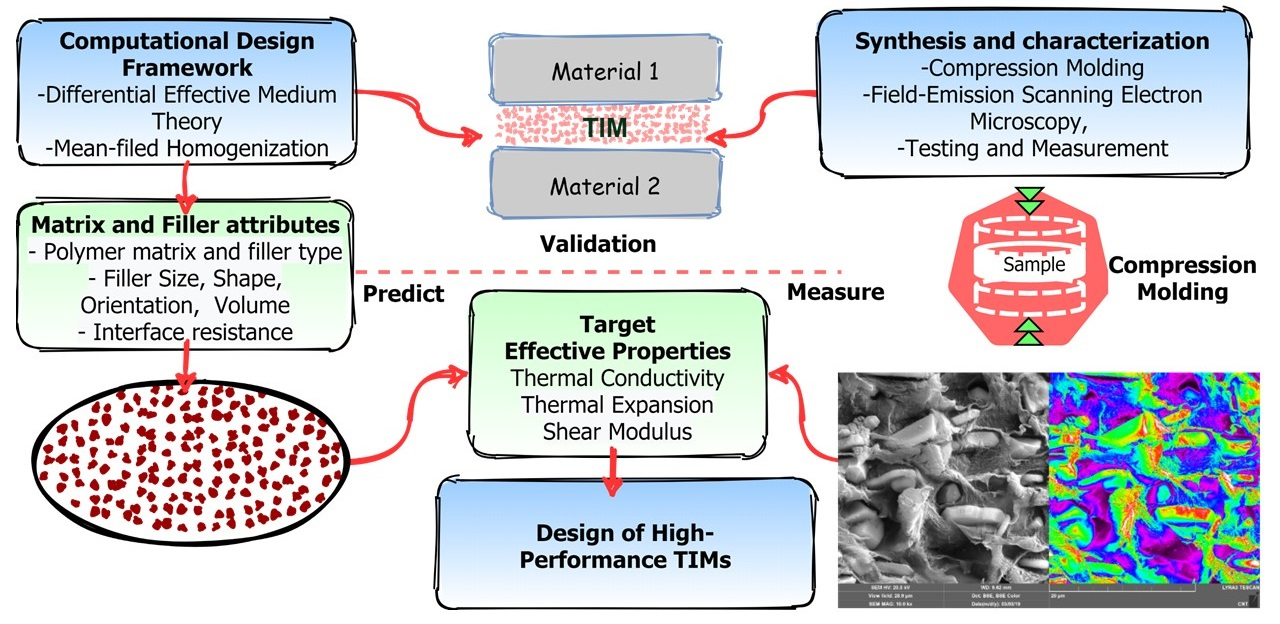
1. Introduction
2. Computational Models
2.1. Differential Effective Medium Approximation for Effective Thermal Conductivity
2.2. Mean-Field Homogenization Scheme for Elastic Modulus and Coefficient of Thermal Expansion
2.3. Selection of Potential Fillers and Polymers
3. Materials and Experimental Methods
3.1. Materials
3.2. Development of Composites
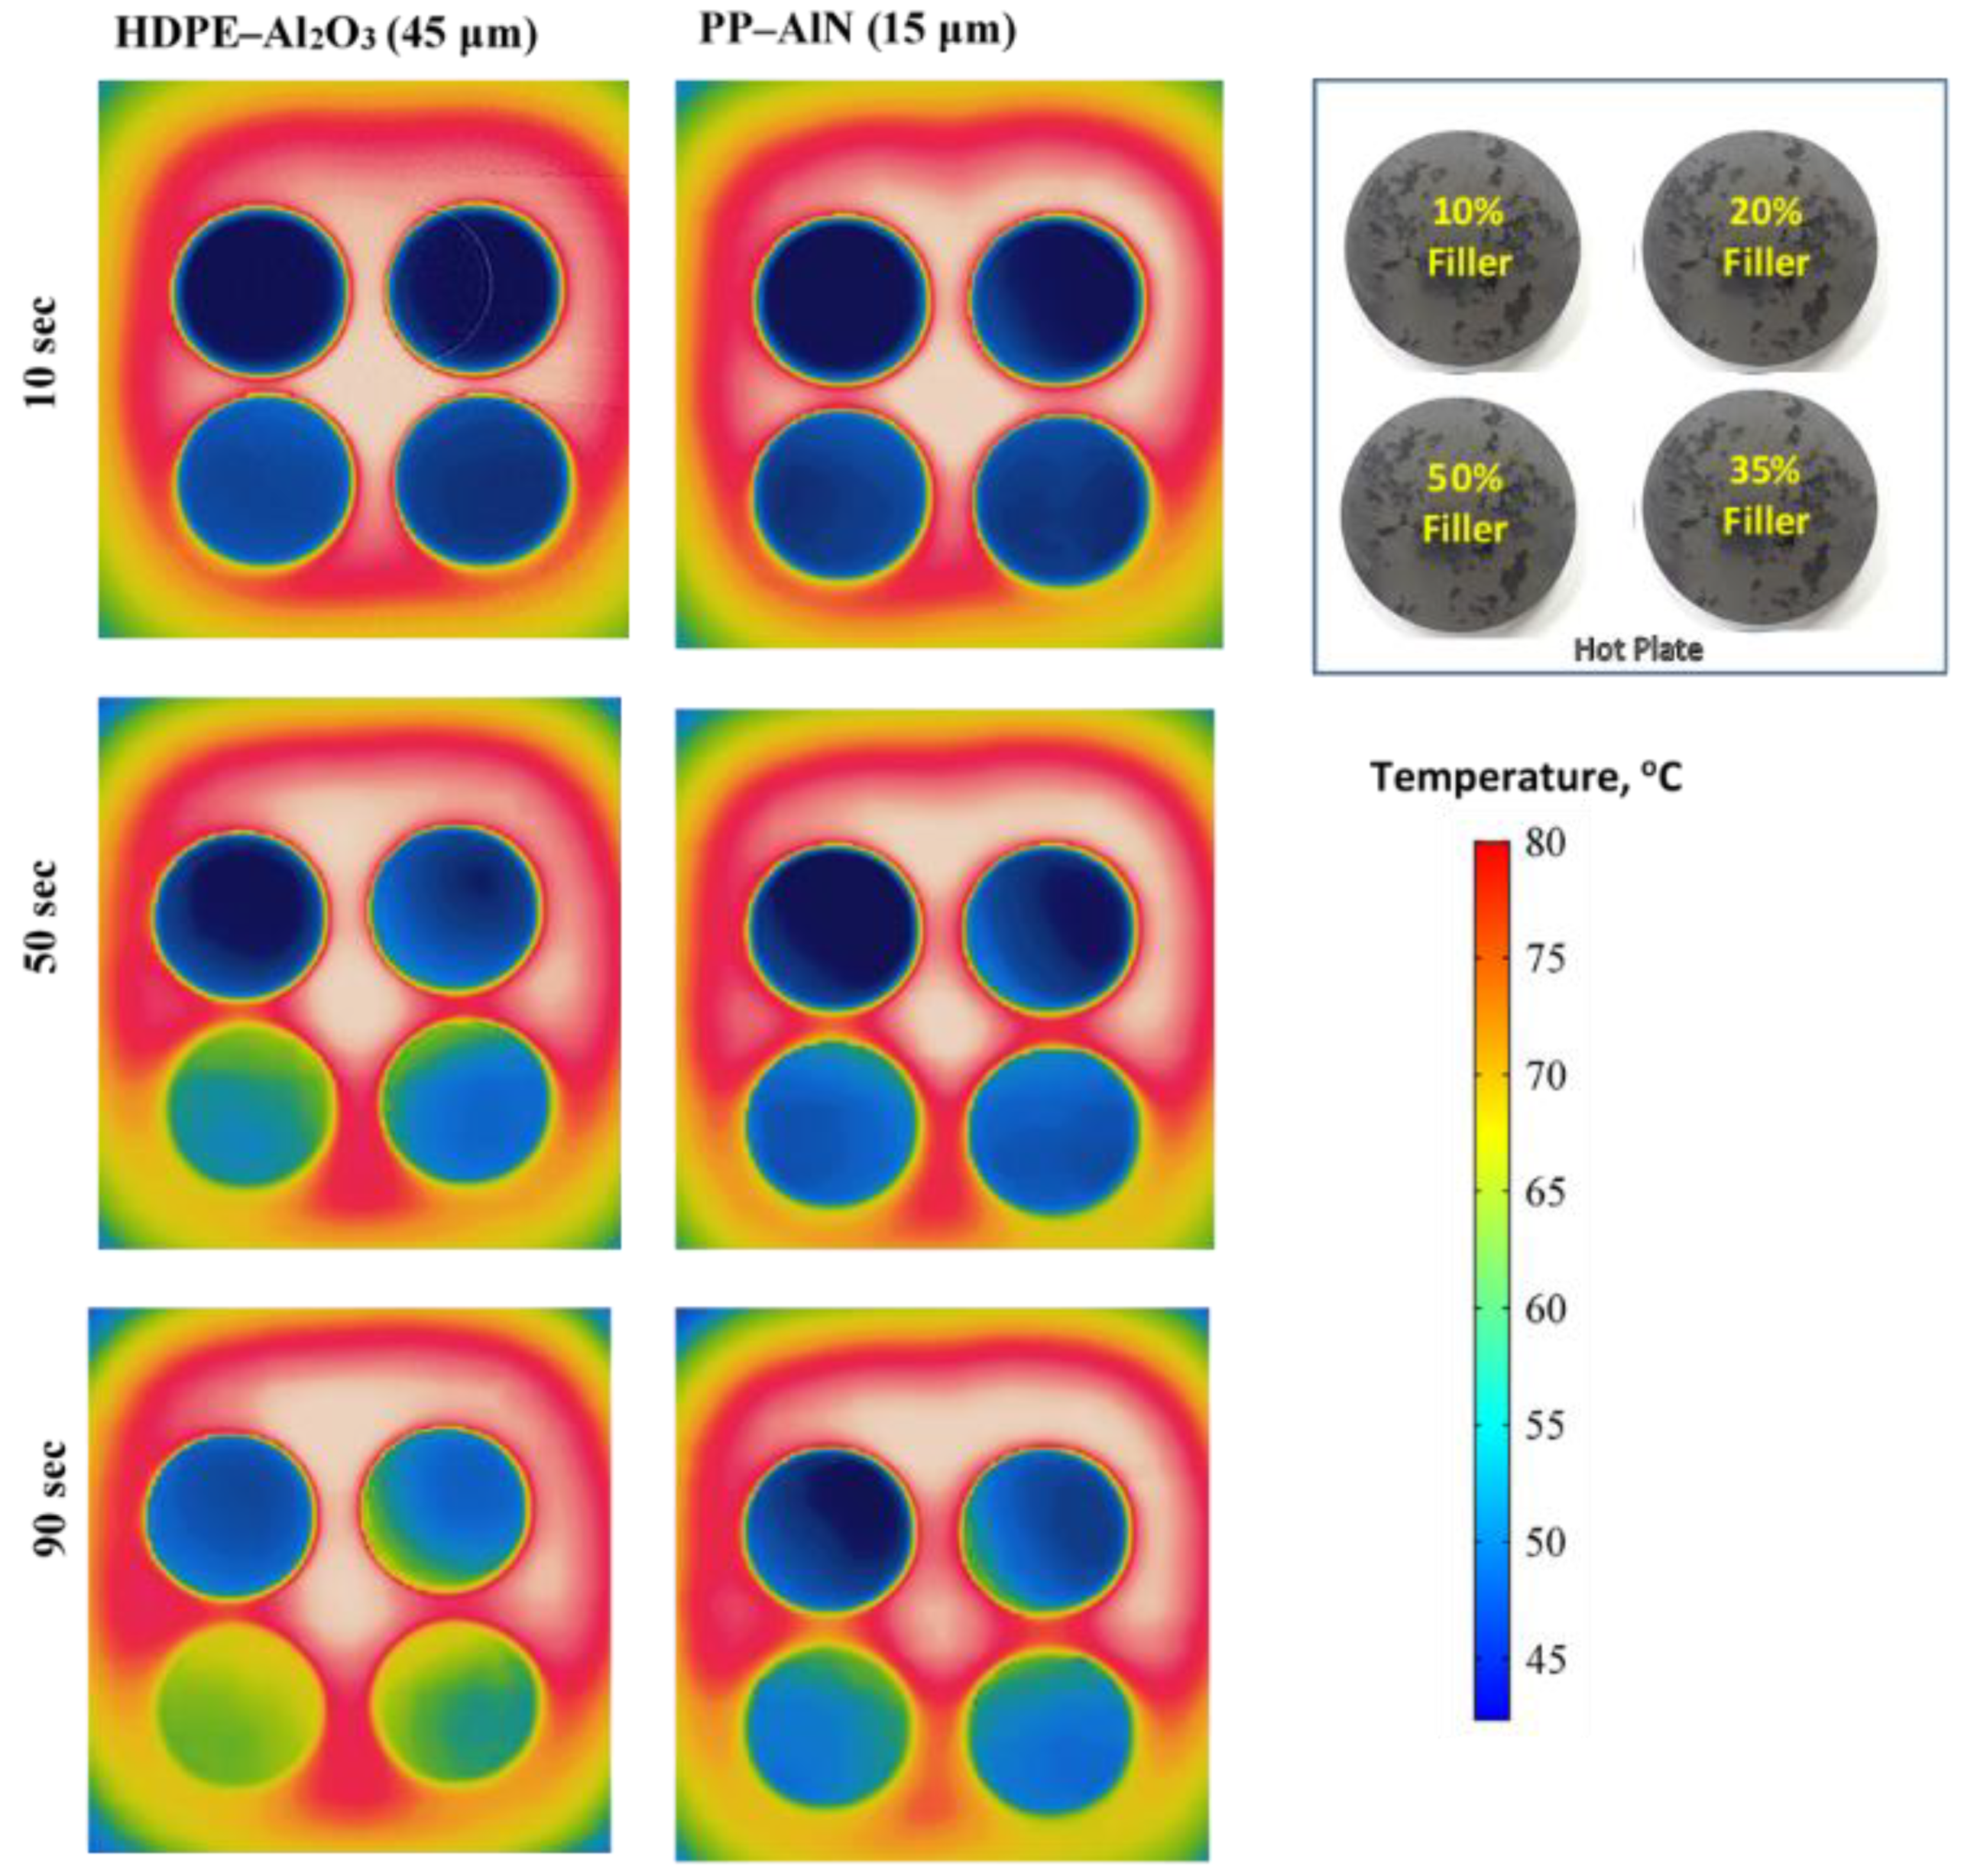
3.3. Testing
4. Results and Discussion
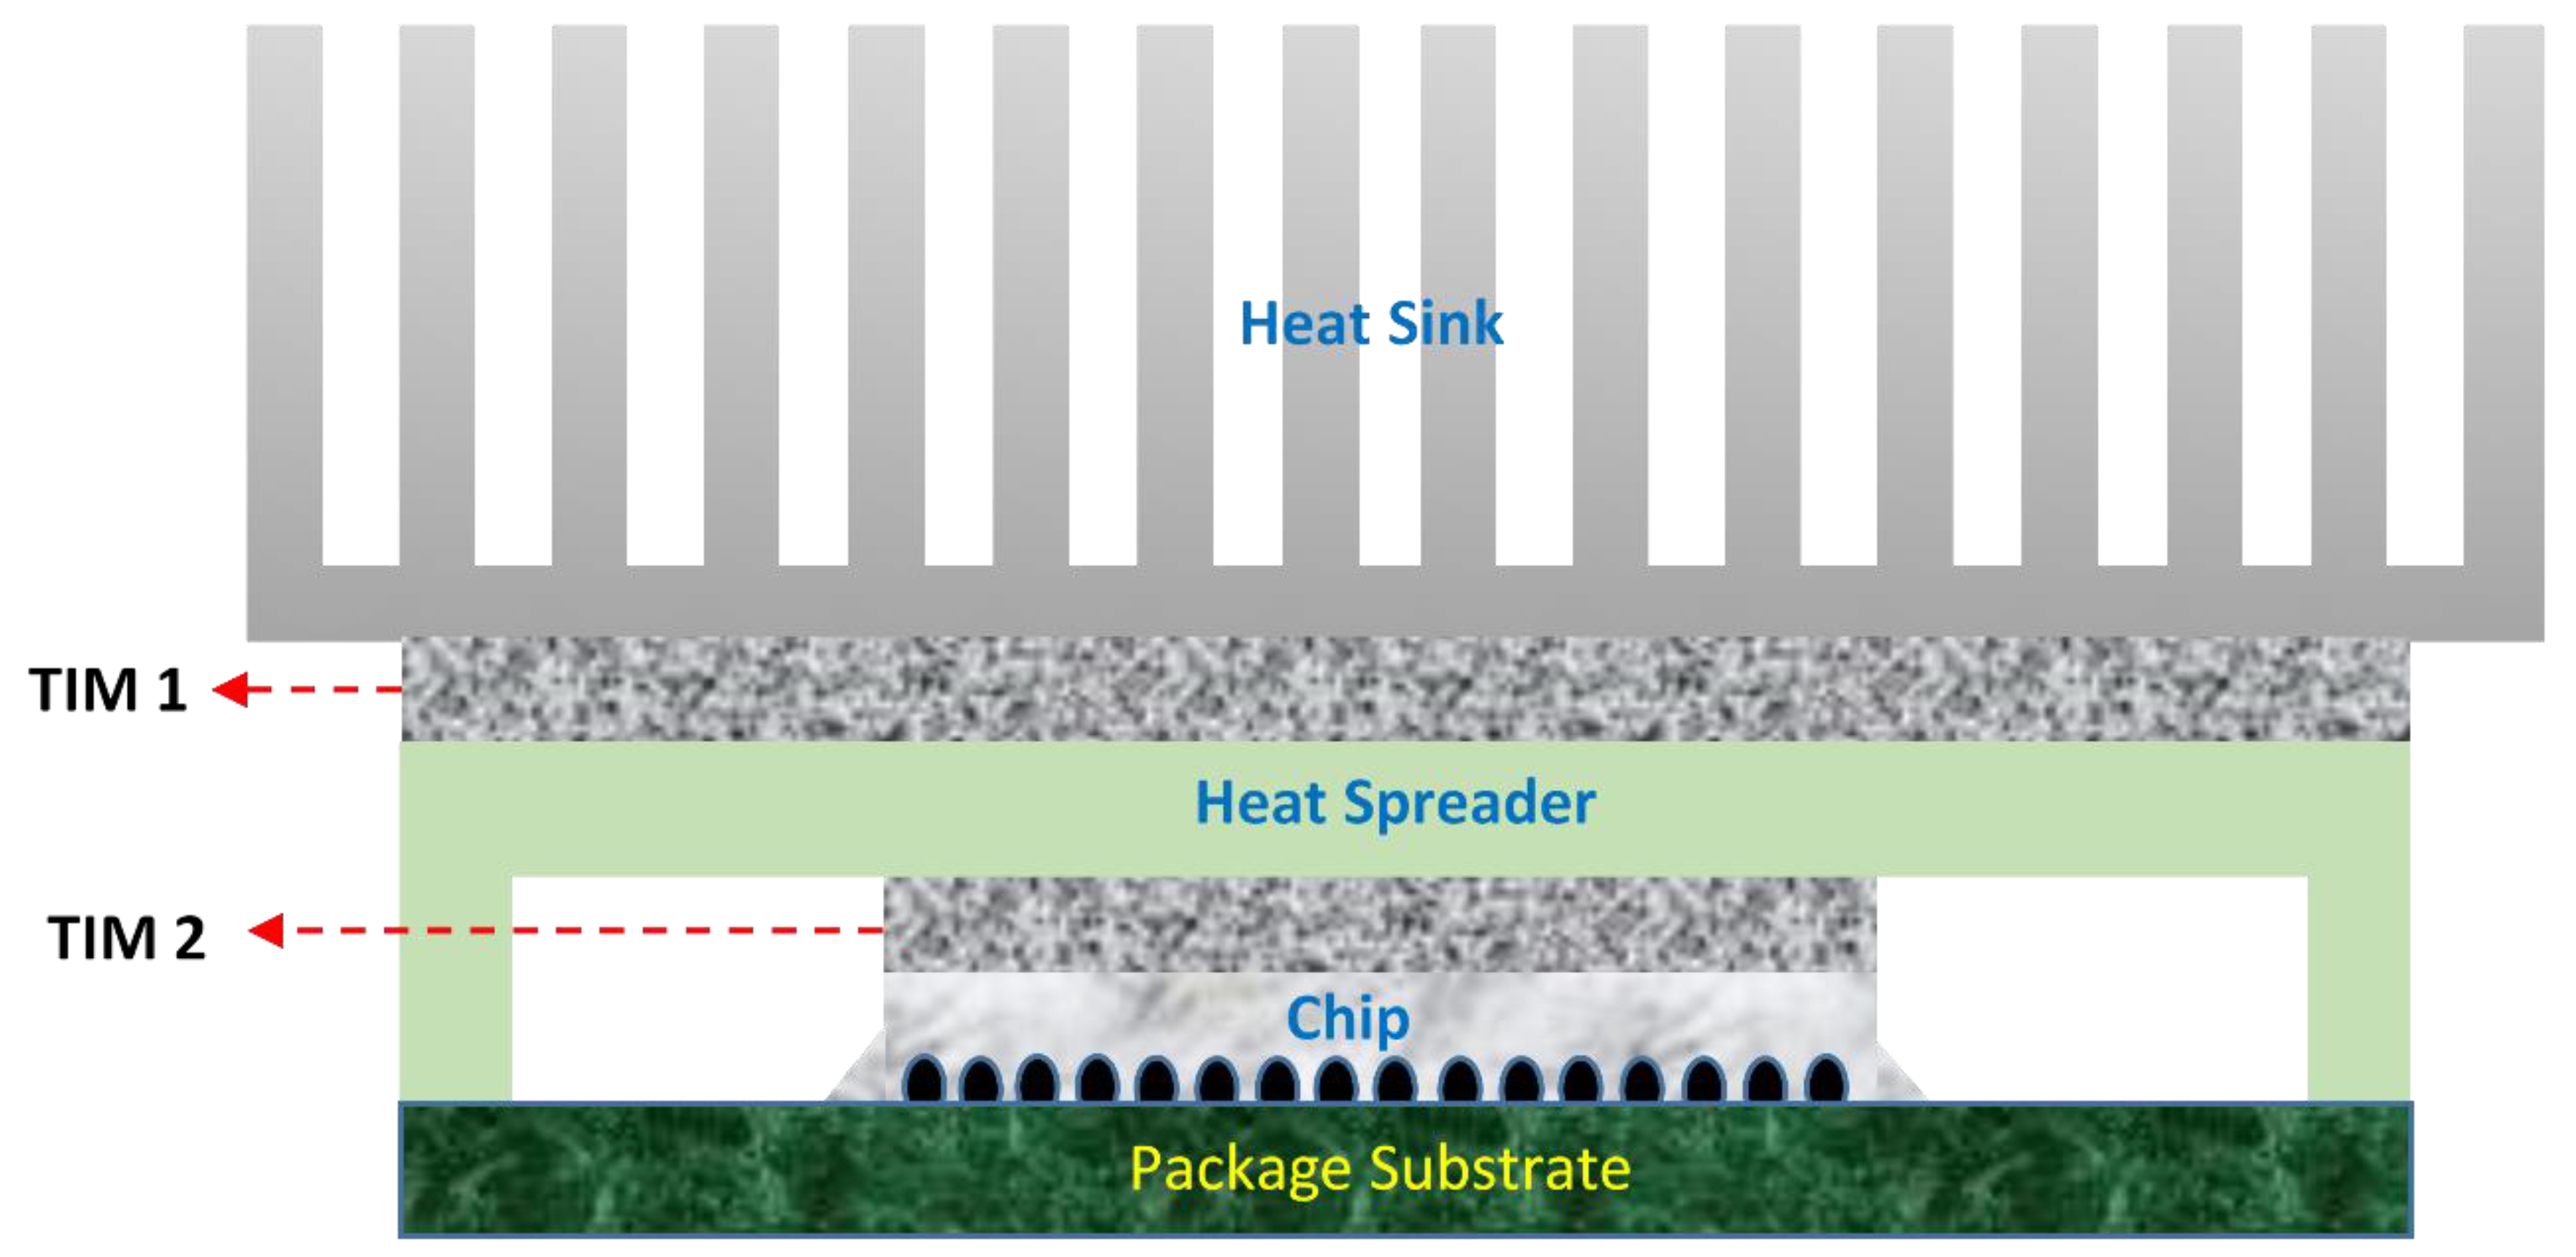
4.1. Prediction of Minimum Filler Size
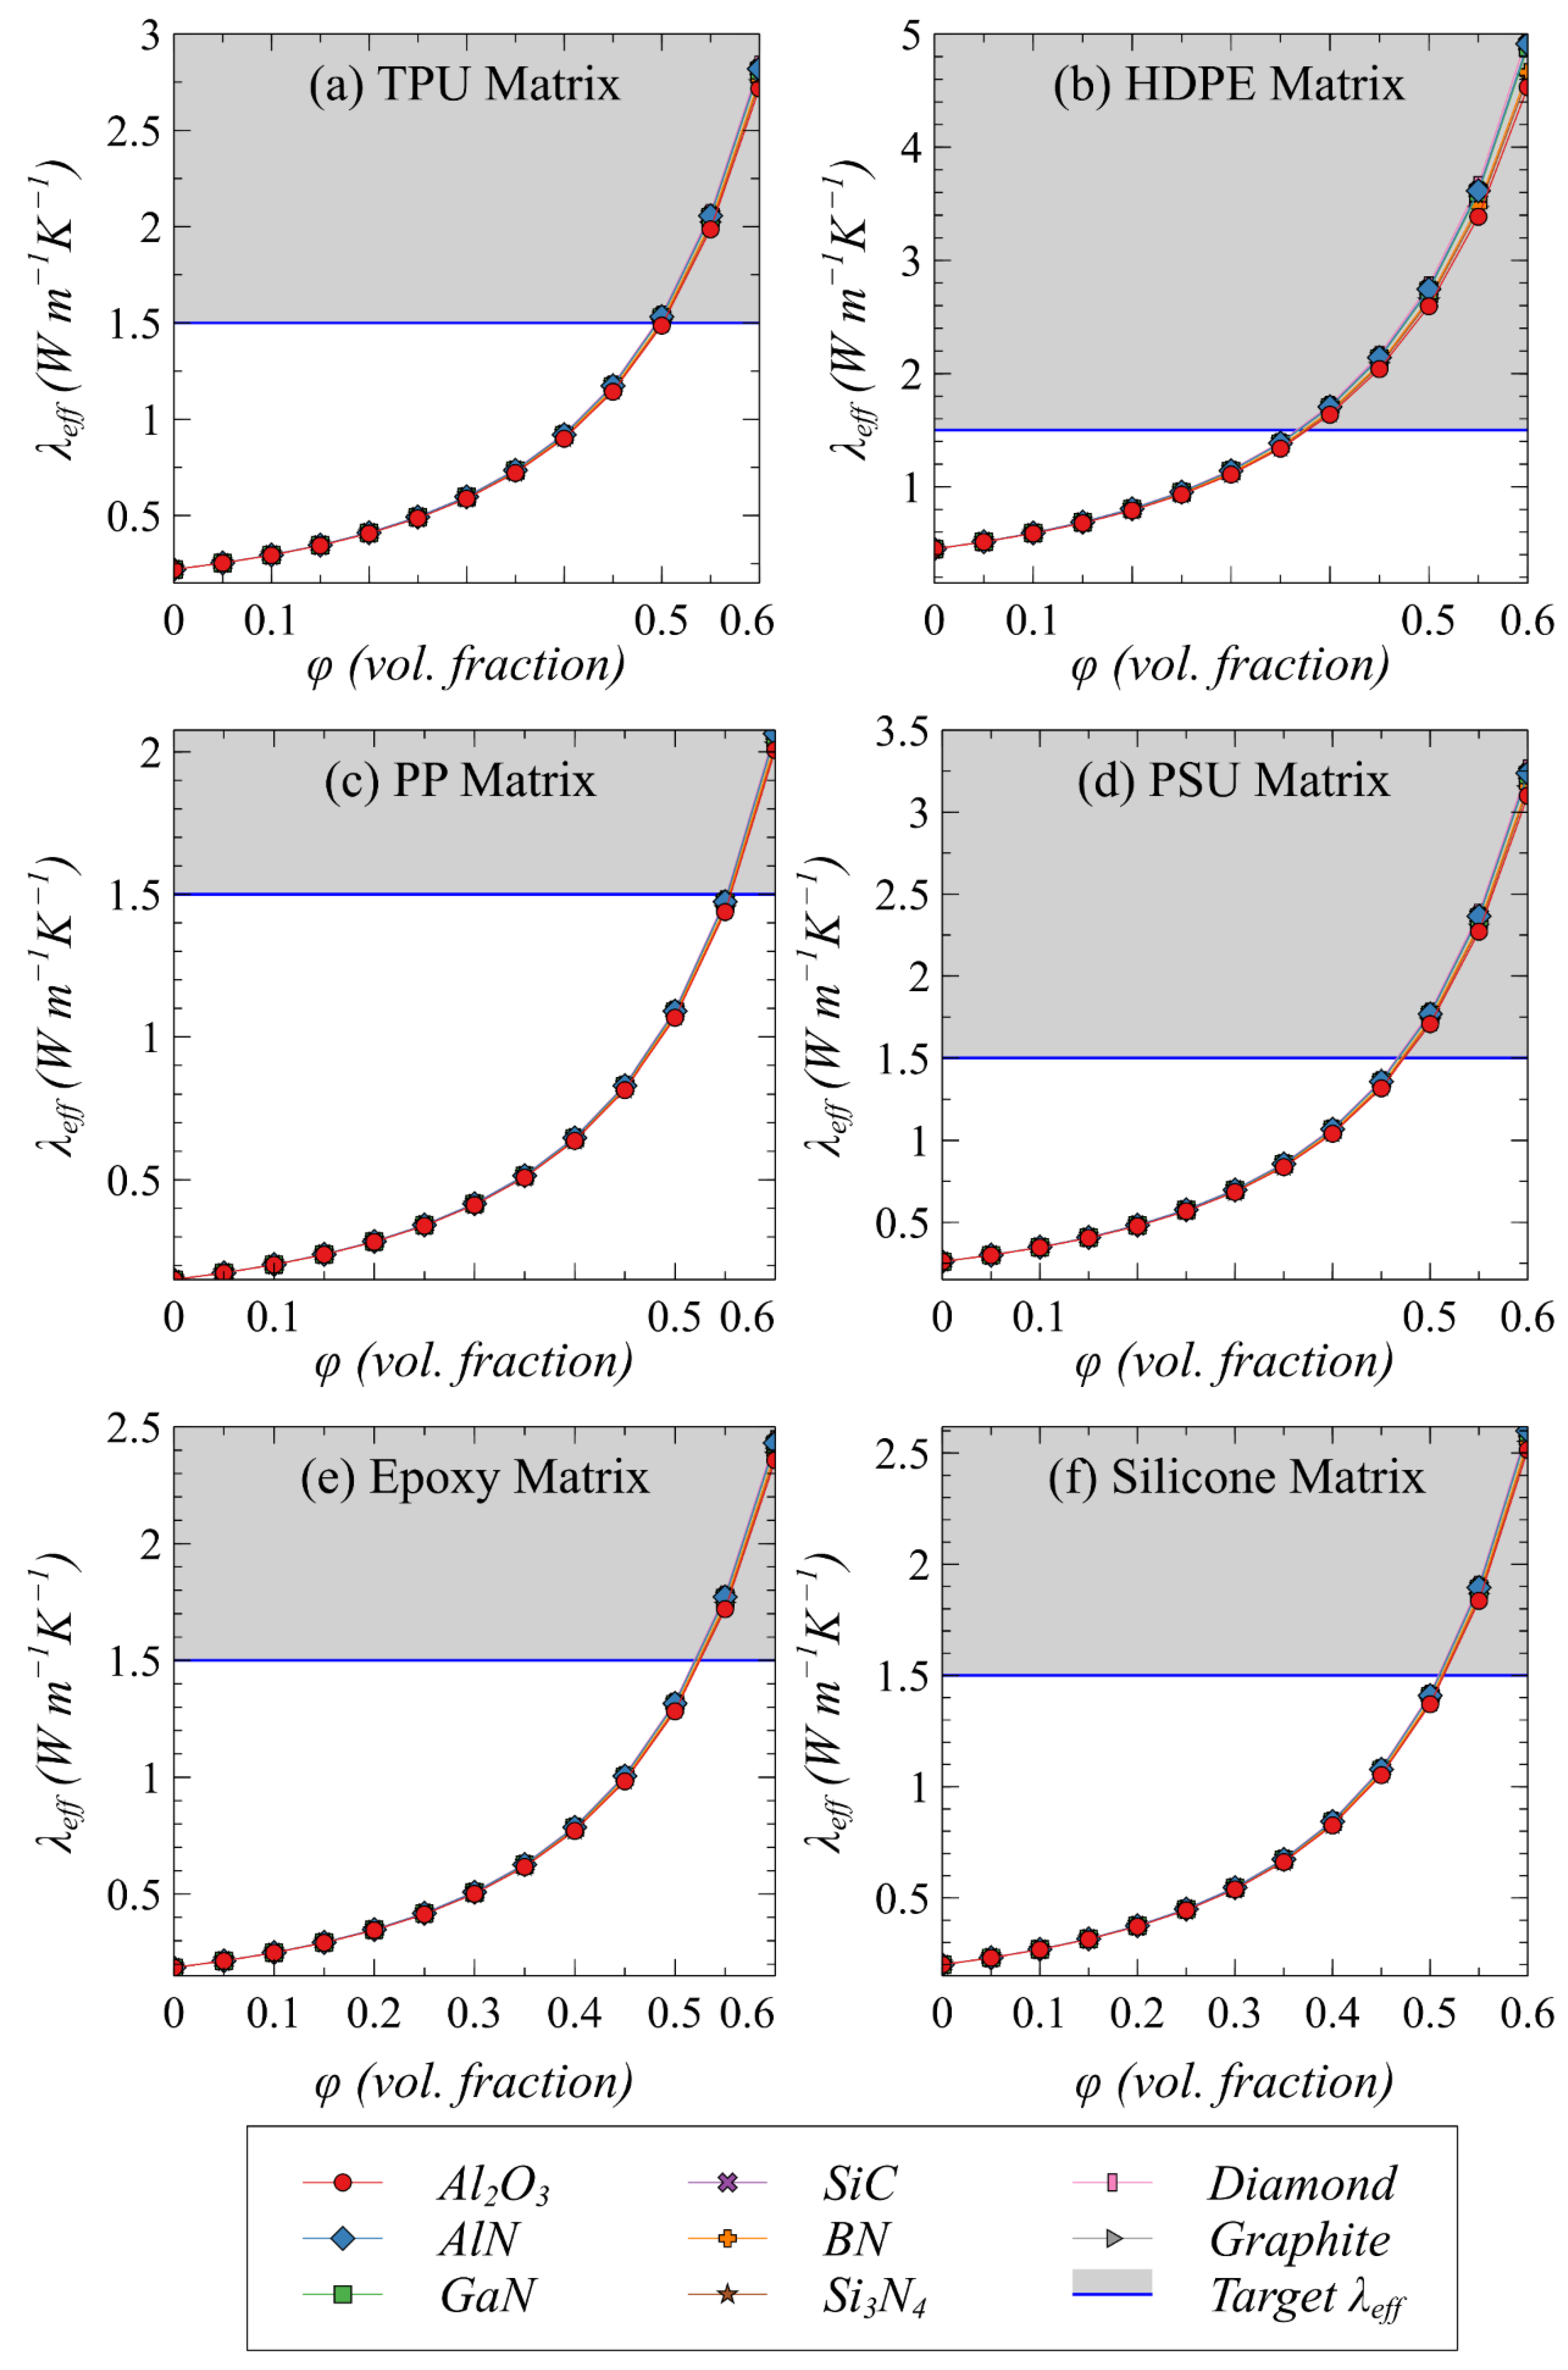
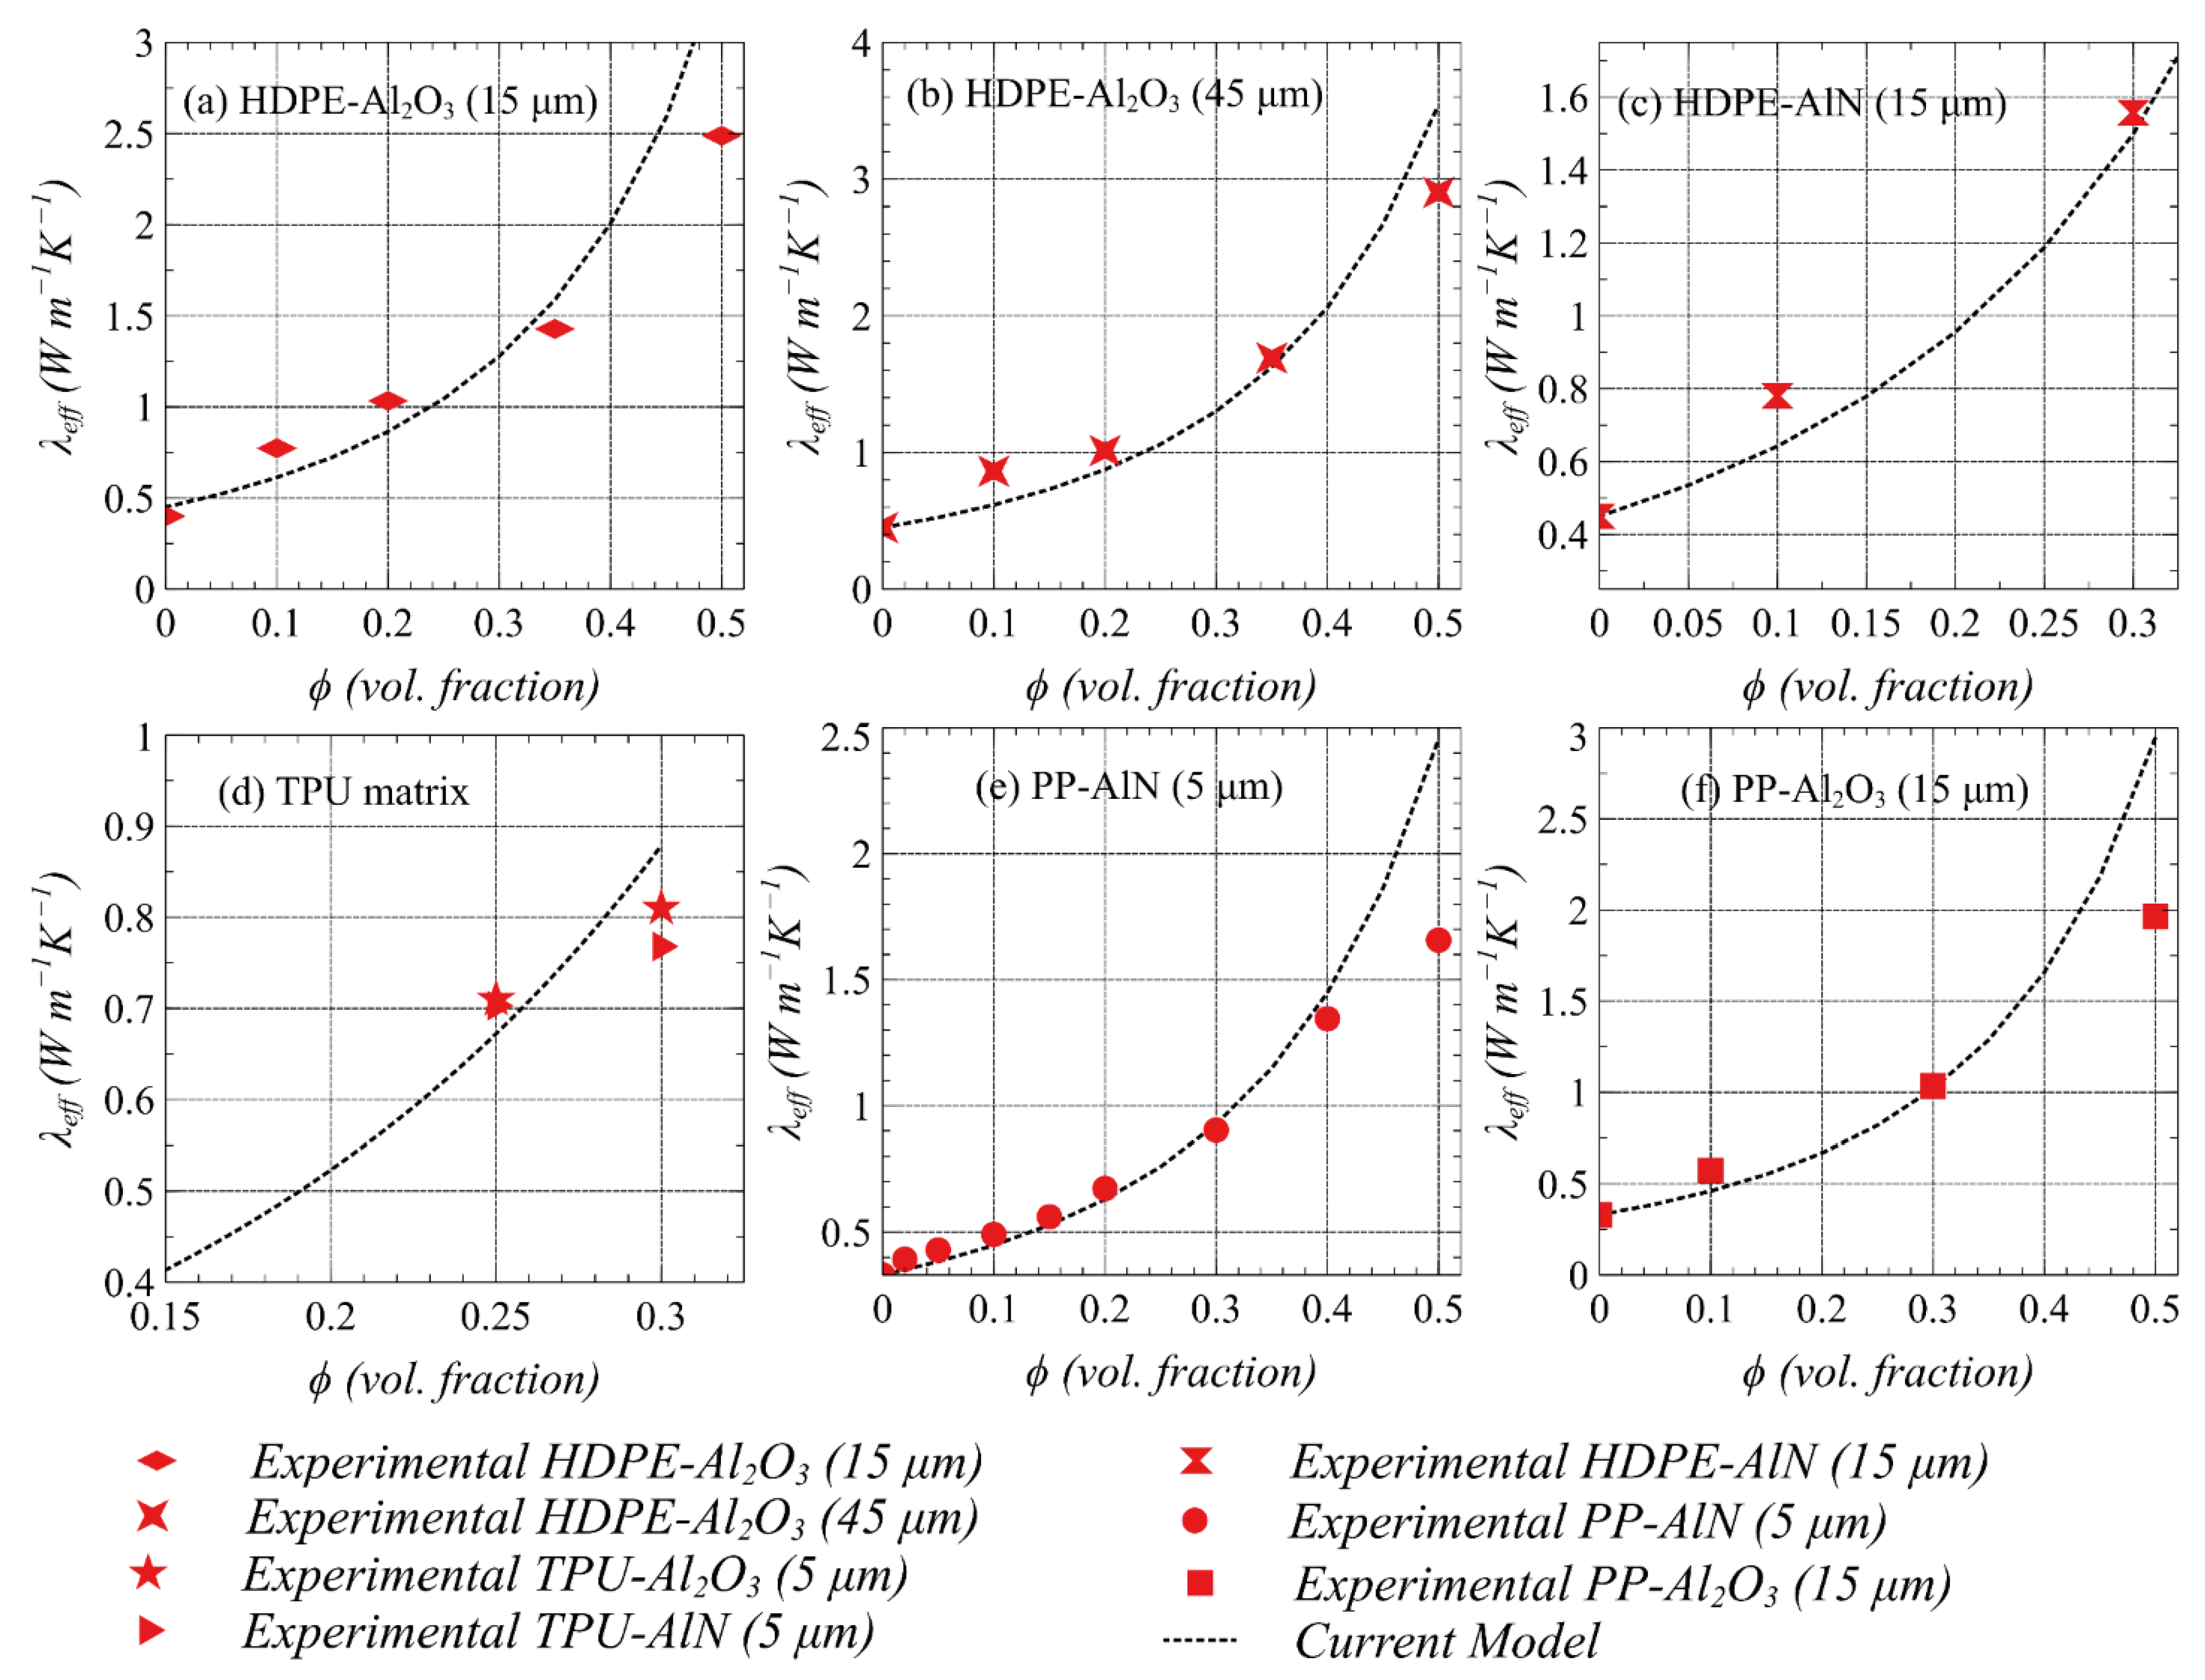
4.2. Effect of Polymer–Filler Combinations on Effective Thermal Conductivity
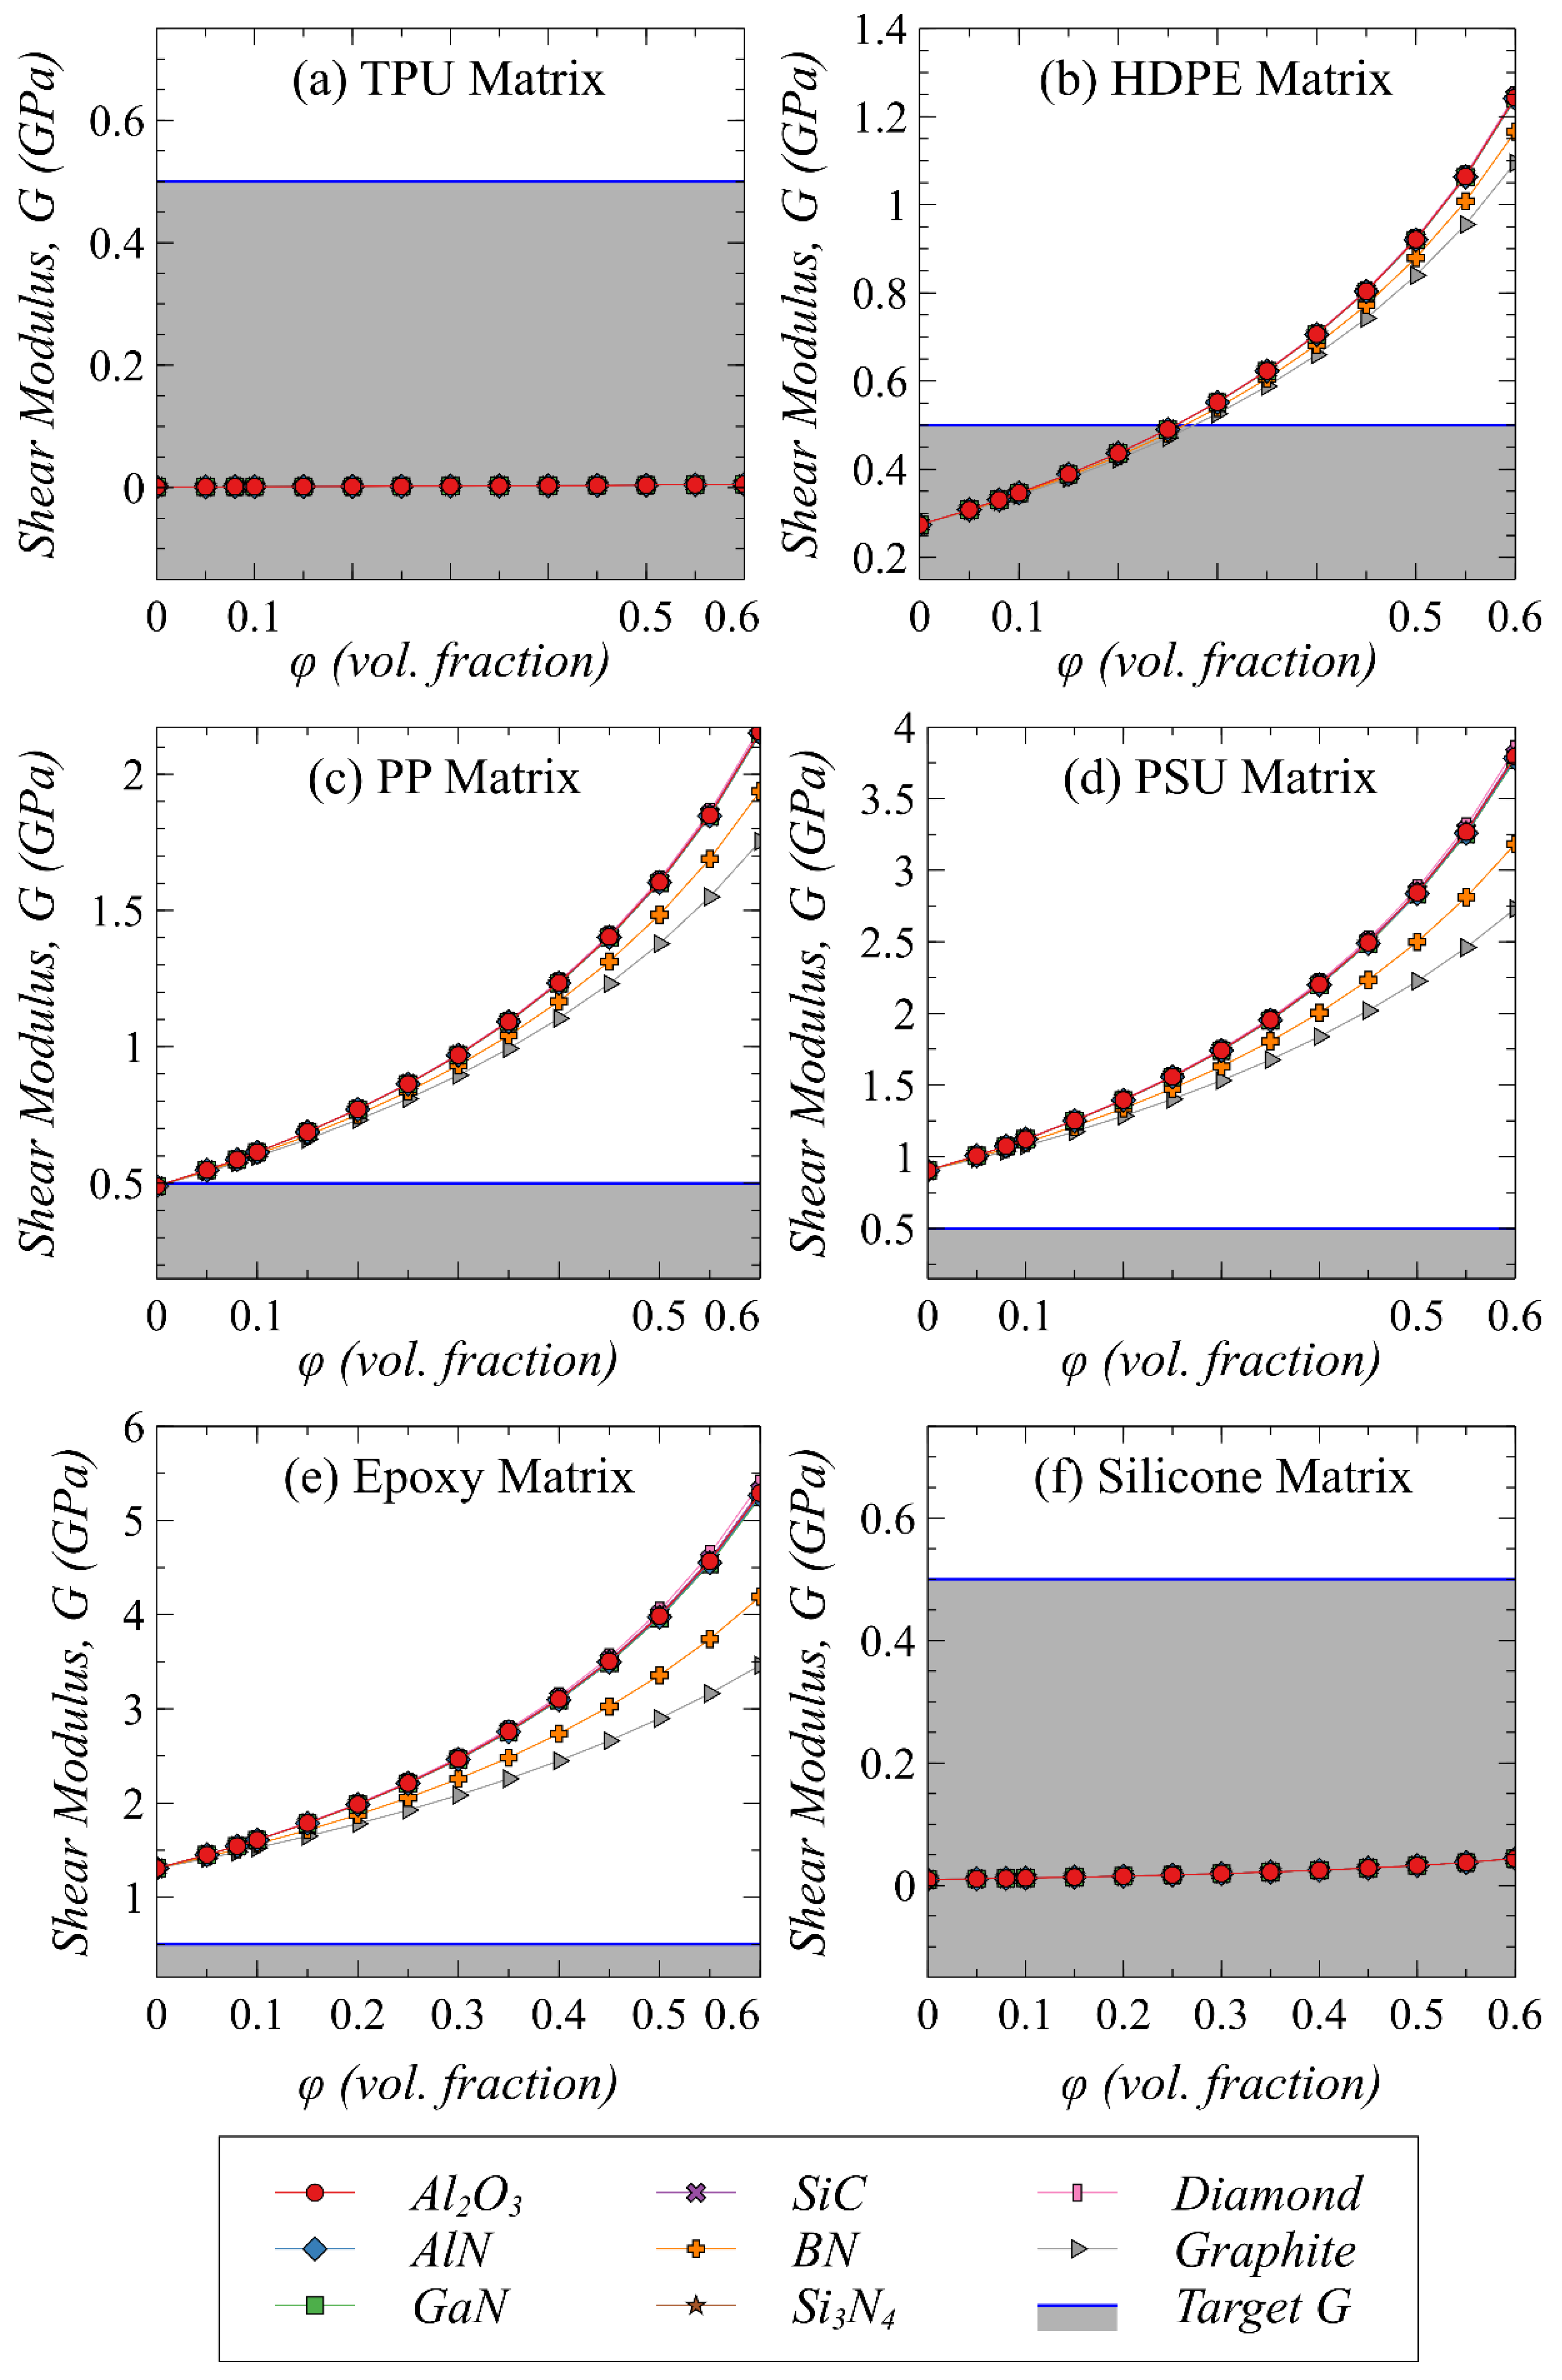
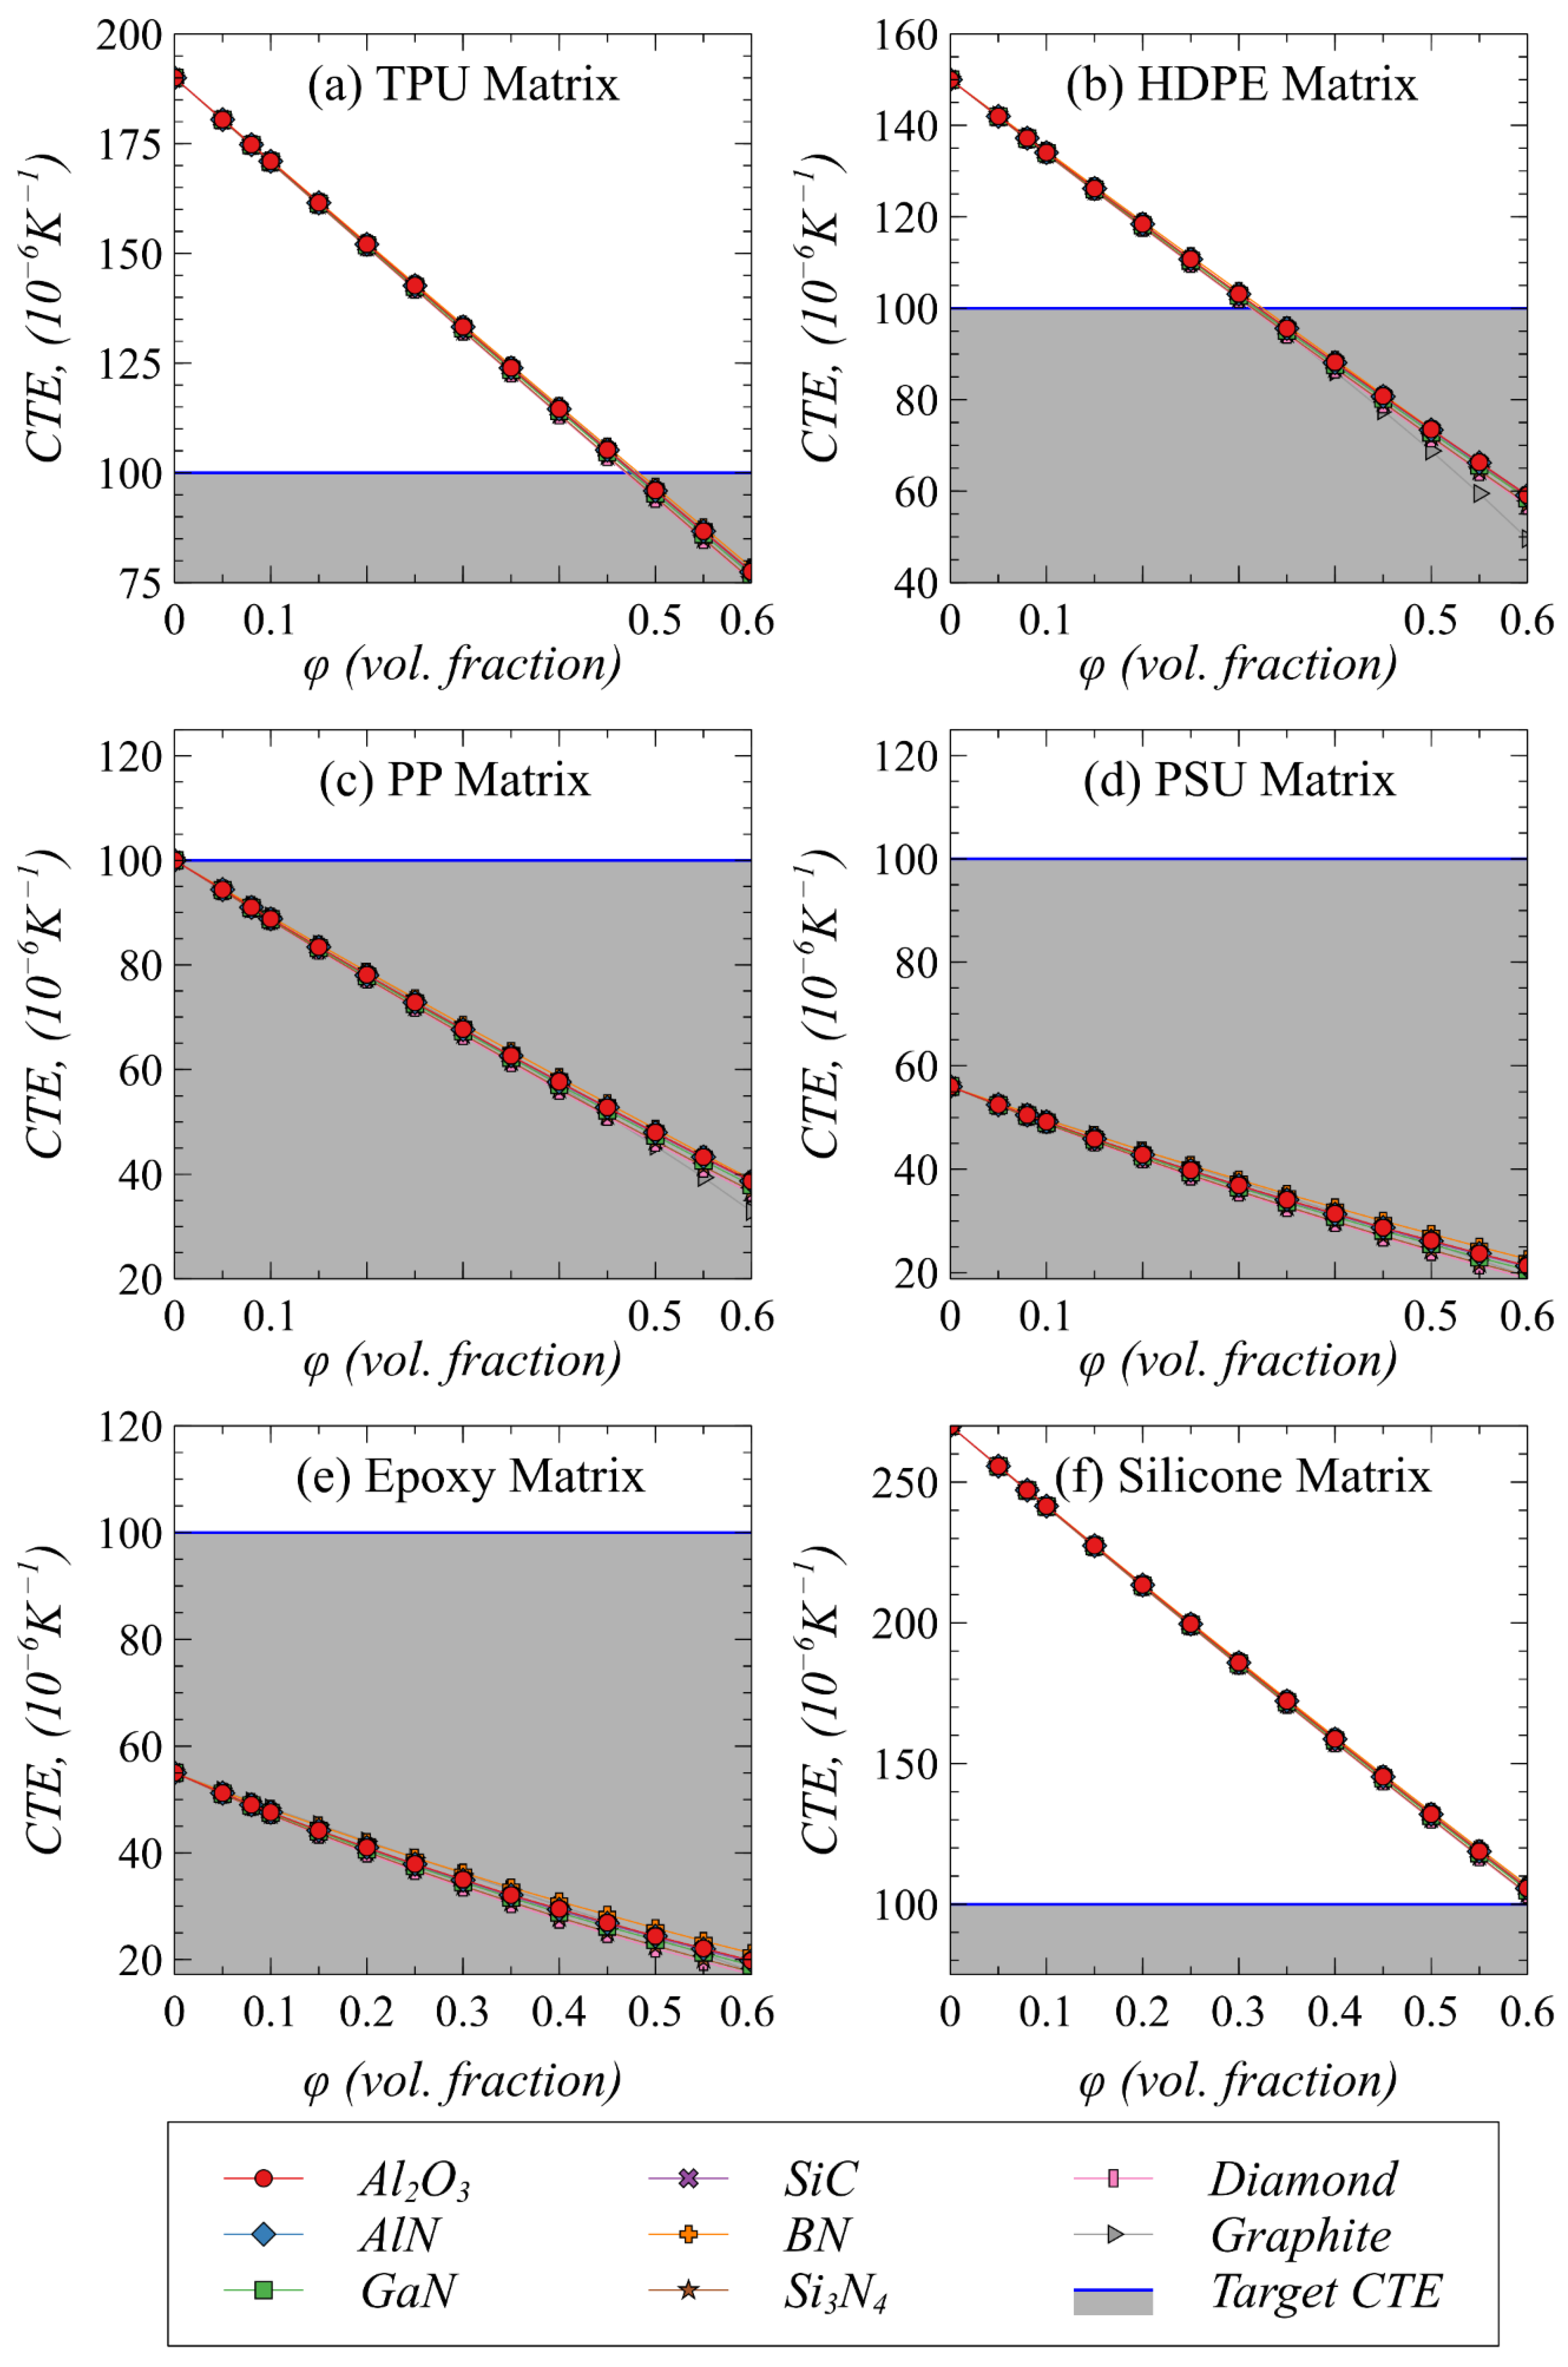
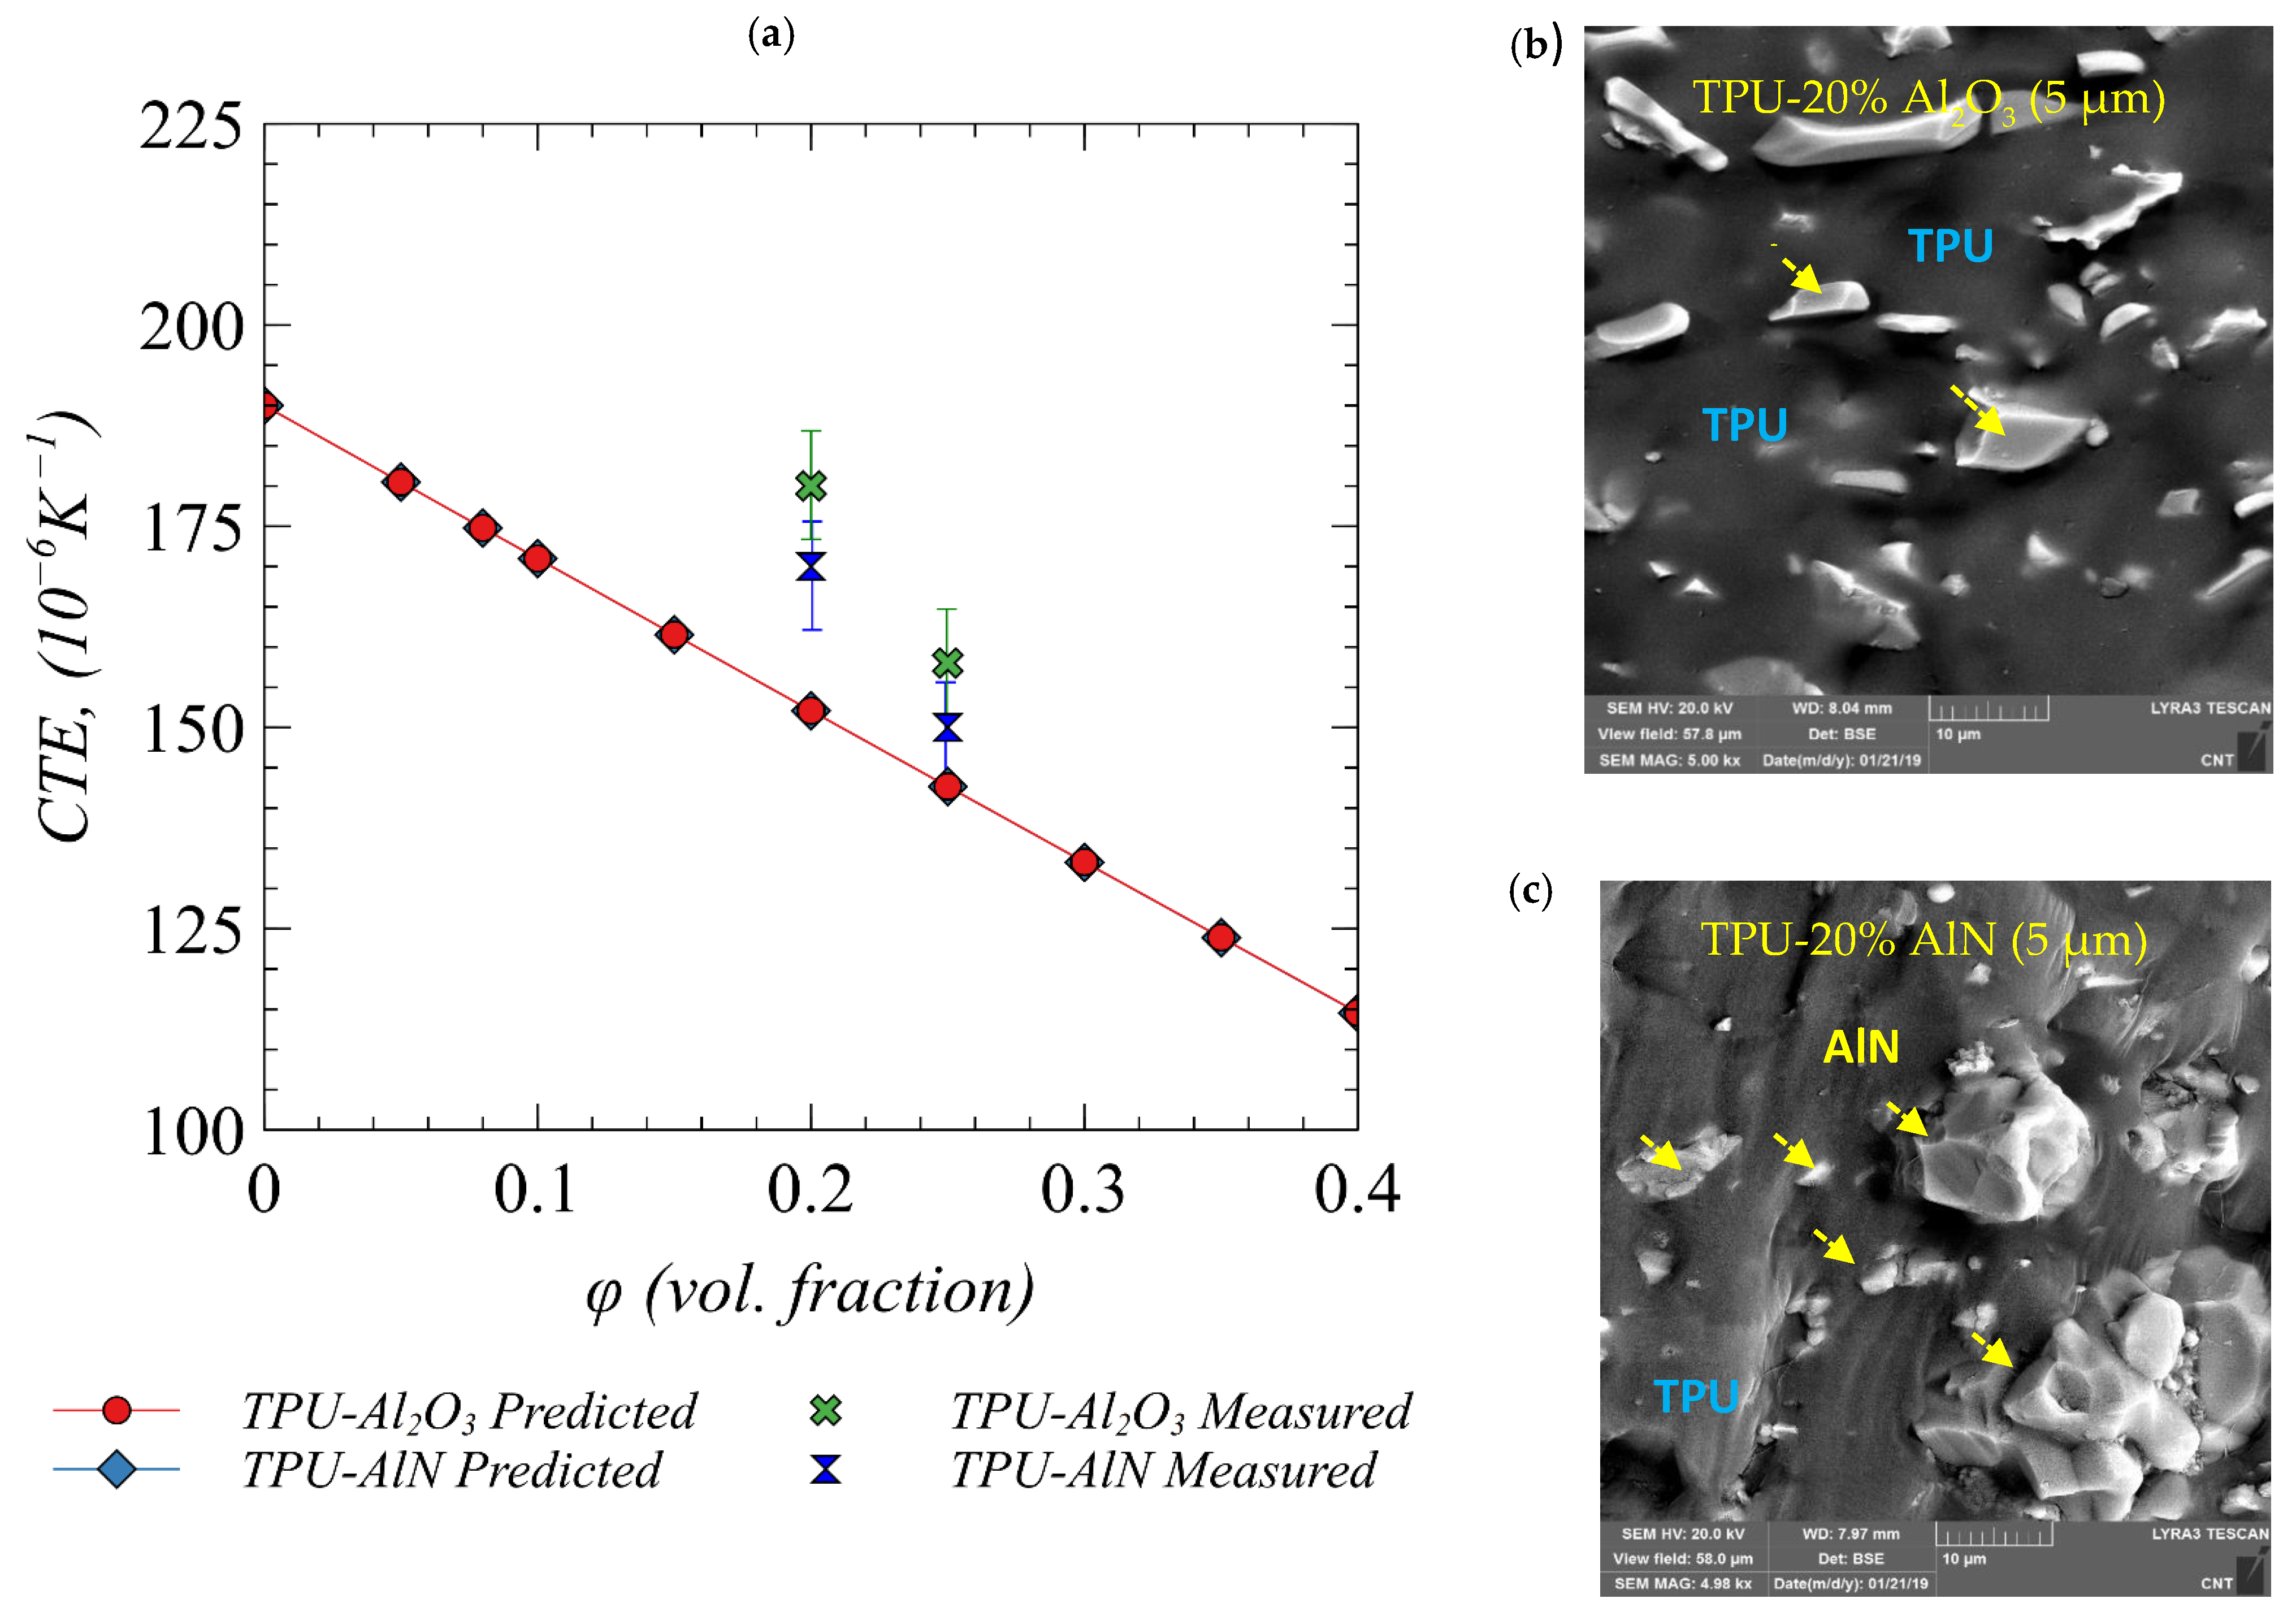
4.3. Effect of Polymer–Filler Combinations on Effective Shear Modulus and Coefficient of Thermal Expansion
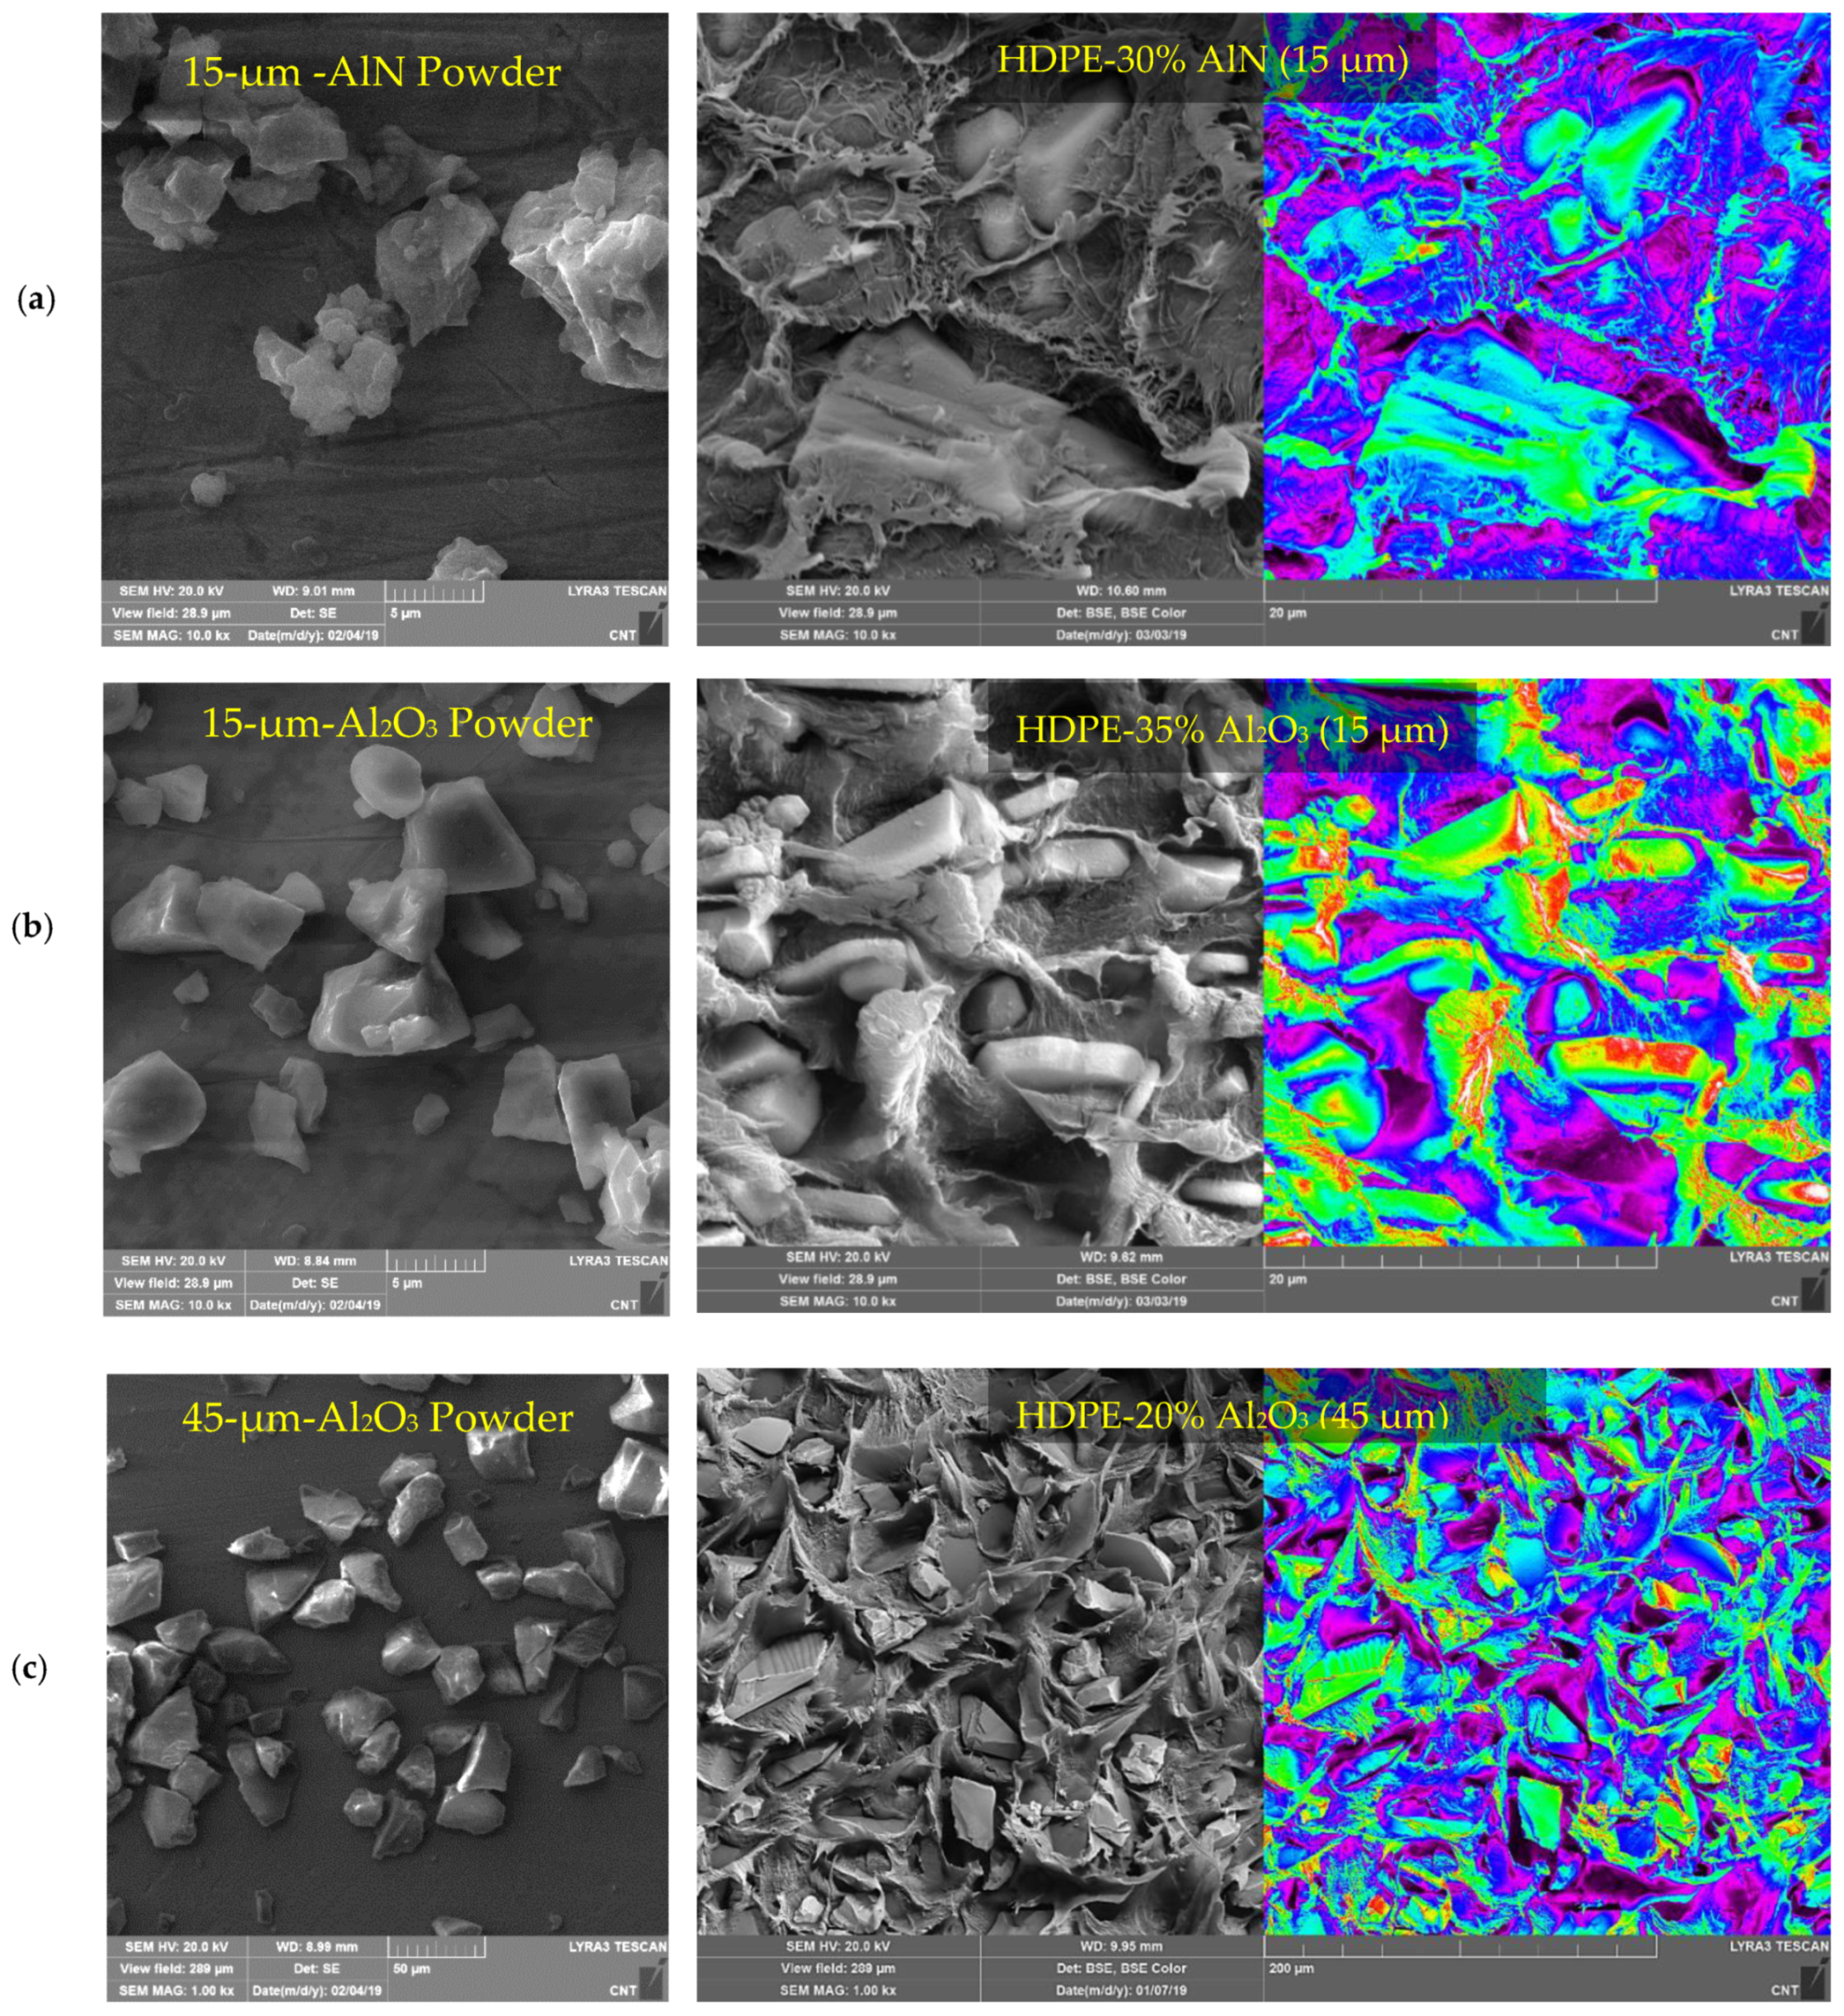
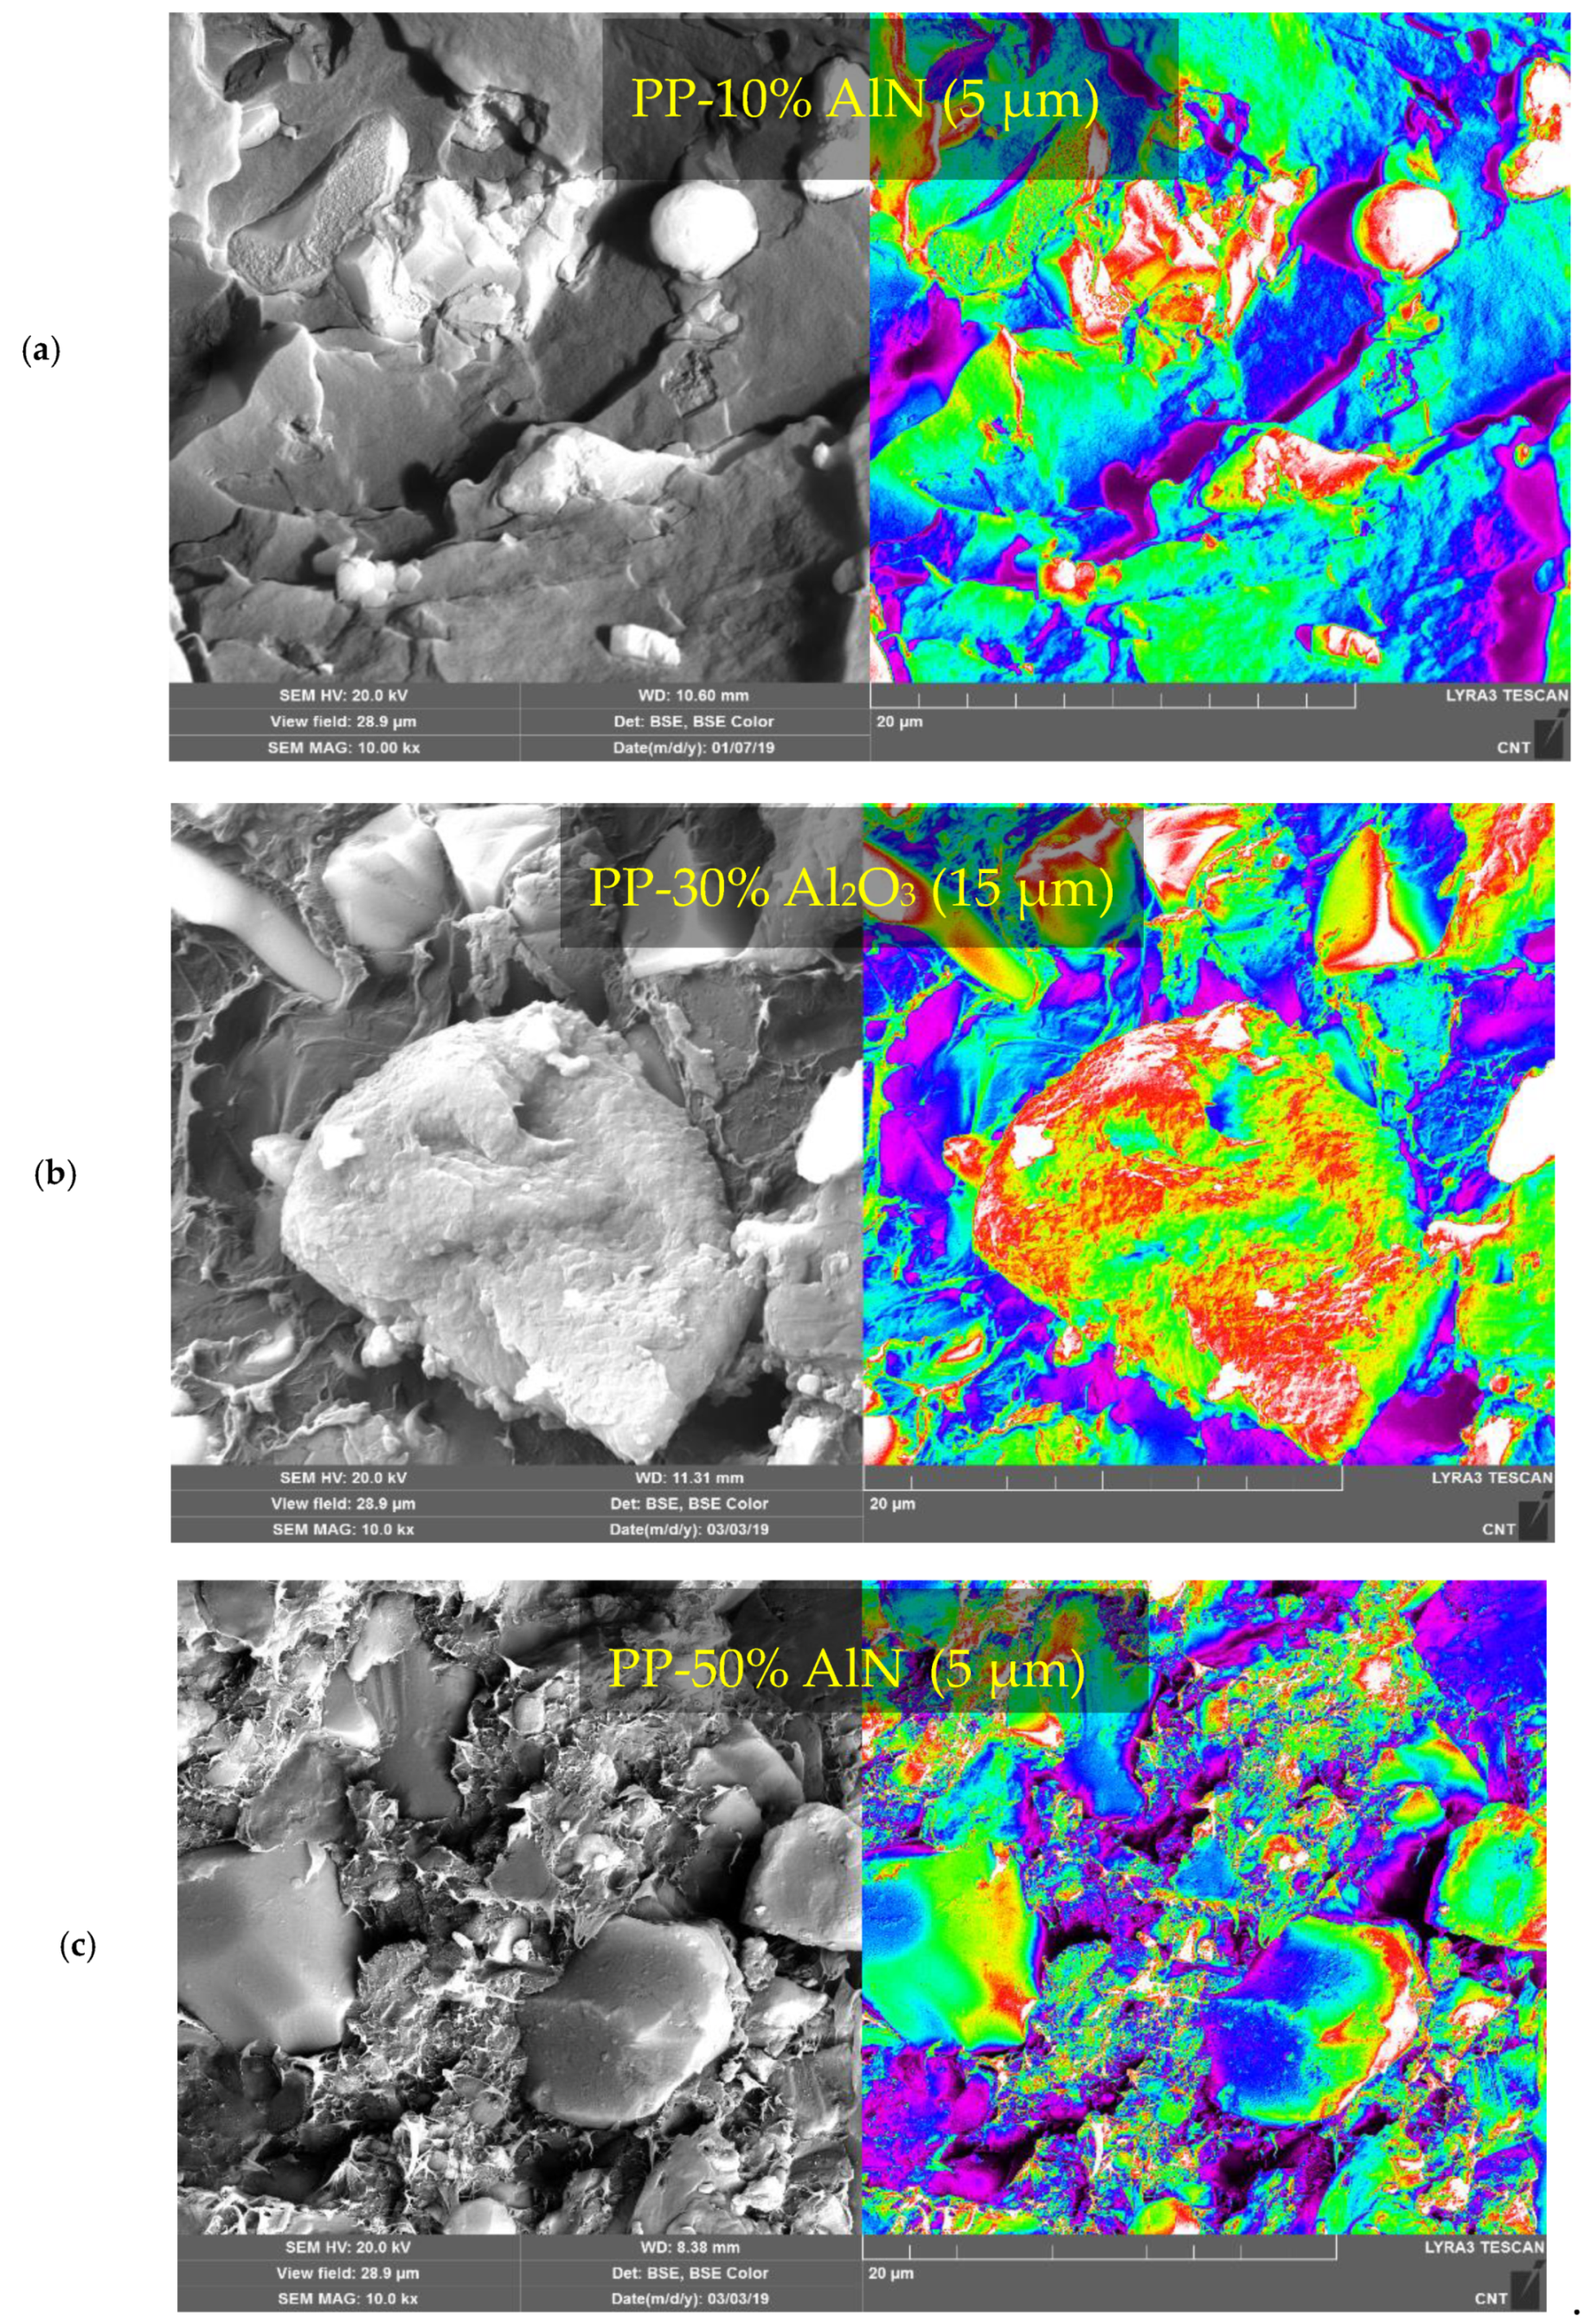
4.4. Microscopic Analysis of Fillers and Synthesized Composites
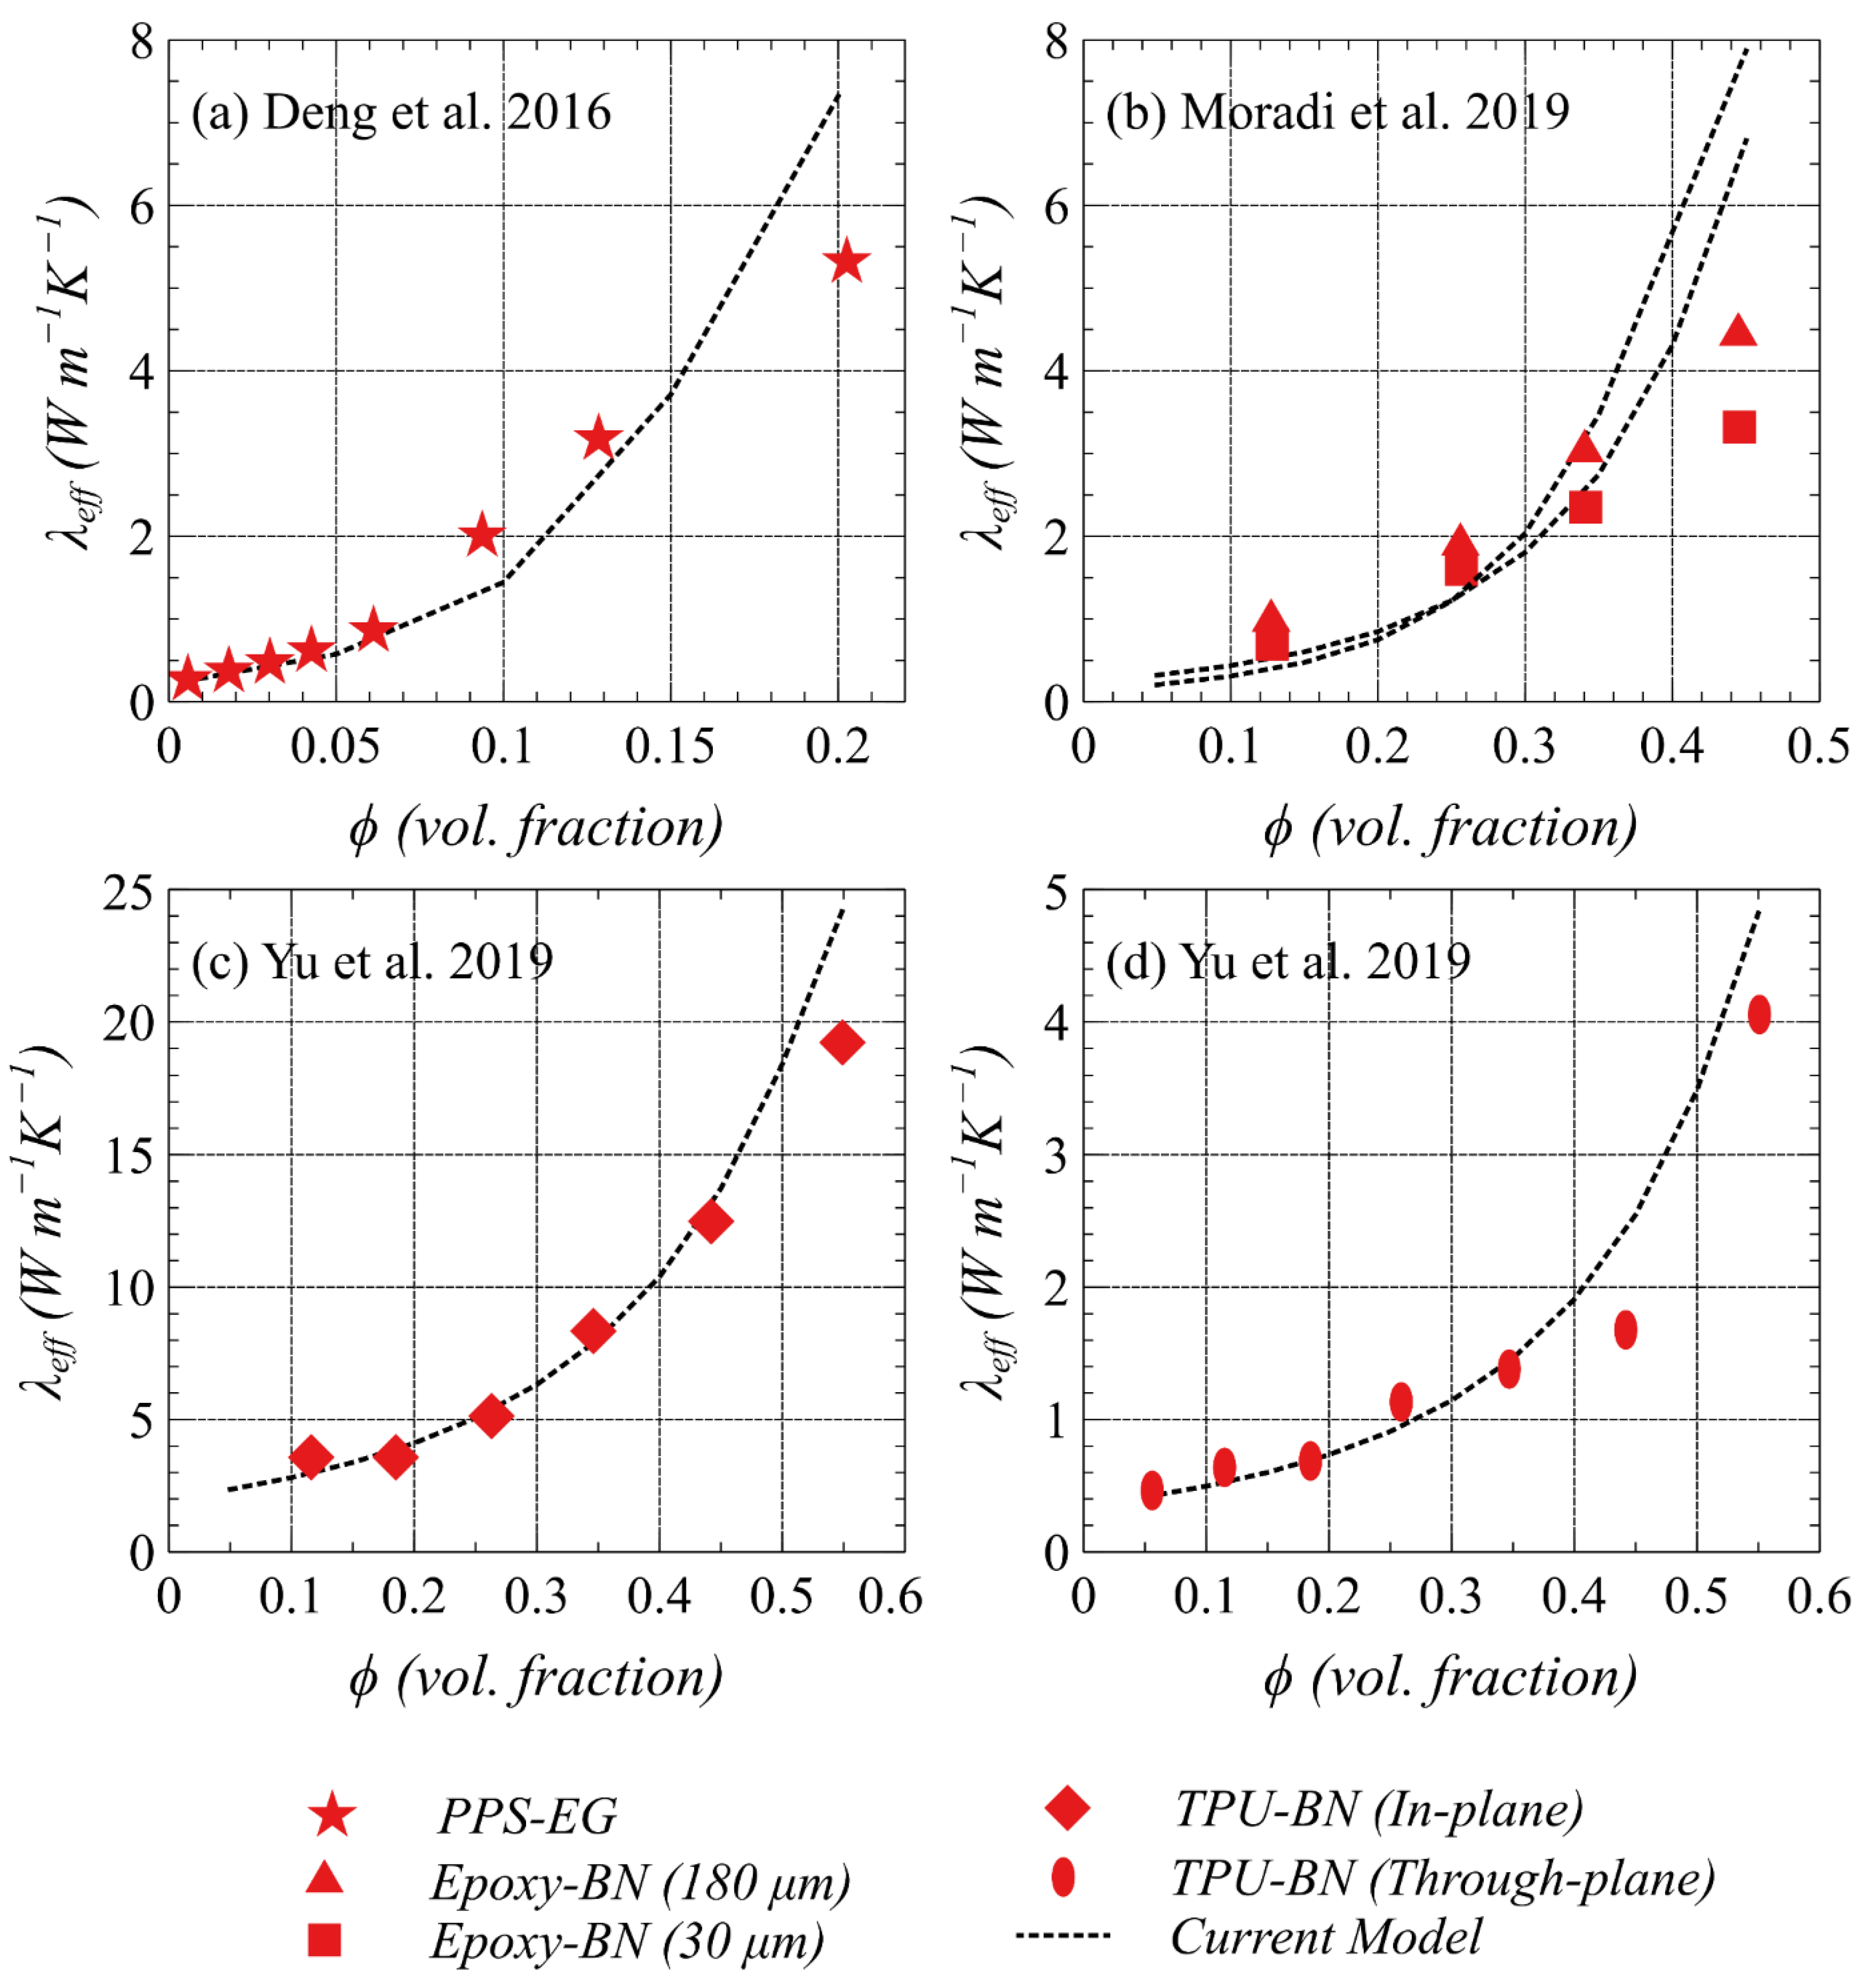
4.5. Validation of Computation Design
4.6. Effect of Filler–Matrix Interface and Filler Orientation
5. Conclusions
Author Contributions
Funding
Institutional Review Board Statement
Informed Consent Statement
Data Availability Statement
Acknowledgments
Conflicts of Interest
References
- Hansson, J.; Nilsson, T.M.J.; Ye, L.; Liu, J. Novel nanostructured thermal interface materials: A review. Int. Mater. Rev. 2018, 63, 22–45. [Google Scholar] [CrossRef]
- Prasher, R.S.; Shipley, J.; Prstic, S.; Koning, P.; Wang, J.L. Thermal resistance of particle laden polymeric thermal interface materials. J. Heat Transf. 2003, 125, 1170–1177. [Google Scholar] [CrossRef]
- Cui, Y.; Li, M.; Hu, Y. Emerging interface materials for electronics thermal management: Experiments, modeling, and new opportunities. J. Mater. Chem. C 2020, 8, 10568–10586. [Google Scholar] [CrossRef]
- Yao, Y.; Zeng, X.; Guo, K.; Sun, R.; Xu, J. Bin The effect of interfacial state on the thermal conductivity of functionalized Al2O3 filled glass fibers reinforced polymer composites. Compos. Part A Appl. Sci. Manuf. 2015, 69, 49–55. [Google Scholar] [CrossRef]
- Wang, H.; Tazebay, A.S.; Yang, G.; Lin, H.T.; Choi, W.; Yu, C. Highly deformable thermal interface materials enabled by covalently-bonded carbon nanotubes. Carbon N. Y. 2016, 106, 152–157. [Google Scholar] [CrossRef]
- Shahil, K.M.F.; Balandin, A.A. Graphene-multilayer graphene nanocomposites as highly efficient thermal interface materials. Nano Lett. 2012, 12, 861–867. [Google Scholar] [CrossRef] [PubMed]
- Marconnet, A.M.; Yamamoto, N.; Panzer, M.A.; Wardle, B.L.; Goodson, K.E. Thermal conduction in aligned carbon nanotube-polymer nanocomposites with high packing density. ACS Nano 2011, 5, 4818–4825. [Google Scholar] [CrossRef] [PubMed]
- Huang, Y.; Hu, J.; Yao, Y.; Zeng, X.; Sun, J.; Pan, G.; Sun, R.; Xu, J.B.; Wong, C.P. Manipulating Orientation of Silicon Carbide Nanowire in Polymer Composites to Achieve High Thermal Conductivity. Adv. Mater. Interfaces 2017, 4, 1700446. [Google Scholar] [CrossRef]
- Kim, H.S.; Jang, J.U.; Lee, H.; Kim, S.Y.; Kim, S.H.; Kim, J.; Jung, Y.C.; Yang, B.J. Thermal Management in Polymer Composites: A Review of Physical and Structural Parameters. Adv. Eng. Mater. 2018, 20, 1800204. [Google Scholar] [CrossRef]
- Kumlutaş, D.; Tavman, I.H.; Turhan Çoban, M. Thermal conductivity of particle filled polyethylene composite materials. Compos. Sci. Technol. 2003, 63, 113–117. [Google Scholar] [CrossRef]
- Boudenne, A.; Ibos, L.; Fois, M.; Majesté, J.C.; Géhin, E. Electrical and thermal behavior of polypropylene filled with copper particles. Compos. Part A Appl. Sci. Manuf. 2005, 36, 1545–1554. [Google Scholar] [CrossRef]
- Tekce, H.S.; Kumlutas, D.; Tavman, I.H. Effect of particle shape on thermal conductivity of copper reinforced polymer composites. J. Reinf. Plast. Compos. 2007, 26, 113–121. [Google Scholar] [CrossRef]
- Mamunya, Y.P.; Davydenko, V.V.; Pissis, P.; Lebedev, E.V. Electrical and thermal conductivity of polymers filled with metal powders. Eur. Polym. J. 2002, 38, 1887–1897. [Google Scholar] [CrossRef]
- Ralphs, M.; Kong, W.; Wang, R.Y.; Rykaczewski, K. Thermal Conductivity Enhancement of Soft Polymer Composites through Magnetically Induced Percolation and Particle–Particle Contact Engineering. Adv. Mater. Interfaces 2019, 6, 1801857. [Google Scholar] [CrossRef]
- Bruggeman, D.A.G. Berechnung verschiedener physikalischer Konstanten von heterogenen Substanzen. I. Dielektrizitätskonstanten und Leitfähigkeiten der Mischkörper aus isotropen Substanzen. Ann. Phys. 1935, 416, 636–664. [Google Scholar] [CrossRef]
- Hamilton, R.L. Thermal conductivity of heterogeneous two-component systems. Ind. Eng. Chem. Fundam. 1962, 1, 187–191. [Google Scholar] [CrossRef]
- Hasselman, D.P.H.; Johnson, L.F. Effective Thermal Conductivity of Composites with Interfacial Thermal Barrier Resistance. J. Compos. Mater. 1987, 21, 508–515. [Google Scholar] [CrossRef]
- Every, A.G.; Tzou, Y.; Hasselman, D.P.H.; Raj, R. The effect of particle size on the thermal conductivity of ZnS/diamond composites. Acta Metall. Mater. 1992, 40, 123–129. [Google Scholar] [CrossRef]
- Wang, J.; Yi, X. Effects of interfacial thermal barrier resistance and particle shape and size on the thermal conductivity of AlN/PI composites. Compos. Sci. Technol. 2004, 64, 1623–1628. [Google Scholar] [CrossRef]
- Nan, C.-W.; Birringer, R.; Clarke, D.R.; Gleiter, H. Effective thermal conductivity of particulate composites with interfacial thermal resistance. J. Appl. Phys. 1997, 81, 6692–6699. [Google Scholar] [CrossRef]
- Siddiqui, M.; Arif, A. Generalized Effective Medium Theory for Particulate Nanocomposite Materials. Materials 2016, 9, 694. [Google Scholar] [CrossRef] [PubMed]
- Raza, K.; Siddiqui, M.U.; Arif, A.F.M.; Akhtar, S.S.; Hakeem, A.S. Design and development of thermally conductive hybrid nano-composites in polysulfone matrix. Polym. Compos. 2019, 40, 1419–1432. [Google Scholar] [CrossRef]
- Akhtar, S.S.; Siddiqui, M.U.; Kabeer, R.; Hakeem, A.; Kareem, L.; Arif, A.F. A computational and experimental study on the effective properties of Al2O3-Ni composites. Int. J. Appl. Ceram. Technol. 2017, 14, 766–778. [Google Scholar] [CrossRef]
- Markov, K.Z. Elementary micromechanics of heterogeneous media. In Hetrogeneous Media; Birkhäuser: Boston, MA, USA, 2000; pp. 1–162. [Google Scholar]
- MatWeb. Your Source for Materials Information. Available online: http://www.matweb.com/ (accessed on 3 March 2020).
- Edinburgh Instruments AZO Materials. Available online: https://www.azom.com/article.aspx?ArticleID=16594 (accessed on 3 March 2020).
- Thermoplastic Polyurethanes Thermal Properties. Available online: https://solutions.covestro.com/en/highlights/articles/theme/product-technology/thermal-properties-tpu (accessed on 10 January 2020).
- Zhi, C.; Bando, Y.; Terao, T.; Tang, C.; Kuwahara, H.; Golberg, D. Towards thermoconductive, electrically insulating polymeric composites with boron nitride nanotubes as fillers. Adv. Funct. Mater. 2009, 19, 1857–1862. [Google Scholar] [CrossRef]
- Raza, K.; Akhtar, S.S.; Arif, A.F.M.; Hakeem, A.S. Computational design and development of high-performance polymer-composites as new encapsulant material for concentrated PV modules. Sci. Rep. 2020, 10, 1–14. [Google Scholar] [CrossRef]
- Khvesyuk, V.I.; Liu, B.; Barinov, A.A. Development of acoustic and diffuse mismatch models for predicting the Kapitza resistance. In Journal of Physics: Conference Series; Novosibirsk, Russia, 27–29 August 2019; IOP Publishing: Bristol, UK, 2019. [Google Scholar]
- Siddiqui, M.U.; Arif, A.F.M. Estimation and optimisation of effective thermal conductivity for polymer matrix composites with hybrid inclusions. J. Compos. Mater. 2018, 52, 2139–2148. [Google Scholar] [CrossRef]
- Moradi, S.; Calventus, Y.; Román, F.; Hutchinson, J.M. Achieving High Thermal Conductivity in Epoxy Composites: Effect of Boron Nitride Particle Size and Matrix-Filler Interface. Polymers 2019, 11, 1156. [Google Scholar] [CrossRef] [PubMed]
- Yu, C.; Gong, W.; Tian, W.; Zhang, Q.; Xu, Y.; Lin, Z.; Hu, M.; Fan, X.; Yao, Y. Hot-pressing induced alignment of boron nitride in polyurethane for composite films with thermal conductivity over 50 Wm−1 K−1. Compos. Sci. Technol. 2018, 160, 199–207. [Google Scholar] [CrossRef]
- Deng, S.; Wang, J.; Zong, G.; Chen, F.; Chai, S.; Fu, Q. Effect of chain structure on the thermal conductivity of expanded graphite/polymer composites. RSC Adv. 2016, 6, 10185–10191. [Google Scholar] [CrossRef]


| Potential Polymers and Fillers Considered | Thermal Conductivity (W m−1 K−1) | Poisson’s Ratio | Elastic Modulus (GPa) | Shear Modulus (GPa) | Coefficient of Thermal Expansion (10−6 K−1) |
|---|---|---|---|---|---|
| Polymer Matrices | |||||
| Thermoplastic polyurethane (TPU) | 0.22 | 0.49 | 0.0035 | 0.00112 | 190 |
| High-density polyethylene (HDPE) | 0.45 | 0.46 | 0.8 | 0.274 | 150 |
| Polypropylene (PP) | 0.15 | 0.43 | 1.4 | 0.49 | 100 |
| Polysulfone | 0.26 | 0.37 | 2.48 | 0.905 | 56 |
| Epoxy | 0.185 | 0.32 | 3.45 | 1.31 | 55 |
| Silicone | 0.2 | 0.47 | 0.028 | 0.0094 | 270 |
| Fillers | |||||
| Alumina (Al2O3) | 33 | 0.21 | 370 | 88.0 | 4.6 |
| Aluminum Nitride (AlN) | 177 | 0.23 | 330 | 126 | 4.3 |
| Gallium Nitride (GaN) | 130 | 0.25 | 306 | 122.4 | 3.1 |
| Silicon Carbide (SiC) | 170 | 0.21 | 430 | 177.7 | 4.0 |
| Boron Nitride (BN) | 52 | 0.21 | 41 | 41.0 | 6.0 |
| Silicon Nitride (Si3N4) | 43 | 0.23 | 310 | 65.3 | 1.4 |
| Diamond | 2000 | 0.2 | 850 | 440 | 0.8 |
| Graphite | 180 | 0.2 | 21 | 8.75 | 4.9 |
| Matrix | Fillers | Mean Particle Size (µm) | Composition, φ (vol%) |
|---|---|---|---|
| HDPE | Al2O3 | 15 | 10, 20, 35, 50 |
| HDPE | Al2O3 | 45 | 10, 20, 35, 50 |
| PP | AlN | 5 | 2, 5, 10, 15, 20, 30, 40, 50 |
| PP | AlN | 15 | 10, 20, 35, 50 |
| PP | Al2O3 | 15 | 10, 30, 50 |
| HDPE | AlN | 15 | 10, 30 |
| TPU | AlN | 5 | 20, 25 |
| TPU | Al2O3 | 5 | 20, 25 |
| Thermal Conductivity of Filler, λp (W m−1 K−1) | Thermal Conductivity of Matrix, λm (W m−1 K−1) | Particle Radius, r1 (µm) | Particles Aspect Ratio, ξ | Effect of Orientation | Interface Thermal Resistance, Rint (m2 K W−1) | Ref. |
|---|---|---|---|---|---|---|
| 200 | 0.24 | 2.5 | 0.05 | 1/3 | 1 × 10⁻⁷ | [34] |
| 600 | 0.14 | 25 | 0.1 | 1/3 | 23 × 10−7 | [32] |
| 600 | 0.14 | 5 | 0.095 | 1/3 | 23 × 10−7 | [32] |
| 600 | 0.24 | 8 | 0.2 | 1 | 16.6 × 10⁻⁷ | [33] |
| 600 | 0.24 | 8 | 0.2 | 0 | 16.6 × 10⁻⁷ | [33] |
Publisher’s Note: MDPI stays neutral with regard to jurisdictional claims in published maps and institutional affiliations. |
© 2021 by the author. Licensee MDPI, Basel, Switzerland. This article is an open access article distributed under the terms and conditions of the Creative Commons Attribution (CC BY) license (http://creativecommons.org/licenses/by/4.0/).
Share and Cite
Akhtar, S.S. An Integrated Approach to Design and Develop High-Performance Polymer-Composite Thermal Interface Material. Polymers 2021, 13, 807. https://doi.org/10.3390/polym13050807
Akhtar SS. An Integrated Approach to Design and Develop High-Performance Polymer-Composite Thermal Interface Material. Polymers. 2021; 13(5):807. https://doi.org/10.3390/polym13050807
Chicago/Turabian StyleAkhtar, Syed Sohail. 2021. "An Integrated Approach to Design and Develop High-Performance Polymer-Composite Thermal Interface Material" Polymers 13, no. 5: 807. https://doi.org/10.3390/polym13050807
APA StyleAkhtar, S. S. (2021). An Integrated Approach to Design and Develop High-Performance Polymer-Composite Thermal Interface Material. Polymers, 13(5), 807. https://doi.org/10.3390/polym13050807