
Poly(Lactic Acid)–Poly(Butylene Succinate)–Sugar Beet Pulp Composites; Part I: Mechanics of Composites with Fine and Coarse Sugar Beet Pulp Particles


Abstract
:
1. Introduction
2. Materials and Methods
2.1. Materials
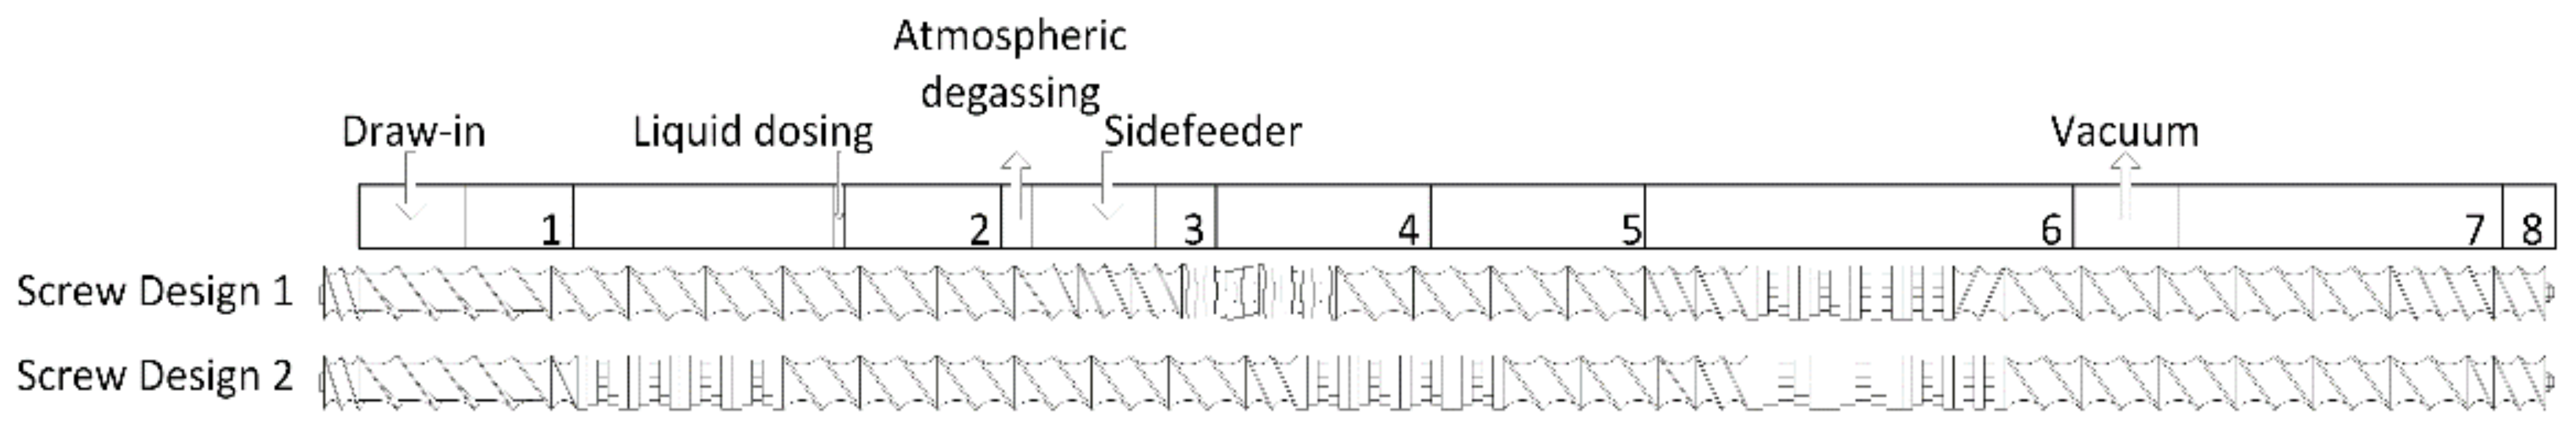
2.2. Compounding
2.2.1. Biopolyester/SBP Composites
2.2.2. SBP Plasticization
2.3. Measurement of Mechanical Properties
2.4. Thermal Analysis
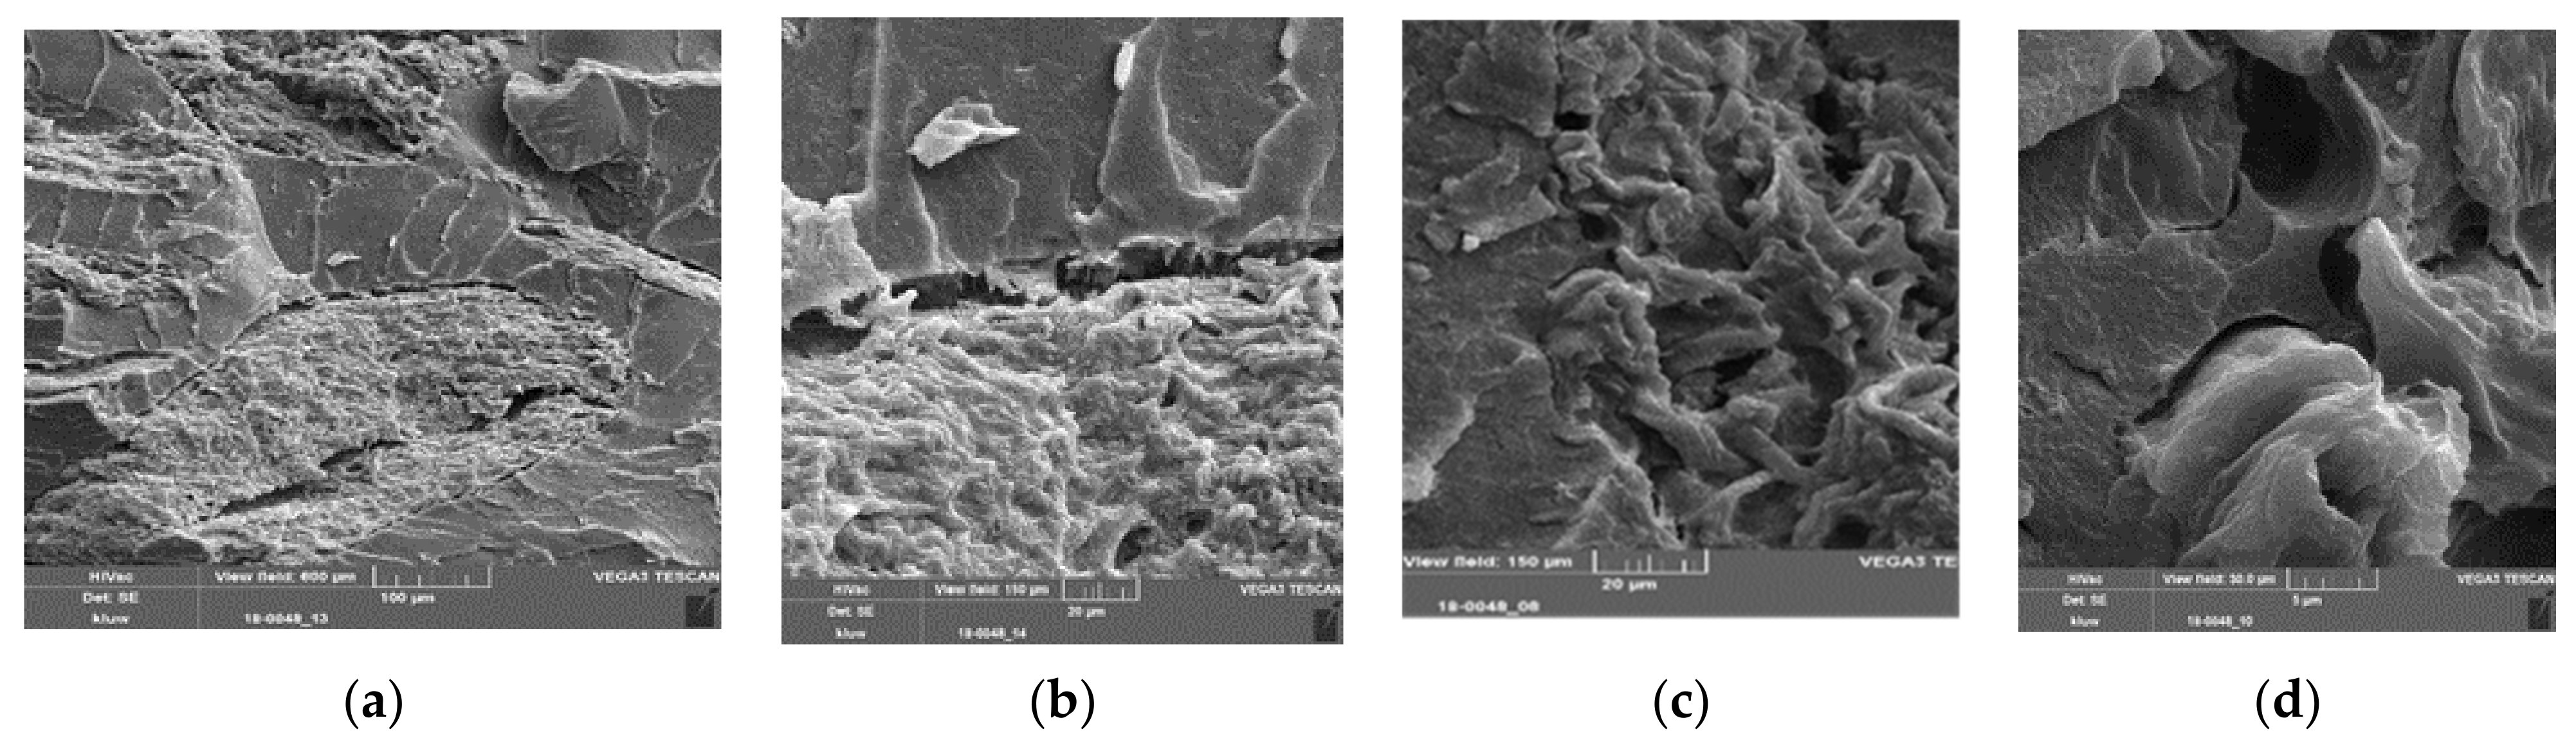
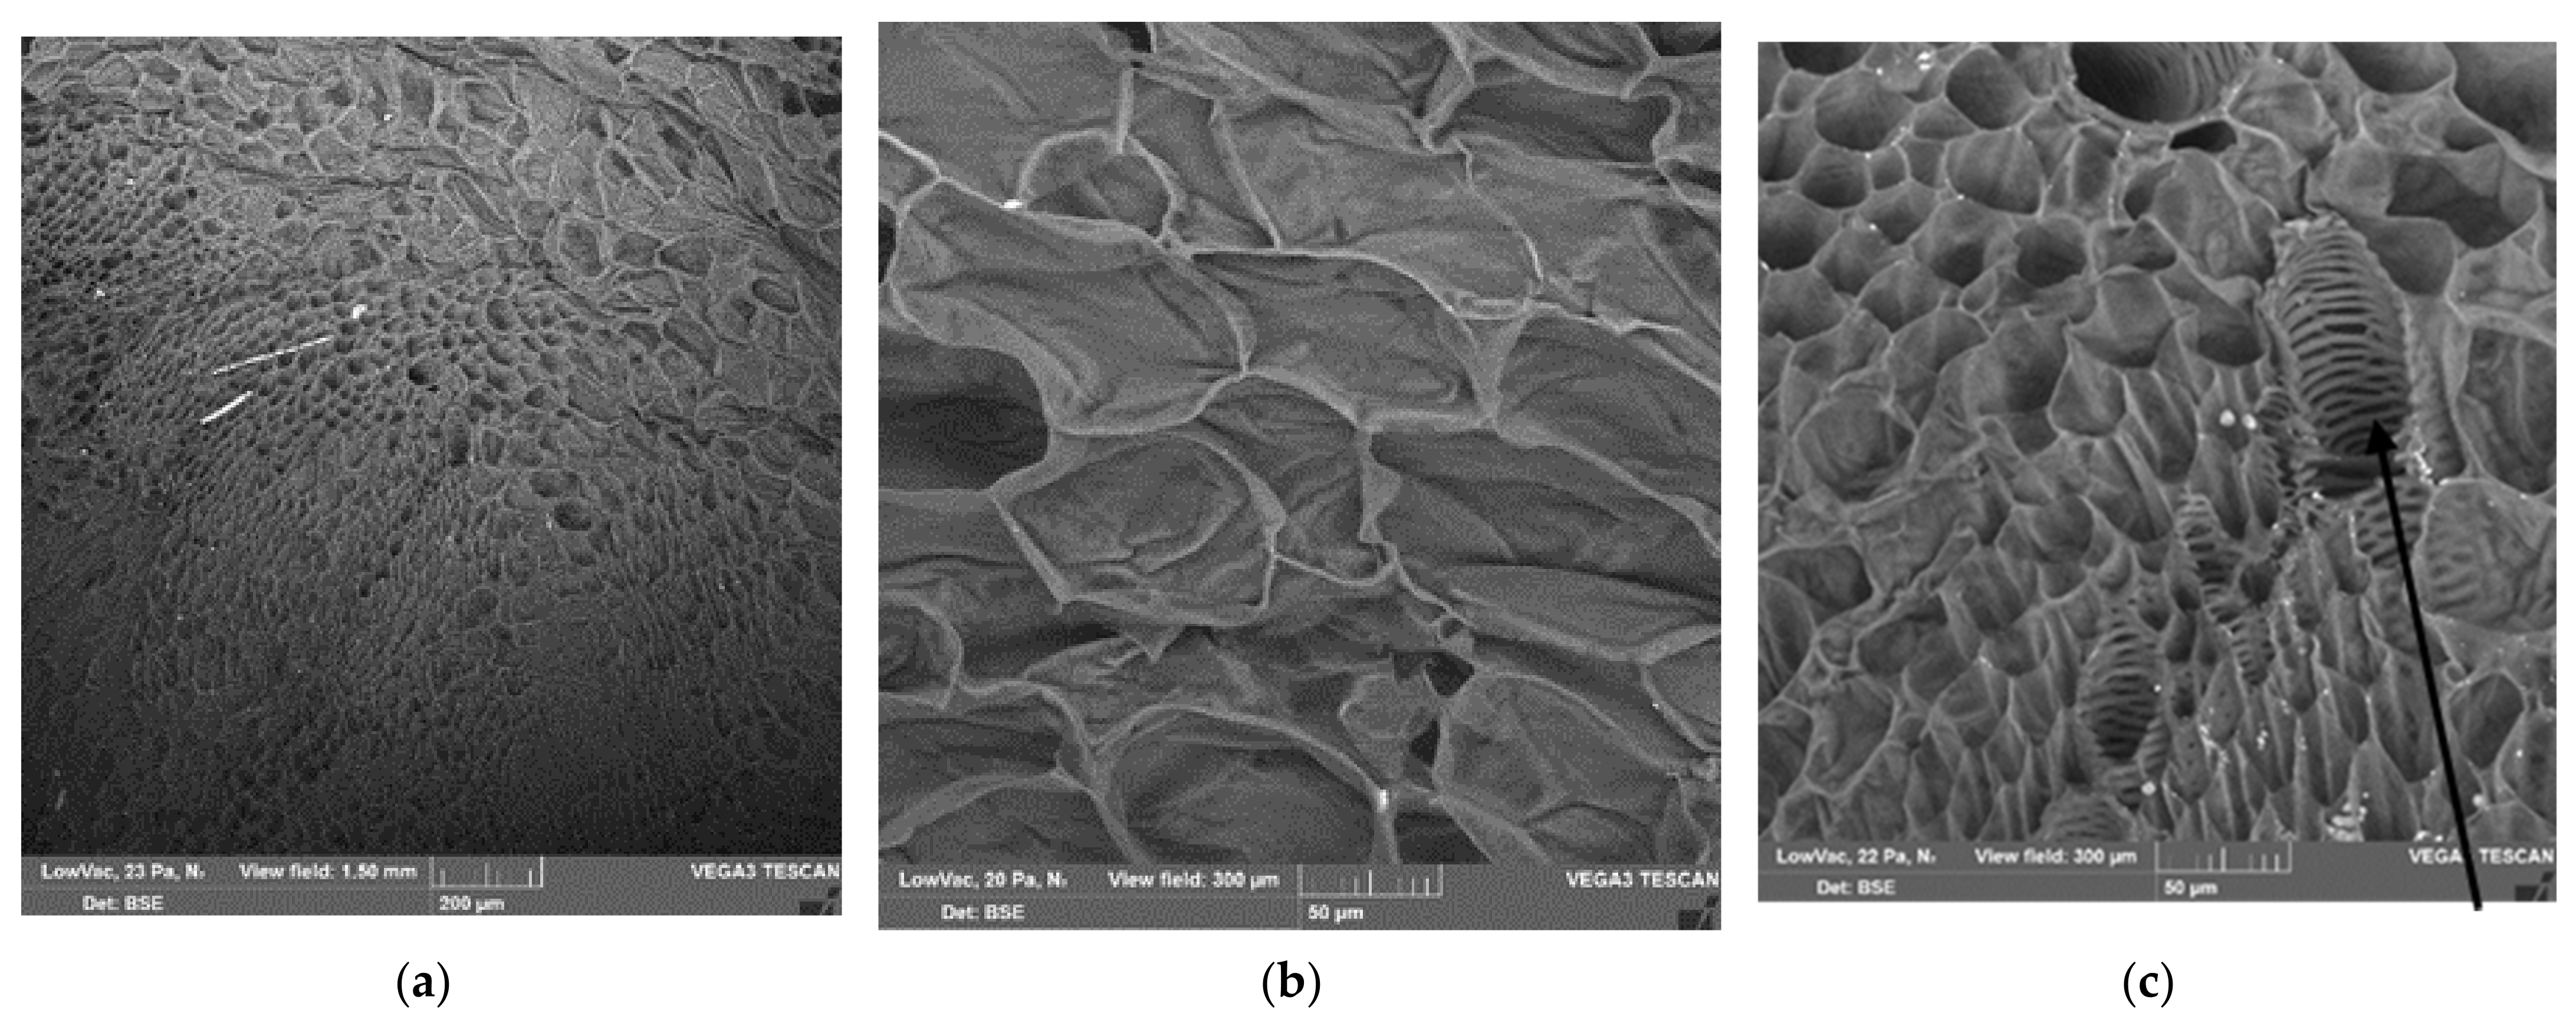
2.5. Scanning Electron Microscopy
2.6. Particle Size
3. Results
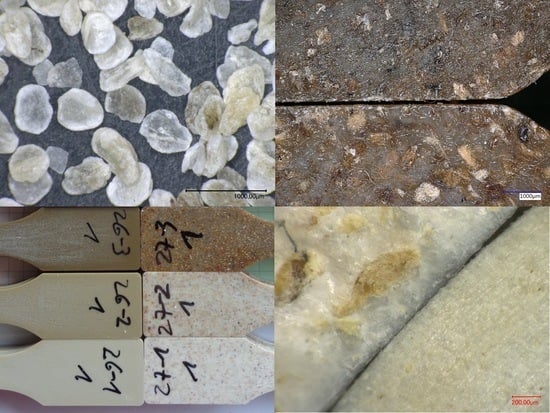
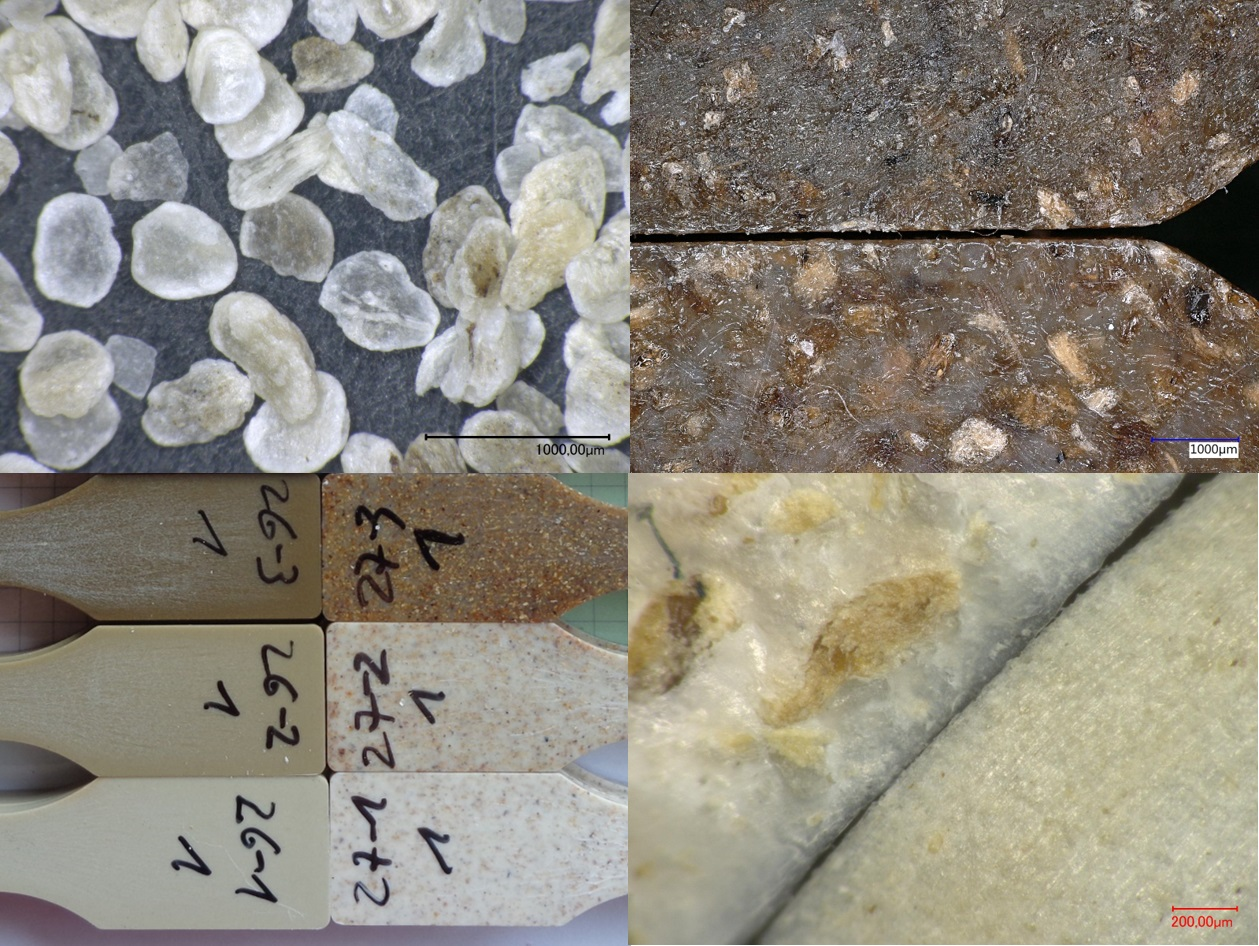
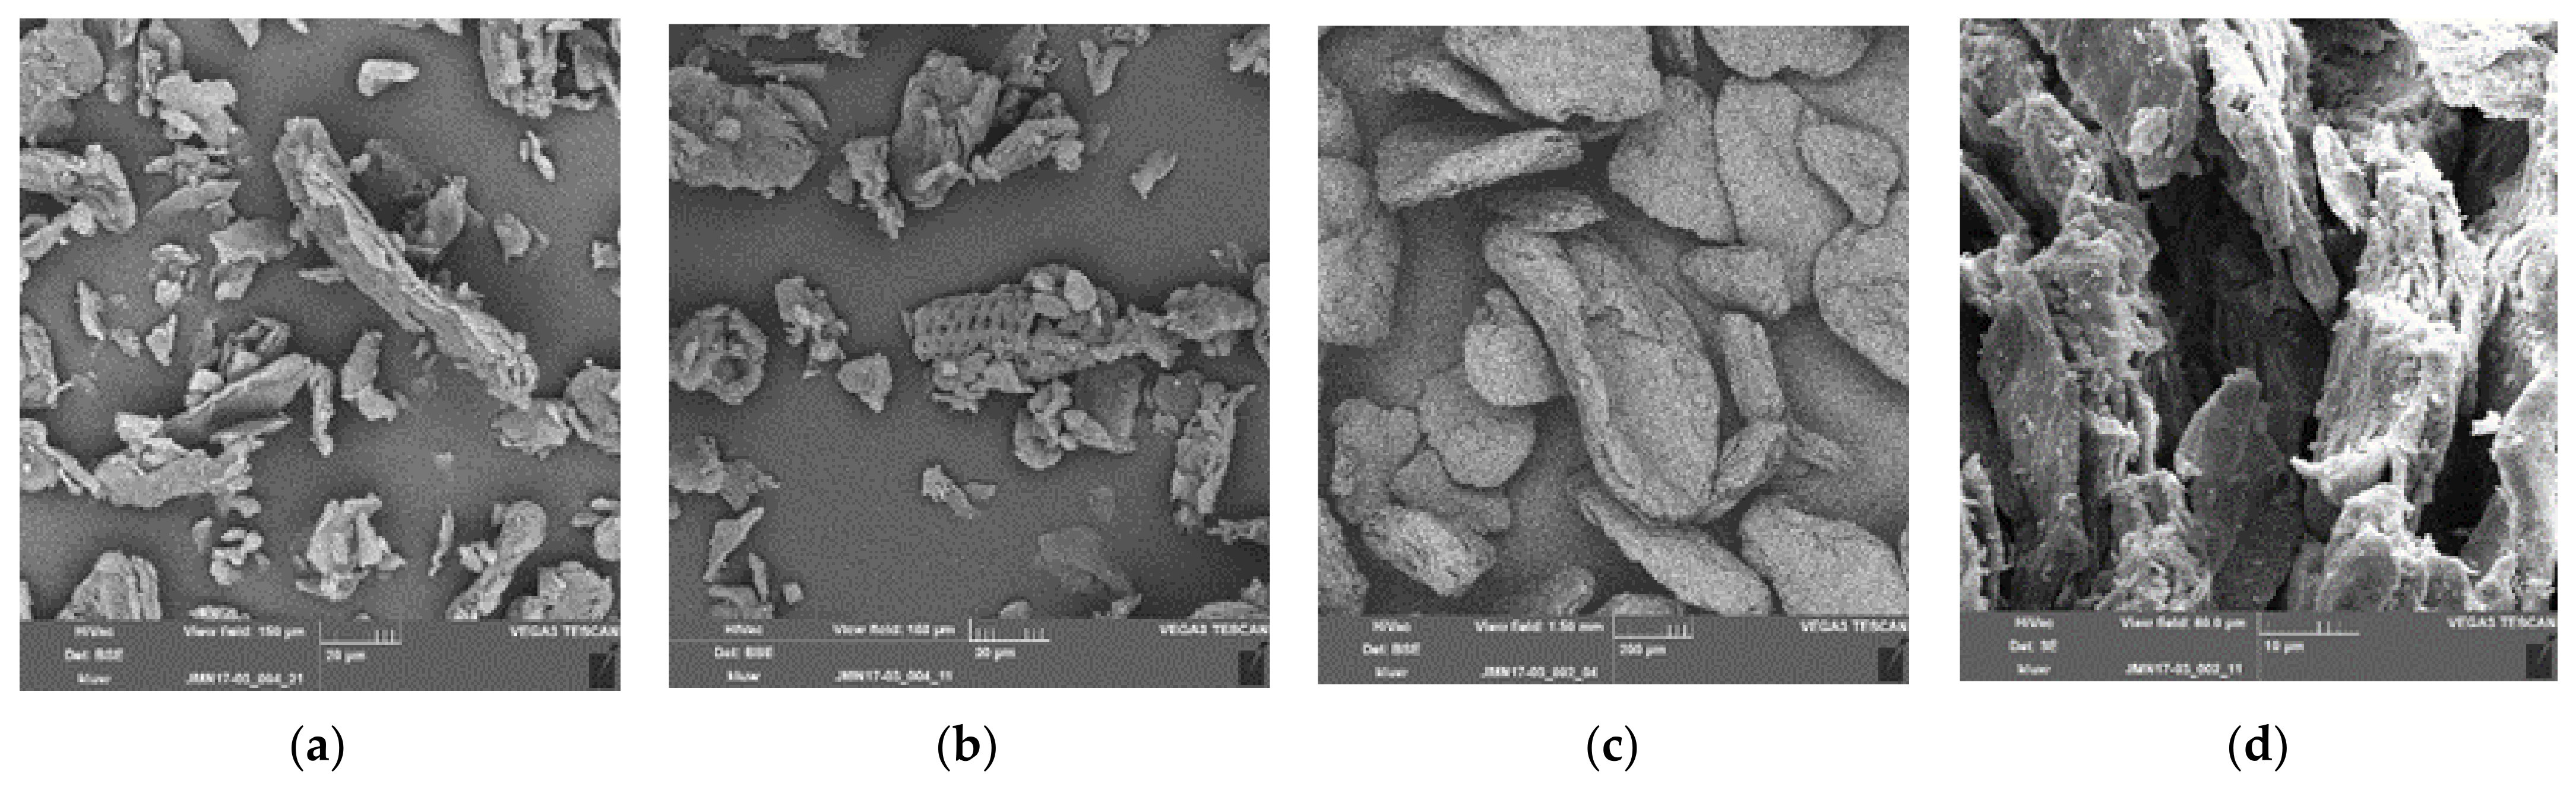
3.1. Sugar Beet Pulp
3.2. Thermoplasticization of Sugar Beet Pulp (TSBP)
3.3. Composites Based on PLA, PBS and SBP
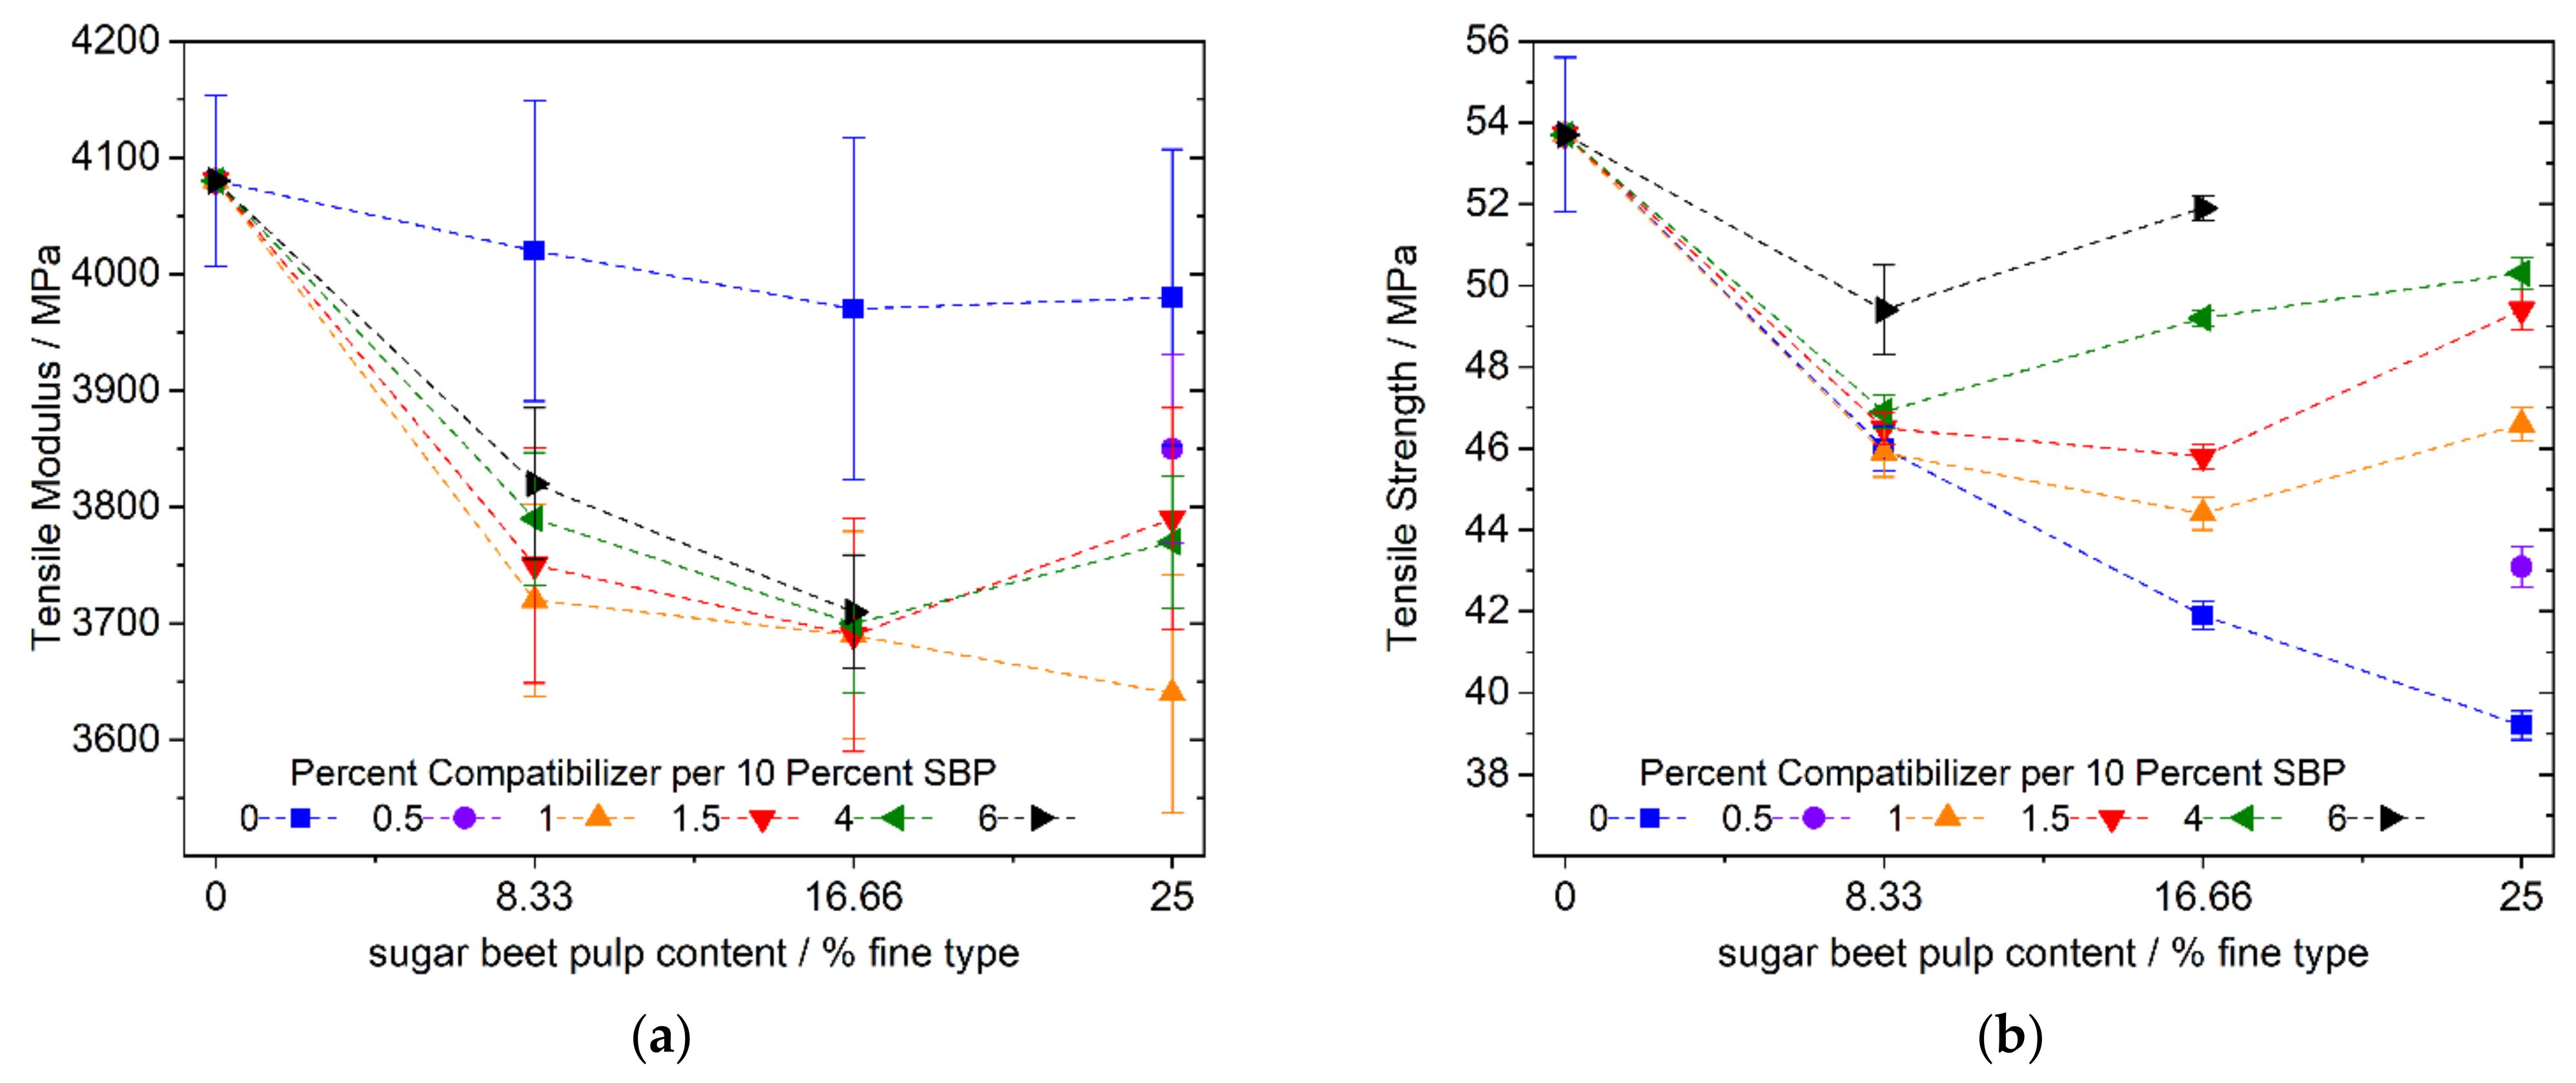
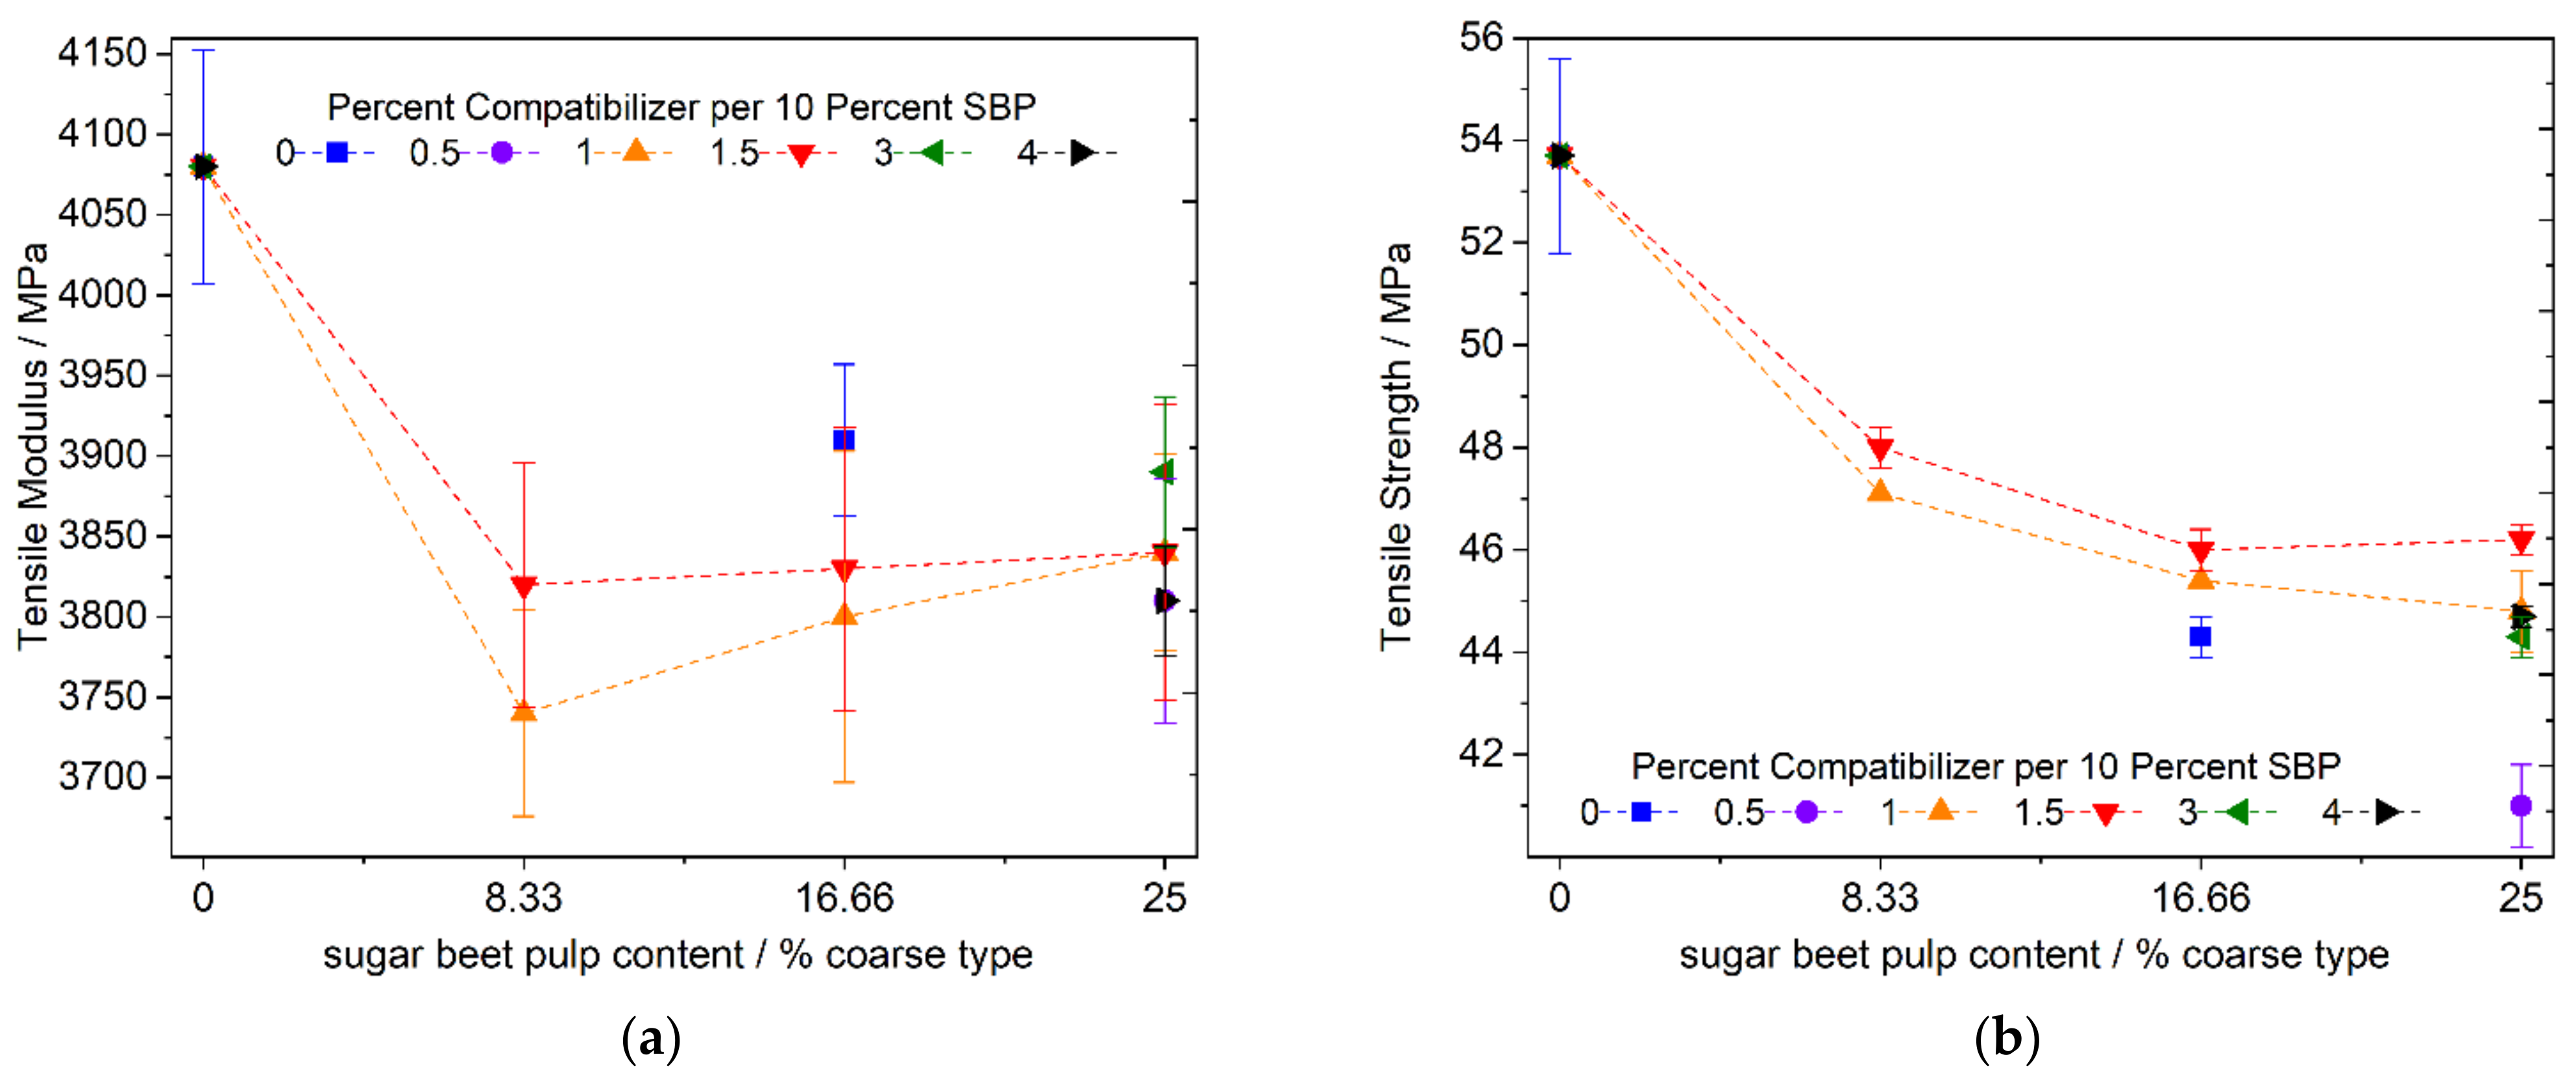
3.3.1. High PLA Content
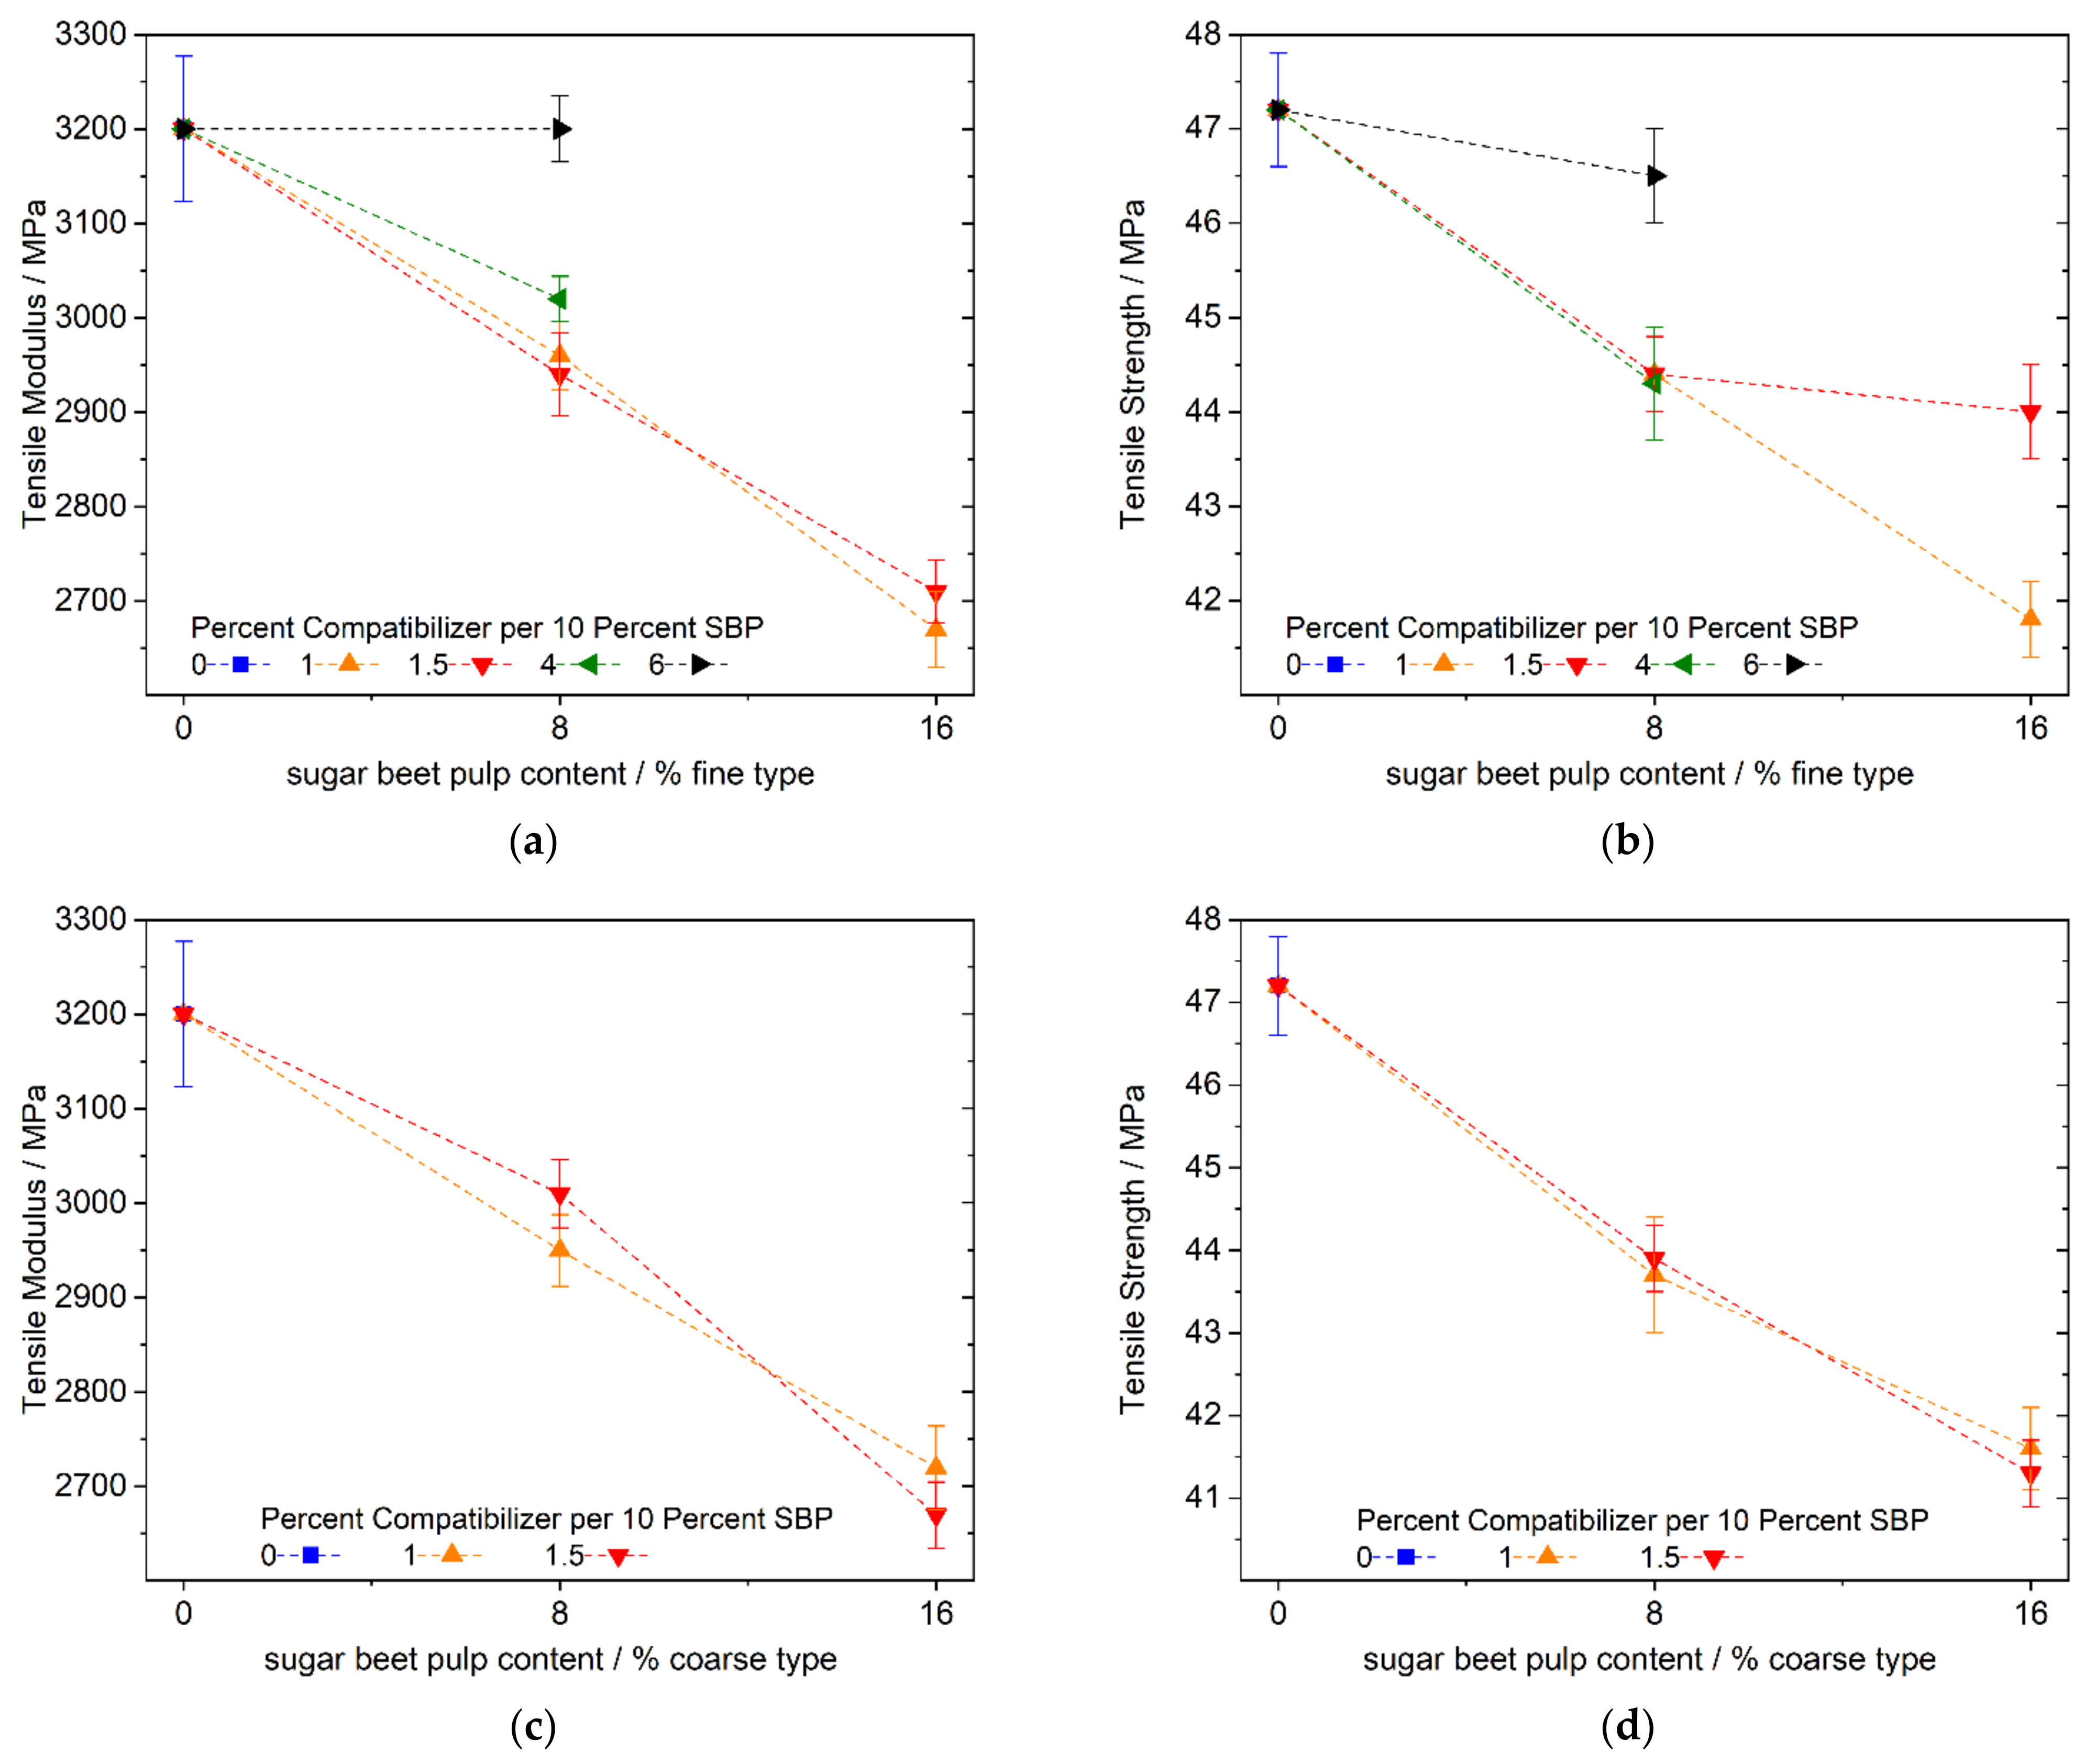
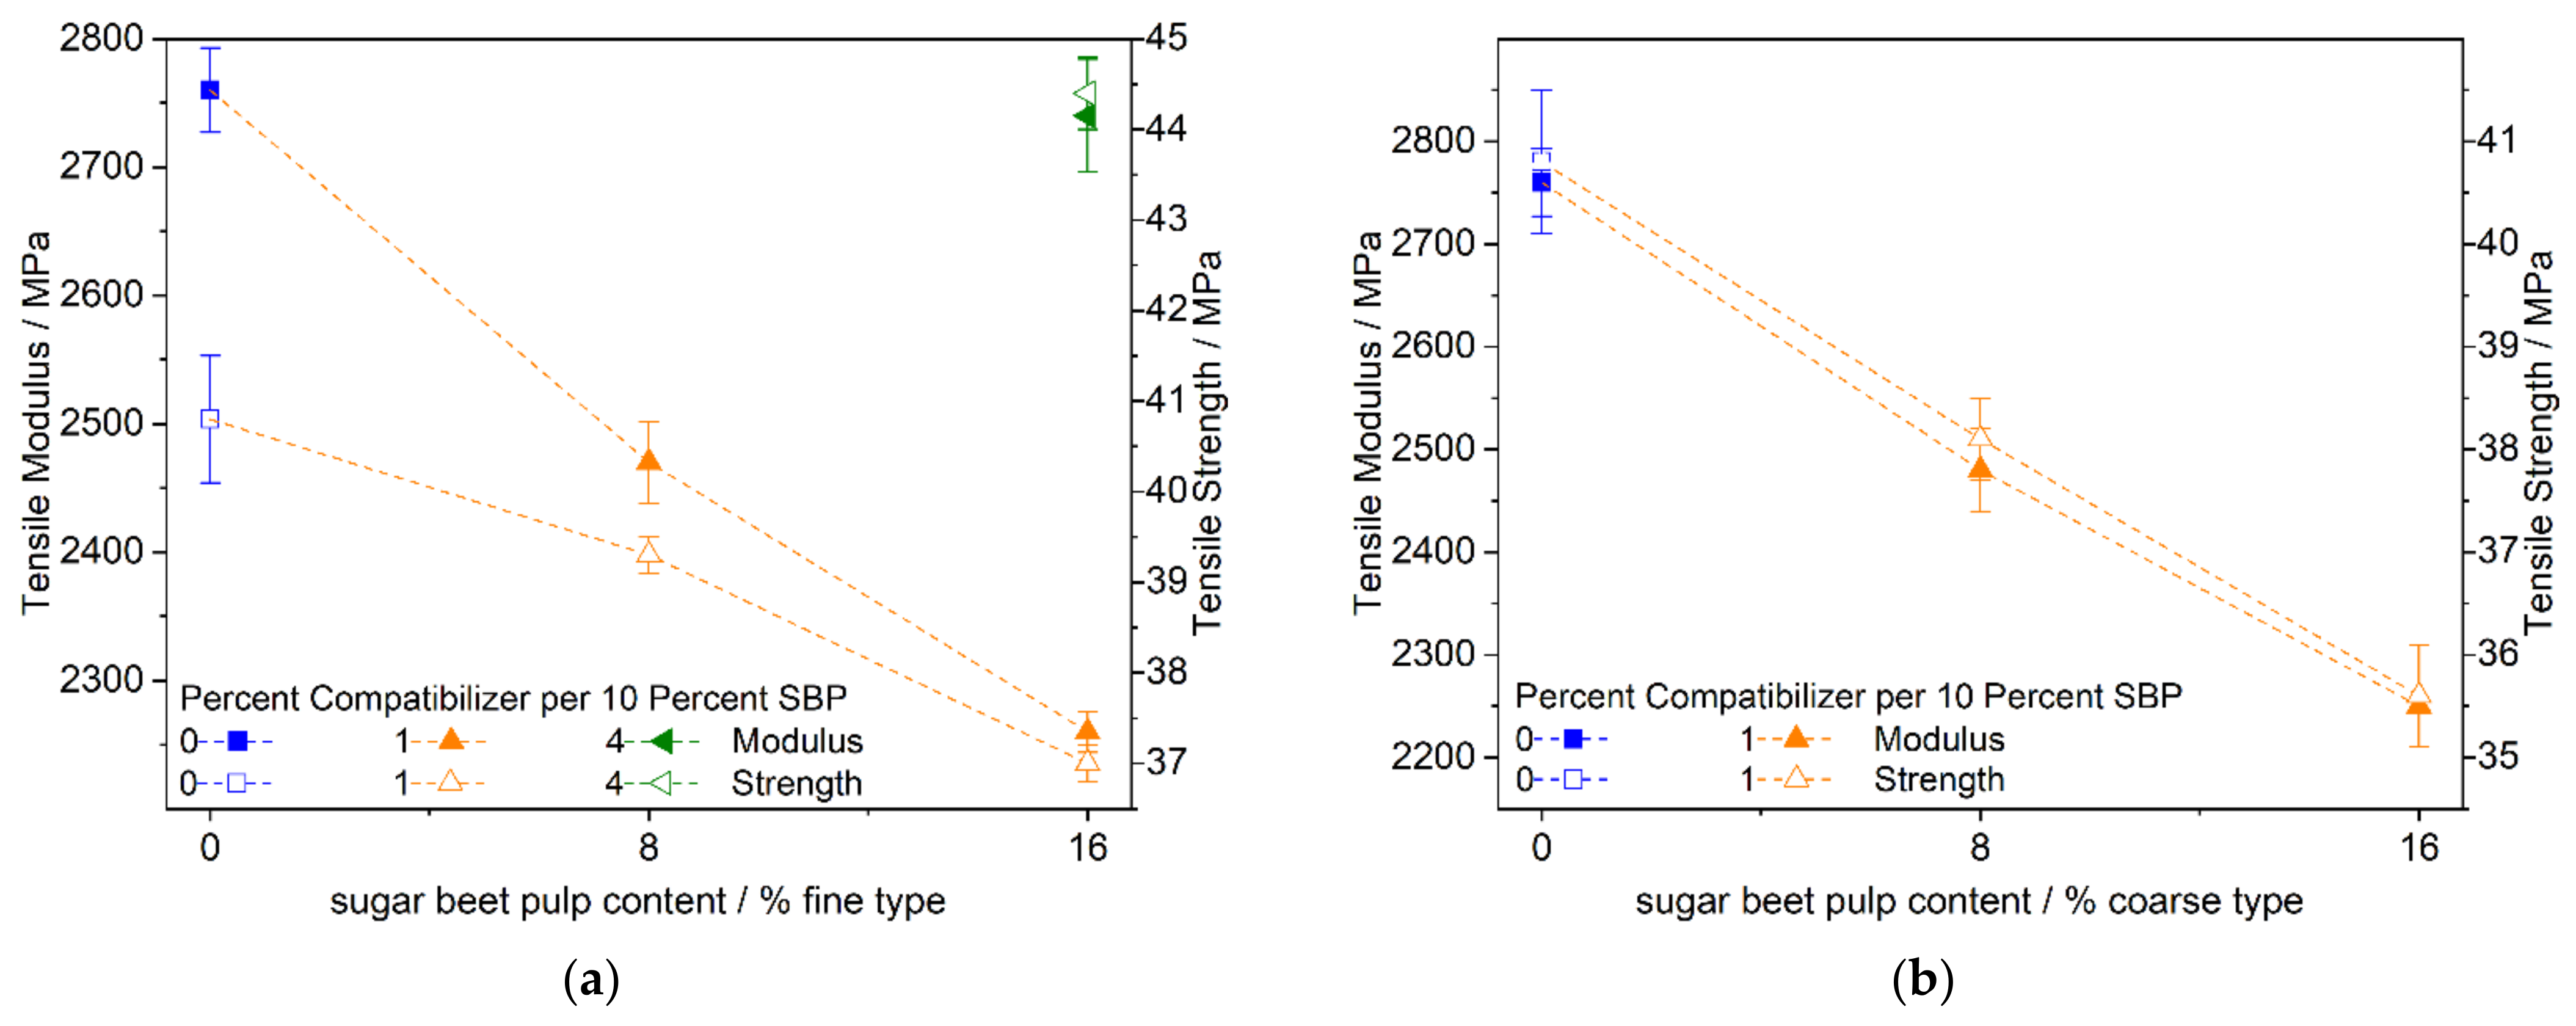
3.3.2. Medium and High PBS Content (PBS Rich Compound)
3.4. Influence of SBP on Modulus and Strength: Theoretical Considerations for the Mineral Filler-Free Composites
4. Conclusions
5. Outlook
Funding
Institutional Review Board Statement
Informed Consent Statement
Data Availability Statement
Acknowledgments
Conflicts of Interest
References and Note
- Food and Agriculure Organisation of the United Nations. FAOSTAT Data. Available online: http://fenix.fao.org/faostat/internal/en/#data/QCL (accessed on 25 May 2021).
- Rouilly, A.; Jorda, J.; Rigal, L. Thermo-mechanical processing of sugar beet pulp. I. Twin-screw extrusion process. Carbohydr. Polym. 2006, 66, 81–87. [Google Scholar] [CrossRef] [Green Version]
- Van der Poel, P.W.; Schiweck, H.; Schwartz, T. Zuckertechnologie: Rüben- und Rohrzuckergewinnung; Verlag Dr. Albert Bartens KG: Berlin, Germany, 2000; pp. 123–125. ISBN 3-87040-070-6. [Google Scholar]
- Van der Poel, P.W.; Schiweck, H.; Schwartz, T. Sugar Technology: Beet and Cane Sugar Manufacture, 1st ed.; Verlag Dr. Albert Bartens KG: Berlin, Germany, 1998; pp. 115–117. ISBN 978-3-87040-065-1. [Google Scholar]
- Sun, R.; Hughes, S. Fractional isolation and physico-chemical characterization of alkali-soluble polysaccharides from sugar beet pulp. Carbohydr. Polym. 1999, 38, 273–281. [Google Scholar] [CrossRef]
- Knudsen, K.E.B. Carbohydrate and lignin contents of plant masterials used in animal feeding. Anim. Feed. Sci. Technol. 1997, 67, 319–338. [Google Scholar] [CrossRef]
- Brachi, P.; Riianova, E.; Miccio, M.; Miccio, F.; Ruoppolo, G.; Chirone, R. Valorization of Sugar Beet Pulp via Torrefaction with a Focus on the Effect of the Preliminary Extraction of Pectins. Energy Fuels 2017, 31, 9595–9604. [Google Scholar] [CrossRef]
- Berłowska, J.; Pielech-Przybylska, K.; Balcerek, M.; Dziekońska-Kubczak, U.; Patelski, P.; Dziugan, P.; Kręgiel, D. Simultaneous Saccharification and Fermentation of Sugar Beet Pulp for Efficient Bioethanol Production. BioMed Res. Int. 2016, 2016, 3154929. [Google Scholar] [CrossRef] [PubMed]
- Majzoobi, M.; Farahnaky, A.; Jamalian, J.; Mesbahi, G.; Sairi, F. Application of sugar beet pulp as dough and bread improver (Barbari bread). In Gums and Stabilisers for the Food Industry 15, Proceedings of the 15th Gums and Stabilisers for the Food Industry Conference, Wrexham, UK, 22–26 June 2010; William, P.A., Phillips, G.O., Eds.; RSC Publishing: Cambridge, UK, 2010; pp. 309–316. ISBN 978-1-84755-199-3. [Google Scholar]
- Michel, F.; Thibault, J.-F.; Barry, J.-L.; de Baynast, R. Preparation and characterisation of dietary fibre from sugar beet pulp. J. Sci. Food Agric. 1988, 42, 77–85. [Google Scholar] [CrossRef]
- Ačkar, Đ.; Jozinović, A.; Babić, J.; Miličević, B.; Panak Balentić, J.; Šubarić, D. Resolving the problem of poor expansion in corn extrudates enriched with food industry by-products. Innov. Food Sci. Emerg. Technol. 2018, 47, 517–524. [Google Scholar] [CrossRef]
- Dinand, E.; Chanzy, H.; Vignon, M.R. Parenchymal cell cellulose from sugar beet pulp: Preparation and properties. Cellulose 1996, 3, 183–188. [Google Scholar] [CrossRef]
- Dinand, E.; Chanzy, H.; Vignon, R.M. Suspensions of cellulose microfibrils from sugar beet pulp. Food Hydrocoll. 1999, 13, 275–283. [Google Scholar] [CrossRef]
- Li, M.; Wang, L.; Li, D.; Cheng, Y.; Adhikari, B. Preparation and characterization of cellulose nanofibers from de-pectinated sugar beet pulp. Carbohydr. Polym. 2014, 102, 136–143. [Google Scholar] [CrossRef]
- Togrul, H. Production of carboxymethyl cellulose from sugar beet pulp cellulose and rheological behaviour of carboxymethyl cellulose. Carbohydr. Polym. 2003, 54, 73–82. [Google Scholar] [CrossRef]
- Oosterveld, A. Isolation of feruloylated arabinans and rhamnogalacturonans from sugar beet pulp and their gel forming ability by oxidative cross-linking. Carbohydr. Polym. 2001, 44, 9–17. [Google Scholar] [CrossRef]
- Huang, X.; Li, D.; Wang, L. Characterization of pectin extracted from sugar beet pulp under different drying conditions. J. Food Eng. 2017, 211, 1–6. [Google Scholar] [CrossRef]
- Turquois, T.; Rinaudo, M.; Taravel, F.; Heyraud, A. Extraction of highly gelling pectic substances from sugar beet pulp and potato pulp: Influence of extrinsic parameters on their gelling properties. Food Hydrocoll. 1999, 13, 255–262. [Google Scholar] [CrossRef]
- Cárdenas-Fernández, M.; Hamley-Bennett, C.; Leak, D.J.; Lye, G.J. Continuous enzymatic hydrolysis of sugar beet pectin and l-arabinose recovery within an integrated biorefinery. Bioresour. Technol. 2018, 269, 195–202. [Google Scholar] [CrossRef]
- Mathew, S.; Abraham, T.E. Ferulic acid: An antioxidant found naturally in plant cell walls and feruloyl esterases involved in its release and their applications. Crit. Rev. Biotechnol. 2004, 24, 59–83. [Google Scholar] [CrossRef]
- Micard, V.; Renard, C.; Thibault, J.-F. Studies on Enzymic Release of Ferulic Acid from Sugar-Beet Pulp. LWT Food Sci. Technol. 1994, 27, 59–66. [Google Scholar] [CrossRef]
- Kumar, N.; Pruthi, V. Potential applications of ferulic acid from natural sources. Biotechnol. Rep. 2014, 4, 86–93. [Google Scholar] [CrossRef] [Green Version]
- Rouilly, A.; Jorda, J.; Rigal, L. Thermo-mechanical processing of sugar beet pulp. II. Thermal and rheological properties of thermoplastic SBP. Carbohydr. Polym. 2006, 66, 117–125. [Google Scholar] [CrossRef] [Green Version]
- Rouilly, A.; Geneau-Sbartaï, C.; Rigal, L. Thermo-mechanical processing of sugar beet pulp. III. Study of extruded films improvement with various plasticizers and cross-linkers. Bioresour. Technol. 2009, 100, 3076–3081. [Google Scholar] [CrossRef] [PubMed] [Green Version]
- Liu, B.; Zhang, J.; Liu, L.; Hotchkiss, A.T. Preparation and Properties of Water and Glycerol-plasticized Sugar Beet Pulp Plastics. J. Polym. Environ. 2011, 19, 559–567. [Google Scholar] [CrossRef]
- Liu, B.; Zhang, J.; Liu, L.; Hotchkiss, A.T. Utilization of Pectin Extracted Sugar Beet Pulp for Composite Application. J. Biobased Mater. Bioenergy 2012, 6. [Google Scholar] [CrossRef]
- Liu, L.; Fishman, M.L.; Hicks, K.B.; Liu, C.-K. Biodegradable composites from sugar beet pulp and poly(lactic acid). J. Agric. Food Chem. 2005, 53, 9017–9022. [Google Scholar] [CrossRef]
- Liu, L.S.; Finkenstadt, V.L.; Liu, C.-K.; Coffin, D.R.; Willett, J.L.; Fishman, M.L.; Hicks, K.B. Green Composites from Sugar Beet Pulp and Poly(lactic acid): Structural and Mechanical Characterization. J. Biobased Mat. Bioenergy 2007, 1, 323–330. [Google Scholar] [CrossRef]
- Finkenstadt, V.L.; Liu, L.; Willett, J.L. Evaluation of Poly(lactic acid) and Sugar Beet Pulp Green Composites. J. Polym. Environ. 2007, 15, 1–6. [Google Scholar] [CrossRef]
- Finkenstadt, V.L.; Liu, C.-K.; Cooke, P.H.; Liu, L.S.; Willett, J.L. Mechanical Property Characterization of Plasticized Sugar Beet Pulp and Poly(Lactic Acid) Green Composites Using Acoustic Emission and Confocal Microscopy. J. Polym. Environ. 2008, 16, 19–26. [Google Scholar] [CrossRef]
- Chen, F.; Liu, L.; Cooke, P.H.; Hicks, K.B.; Zhang, J. Performance Enhancement of Poly(lactic acid) and Sugar Beet Pulp Composites by Improving Interfacial Adhesion and Penetration. Ind. Eng. Chem. Res. 2008, 47, 8667–8675. [Google Scholar] [CrossRef]
- Mohamed, A.A.; Finkenstadt, V.L.; Palmquist, D.E. Thermal properties of extruded/injection-molded poly(lactic acid) and biobased composites. J. Appl. Polym. Sci. 2008, 107, 898–908. [Google Scholar] [CrossRef]
- Liu, B.; Bhaladhare, S.; Zhan, P.; Jiang, L.; Zhang, J.; Liu, L.; Hotchkiss, A.T. Morphology and Properties of Thermoplastic Sugar Beet Pulp and Poly(butylene adipate-co-terepthalate) Blends. Ind. Eng. Chem. Res. 2011, 50, 13859–13865. [Google Scholar] [CrossRef]
- Shen, Z.; Ghasemlou, M.; Kamdem, D.P. Development and compatibility assessment of new composite film based on sugar beet pulp and polyvinyl alcohol intended for packaging applications. J. Appl. Polym. Sci. 2015, 132. [Google Scholar] [CrossRef]
- Tsuji, H. Hydrolytic Degradation. In Poly(Lactic Acid): Synthesis, Structures, Properties, Processing, and Applications; Auras, R., Lim, L.-T., Selke, S., Tsuji, H., Eds.; John Wiley & Sons, Inc.: Hoboken, NJ, USA, 2010; pp. 345–376. ISBN 9780470649848. [Google Scholar]
- Kopitzky, R. Non-Published Results of an Internal FT-IR Study on Commercialized Coffee Capsules Mainly from Europe between 2019 and 2021.
- Su, S.; Kopitzky, R.; Tolga, S.; Kabasci, S. Polylactide (PLA) and Its Blends with Poly(butylene succinate) (PBS): A Brief Review. Polymers 2019, 11, 1193. [Google Scholar] [CrossRef] [Green Version]
- Aliotta, L.; Cinelli, P.; Coltelli, M.B.; Righetti, M.C.; Gazzano, M.; Lazzeri, A. Effect of nucleating agents on crystallinity and properties of poly (lactic acid) (PLA). Eur. Polym. J. 2017, 93, 822–832. [Google Scholar] [CrossRef]
- Lee, H.L.; Luner, P. The Solubility Parameter of Cellulose and Alkyleneketene Dimer (AKD) Determined by Inverse Gas Chromatography. J. Wood Technol. Technol. 1991, 11, 247–261. [Google Scholar] [CrossRef]
- Archer, W.L. Determination of Hansen Solubility Parameters for selected Cellulose Ether Derivates. Ind. Eng. Chem. Res. 1991, 30, 2292–2298. [Google Scholar] [CrossRef]
- Robeson, L.M. Polymer Blends: A Comprehensive Review; Hanser Verlag: Munich, Germany, 2007; ISBN 978-3-446-22569-5. [Google Scholar]
- Abbot, S. Chemical Compatibility of Poly(Lactic Acid): A Practical Framework Using Hansen Solubility Parameters. In Poly(Lactic Acid): Synthesis, Structures, Properties, Processing, and Applications; Auras, R., Lim, L.-T., Selke, S., Tsuji, H., Eds.; John Wiley & Sons, Inc.: Hoboken, NJ, USA, 2010; pp. 83–95. ISBN 9780470649848. [Google Scholar]
- Li, H.; Huneault, M.A. Effect of nucleation and plasticization on the crystallization of poly(lactic acid). Polymer 2007, 48, 6855–6866. [Google Scholar] [CrossRef] [Green Version]
- Battegazore, D.; Bocchini, S.; Frache, A. Crystallization kinetics of poly(lactic acid)-talc composites. Express Polym. Lett. 2011, 5, 849–858. [Google Scholar] [CrossRef] [Green Version]
- Pivsa-Art, W.; Fujii, K.; Nomura, K.; Aso, Y.; Ohara, H.; Yamane, H. Isothermal crystallization kinetics of talc-filled poly(lactic acid) and poly(butylene succinate) blends. J. Polym. Res. 2016, 23, 144. [Google Scholar] [CrossRef]
- Agarval, B.D.; Broutman, L.J.; Chandrashekhara, K. Analysis and Performance of Fibre, 3rd ed.; John Wiley & Sons: Hoboken, NJ, USA, 2006; Chapter 3; p. 69ff. ISBN 978-0-471-26891-8. [Google Scholar]
- Yerbolat, G.; Amangeldi, S.; Ali, H.M.; Badanova, N.; Ashirbeok, A.; Islam, G. (Eds.) Composite Materials Property Determination by Rule of Mixture and Monte Carlo Simulation. In Proceedings of the 2018 IEEE International Conference on Advanced Manufacturing (ICAM), Yunlin, Taiwan, 16–18 November 2018; pp. 384–387. [Google Scholar] [CrossRef]
- Tomar, N.; Maiti, S.M. Mechanical Properties of PBT/ABAS Blends. J. Appl. Polym. Sci. 2007, 104, 1807–1817. [Google Scholar] [CrossRef]
- Simões, C.L.; Viana, J.C.; Cunha, A.M. Mechanical properties of poly(ε-caprolactone) and poly(lactic acid) blends. J. Appl. Polym. Sci. 2009, 112, 345–352. [Google Scholar] [CrossRef]
- Cohen, L.J.; Ishai, O. The Elastic Properties of Three Phase Composites. J. Compos. Mater. 1967, 1, 390–403. [Google Scholar] [CrossRef]
- Halpin, J.C.; Kardos, J.L. The Halpin-Tsai Equations: A Review. Polym. Eng. Sci. 1976, 16, 344–352. [Google Scholar] [CrossRef]
- Nicolais, L.; Narkis, M. Stress-Strain Behavior of Styrene-Acrylonitrile/Glass Bead Composites in the Glassy Region. Polym. Eng. Sci. 1971, 11, 194–199. [Google Scholar] [CrossRef]
- Ramsteiner, F.; Theysohn, R. On the tensile behaviour of filled composites. Composites 1984, 15, 121–128. [Google Scholar] [CrossRef]


| Dimension | Unit | Fine Type | Coarse Type (I) | Coarse Type (II) |
|---|---|---|---|---|
| d (0.1) | µm | 6.1 | 360 | 291 |
| d (0.5) | µm | 23.4 | 601 | 500 |
| d (0.9) | µm | 48.7 | 999 | 821 |
| surface mean value D[3, 2], Sauter-diameter | µm | 11.8 | 539 | 280 |
| volume mean value D[4, 3], De Broucker-diameter | µm | 25.9 | 645 | 529 |
| specific surface | cm2 g−1 | 5080 | 111 | 214 |
| Sample, Consisting of 75% PLA–PBS (9:1) and | Screw Design 1, Glycerol-Containing Composite Tg/°C | Screw Design 2, Composite without Glycerol Tg/°C |
|---|---|---|
| 0% SBP 25% chalk | 54.7 | |
| 8.33% SBP 16.66% chalk | 53.5 | 54.7 |
| 16.66% SBP 8.33% chalk | 50.5 | 56.3 |
| 25% SBP 0% chalk | 50.9 | 52.4 |
| SBP | Chalk | Additives | Tensile Modulus | Tensile Strength | Elongation at Break | Impact (Charpy) | |||
|---|---|---|---|---|---|---|---|---|---|
| Type 1 | % | c. a. 2 | a. p. 2 | MPa | MPa | % | Notched kJm−2 | Unnotched kJm−2 | |
| - | 0 | 25 | 0 | 0 | 4080 (1.8) | 50.4 (1.0) | 3.0 (8.2) | 1.6 (0.8) | 14.2 (7.2) |
| f | 8.3 | 16.7 | 0 | 0 | 4020 (32) | 46.0 (1.2) | 4.1 (14) | 2.4 (25) | 17.6 (8.5) |
| f | 8.3 | 16.7 | 1 | 0 | 3720 (2.2) | 45.9 (1.4) | 5.0 (22) | 2.0 (12) | 18.9 (7.8) |
| f | 8.3 | 16.7 | 1.5 | 0 | 3750 (2.7) | 46.5 (0.9) | 4.2 (27) | 2.0 (8.0) | 17.5 (13) |
| f | 8.3 | 16.7 | 4 | 0 | 3790 (1.5) | 46.9 (0.8) | 4.2 (8.8) | 1.8 (6.1) | 19.4 (5.9) |
| f | 8.3 | 16.7 | 6 | 0 | 3820 (1.7) | 49.4 (2.3) | 3.8 (17) | 2.0 (8.7) | 17.3 (2.3) |
| f | 16.7 | 8.3 | 0 | 0 | 3970 (3.7) | 41.9 (0.8) | 3.8 (16) | 2.5 (22) | 13.3 (9.2) |
| f | 16.7 | 8.3 | 1 | 0 | 3690 (2.4) | 44.4 (0.9) | 3.8 (15) | 1.9 (13) | 15.5 (16) |
| f | 16.7 | 8.3 | 1.5 | 0 | 3690 (2.7) | 45.8 (0.6) | 3.5 (8.7) | 2.1 (13) | 15.3 (6.6) |
| f | 16.7 | 8.3 | 4 | 0 | 3700 (1.6) | 49.2 (0.49 | 3.7 (1.0) | 1.8 (9.9) | 14.9 (19) |
| f | 16.7 | 8.3 | 6 | 0 | 3710 (1.3) | 51.9 (0.5) | 3.8 (3.2) | 1.8 (7.5) | 16.6 (4.0) |
| f | 25 | 0 | 0 | 0 | 3980 (3.2) | 39.2 (0.9) | 3.9 (6.0) | 2.1 (18) | 13.5 (6.5) |
| f | 25 | 0 | 0 | 0.5 | 3710 (1.9) | 46.6 (0.7) | 3.2 (5.5) | 1.7 (4.4) | 12.4 (6.2) |
| f | 25 | 0 | 0 | 1 | 3640 (5.7) | 46.1 (1.5) | 3.1 (9.2) | 1.8 (8.1) | 14.7 (9.3) |
| f | 25 | 0 | 0 | 1.5 | 3620 (3.1) | 46.2 (1.6) | 2.9 (4.5) | 1.6 (5.8) | 14.1 (3.6) |
| f | 25 | 0 | 0.5 | 0 | 3850 (2.1) | 43.1 (1.1) | 3.5 (16) | n.d. | 14.9 (11) |
| f | 25 | 0 | 1 | 0 | 3640 (2.8) | 46.6 (0.9) | 3.3 (6.5) | n.d. | 14.1 (9.9) |
| f | 25 | 0 | 1 | 0.5 | 3810 (2.4) | 49.5 (0.8) | 3.3 (4.6) | 1.6 (8.5) | 12.8 (6.2) |
| f | 25 | 0 | 1 | 1 | 3740 (1.4) | 49.1 (0.7) | 3.2 (3.4) | 1.8 (6.6) | 13.3 (4.2) |
| f | 25 | 0 | 1 | 1.5 | 3390 (3.6) | 52.8 (0.7) | 4.4 (8.7) | 1.7 (6.8) | 18.6 (7.8) |
| f | 25 | 0 | 1.5 | 0 | 3790 (2.5) | 49.4 (1.1) | 3.3 (11) | n.d. | 13.0 (9.8) |
| f | 25 | 0 | 2 | 0.5 | 3610 (2.7) | 51.4 (0.9) | 3.4 (5.4) | 1.7 (6.5) | 8.6 (8.5) |
| f | 25 | 0 | 2 | 1 | 3490 (4.5) | 52.8 (0.7) | 3.6 (3.3) | 1.9 (17) | 16.7 (5.1) |
| f | 25 | 0 | 2 | 1.5 | 3570 (3.2) | 52.2 (0.9) | 3.8 (9.2) | 1.7 (9.5) | 18.4 (5.0) |
| f | 25 | 0 | 3 | 0 | 3740 (1.0) | 48.5 (0.6) | 1.6 (6.2) | 1.7 (4.8) | 13.4 (7.3) |
| f | 25 | 0 | 4 | 0 | 3770 (1.5) | 50.3 (0.7) | 3.3 (4.7) | 1.8 (12) | 14.2 (7.9) |
| c | 8.3 | 16.7 | 1 | 0 | 3740 (1.7) | 47.1 (0.8) | 3.2 (4.1) | n.d, | 8.2 (20) |
| c | 8.3 | 16.7 | 1.5 | 0 | 3820 (2.0) | 48.0 (0.8) | 3.2 (5.5) | 1.8 (10) | 9.3 (6.7) |
| c | 16.7 | 8.3 | 0 | 0 | 3910 (1.2) | 44.3 (0.9) | 2.9 (5.8) | 2.3 (23) | 8.8 (6.2) |
| c | 16.7 | 8.3 | 1 | 0 | 3800 (2.7) | 45.4 (0.8) | 3.1 (5.0) | n.d | 8.0 (16) |
| c | 16.7 | 8.3 | 1.5 | 0 | 3830 (2.3) | 46.0 (0.9) | 3.1 (2.8) | n.d | 8.6 (18) |
| c | 25 | 0 | 0.5 | 0 | 3810 (2.0) | 41.0 (1.9) | 2.8 (4.3) | n.d | 6.7 (15) |
| c | 25 | 0 | 1 | 0 | 3840 (1.6) | 44.8 (0.7) | 2.9 (5.3) | n.d | 8.6 (9.5) |
| c | 25 | 0 | 1.5 | 0 | 3840 (2.4) | 46.2 (1.3) | 3.0 (1.5) | n.d | 8.2 (9.1) |
| c | 25 | 0 | 1 | 0.5 | 3780 (0.6) | 42.5 (0.9) | 3.0 (3.5) | 1.9 (17) | 14.2 (7.2) |
| c | 25 | 0 | 0 | 1 | 3560 (1.7) | 43.1 (1.0) | 3.4 (4.1) | 1.9 (14) | 7.8 (16) |
| c | 25 | 0 | 1 | 1 | 3520 (3.0) | 44.7 (0.6) | 3.2 (3.7) | 1.8 (11) | 8.5 (7.3) |
| c | 25 | 0 | 1 | 1.5 | 3580 (3.0) | 44.9 (2.3) | 3.1 (5.6) | 1.7 (7.1) | 7.8 (20) |
| c | 25 | 0 | 3 | 0 | 3890 (1.2) | 44.3 (0.8) | 3.0 (5.4) | 1.8 (6.1) | 8.9 (8.0) |
| c | 25 | 0 | 4 | 0 | 3810 (0.9) | 44.7 (0.5) | 3.0 (1.7) | 2.0 (22) | 8.8 (3.2) |
| SBP | Impact Modifier | Tensile Modulus | Tensile Strength | Elongation at Break | Impact (Charpy) | ||
|---|---|---|---|---|---|---|---|
| Type | Type | % | MPa | MPa | % | Notched kJm−2 | Unnotched kJm−2 |
| f | core-shell | 3.75 | 3410 (1.2) | 40.8 (0.8) | 3.9 (3.8) | 1.8 (9.1) | 14.9 (8.3) |
| f | core-shell | 7.5 | 3170 (1.9) | 39.2 (1.7) | 3.8 (5.4) | 2.2 (20) | 15.5 (5.0) |
| f | core-shell | 11.25 | 2860 (0.8) | 35.7 (0.5) | 5.1 (21) | 2.4 (12) | 16.8 (12) |
| f | core-shell | 15 | 2660 (1.9) | 32.0 (2.8) | 6.2 (13) | 2.9 (5.2) | 19.2 (7.7) |
| f | polyolefinic | 3.75 | 2920 (2.6) | 32.1 (1.0) | 3.8 (8.7) | 2.6 (16) | 8.4 (4.9) |
| f | polyolefinic | 7.5 | 2390 (1.9) | 29.0 (1.1) | 9.7 (8.3) | n.d. | 18.4 (17) |
| c | polyolefinic | 3.75 | 2810 (1.0) | 31.0 (1.3) | 4.3 (7.6) | 3.0 (7.4) | 8.2 (3.3) |
| c | polyolefinic | 7.5 | 2790 (0.9) | 31.8 (0.6) | 8.8 (9.1) | 2.3 (14) | 14.8 (12) |
| SBP | Talc | Additives | Tensile Modulus | Tensile Strength | Elongation at Break | Impact (Charpy) | |||
|---|---|---|---|---|---|---|---|---|---|
| Type 1 | % | c. a. 2 | a. p. 2 | MPa | MPa | % | Notched kJm−2 | Unnotched kJm−2 | |
| PLA–PBS (4:3) composites | |||||||||
| - | 0 | 16 | 0 | 0 | 3200 (2.4) | 47.2 (1.2) | 6.2 (24) | 3.0 (14) | 38.8 (11) |
| f | 8 | 8 | 1 | 0 | 2960 (1.2) | 44.4 (1.0) | 6.4 (22) | 3.1 (1.3) | 24.0 (6.2) |
| f | 8 | 8 | 1.5 | 0 | 2940 (1.5) | 44.4 (0.8) | 5.7 (14) | 3.1 (2.7) | 23.8 (8.7) |
| f | 8 | 8 | 4 | 0 | 3020 (0.8) | 44.3 (1.3) | 4.0 (3.9) | 2.4 (20) | 21.8 (8.6) |
| f | 8 | 8 | 6 | 0 | 3200 (1.1) | 46.5 (1.1) | 4.4(3.1) | 2.4 (24) | 20.9 (11) |
| f | 16 | 0 | 1 | 0 | 2670 (1.5) | 41.8 (1.3) | 5.5 (25) | 2.9 (2.4) | 18.8 (15) |
| f | 16 | 0 | 1 | 0.5 | 2750 (2.2) | 41.6 (0.8) | 4.1 (4.1) | 2.0 (22) | 16.0 (12) |
| f | 16 | 0 | 1.5 | 0 | 2710 (1.2) | 44.0 (0.9) | 5.0 (13) | 2.8 (10) | 18.6 (7.8) |
| c | 8 | 8 | 1 | 0 | 2950 (1.3) | 43.7 (1.5) | 4.2 (9.2) | 3.1 (2.9) | 13.4 (8.0) |
| c | 8 | 8 | 1.5 | 0 | 3010 (1.2) | 43.9 (1.0) | 4.3 (7.3) | 3.1 (1.8) | 12.3 (15) |
| c | 8 | 8 | 4 | 0 | 3600 (0.6) | 41.6 (1.4) | 3.2 (4.1) | 2.4 (22) | 13.2 (6.4) |
| c | 16 | 0 | 1 | 0 | 2720 (1.6) | 41.6 (0.5) | 4.3 (6.7) | 3.0 (2.5) | 11.0 (11) |
| c | 16 | 0 | 1 | 0.5 | 2750 (0.9) | 38.1 (1.4) | 3.4 (2.0) | 2.4 (21) | 10.4 (13) |
| PLA–PBS (3:4) composites | |||||||||
| - | 0 | 16 | 0 | 0 | 2760 (1.2) | 40.8 (1.7) | 4.5 (8.5) | 3.1 (2.8) | 40.5 (20) |
| f | 8 | 8 | 1 | 0 | 2470 (1.3) | 39.3 (0.4) | 5.8 (7.0) | 2.5 (20) | 27.4 (9.0) |
| f | 16 | 0 | 1 | 0 | 2260 (0.7) | 37.0 (0.6) | 6.0 (12) | 2.6 (16) | 21.1 (14) |
| f | 16 | 0 | 1 | 0.5 | 2730 (1.3) | 41.5 (1.3) | 4.0 (3.9) | 1.7 (6.2) | 16.1 (7.6) |
| f | 16 | 0 | 4 | 0 | 2740 (1.4) | 44.4 (0.9) | 4.6 (3.0) | 2.5 (19) | 17.3 (11) |
| c | 8 | 8 | 1 | 0 | 2480 (1.6) | 38.1 (1.1) | 4.5 (4.8) | 2.9 (8.5) | 16.0 (10) |
| c | 16 | 0 | 1 | 0 | 2250 (0.2) | 35.6 (1.5) | 4.6 (6.1) | 2.7 (12) | 14.7 (18) |
| c | 16 | 0 | 1 | 0.5 | 2680 (0.6) | 37.3 (1.6) | 3.4 (4.0) | 2.4 (20) | 10.4 (24) |
| SBP | Additives | K | ||
|---|---|---|---|---|
| % | c. a. 1 | a. p. 1 | Fine | Coarse |
| PLA–PBS (9:1) | ||||
| 25 | 0.0 | 0.0 | 0.85 | |
| 25 | 0.5 | 0.0 | 0.67 | 0.77 |
| 25 | 1.0 | 0.0 | 0.51 | 0.59 |
| 25 | 1.5 | 0.0 | 0.38 | 0.52 |
| 25 | 0.0 | 0.5 | 0.51 | |
| 25 | 0.0 | 1.0 | 0.53 | 0.67 |
| 25 | 0.0 | 1.5 | 0.52 | |
| 25 | 1.0 | 0.5 | 0.37 | 0.70 |
| 25 | 1.0 | 1.0 | 0.39 | 0.59 |
| 25 | 1.0 | 1.5 | 0.22 | 0.58 |
| 25 | 2.0 | 0.5 | 0.28 | |
| 25 | 2.0 | 1.0 | 0.22 | |
| 25 | 2.0 | 1.5 | 0.24 | |
| 25 | 3.0 | 0.0 | 0.42 | 0.61 |
| 25 | 4.0 | 0.0 | 0.33 | 0.59 |
| PLA–PBS (4:3) | ||||
| 16 | 1.0 | 0.0 | 0.53 | 0.54 |
| 16 | 1.0 | 0.5 | 0.54 | 0.80 |
| 16 | 1.5 | 0.0 | 0.37 | |
| PLA–PBS (3:4) | ||||
| 16 | 1.0 | 0.0 | 0.66 | 0.77 |
| 16 | 1.0 | 0.5 | 0.30 | 0.63 |
| 16 | 4.0 | 0.0 | 0.07 | |
Publisher’s Note: MDPI stays neutral with regard to jurisdictional claims in published maps and institutional affiliations. |
© 2021 by the author. Licensee MDPI, Basel, Switzerland. This article is an open access article distributed under the terms and conditions of the Creative Commons Attribution (CC BY) license (https://creativecommons.org/licenses/by/4.0/).
Share and Cite
Kopitzky, R. Poly(Lactic Acid)–Poly(Butylene Succinate)–Sugar Beet Pulp Composites; Part I: Mechanics of Composites with Fine and Coarse Sugar Beet Pulp Particles. Polymers 2021, 13, 2531. https://doi.org/10.3390/polym13152531
Kopitzky R. Poly(Lactic Acid)–Poly(Butylene Succinate)–Sugar Beet Pulp Composites; Part I: Mechanics of Composites with Fine and Coarse Sugar Beet Pulp Particles. Polymers. 2021; 13(15):2531. https://doi.org/10.3390/polym13152531
Chicago/Turabian StyleKopitzky, Rodion. 2021. "Poly(Lactic Acid)–Poly(Butylene Succinate)–Sugar Beet Pulp Composites; Part I: Mechanics of Composites with Fine and Coarse Sugar Beet Pulp Particles" Polymers 13, no. 15: 2531. https://doi.org/10.3390/polym13152531
APA StyleKopitzky, R. (2021). Poly(Lactic Acid)–Poly(Butylene Succinate)–Sugar Beet Pulp Composites; Part I: Mechanics of Composites with Fine and Coarse Sugar Beet Pulp Particles. Polymers, 13(15), 2531. https://doi.org/10.3390/polym13152531