
Nanocomposites Materials of PLA Reinforced with Nanoclays Using a Masterbatch Technology: A Study of the Mechanical Performance and Its Sustainability

 ,
,  , ,
, ,  and
and 
Abstract
:
1. Introduction
2. Materials and Methods
2.1. Materials
2.2. Methods
2.2.1. Compounding Process
2.2.2. Mechanical Characterization
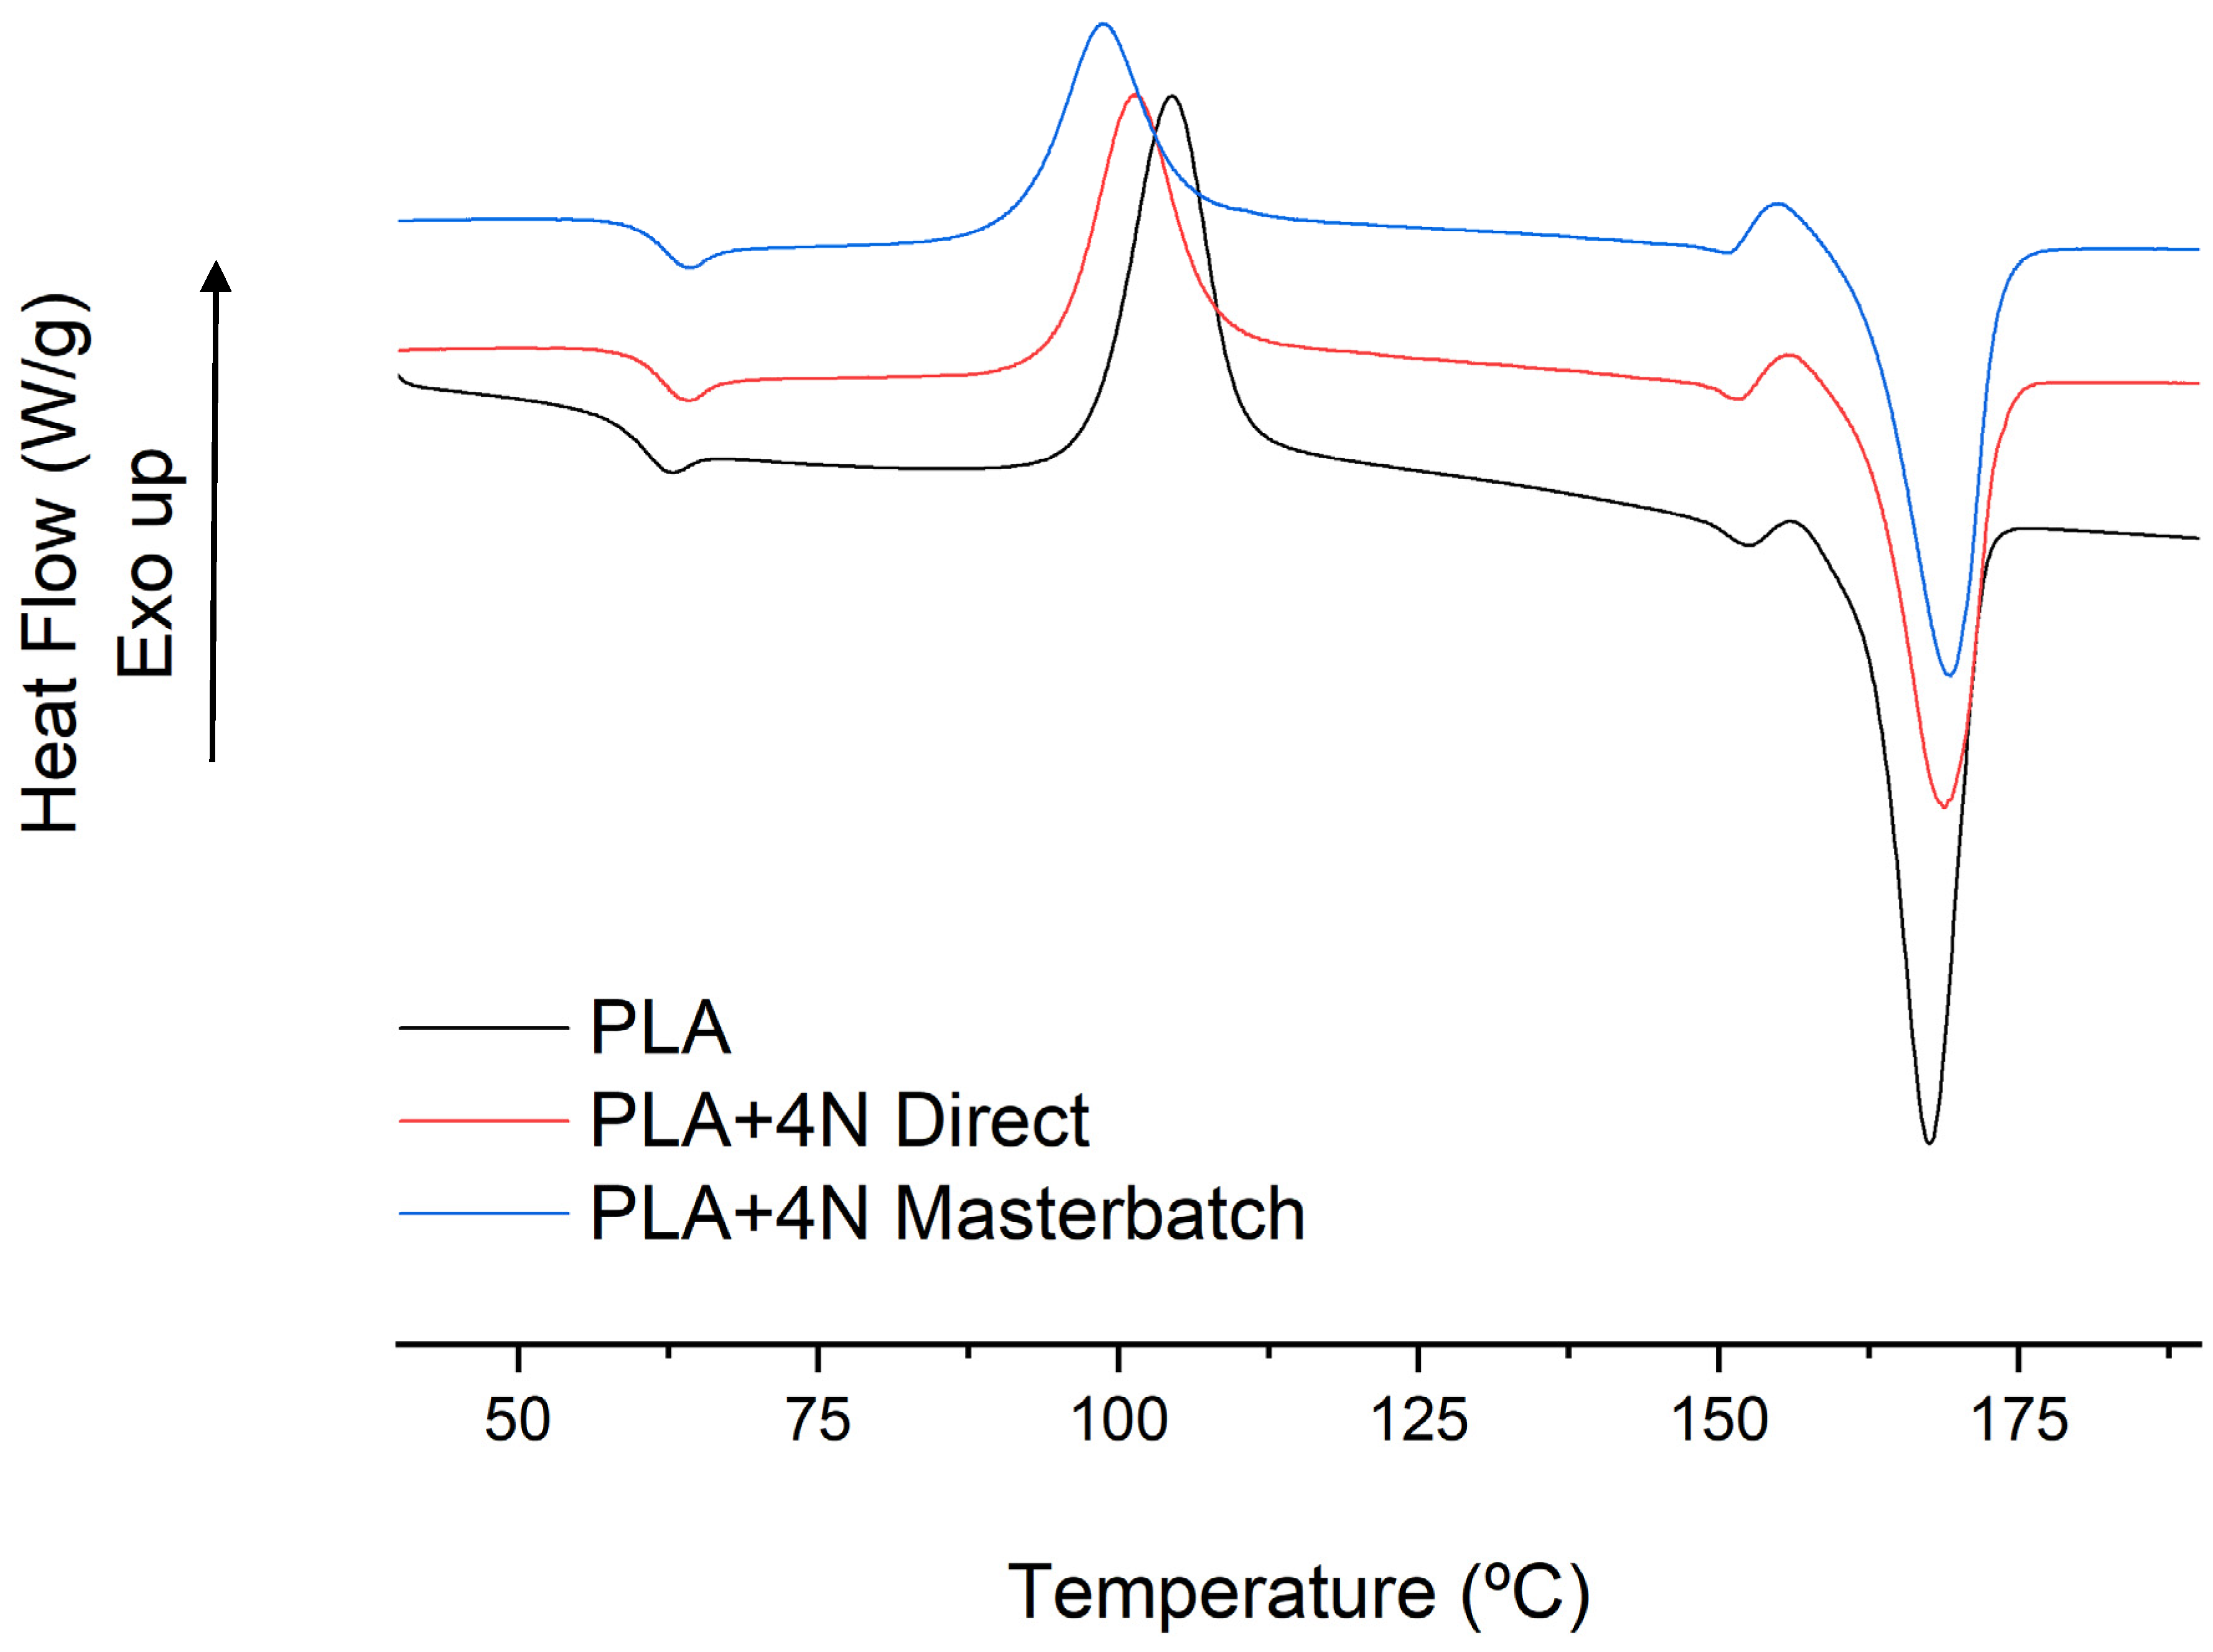
2.2.3. Thermal Behaviour
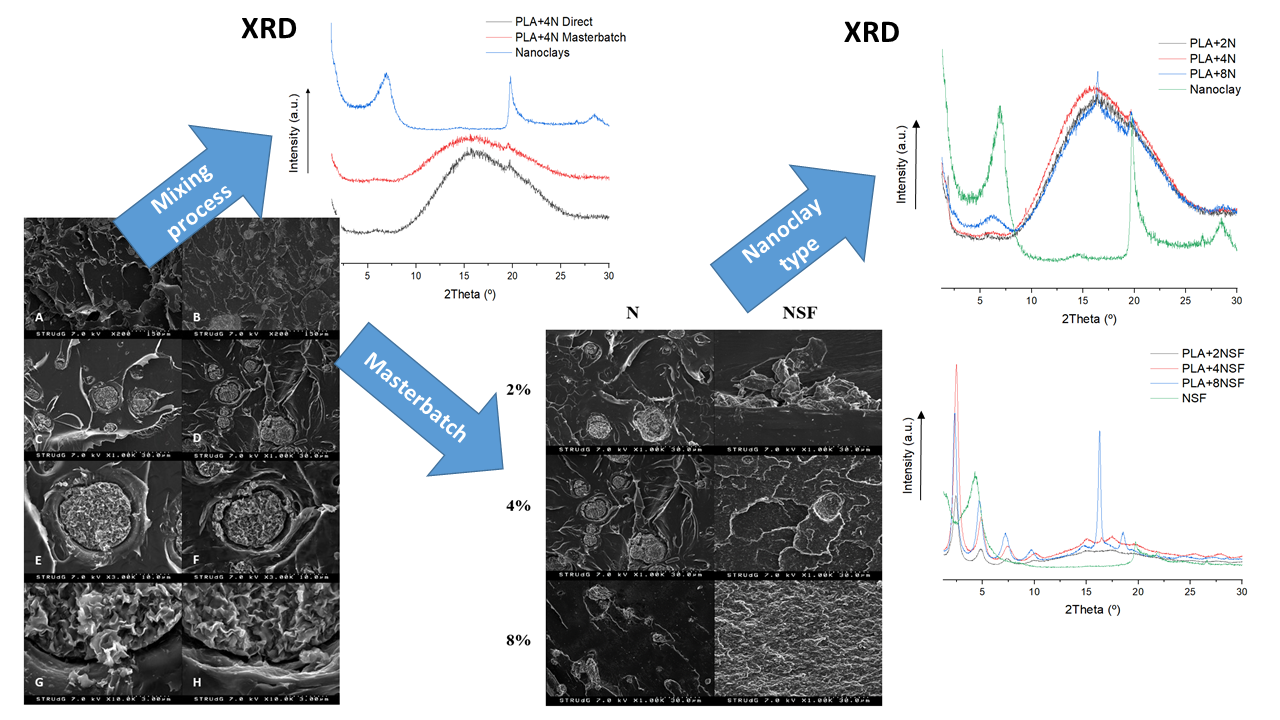
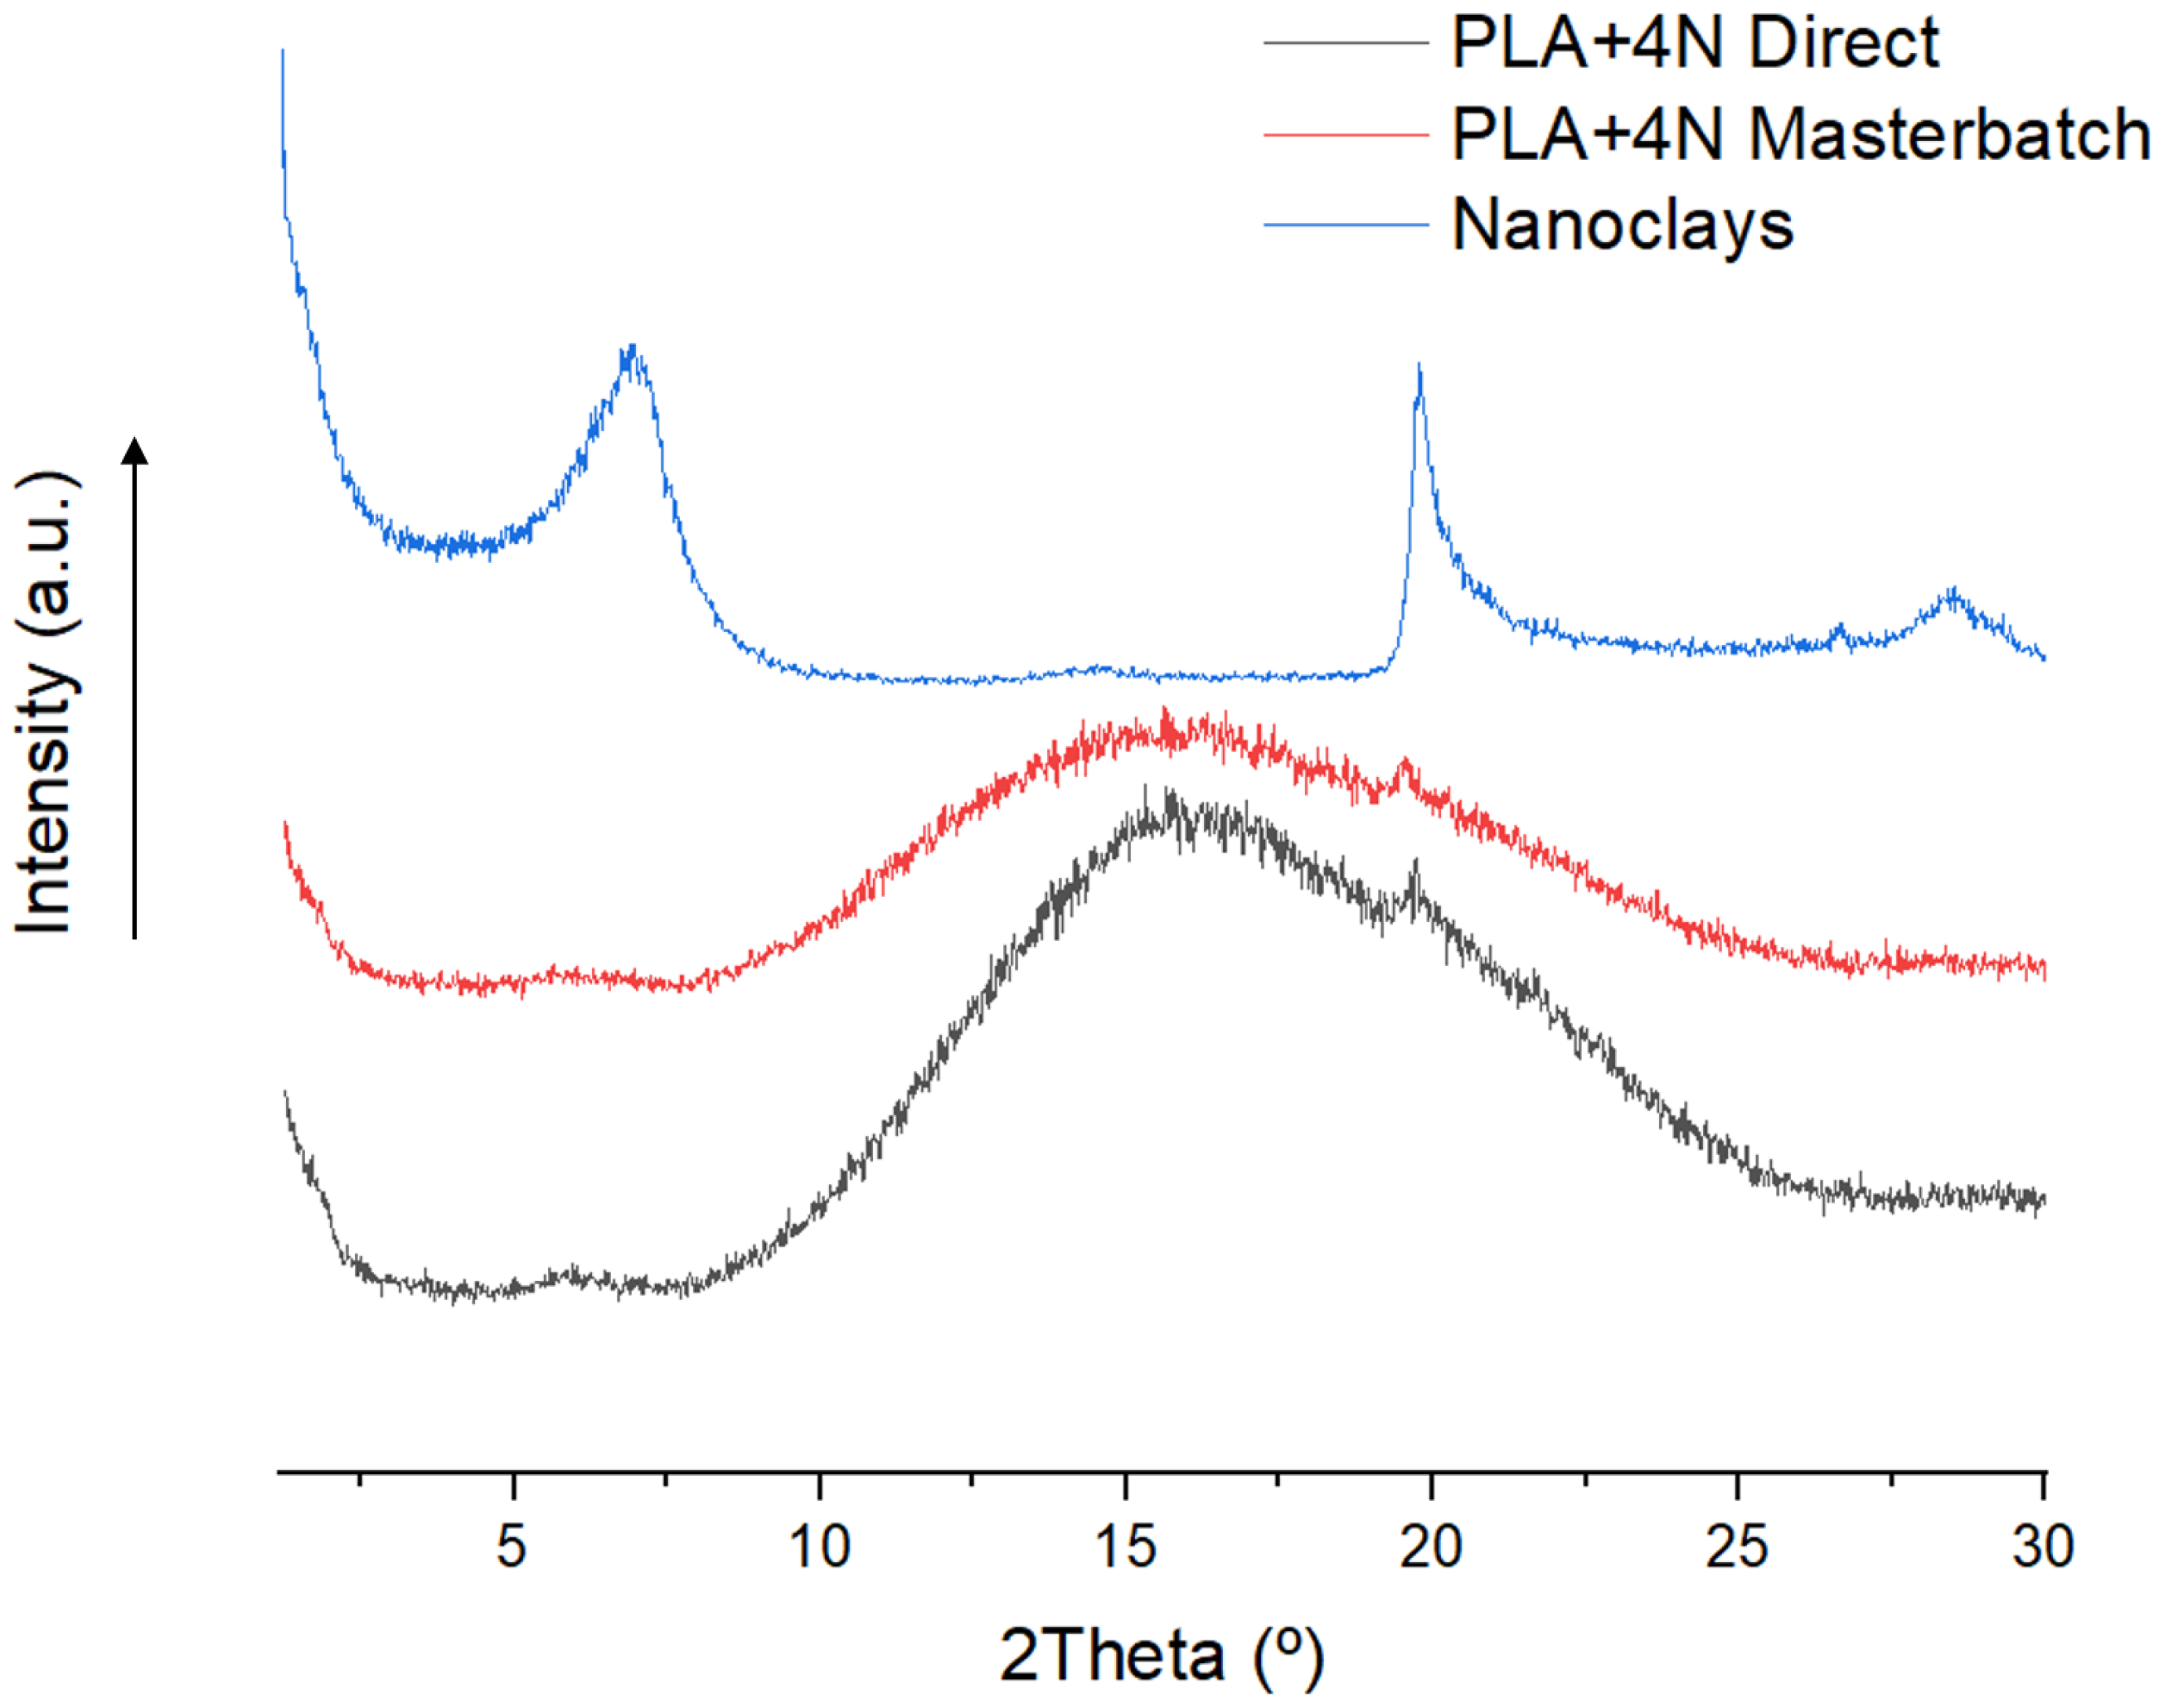
2.2.4. X-ray Diffraction (XRD)
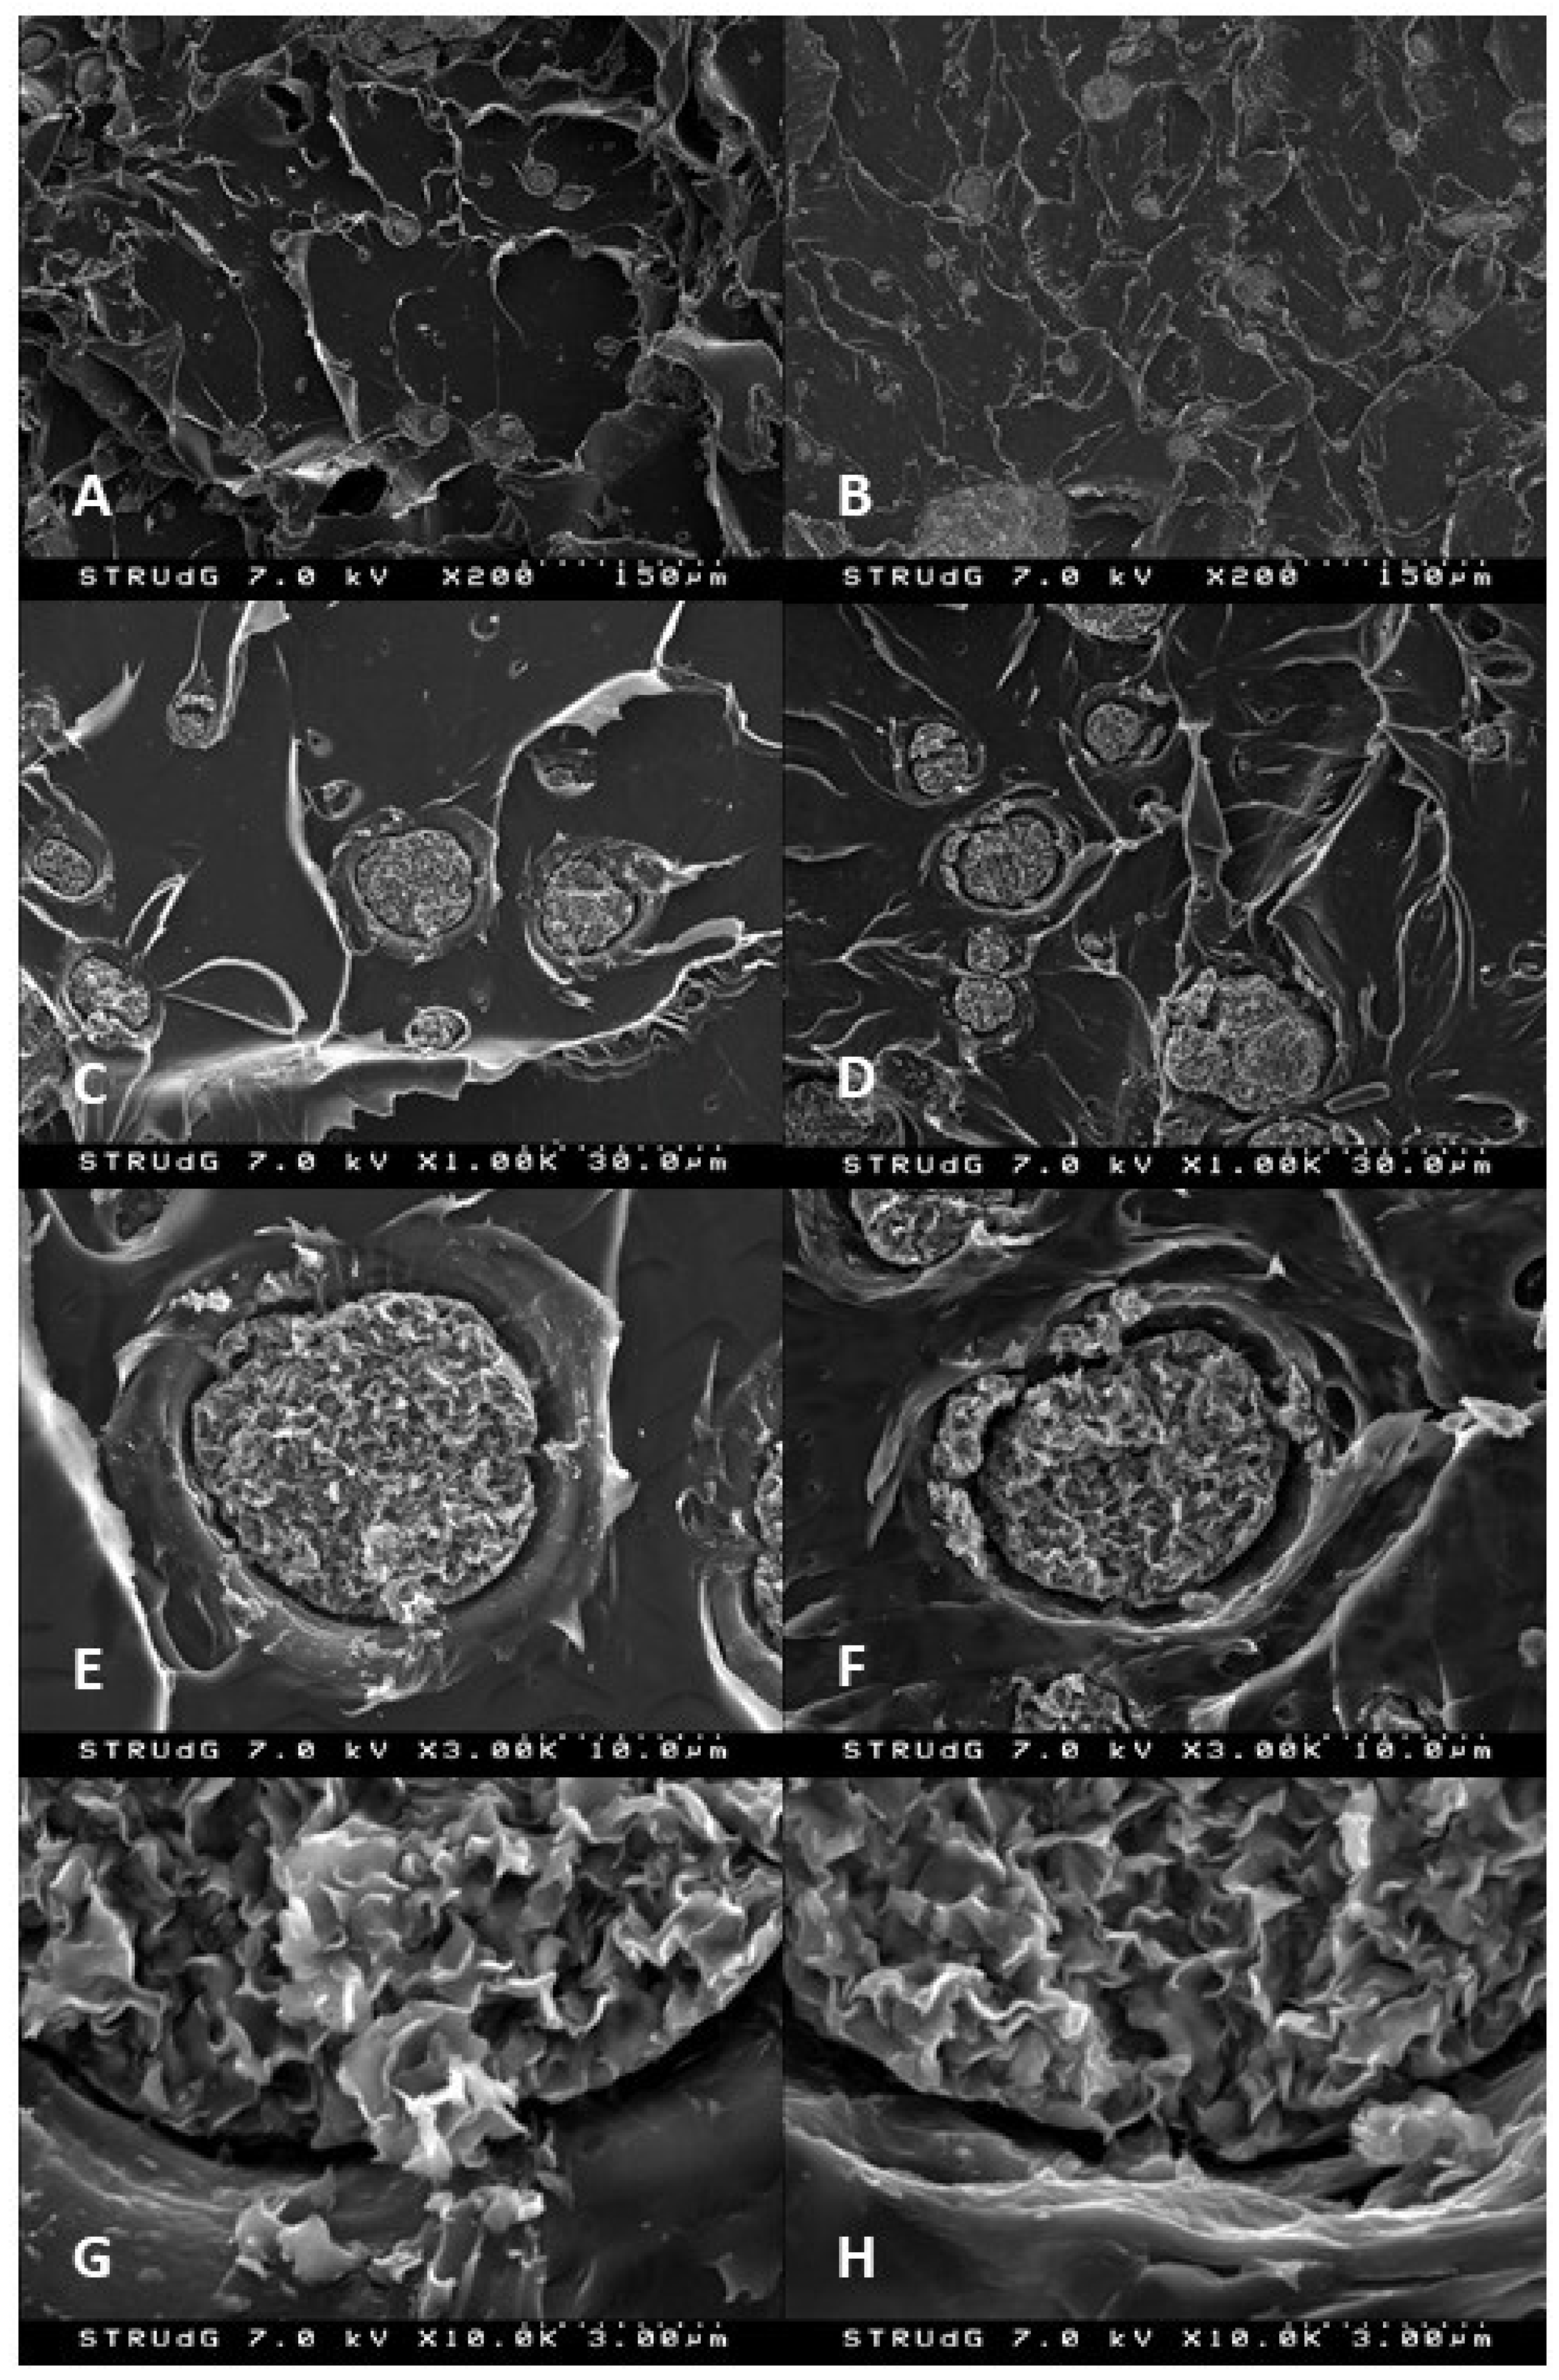
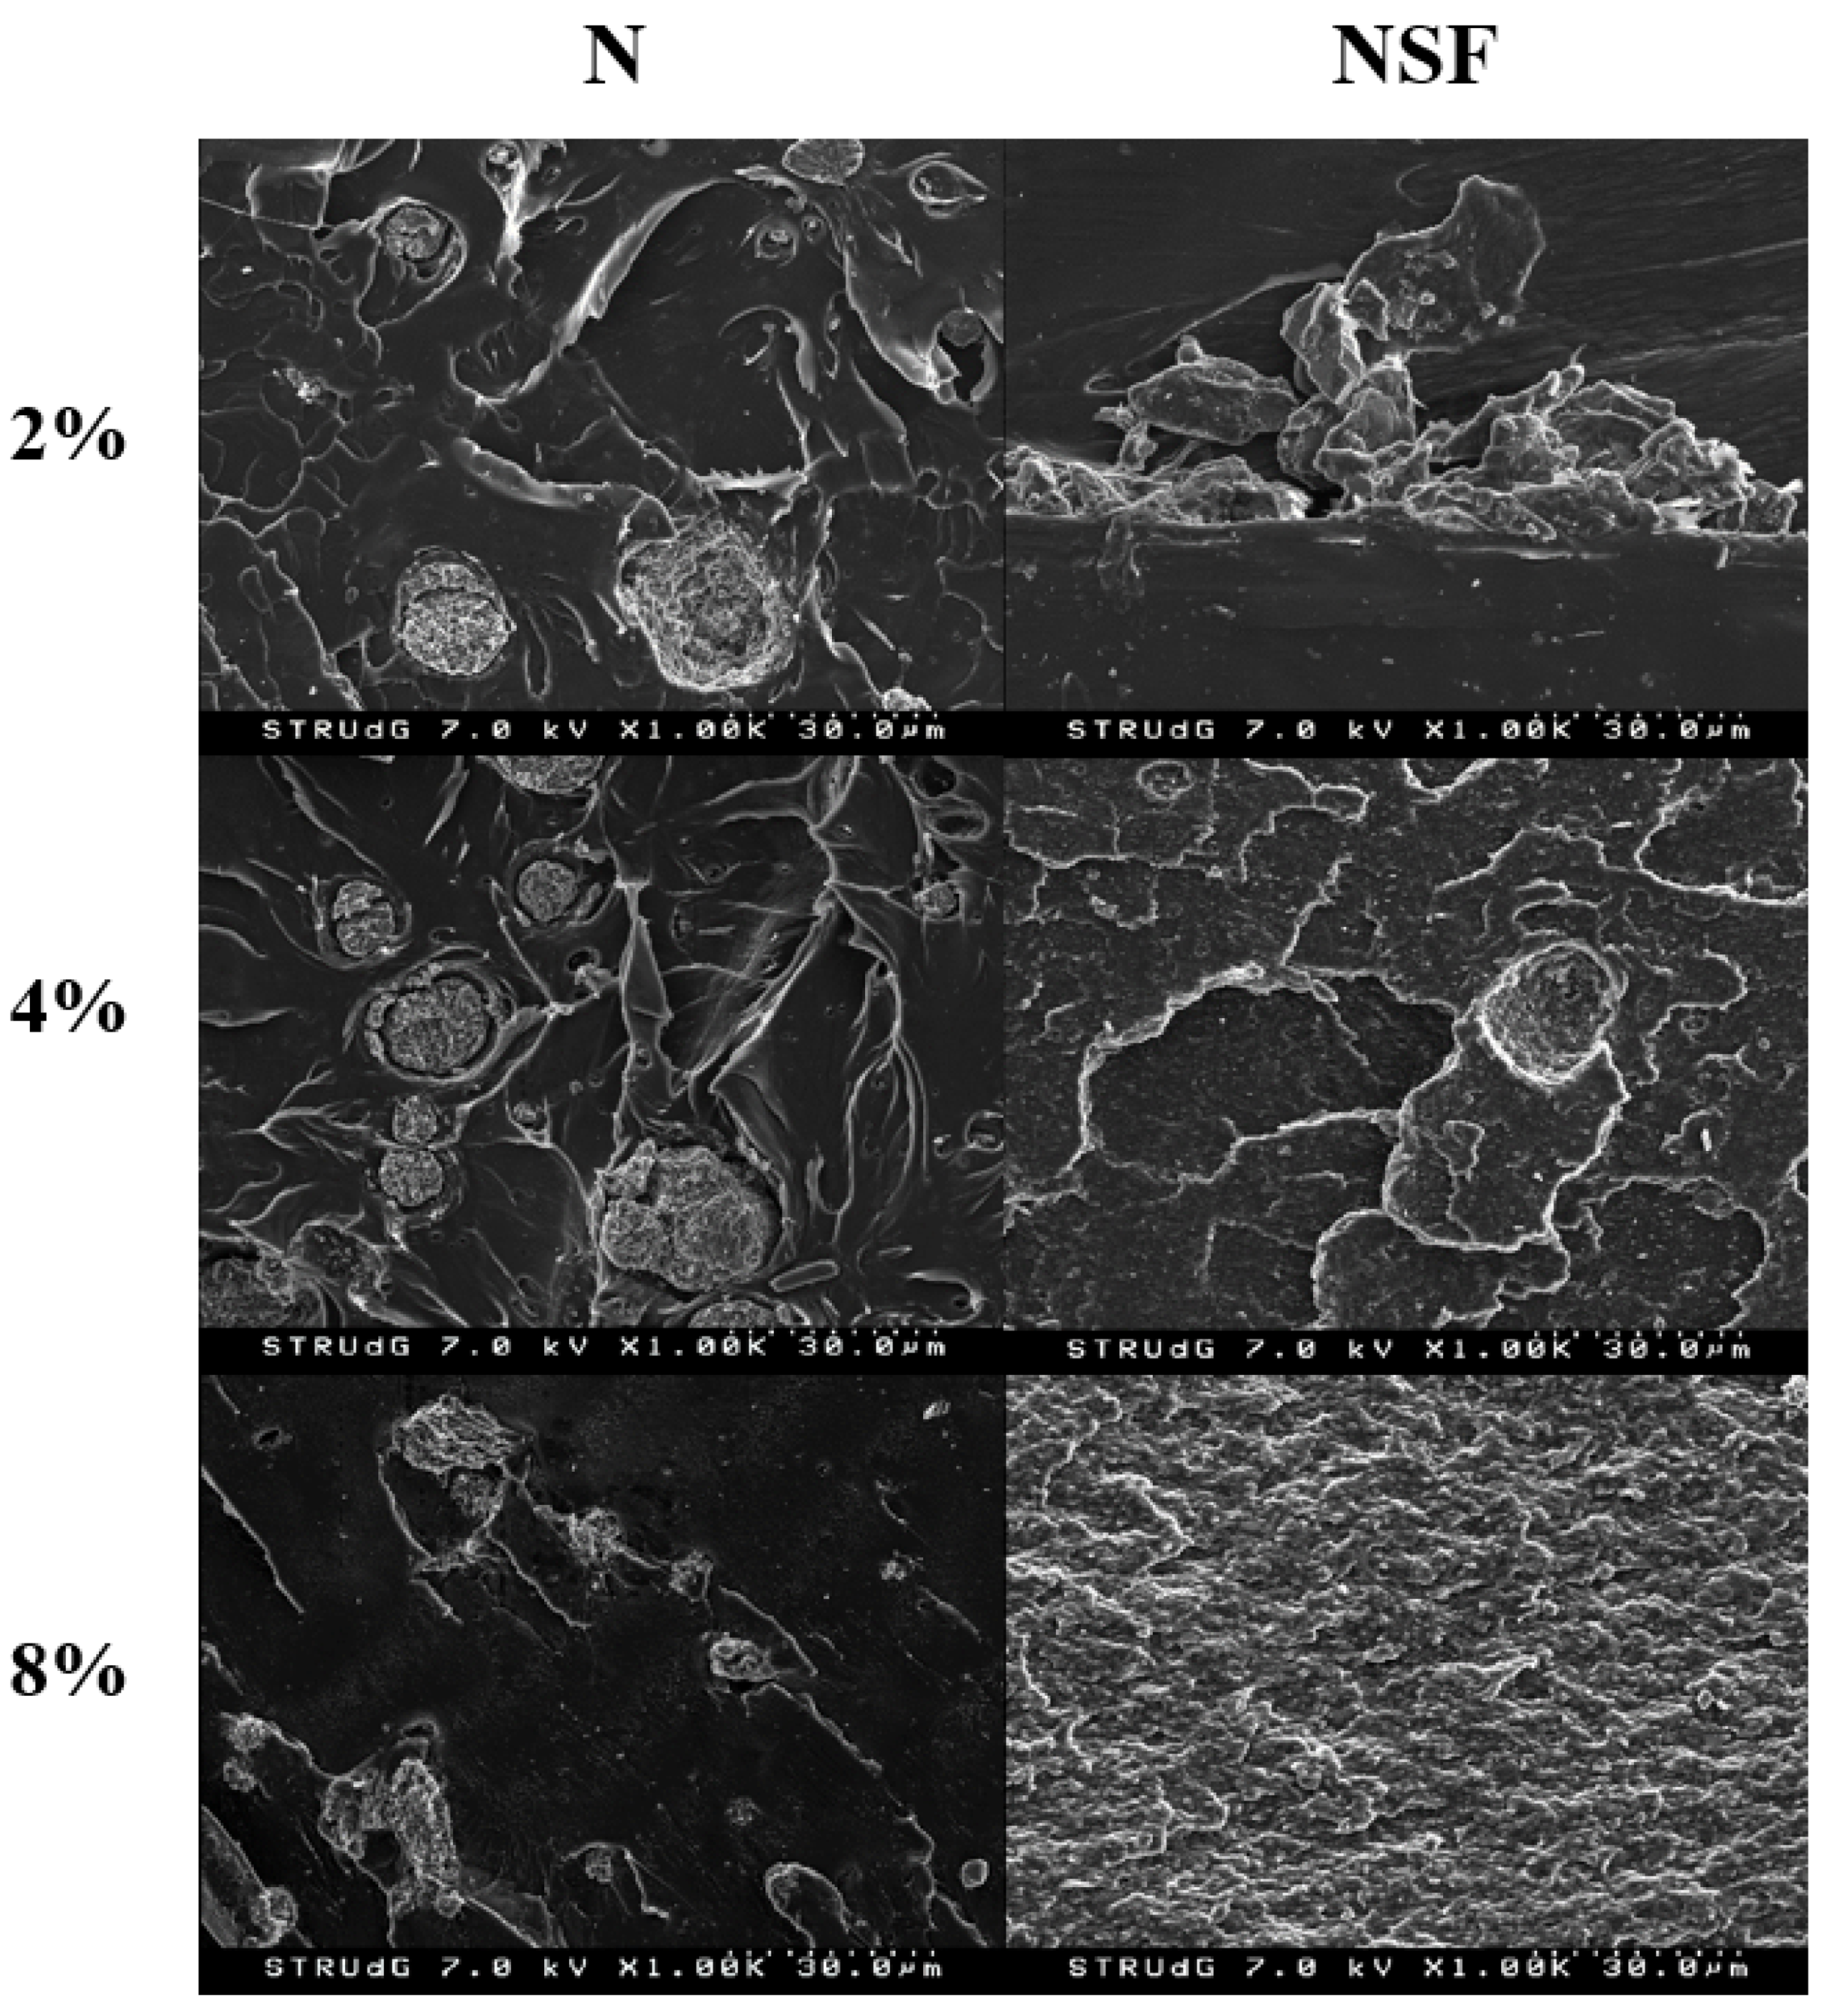
2.2.5. Scanning Electron Microscopy (SEM)
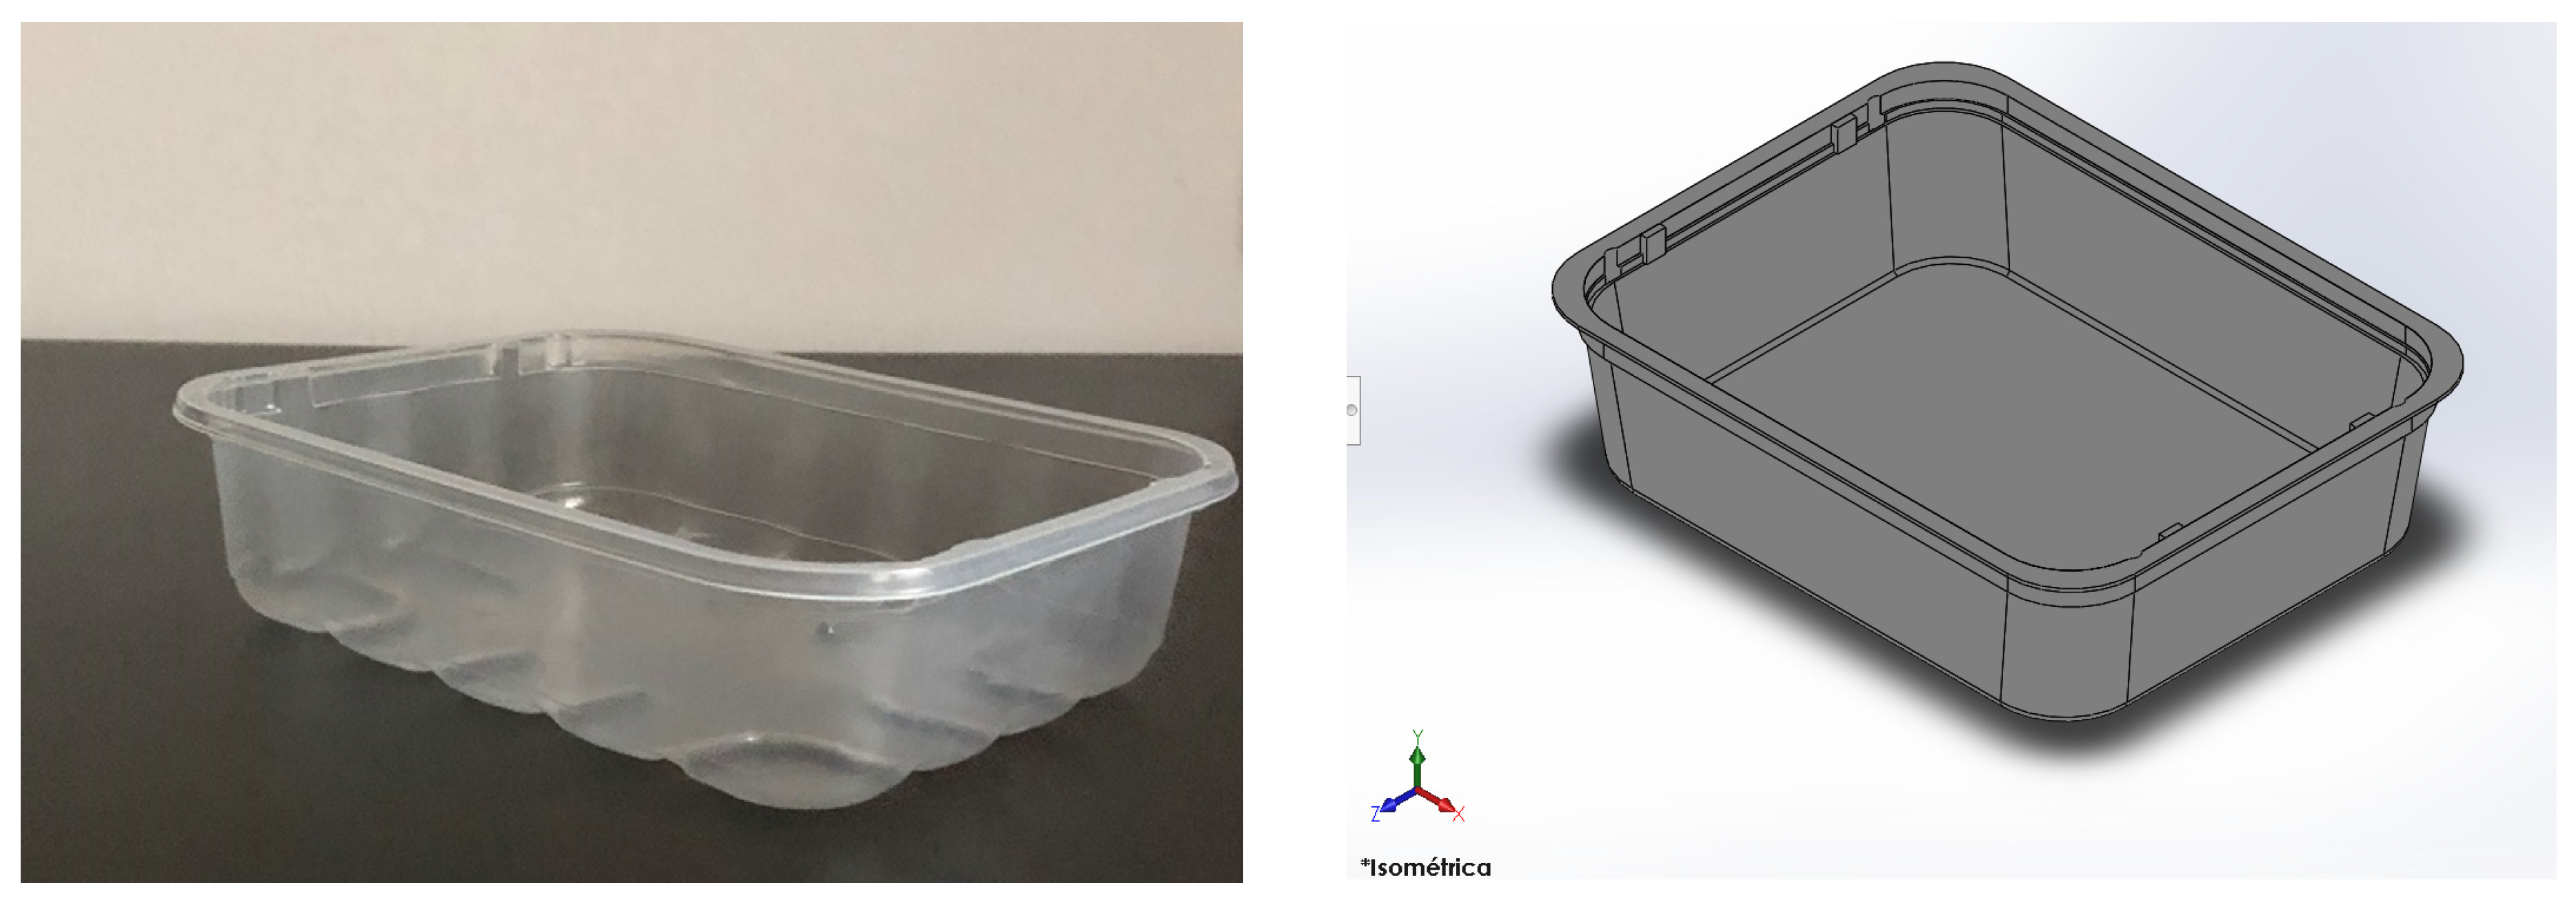
2.2.6. Sample Modeling and Evaluation
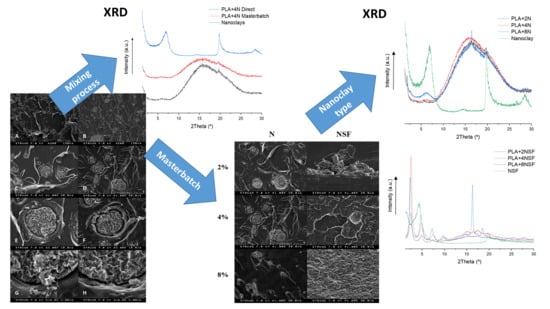
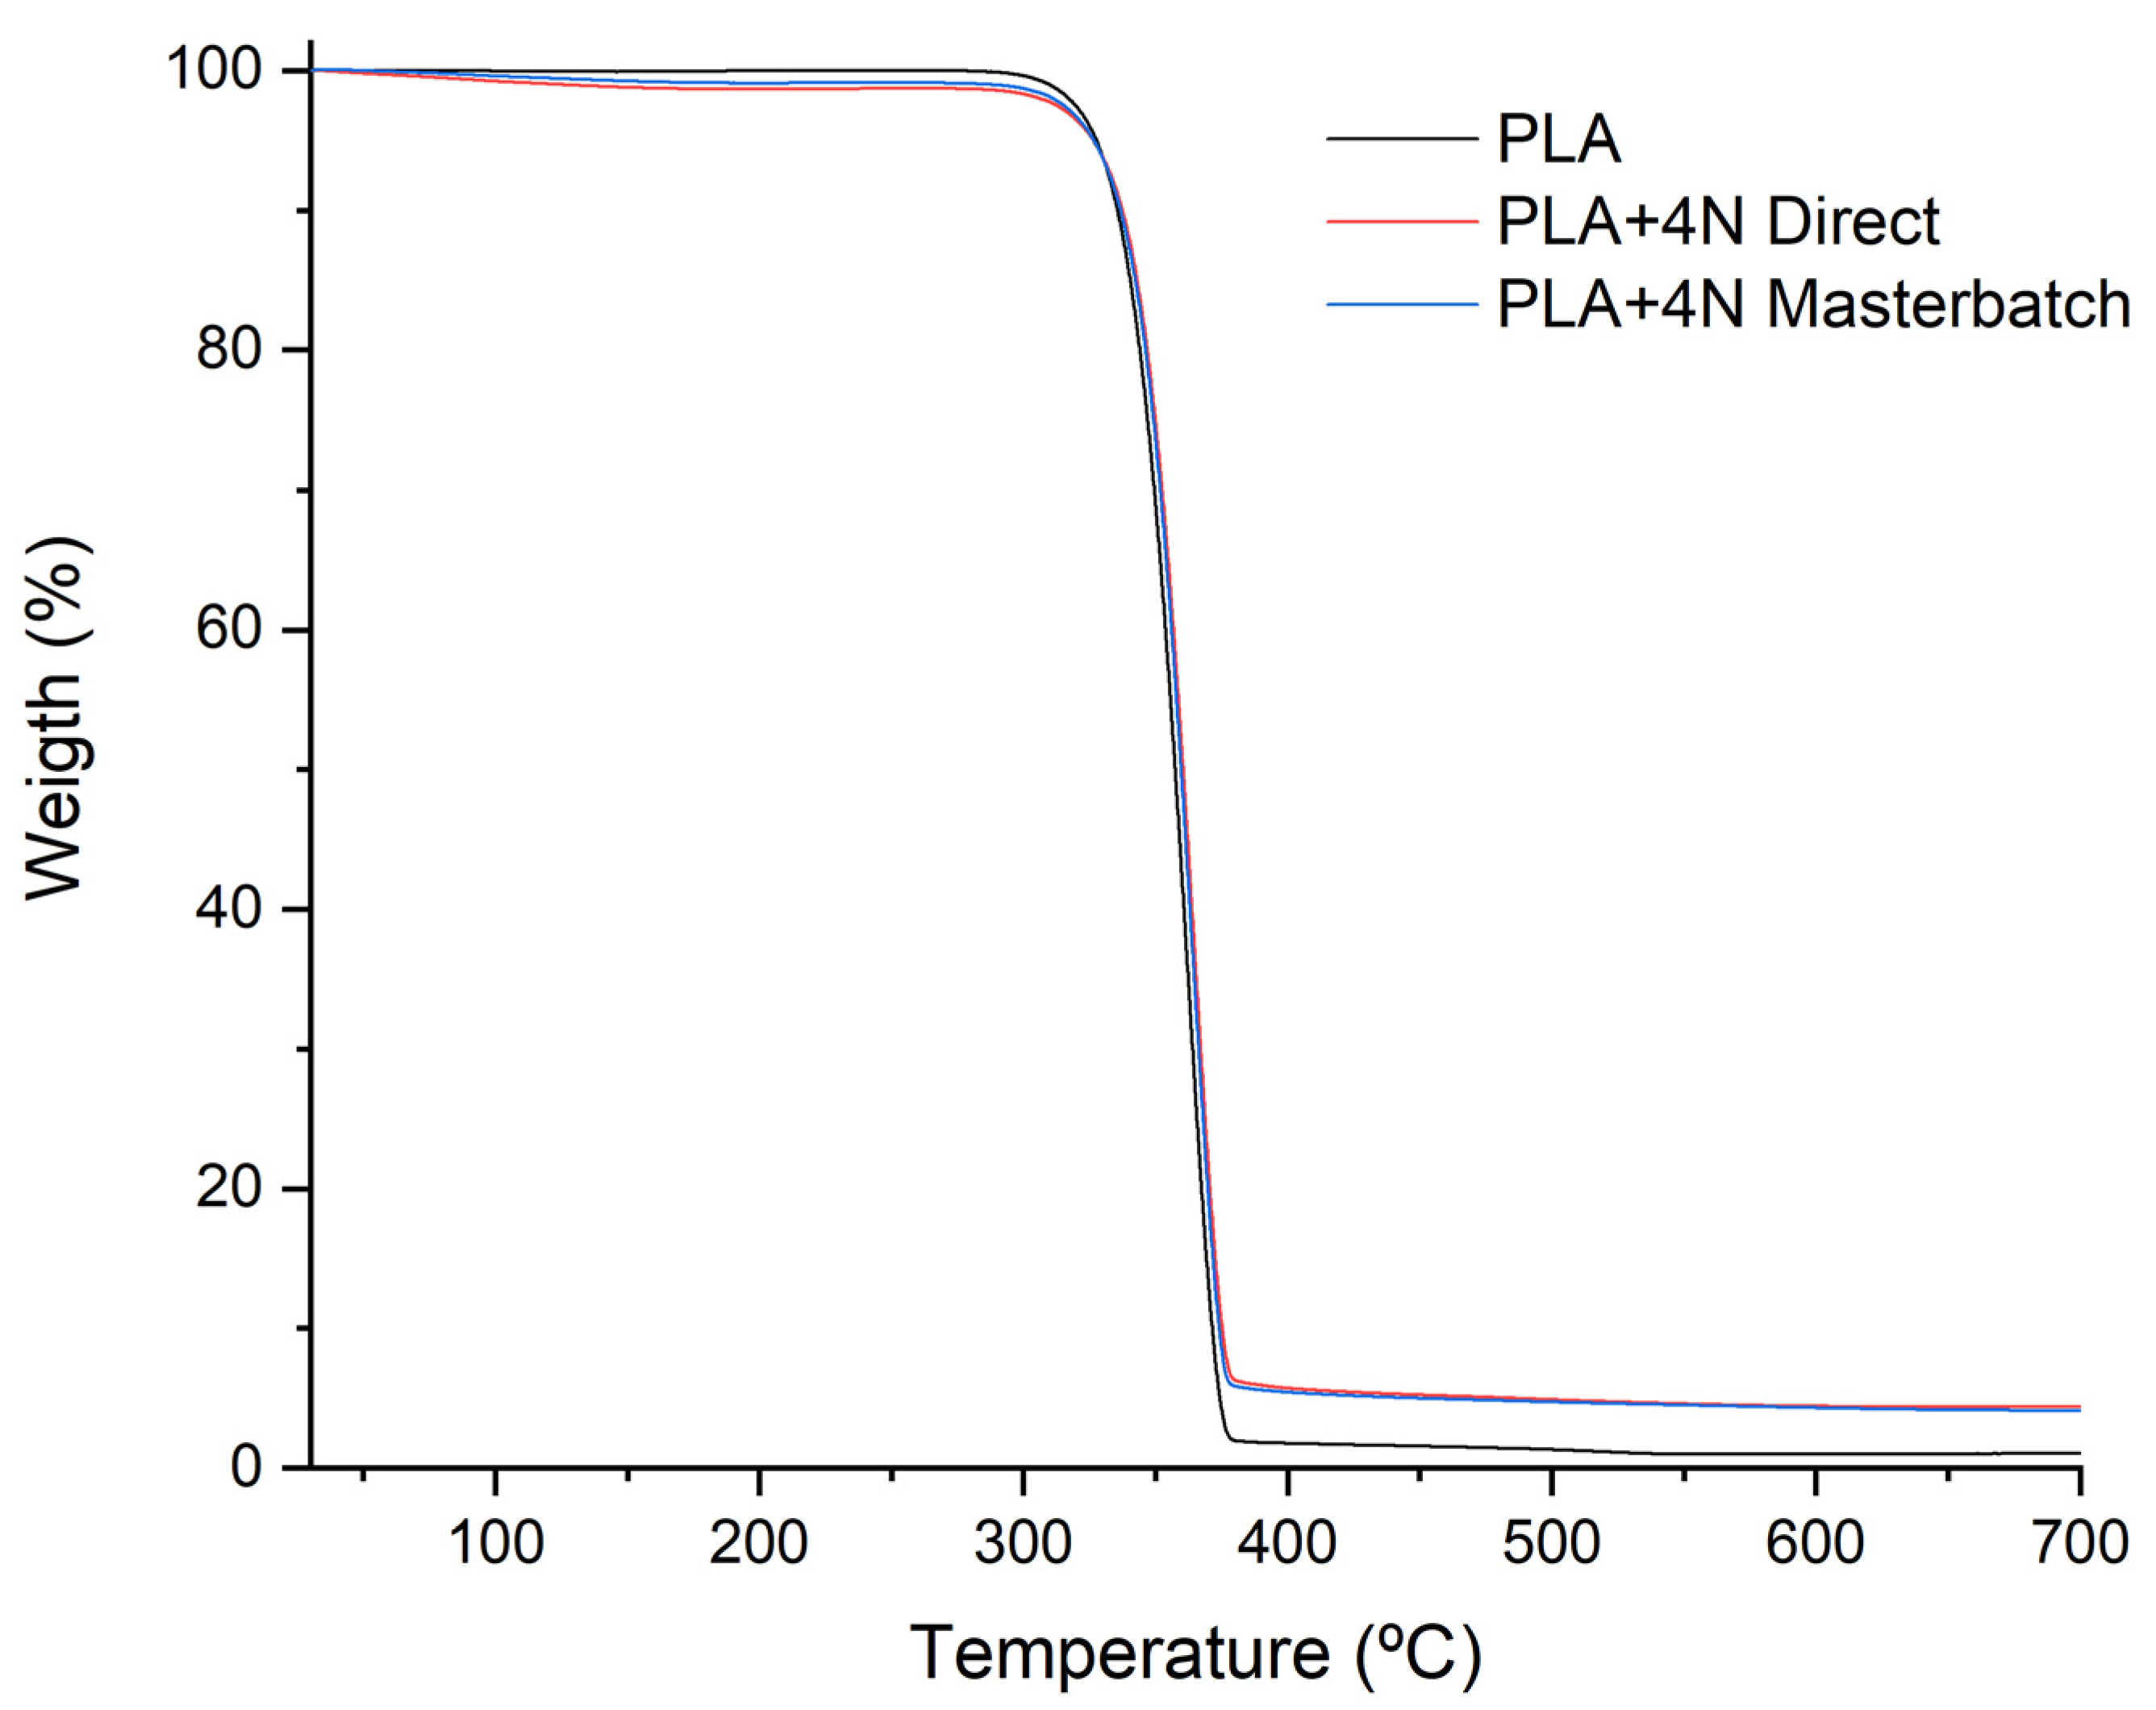
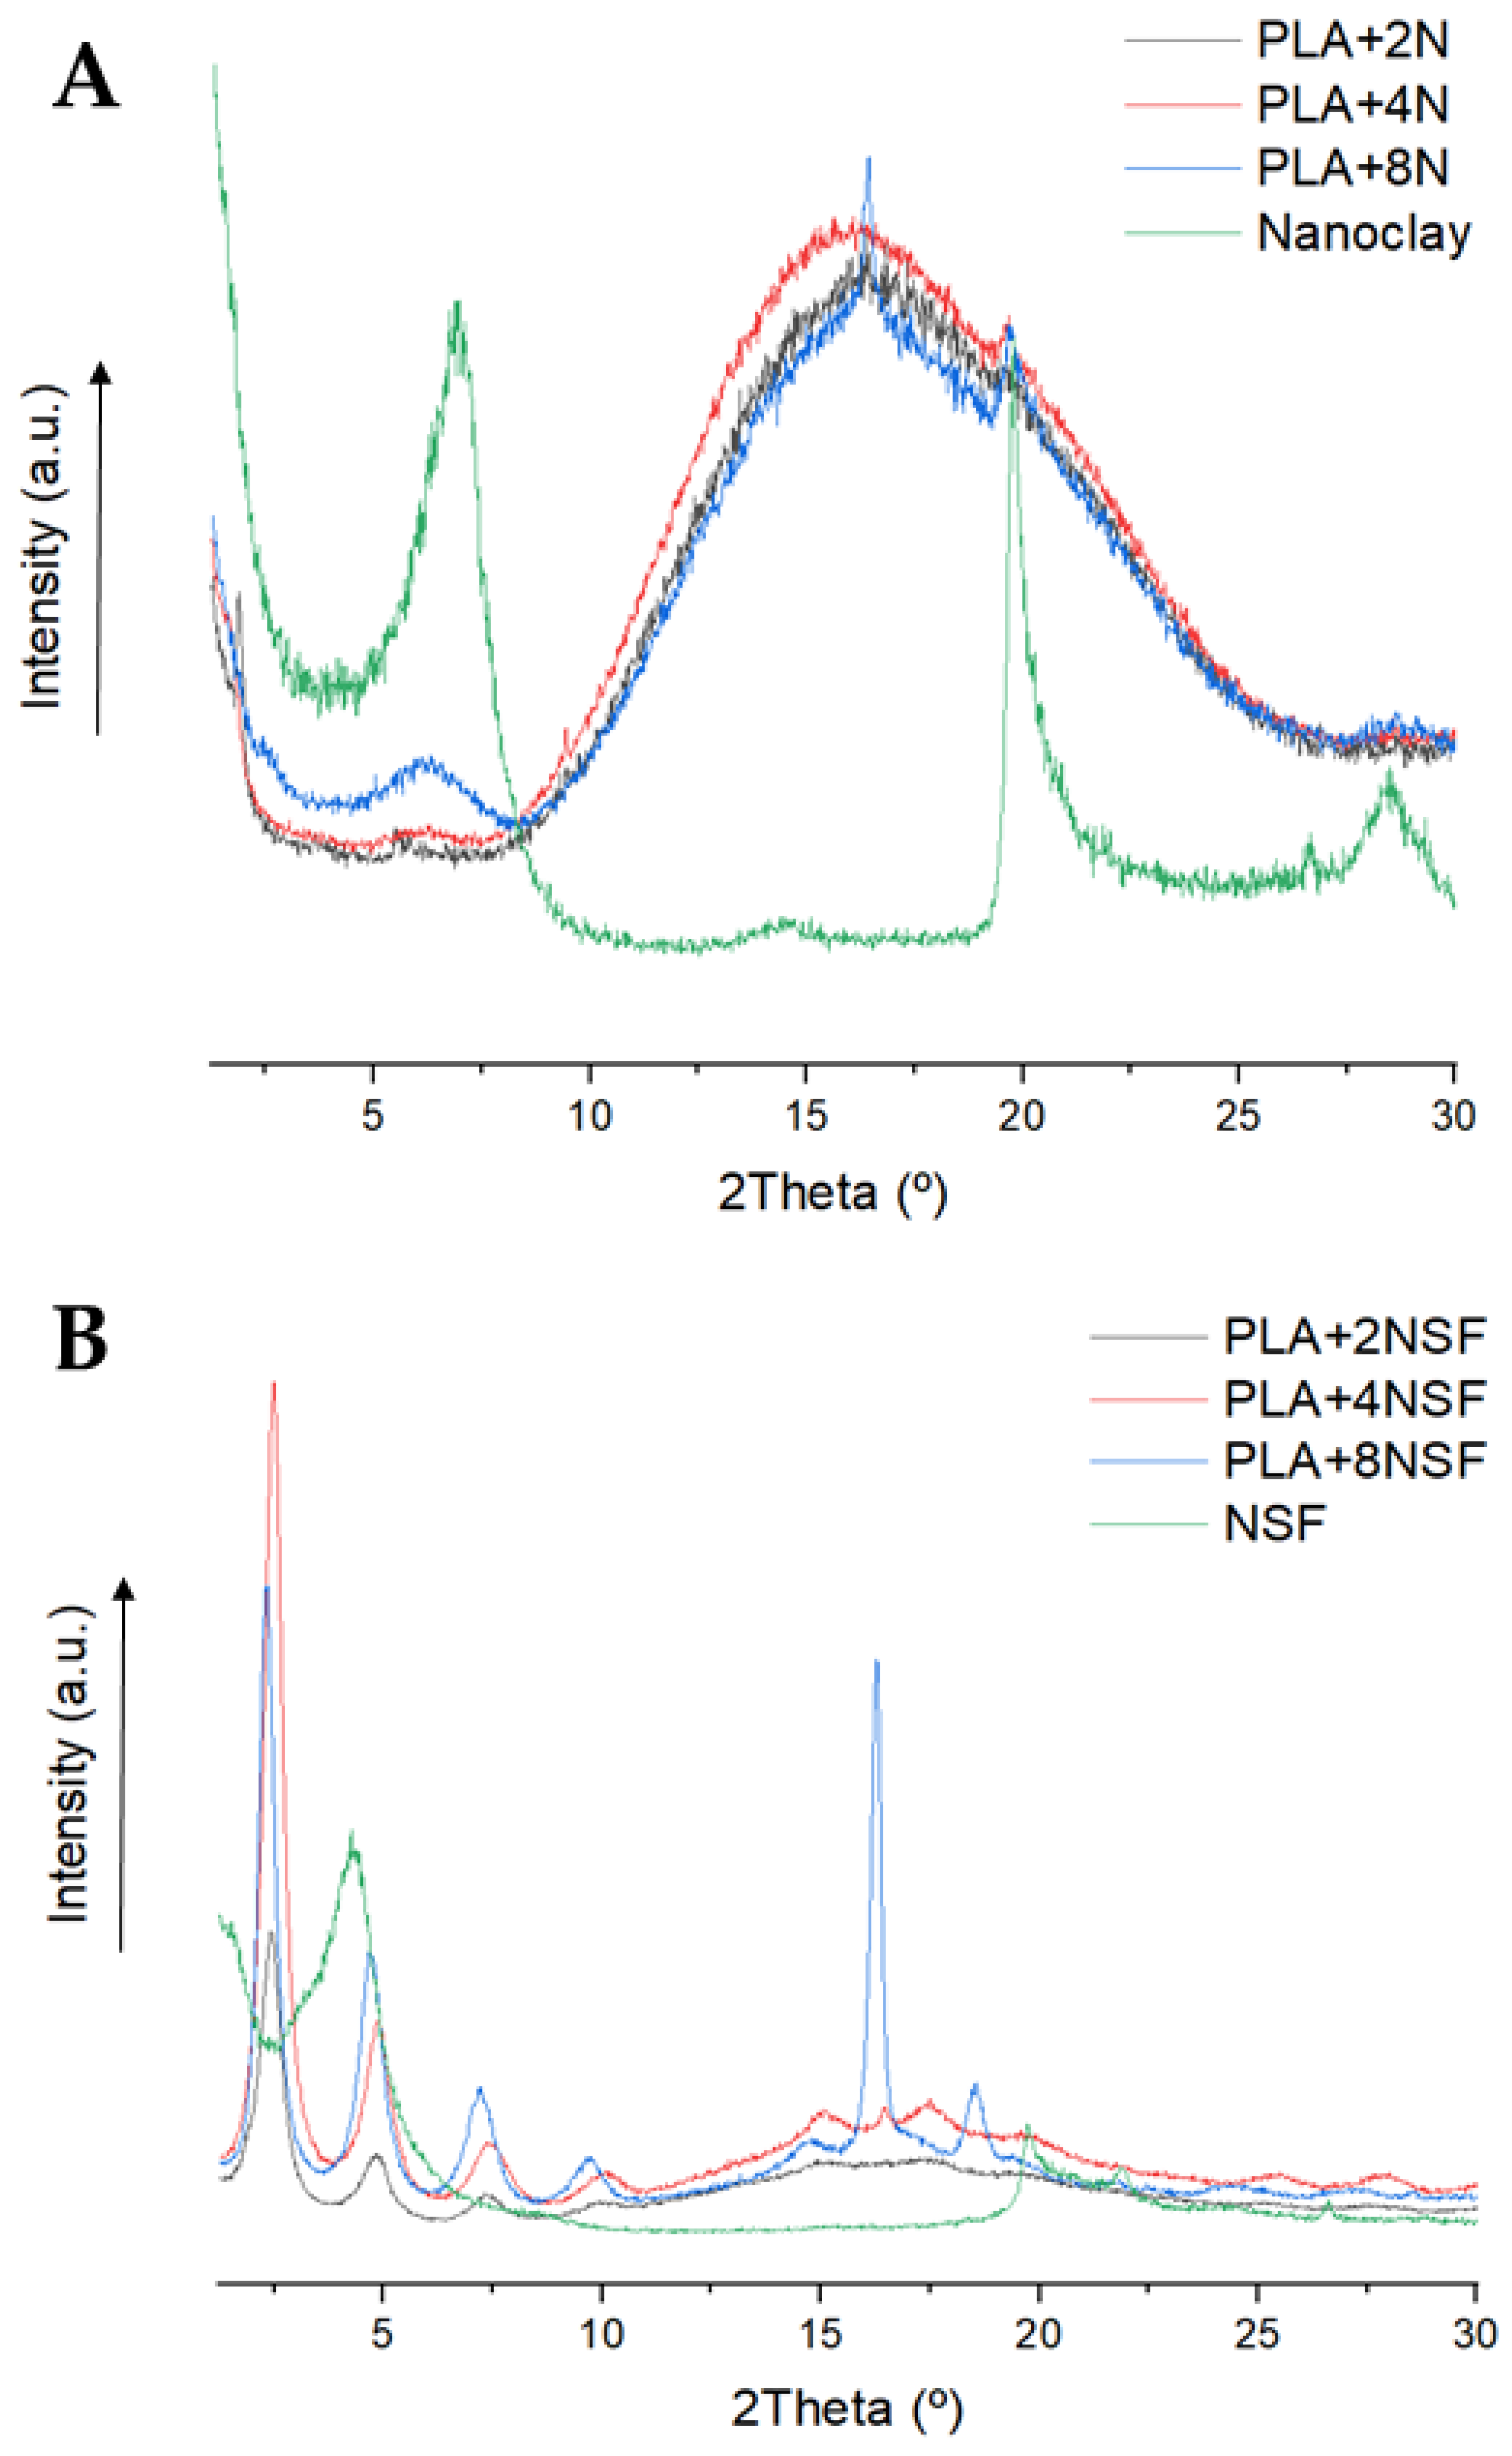
3. Results and Discussion
3.1. Evaluation of the Compounding Process
3.2. Comparison between Nanoclay Type and Composition
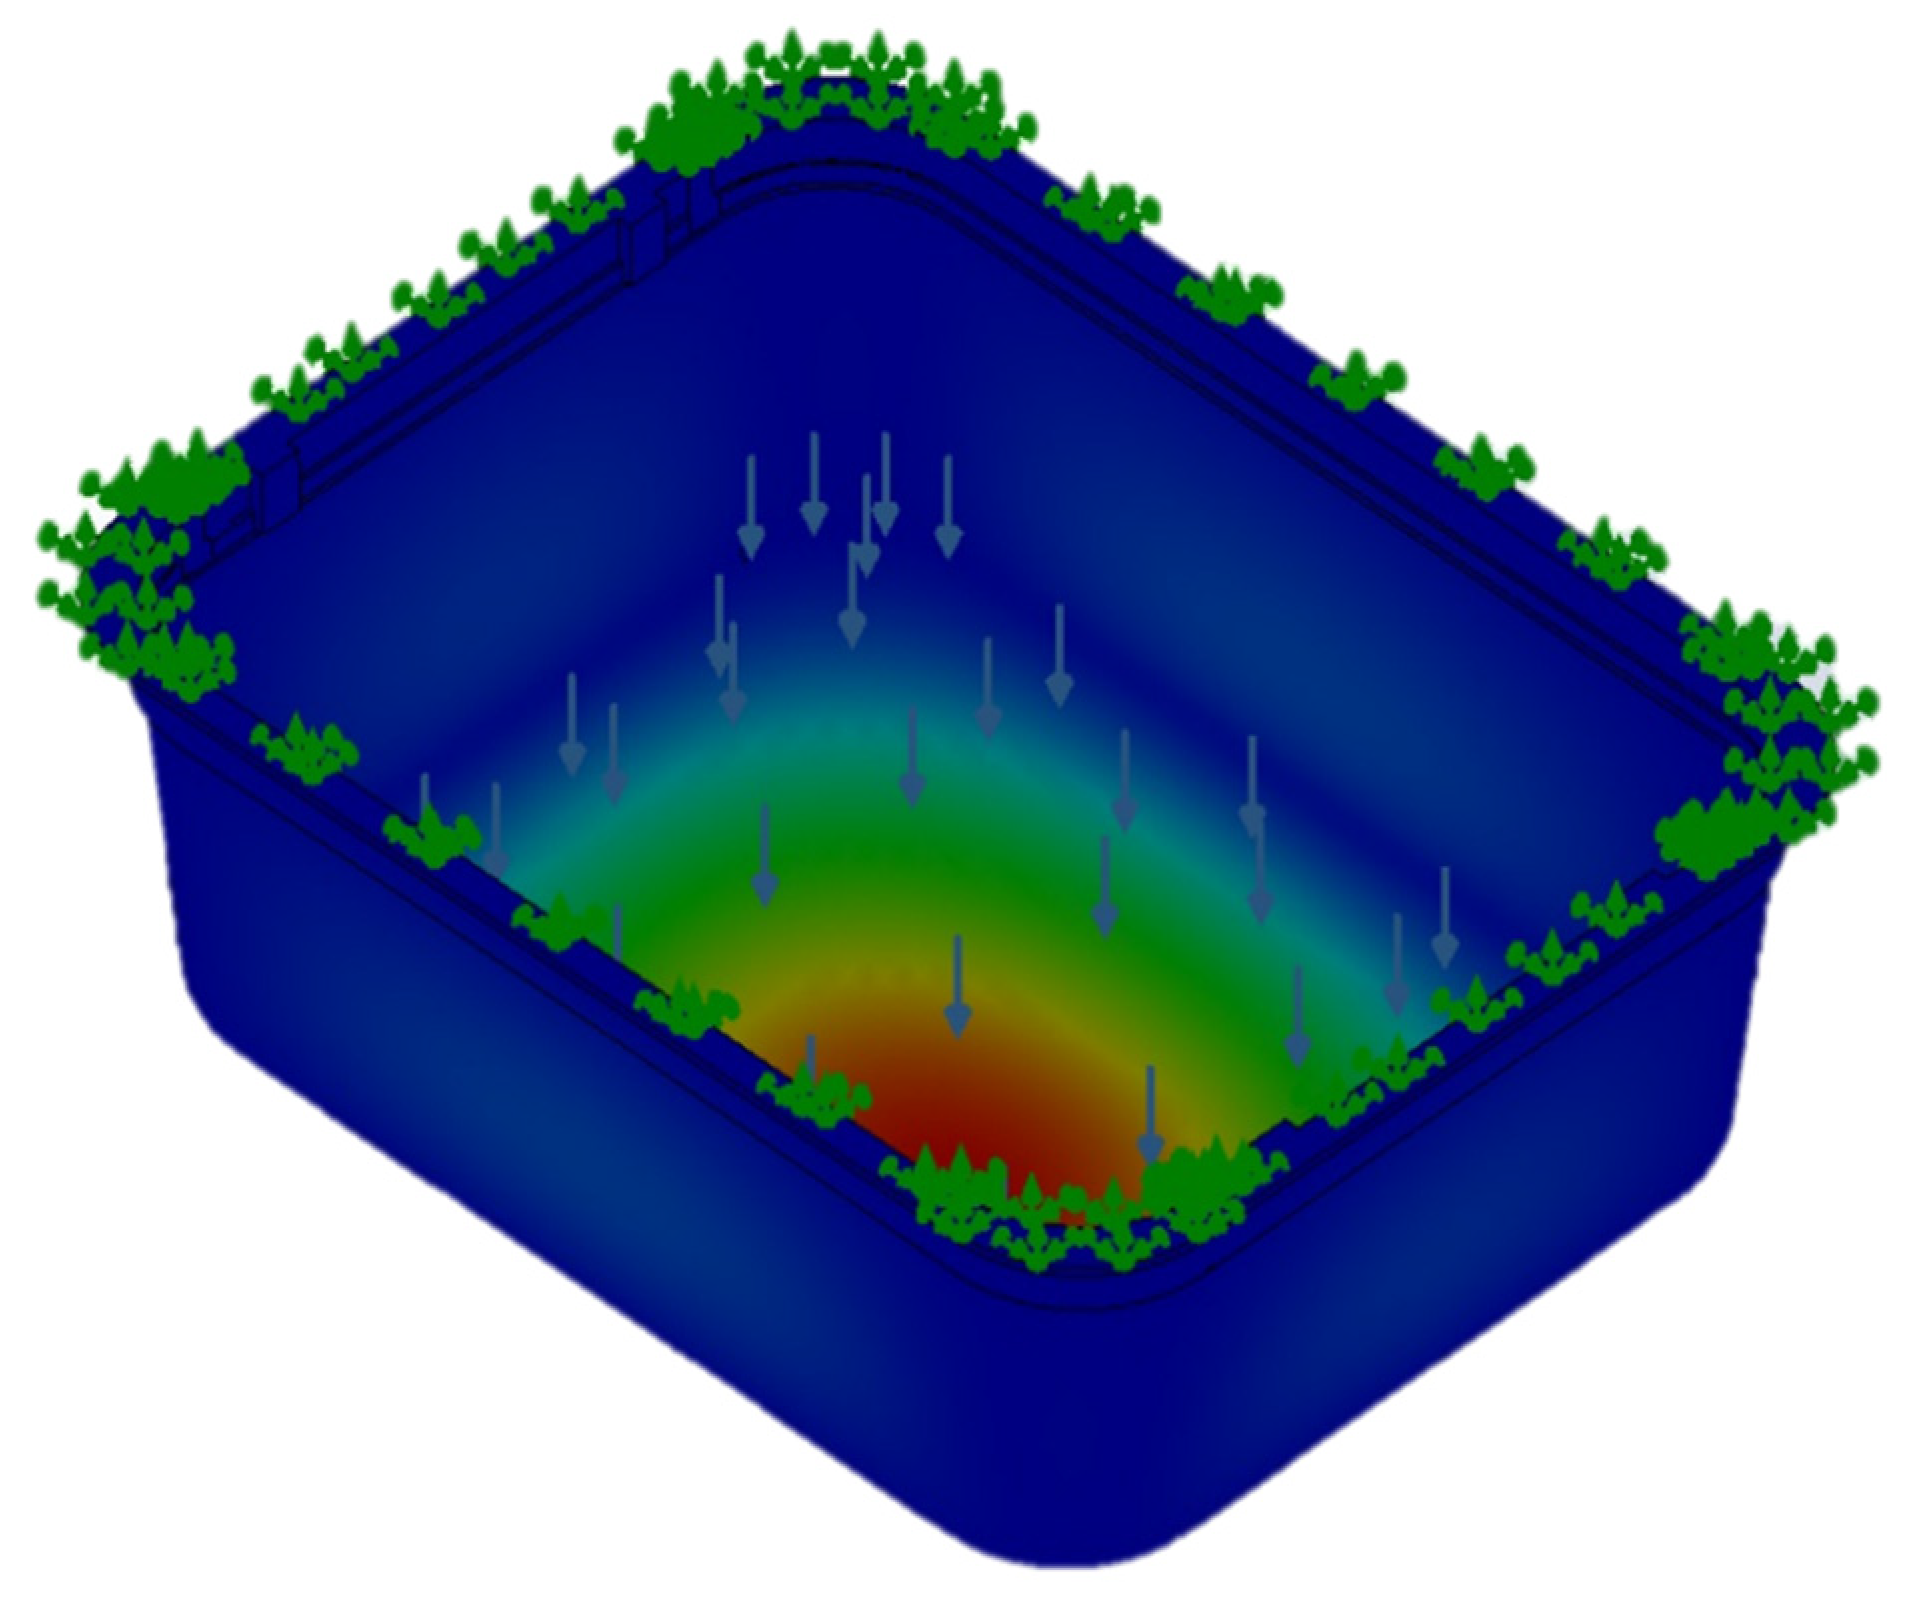
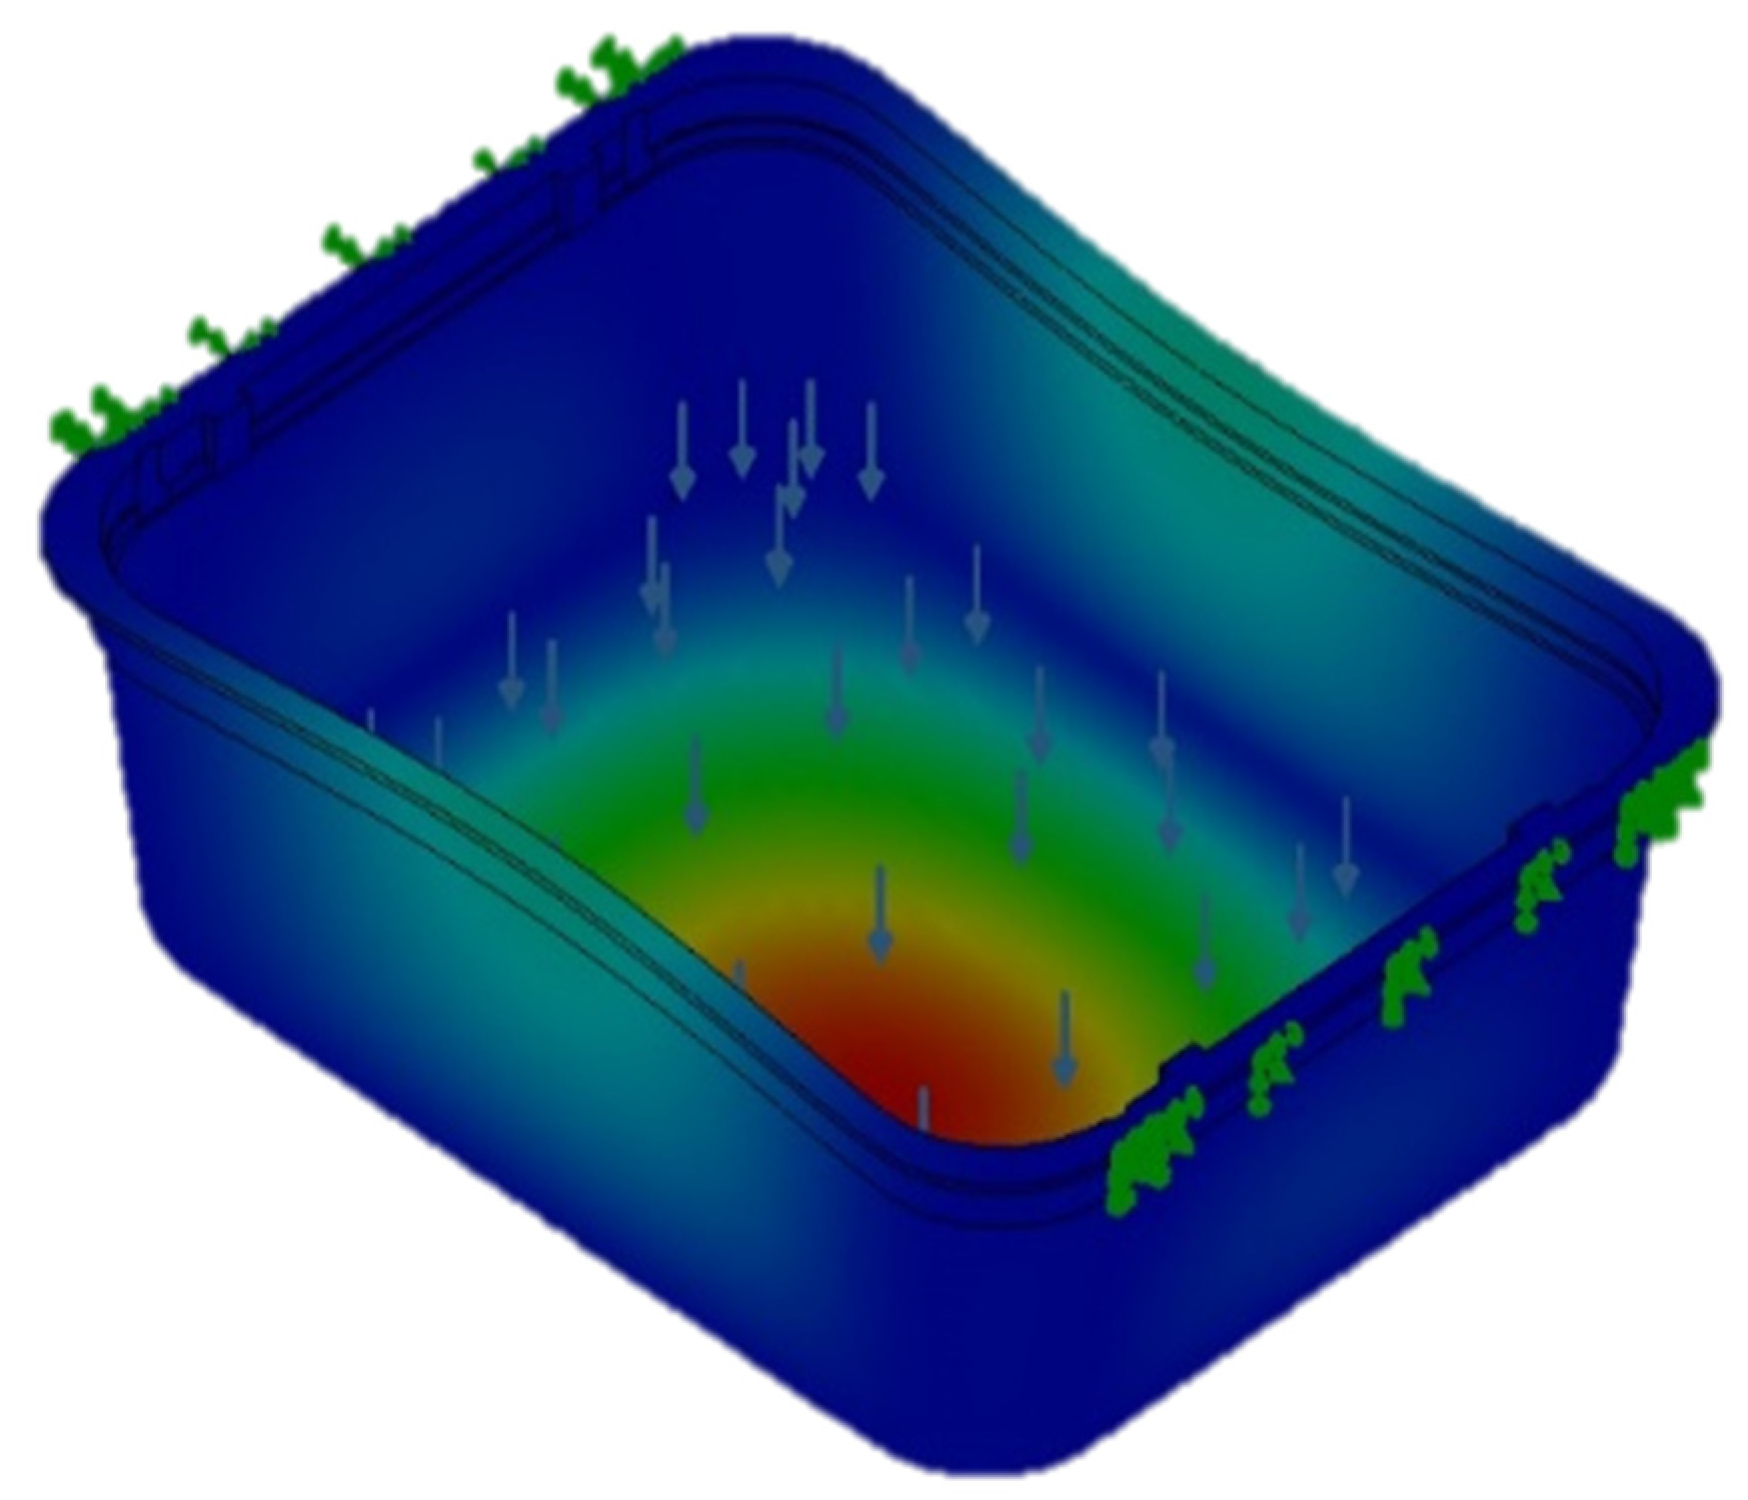
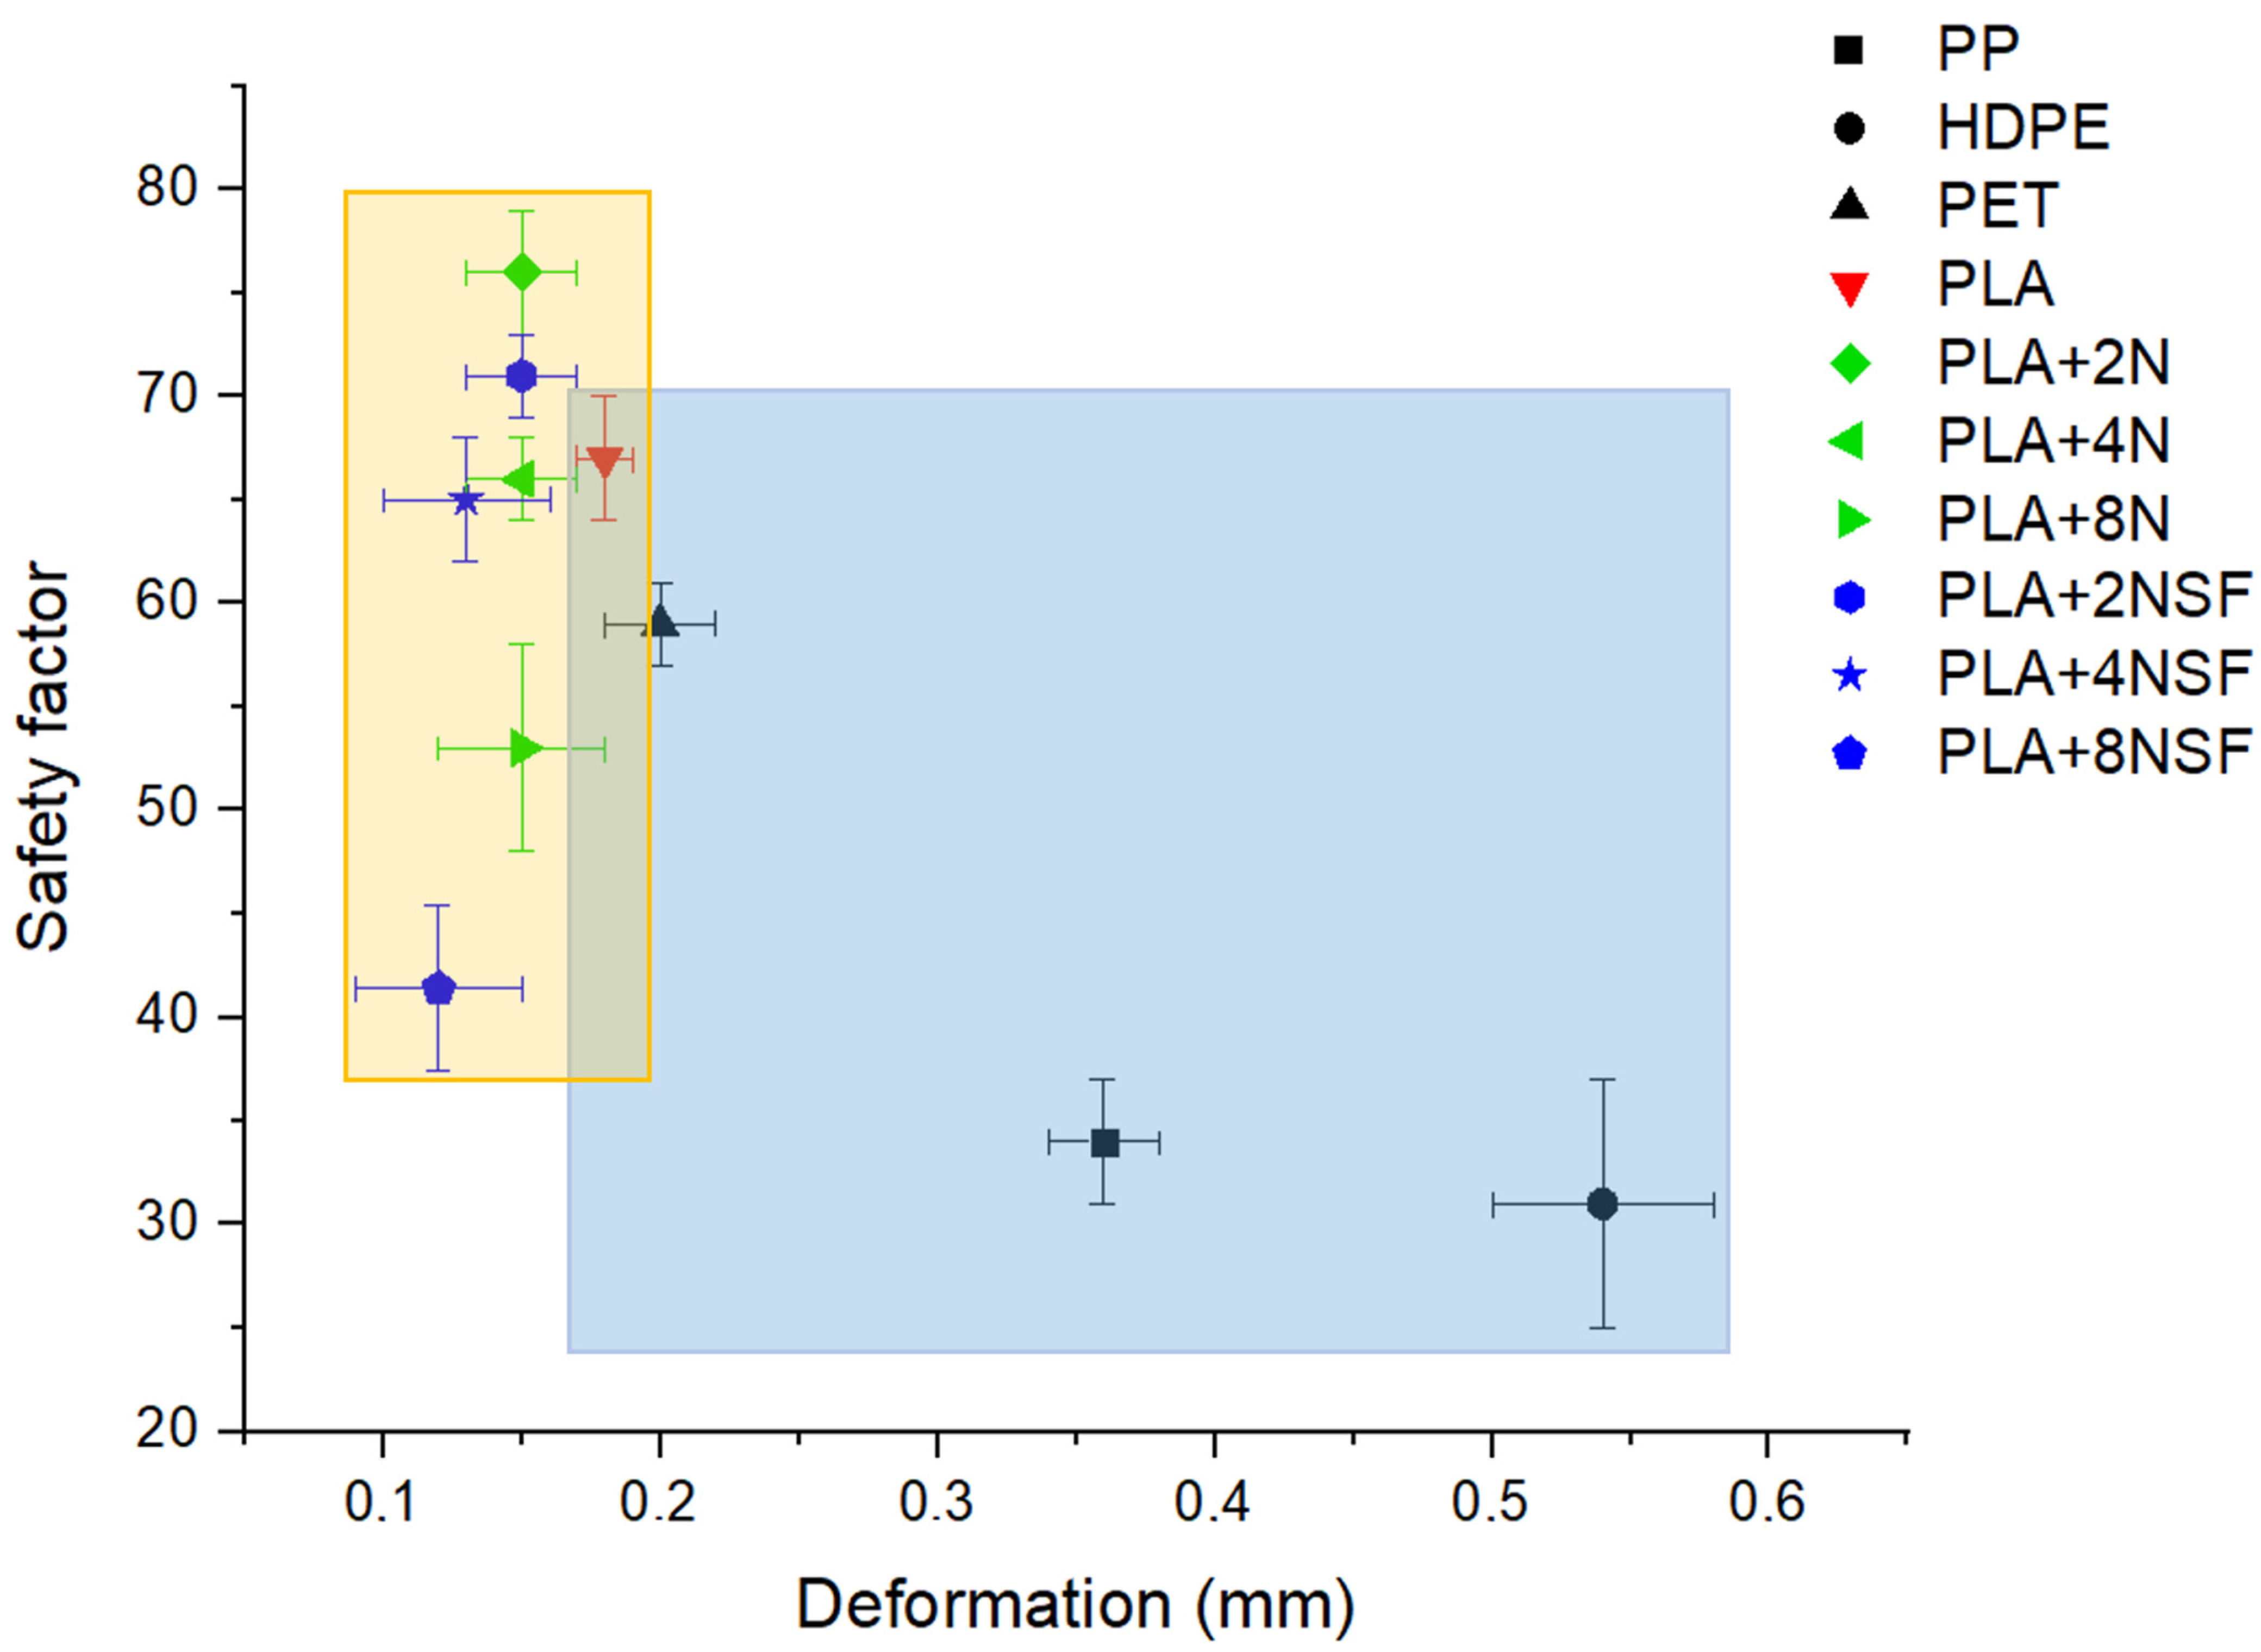
3.3. Mechanical Assessment in a Product
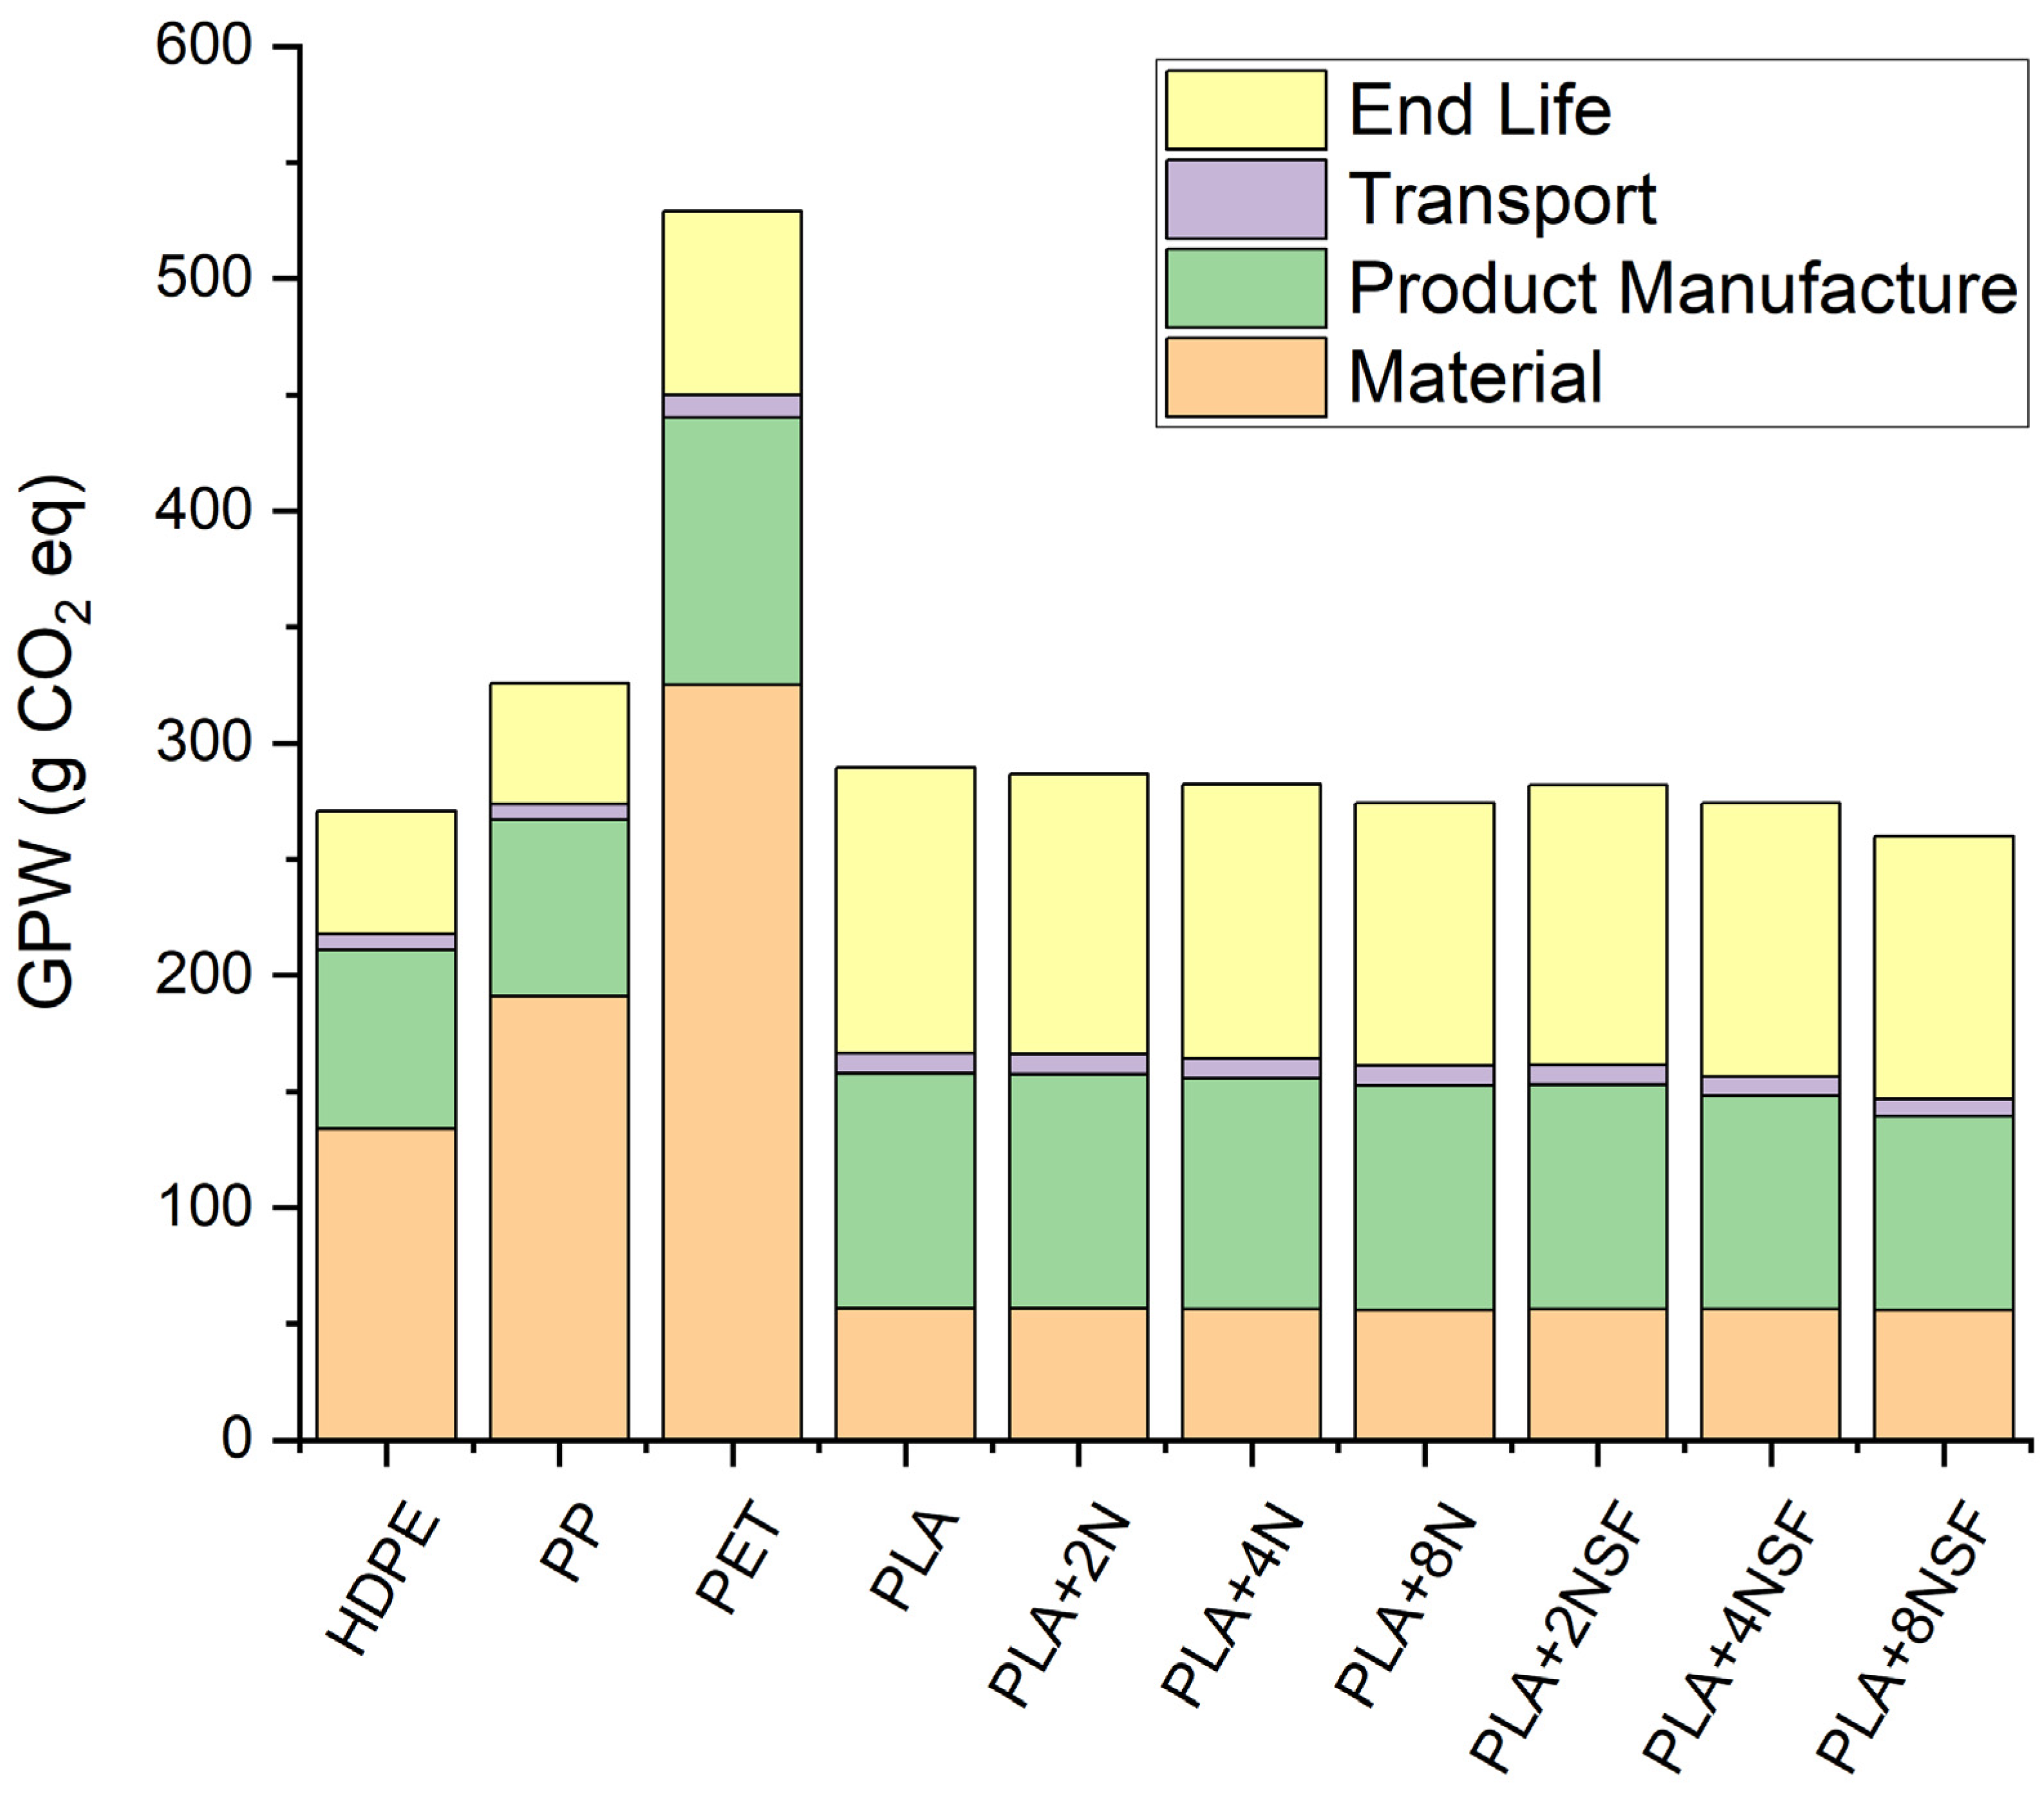
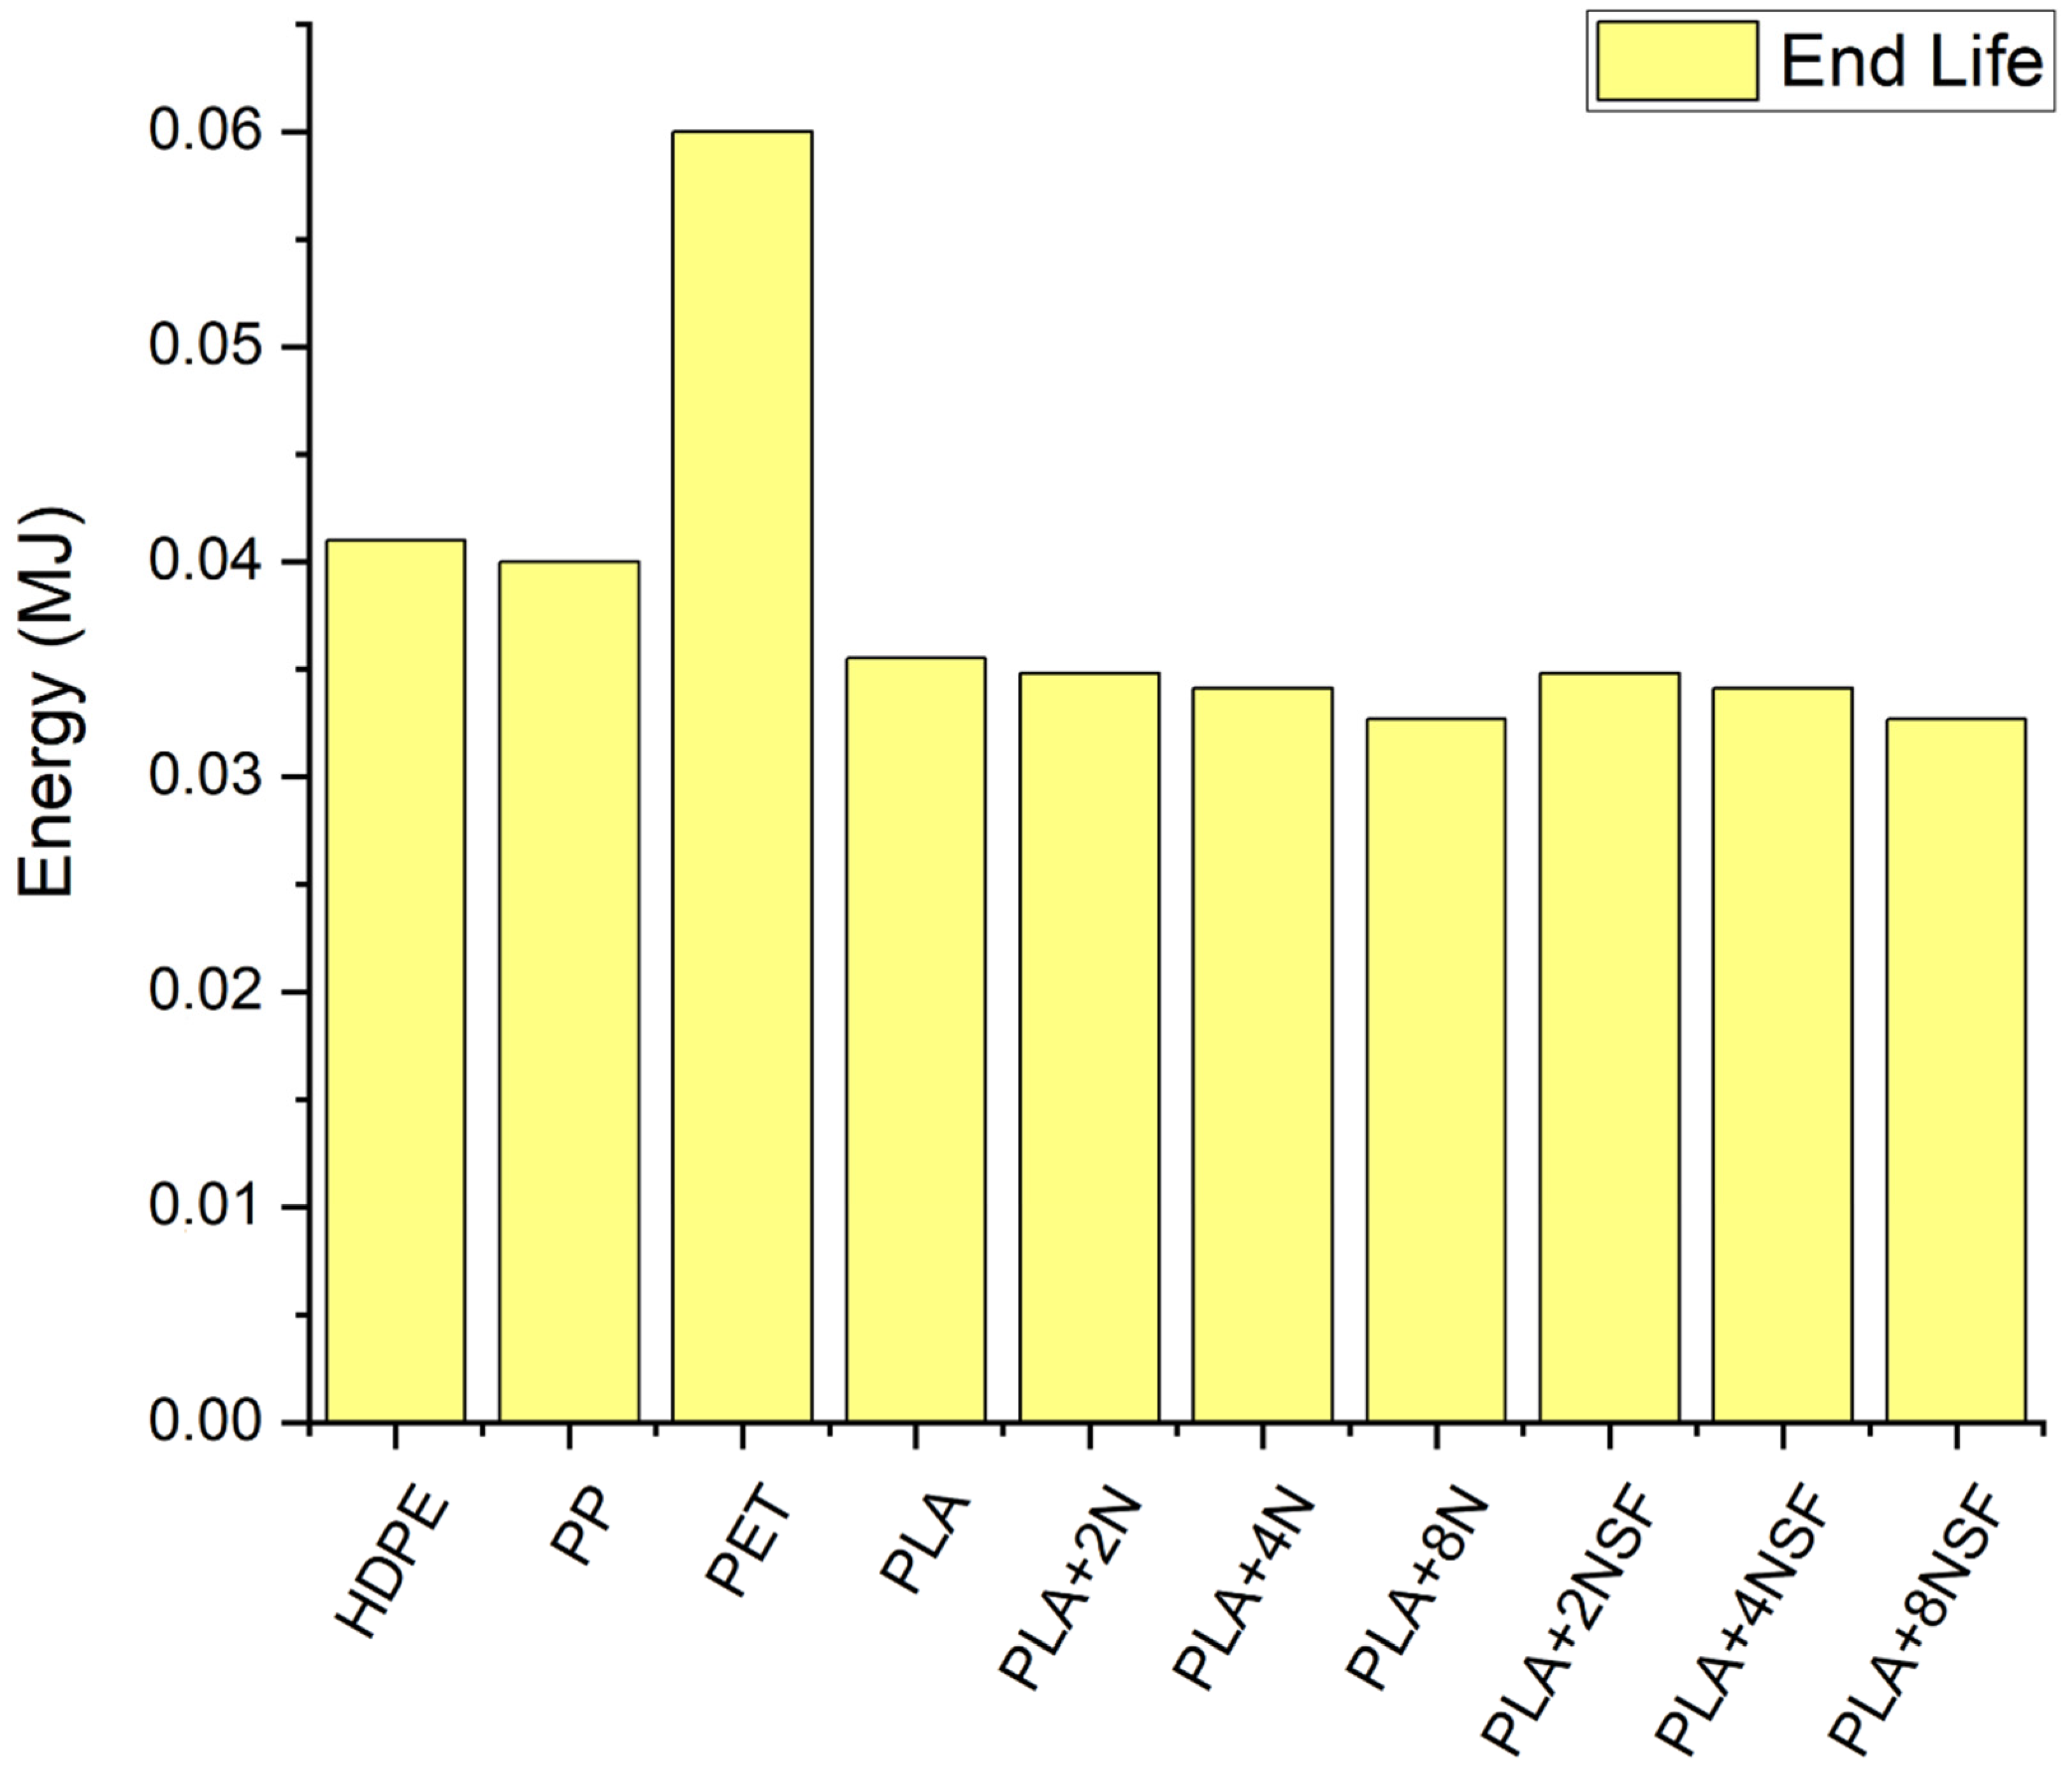
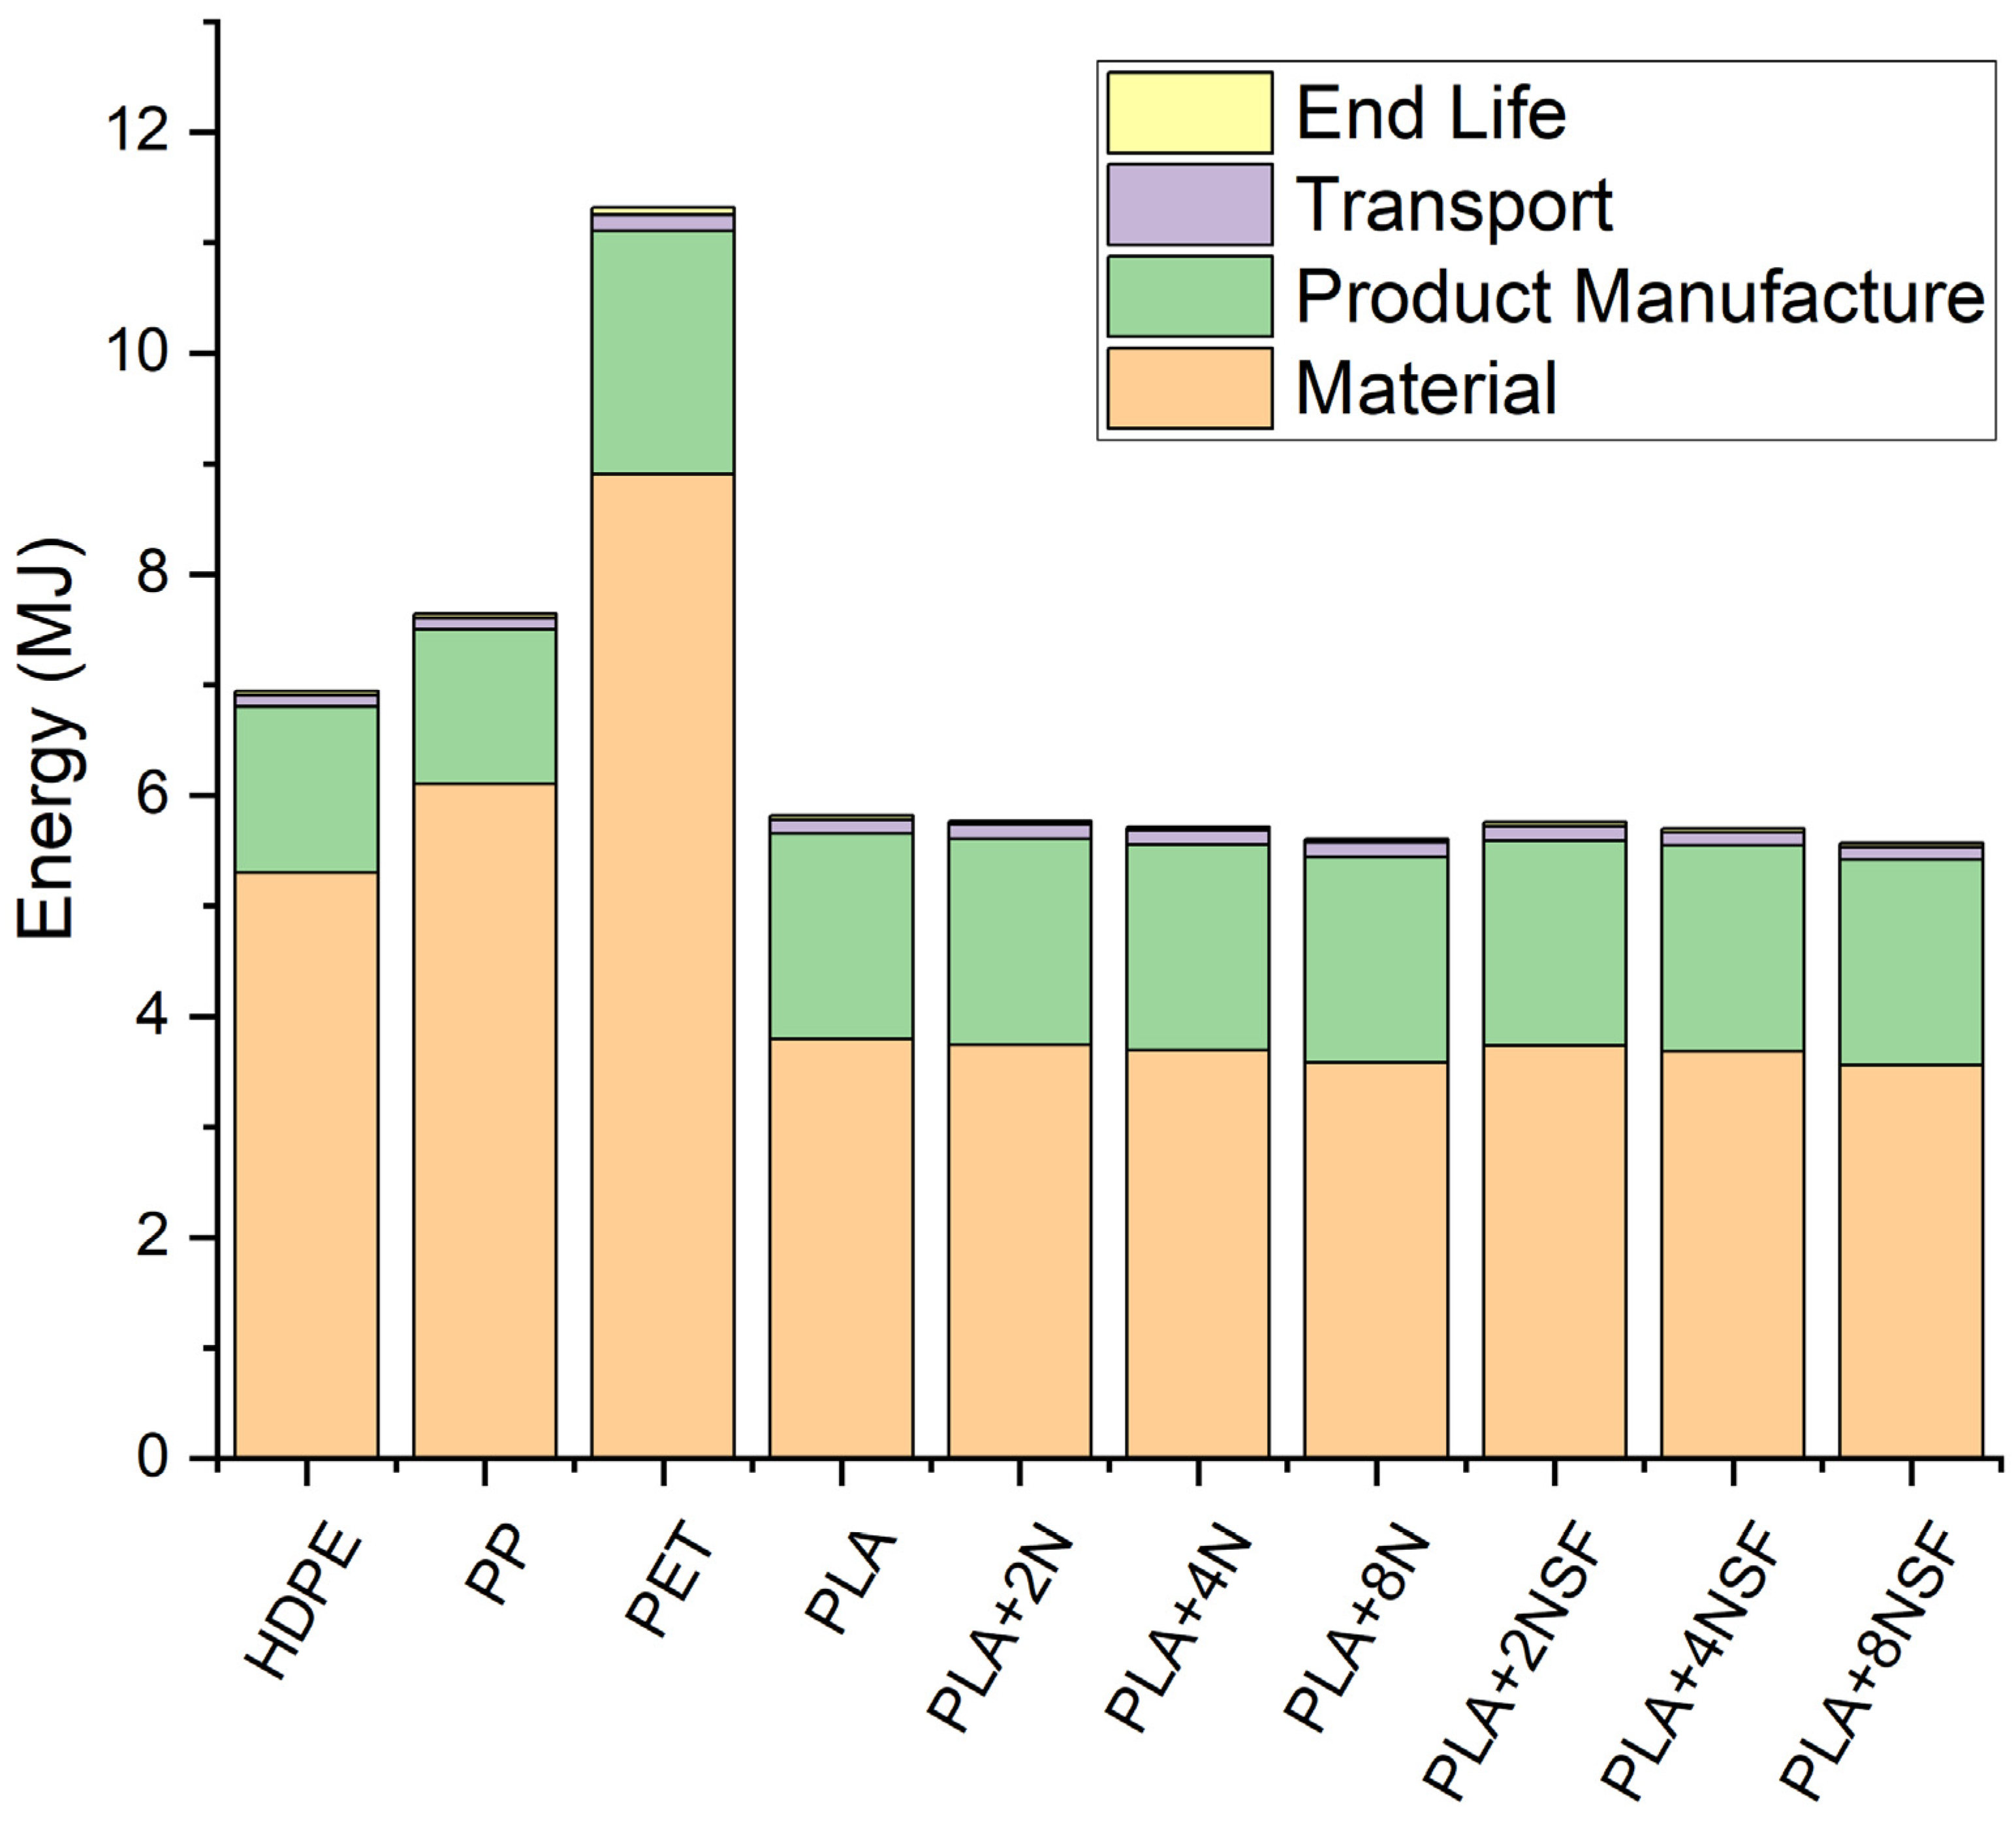
3.4. LCA Preliminary Results
4. Conclusions
Author Contributions
Funding
Institutional Review Board Statement
Informed Consent Statement
Conflicts of Interest
References
- Elsawy, M.A.; Kim, K.H.; Park, J.W.; Deep, A. Hydrolytic degradation of polylactic acid (PLA) and its composites. Renew. Sustain. Energy Rev. 2017, 79, 1346–1352. [Google Scholar] [CrossRef]
- Halley, P.J.; Dorgan, J.R. Next-generation biopolymers: Advanced functionality and improved sustainability. MRS Bull. 2011, 36, 687–691. [Google Scholar] [CrossRef] [Green Version]
- Murariu, M.; Dubois, P. PLA composites: From production to properties. Adv. Drug Deliv. Rev. 2016, 107, 17–46. [Google Scholar] [CrossRef] [PubMed]
- Meunier, B. Plásticos–Situación en 2011. 2011. Available online: https://www.plasticseurope.org/es/resources/publications/327-plasticos-situacion-en-2011 (accessed on 28 October 2020).
- PlasticsEurope. Plastics the Facts 2019. 2019. Available online: https://www.plasticseurope.org/application/files/9715/7129/9584/FINAL_web_version_Plastics_the_facts2019_14102019.pdf (accessed on 28 October 2020).
- Pretula, J.; Slomkowski, S.; Penczek, S. Polylactides—Methods of synthesis and characterization. Adv. Drug Deliv. Rev. 2016, 107, 3–16. [Google Scholar] [CrossRef] [PubMed]
- Silvestre, C.; Cimmino, S.; Silvestre, C.; Pezzuto, M.; Cimmino, S.; Duraccio, D. Polymer Nanomaterials for Food Packaging. In Ecosustainable Polymer Nanomaterials for Food Packaging; CRC Press: Boca Raton, FL, USA, 2013. [Google Scholar]
- Jiménez, A.; Peltzer, M.A.; Ruseckaite, R.A. Poly(Lactic Acid) Science and Technology: Processing, Properties, Additives and Applications; Royal Society of Chemistry: Cambridge, UK, 2015; ISBN 978-1-84973-879-8. [Google Scholar]
- Lajarrige, A.; Gontard, N.; Gaucel, S.; Samson, M.-F.; Peyron, S. The mixed impact of nanoclays on the apparent diffusion coefficient of additives in biodegradable polymers in contact with food. Appl. Clay Sci. 2019, 180, 105170. [Google Scholar] [CrossRef]
- Alexandre, M.; Dubois, P. Polymer-layered silicate nanocomposites: Preparation, properties and uses of a new class of materials. Mater. Sci. Eng. R Rep. 2000, 28, 1–63. [Google Scholar] [CrossRef]
- Sinha Ray, S.; Okamoto, M. Biodegradable polylactide and its nanocomposites: Opening a new dimension for plastics and composites. Macromol. Rapid Commun. 2003, 24, 815–840. [Google Scholar]
- Raquez, J.M.; Habibi, Y.; Murariu, M.; Dubois, P. Polylactide (PLA)-based nanocomposites. Prog. Polym. Sci. 2013, 38, 1504–1542. [Google Scholar] [CrossRef]
- Rhim, J.W.; Hong, S.I.; Ha, C.S. Tensile, water vapor barrier and antimicrobial properties of PLA/nanoclay composite films. LWT Food Sci. Technol. 2009, 42, 612–617. [Google Scholar] [CrossRef]
- Li, Y.; Shimizu, H. Novel morphologies of poly(phenylene oxide) (PPO)/polyamide 6 (PA6) blend nanocomposites. Polymer 2004, 45, 7381–7388. [Google Scholar] [CrossRef]
- Müller, C.M.O.; Laurindo, J.B.; Yamashita, F. Effect of nanoclay incorporation method on mechanical and water vapor barrier properties of starch-based films. Ind. Crops Prod. 2011, 33, 605–610. [Google Scholar] [CrossRef]
- Chiou, B.-S.; Wood, D.; Yee, E.; Imam, S.H.; Glenn, G.M.; Orts, W.J. Extruded starch–nanoclay nanocomposites: Effects of glycerol and nanoclay concentration. Polym. Eng. Sci. 2007, 47, 1898–1904. [Google Scholar] [CrossRef]
- Allafi, A.R.; Pascall, M.A. The effect of different percent loadings of nanoparticles on the barrier and thermal properties of nylon 6 films. Innov. Food Sci. Emerg. Technol. 2013, 20, 276–280. [Google Scholar] [CrossRef]
- Luo, Y.; Lin, Z.; Guo, G. Biodegradation Assessment of Poly (Lactic Acid) Filled with Functionalized Titania Nanoparticles (PLA/TiO2) under Compost Conditions. Nanoscale Res. Lett. 2019, 14, 1–10. [Google Scholar] [CrossRef] [Green Version]
- Xue, Y.; Ma, Z.; Xu, X.; Shen, M.; Huang, G.; Bourbigot, S.; Liu, X.; Song, P. Mechanically robust and flame-retardant polylactide composites based on molecularly-engineered polyphosphoramides. Compos. Part A Appl. Sci. Manuf. 2021, 144, 106317. [Google Scholar] [CrossRef]
- Yin, W.; Chen, L.; Lu, F.; Song, P.; Dai, J.; Meng, L. Mechanically Robust, Flame-Retardant Poly(lactic acid) Biocomposites via Combining Cellulose Nanofibers and Ammonium Polyphosphate. ACS Omega 2018, 3, 5615–5626. [Google Scholar] [CrossRef]
- Xu, X.; Dai, J.; Ma, Z.; Liu, L.; Zhang, X.; Liu, H.; Tang, L.-C.; Huang, G.; Wang, H.; Song, P. Manipulating interphase reactions for mechanically robust, flame-retardant and sustainable polylactide biocomposites. Compos. Part B Eng. 2020, 190, 107930. [Google Scholar] [CrossRef]
- Xue, Y.; Feng, J.; Huo, S.; Song, P.; Yu, B.; Liu, L.; Wang, H. Polyphosphoramide-intercalated MXene for simultaneously enhancing thermal stability, flame retardancy and mechanical properties of polylactide. Chem. Eng. J. 2020, 397, 125336. [Google Scholar] [CrossRef]
- Feng, J.; Sun, Y.; Song, P.; Lei, W.; Wu, Q.; Liu, L.; Yu, Y.; Wang, H. Fire-Resistant, Strong, and Green Polymer Nanocomposites Based on Poly(lactic acid) and Core–Shell Nanofibrous Flame Retardants. ACS Sustain. Chem. Eng. 2017, 5, 7894–7904. [Google Scholar] [CrossRef]
- Krikorian, V.; Pochan, D.J. Crystallization Behavior of Poly(lactic acid) Nanocomposites: Nucleation and Growth Probed by Infrared Spectroscopy. Macromolecules 2005, 38, 6520–6527. [Google Scholar] [CrossRef]
- Lai, S.-M.; Wu, S.-H.; Lin, G.-G.; Don, T.-M. Unusual mechanical properties of melt-blended poly(lactic acid) (PLA)/clay nanocomposites. Eur. Polym. J. 2014, 52, 193–206. [Google Scholar] [CrossRef]
- Sanchez, L.M.; Alvarez, V.A.; Ollier, R.P. Acid-treated Bentonite as filler in the development of novel composite PVA hydrogels. J. Appl. Polym. Sci. 2019, 136, 47663. [Google Scholar] [CrossRef]
- Lendvai, L.; Sajó, I.; Karger-Kocsis, J. Effect of Storage Time on the Structure and Mechanical Properties of Starch/Bentonite Nanocomposites. Starch Stärke 2019, 71, 1800123. [Google Scholar] [CrossRef] [Green Version]
- Duncan, T.V. Applications of nanotechnology in food packaging and food safety: Barrier materials, antimicrobials and sensors. J. Colloid Interface Sci. 2011, 363, 1–24. [Google Scholar] [CrossRef]
- Naderi-Samani, H.; Loghman-Estarki, M.R.; Razavi, R.S.; Ramazani, M. The Effects of organoclay on the morphology, thermal stability, transparence and hydrophobicity properties of polyamide—Imide/nanoclay nanocomposite coatings. Prog. Org. Coat. 2017, 112, 162–168. [Google Scholar] [CrossRef]
- Rani, P.; Ahamed, M.B.; Deshmukh, K. Significantly enhanced electromagnetic interference shielding effectiveness of montmorillonite nanoclay and copper oxide nanoparticles based polyvinylchloride nanocomposites. Polym. Test. 2020, 91, 106744. [Google Scholar] [CrossRef]
- Hsu, W.-H.; Chang, H.-M.; Lee, Y.-L.; Prasannan, A.; Hu, C.-C.; Wang, J.-S.; Lai, J.-Y.; Yang, J.M.; Jebaranjitham, N.; Tsai, H.-C. Biodegradable polymer-nanoclay composites as intestinal sleeve implants installed in digestive tract for obesity and type 2 diabetes treatment. Mater. Sci. Eng. C 2020, 110, 110676. [Google Scholar] [CrossRef]
- Iturrondobeitia, M.; Okariz, A.; Guraya, T.; Zaldua, A.M.; Ibarretxe, J. Influence of the processing parameters and composition on the thermal stability of PLA/nanoclay bio-nanocomposites. J. Appl. Polym. Sci. 2014, 131, 9120–9127. [Google Scholar] [CrossRef]
- Mróz, P.; Białas, S.; Mucha, M.; Kaczmarek, H. Thermogravimetric and DSC testing of poly(lactic acid) nanocomposites. Thermochim. Acta 2013, 573, 186–192. [Google Scholar] [CrossRef]
- Cheraghian, G.; Khalili Nezhad, S. Experimental Investigation of Polymer Solutions Used in Enhanced Oil Recovery–Thermal properties Improved by Nanoclay. In Proceedings of the 77th EAGE Conference and Exhibition 2015, Madrid, Spain, 1–4 June 2015; pp. 1–3. [Google Scholar]
- Das, K.; Ray, D.; Banerjee, I.; Bandyopadhyay, N.R.; Sengupta, S.; Mohanty, A.K.; Misra, M. Crystalline morphology of PLA/clay nanocomposite films and its correlation with other properties. J. Appl. Polym. Sci. 2010, 118, 143–151. [Google Scholar] [CrossRef]
- Molinaro, S.; Cruz Romero, M.; Boaro, M.; Sensidoni, A.; Lagazio, C.; Morris, M.; Kerry, J. Effect of nanoclay-type and PLA optical purity on the characteristics of PLA-based nanocomposite films. J. Food Eng. 2013, 117, 113–123. [Google Scholar] [CrossRef]
- Yang, H.; Shi, B.; Xue, Y.; Ma, Z.; Liu, L.; Liu, L.; Yu, Y.; Zhang, Z.; Annamalai, P.K.; Song, P. Molecularly Engineered Lignin-Derived Additives Enable Fire-Retardant, UV-Shielding, and Mechanically Strong Polylactide Biocomposites. Biomacromolecules 2021, 22, 1432–1444. [Google Scholar] [CrossRef]
- Hwang, W.-G.; Wei, K.-H.; Wu, C.-M. Synergistic effect of compatibilizer in organo-modified layered silicate reinforced butadiene rubber nanocomposites. Polym. Eng. Sci. 2006, 46, 80–88. [Google Scholar] [CrossRef]
- Mykola, S.; Olga, N.; Dmitry, M. The influence of alkylammonium modified clays on the fungal resistance and biodeterioration of epoxy-clay nanocomposites. Int. Biodeterior. Biodegrad. 2016, 110, 136–140. [Google Scholar] [CrossRef]
- He, H.; Ma, Y.; Zhu, J.; Yuan, P.; Qing, Y. Organoclays prepared from montmorillonites with different cation exchange capacity and surfactant configuration. Appl. Clay Sci. 2010, 48, 67–72. [Google Scholar] [CrossRef]
- Tábi, T.; Sajó, I.E.; Szabó, F.; Luyt, A.S.; Kovács, J.G. Crystalline structure of annealed polylactic acid and its relation to processing. Express Polym. Lett. 2010, 4, 659–668. [Google Scholar] [CrossRef]
- Li, S.; McCarthy, S. Further investigations on the hydrolytic degradation of poly (DL-lactide). Biomaterials 1999, 20, 35–44. [Google Scholar] [CrossRef]
- Encalada-Alayola, J.J.; Veranes-Pantoja, Y.; Uribe-Calderón, J.A.; Cauich-Rodríguez, J.V.; Cervantes-Uc, J.M. Effect of Type and Concentration of Nanoclay on the Mechanical and Physicochemical Properties of Bis-GMA/TTEGDMA Dental Resins. Polymers 2020, 12, 601. [Google Scholar] [CrossRef] [Green Version]
- Shettar, M.; Kowshik, C.S.S.; Manjunath, M.; Hiremath, P. Experimental investigation on mechanical and wear properties of nanoclay–epoxy composites. J. Mater. Res. Technol. 2020, 9, 9108–9116. [Google Scholar] [CrossRef]
- Feng, J.; Xu, X.; Xu, Z.; Xie, H.; Song, P.; Li, L.; Huang, G.; Wang, H. One-Pot, Solvent- and Catalyst-Free Synthesis of Polyphosphoramide as an Eco-Benign and Effective Flame Retardant for Poly(lactic acid). ACS Sustain. Chem. Eng. 2020, 8, 16612–16623. [Google Scholar] [CrossRef]
- Vink, E.T.H.; Davies, S. Life Cycle Inventory and Impact Assessment Data for 2014 IngeoTM Polylactide Production. Ind. Biotechnol. 2015, 11, 167–180. [Google Scholar] [CrossRef] [Green Version]
- Gironi, F.; Piemonte, V. Life cycle assessment of polylactic acid and polyethylene terephthalate bottles for drinking water. Environ. Prog. Sustain. Energy 2011, 30, 459–468. [Google Scholar] [CrossRef]
- Spierling, S.; Röttger, C.; Venkatachalam, V.; Mudersbach, M.; Herrmann, C.; Endres, H.-J. Bio-based Plastics–A Building Block for the Circular Economy? Procedia CIRP 2018, 69, 573–578. [Google Scholar] [CrossRef]
- Joshi, S. Can Nanotechnology Improve the Sustainability of Biobased Products? J. Ind. Ecol. 2008, 12, 474–489. [Google Scholar]


| Sample | Young’s Modulus (GPa) | Tensile Strength (MPa) | Tensile Deformation at Maximum Force (%) |
|---|---|---|---|
| PLA | 3.34 ± 0.13 | 49.9 ± 1.3 | 2.3 ± 0.1 |
| PLA+4%N Direct | 3.94 ± 0.05 | 47.0 ± 3.4 | 2.3 ± 0.3 |
| PLA+4%N Masterbatch | 4.03 ± 0.11 | 49.0 ± 1.1 | 2.5 ± 0.1 |
| Temperatures (°C) | PLA | PLA+4%N Direct | PLA+4%N Masterbatch |
|---|---|---|---|
| T5% | 328 | 326 | 327 |
| T10% | 334 | 337 | 337 |
| Tmax | 362 | 365 | 364 |
| Residue (700 °C) (%) | 1.04 | 4.38 | 4.12 |
| Sample | Young’s Modulus (GPa) | Tensile Strength (MPa) | Deformation at Maximum Force (%) |
|---|---|---|---|
| PLA | 3.34 ± 0.13 | 49.9 ± 1.3 | 2.3 ± 0.1 |
| PLA+2%N | 4.00 ± 0.16 | 56.5 ± 0.7 | 2.8 ± 0.2 |
| PLA+4%N | 4.03 ± 0.11 | 49.0 ± 1.1 | 2.5 ± 0.1 |
| PLA+8%N | 4.18 ± 0.07 | 36.1 ± 3.0 | 1.5 ± 0.2 |
| PLA+2%NSF | 4.19 ± 0.12 | 52.8 ± 1.5 | 2.5 ± 0.2 |
| PLA+4%NSF | 4.56 ± 0.19 | 48.9 ± 2.8 | 2.2 ± 0.2 |
| PLA+8%NSF | 5.01 ± 0.27 | 28.2 ± 1.8 | 1.3 ± 0.2 |
| T5% (°C) | T10% (°C) | Tmax (°C) | Residue at 700 °C (%) | |
|---|---|---|---|---|
| PLA | 328 | 334 | 362 | 1.04 |
| PLA+2%N | 328 | 338 | 367 | 2.28 |
| PLA+4%N | 327 | 337 | 364 | 4.12 |
| PLA+8%N | 318 | 332 | 365 | 6.57 |
| PLA+2%NSF | 323 | 334 | 364 | 0.71 |
| PLA+4%NSF | 320 | 333 | 369 | 2.78 |
| PLA+8%NSF | 304 | 326 | 367 | 5.33 |
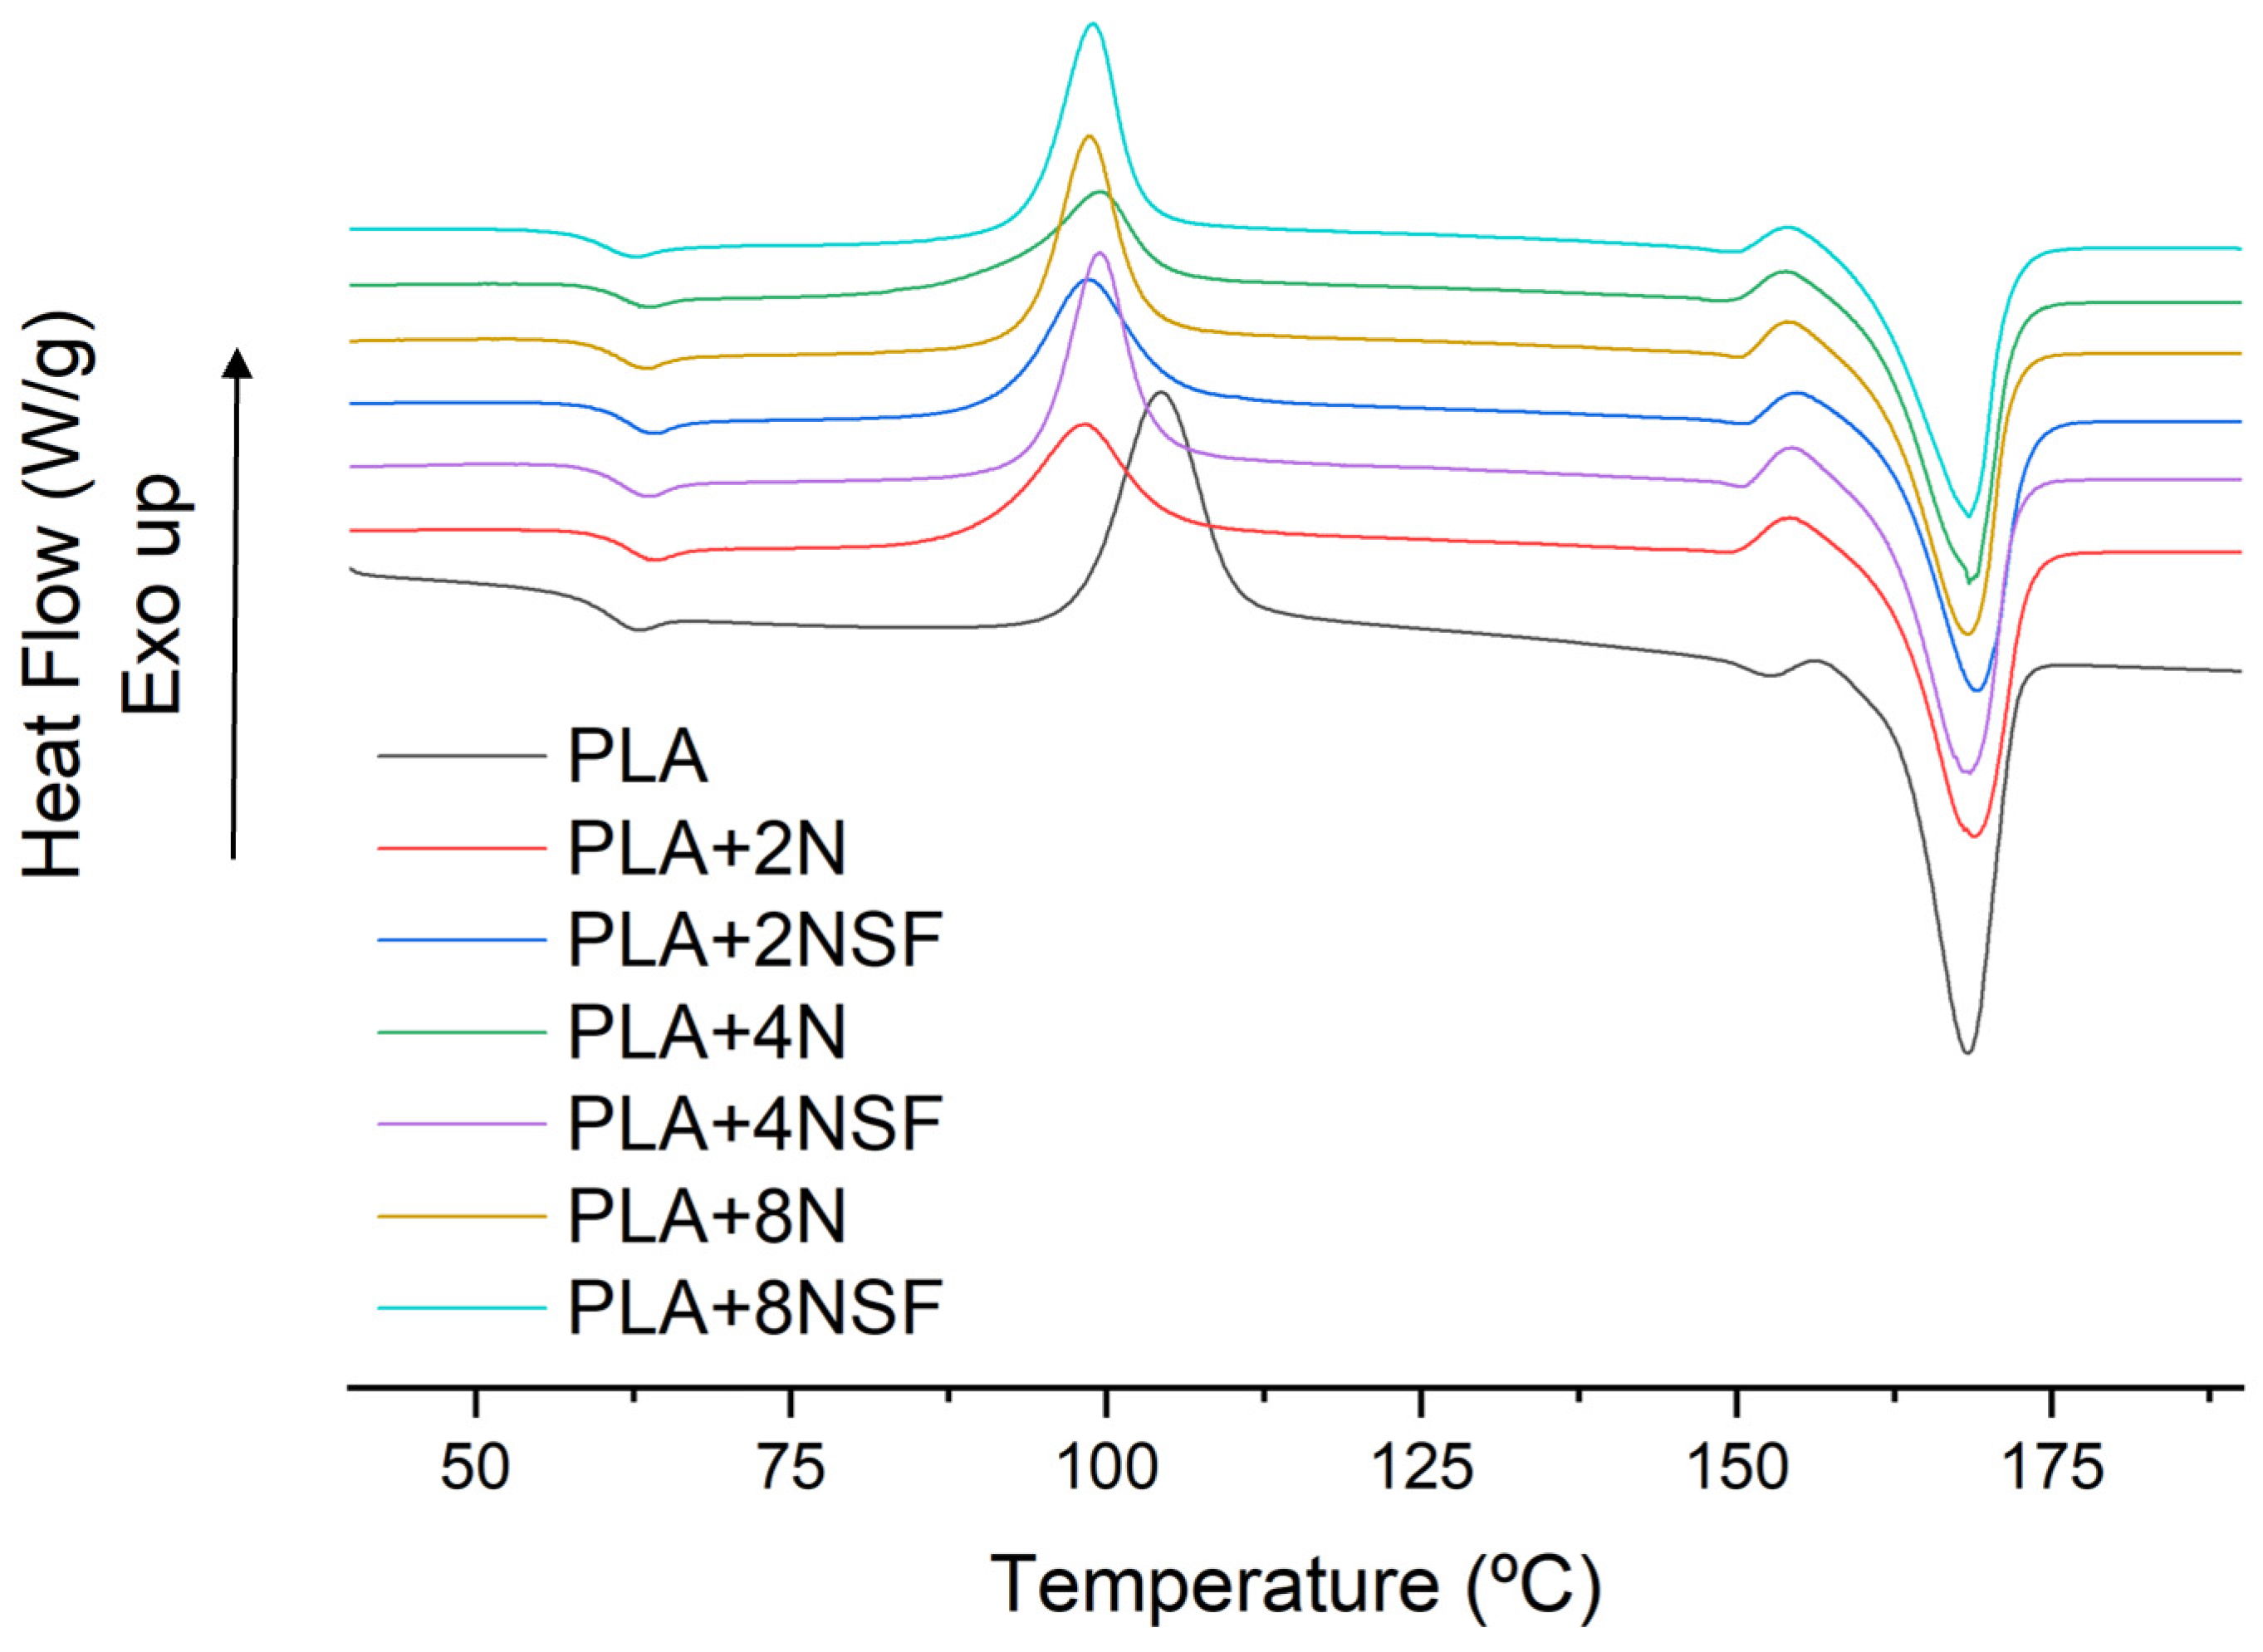
| Tg (°C) | Tc (°C) | ΔHc (J/g PLA) | Tm (°C) | ΔHm (J/g PLA) | Crystallinity (%) | |
|---|---|---|---|---|---|---|
| PLA | 57.7–60.8 | 104.3 | 38.7 | 167.5 | 50.1 | 53.6 |
| PLA+2%N | 59.7–62.4 | 98.3 | 21.5 | 168.7 | 39.4 | 42.1 |
| PLA+4%N | 60.3–62.4 | 98.7 | 22.6 | 169.3 | 37.8 | 40.3 |
| PLA+8%N | 59.5–62.2 | 99.4 | 18.4 | 168.4 | 40.3 | 43.1 |
| PLA+2%NSF | 59.2–62.2 | 99.4 | 26.5 | 168.5 | 39.2 | 41.9 |
| PLA+4%NSF | 59.1–61.6 | 98.5 | 24.5 | 168.4 | 38.3 | 40.9 |
| PLA+8%NSF | 57.9–61.0 | 98.9 | 26.5 | 168.4 | 41.1 | 44.0 |
| PP | HDPE | PET | PLA | |
|---|---|---|---|---|
| Von Misses (MPa) | 0.7 ± 0.1 | 0.7 ± 0.1 | 0.7 ± 0.1 | 0.7 ± 0.1 |
| Maximum deformation (mm) | 0.32 ± 0.02 | 0.48 ± 0.05 | 0.18 ± 0.02 | 0.16 ± 0.01 |
| Safety factor | 35 ± 2 | 32 ± 5 | 56 ± 2 | 69.0 ± 2 |
| PLA+2%N | PLA+4%N | PLA+8%N | PLA+2%NSF | PLA+4%NSF | PLA+8%NSF | |
|---|---|---|---|---|---|---|
| Von Misses (MPa) | 0.7 ± 0.1 | 0.7 ± 0.1 | 0.7 ± 0.1 | 0.7 ± 0.1 | 0.7 ± 0.1 | 0.7 ± 0.1 |
| Maximum deformation (mm) | 0.16 ± 0.01 | 0.14 ± 0.01 | 0.13 ± 0.03 | 0.13 ± 0.02 | 0.12 ± 0.02 | 0.11 ± 0.03 |
| Safety factor | 78 ± 2 | 68 ± 2 | 55 ± 4 | 73 ± 2 | 68 ± 2 | 43 ± 3 |
| PP | HDPE | PET | PLA | |
|---|---|---|---|---|
| Von Misses (MPa) | 0.7 ± 0.1 | 0.7 ± 0.1 | 0.7 ± 0.1 | 0.8 ± 0.1 |
| Maximum deformation (mm) | 0.36 ± 0.02 | 0.54 ± 0.04 | 0.20 ± 0.02 | 0.18 ± 0.01 |
| Safety factor | 34 ± 3 | 31 ± 6 | 59 ± 2 | 67 ± 3 |
| PLA+2%N | PLA+4%N | PLA+8%N | PLA+2%NSF | PLA+4%NSF | PLA+8%NSF | |
|---|---|---|---|---|---|---|
| Von Misses (MPa) | 0.8 ± 0.1 | 0.8 ± 0.1 | 0.8 ± 0.1 | 0.8 ± 0.1 | 0.8 ± 0.1 | 0.8 ± 0.1 |
| Maximum deformation (mm) | 0.15 ± 0.02 | 0.15 ± 0.02 | 0.15 ± 0.03 | 0.15 ± 0.02 | 0.13 ± 0.03 | 0.12 ± 0.03 |
| Safety factor | 76 ± 3 | 66 ± 2 | 53 ± 5 | 71 ± 2 | 65 ± 3 | 41 ± 4 |
Publisher’s Note: MDPI stays neutral with regard to jurisdictional claims in published maps and institutional affiliations. |
© 2021 by the authors. Licensee MDPI, Basel, Switzerland. This article is an open access article distributed under the terms and conditions of the Creative Commons Attribution (CC BY) license (https://creativecommons.org/licenses/by/4.0/).
Share and Cite
Oliver-Ortega, H.; Tresserras, J.; Julian, F.; Alcalà, M.; Bala, A.; Espinach, F.X.; Méndez, J.A. Nanocomposites Materials of PLA Reinforced with Nanoclays Using a Masterbatch Technology: A Study of the Mechanical Performance and Its Sustainability. Polymers 2021, 13, 2133. https://doi.org/10.3390/polym13132133
Oliver-Ortega H, Tresserras J, Julian F, Alcalà M, Bala A, Espinach FX, Méndez JA. Nanocomposites Materials of PLA Reinforced with Nanoclays Using a Masterbatch Technology: A Study of the Mechanical Performance and Its Sustainability. Polymers. 2021; 13(13):2133. https://doi.org/10.3390/polym13132133
Chicago/Turabian StyleOliver-Ortega, Helena, Josep Tresserras, Fernando Julian, Manel Alcalà, Alba Bala, Francesc Xavier Espinach, and José Alberto Méndez. 2021. "Nanocomposites Materials of PLA Reinforced with Nanoclays Using a Masterbatch Technology: A Study of the Mechanical Performance and Its Sustainability" Polymers 13, no. 13: 2133. https://doi.org/10.3390/polym13132133
APA StyleOliver-Ortega, H., Tresserras, J., Julian, F., Alcalà, M., Bala, A., Espinach, F. X., & Méndez, J. A. (2021). Nanocomposites Materials of PLA Reinforced with Nanoclays Using a Masterbatch Technology: A Study of the Mechanical Performance and Its Sustainability. Polymers, 13(13), 2133. https://doi.org/10.3390/polym13132133