3.1. Functional Properties of Thickeners
Figure 2 presents the SIs and SPs of the employed thickeners. Generally, the SI of a hydrocolloid substance reflects the degree of dissolution of the dissolved matter in water during the swelling process. When the thickener granules are heated, water enters the network matrices and causes the particles to absorb water and swell. Differences in heating temperature also cause differences in SI. At all heating temperatures, SI was higher in the TS group (82.67–91.57%) and lower in the HDP group (17.56–21.26%), and the differences between the two groups were statistically significant (
p < 0.05). The SI of the TS and HDP groups increased with an increase in temperature. In addition, the SI values of the TS and HDP groups were significantly higher at 90 °C compared to those at lower processing temperatures (
p < 0.05), with the SI values being 91.57% and 21.26%, respectively.
The SP reflects the degree of swelling in the granules of the hydrocolloid substance and is a key factor that affects food quality [
27]. The SP was higher in the TS group (31.01–34.14 g/g) and lower in the HDP group (22.34–24.82 g/g) at all processing temperatures, and the difference between these groups was statistically significant at 60, 70 and 80 °C (
p < 0.05) but insignificant at 90 °C. Within each group, SP also differed with processing temperatures. SP values of the HDP group at 80 and 90 °C (23.52 g/g and 24.82 g/g, respectively) were significantly lower (
p < 0.05) than the SP values at lower processing temperatures. In the TS group, SP initially increased and then decreased. The highest SP value was 34.14 g/g at 80 °C, but different processing temperatures did not result in significant differences in SP.
As indicated in a previous study [
28], the structures of starch granules are mainly composed of radial channels formed by semi-crystalline and amorphous material. Thermal processing destroys these structures, thereby inhibiting starch swelling and delaying gelatinization. Therefore, thermal processing of starches causes a decrease in SP and a corresponding increase in SI. Previous studies have shown that the amylose and amylopectin contents of starches affect SI and SP, respectively [
29]. In addition, cross-linking reinforces the bonds in starch granules, and an increase in cross-link density causes a decrease in SI and SP [
30,
31]. Another study indicated that the SI and SP of cross-linked oat starch decreased as the degree of cross-linking increased [
32]. HDP (E-1442) is classified as modified cross-linked starch; the particular HDP used in the present study is of the tapioca origins. Its degree of cross-linkage gives a much more compact structure to constrain SP as compared to its corresponding native starch, i.e., the TS used in our formula [
30]. Other reports in such light have also been well-documented towards modifications of waxy rice and waxy maize starch [
33,
34,
35].
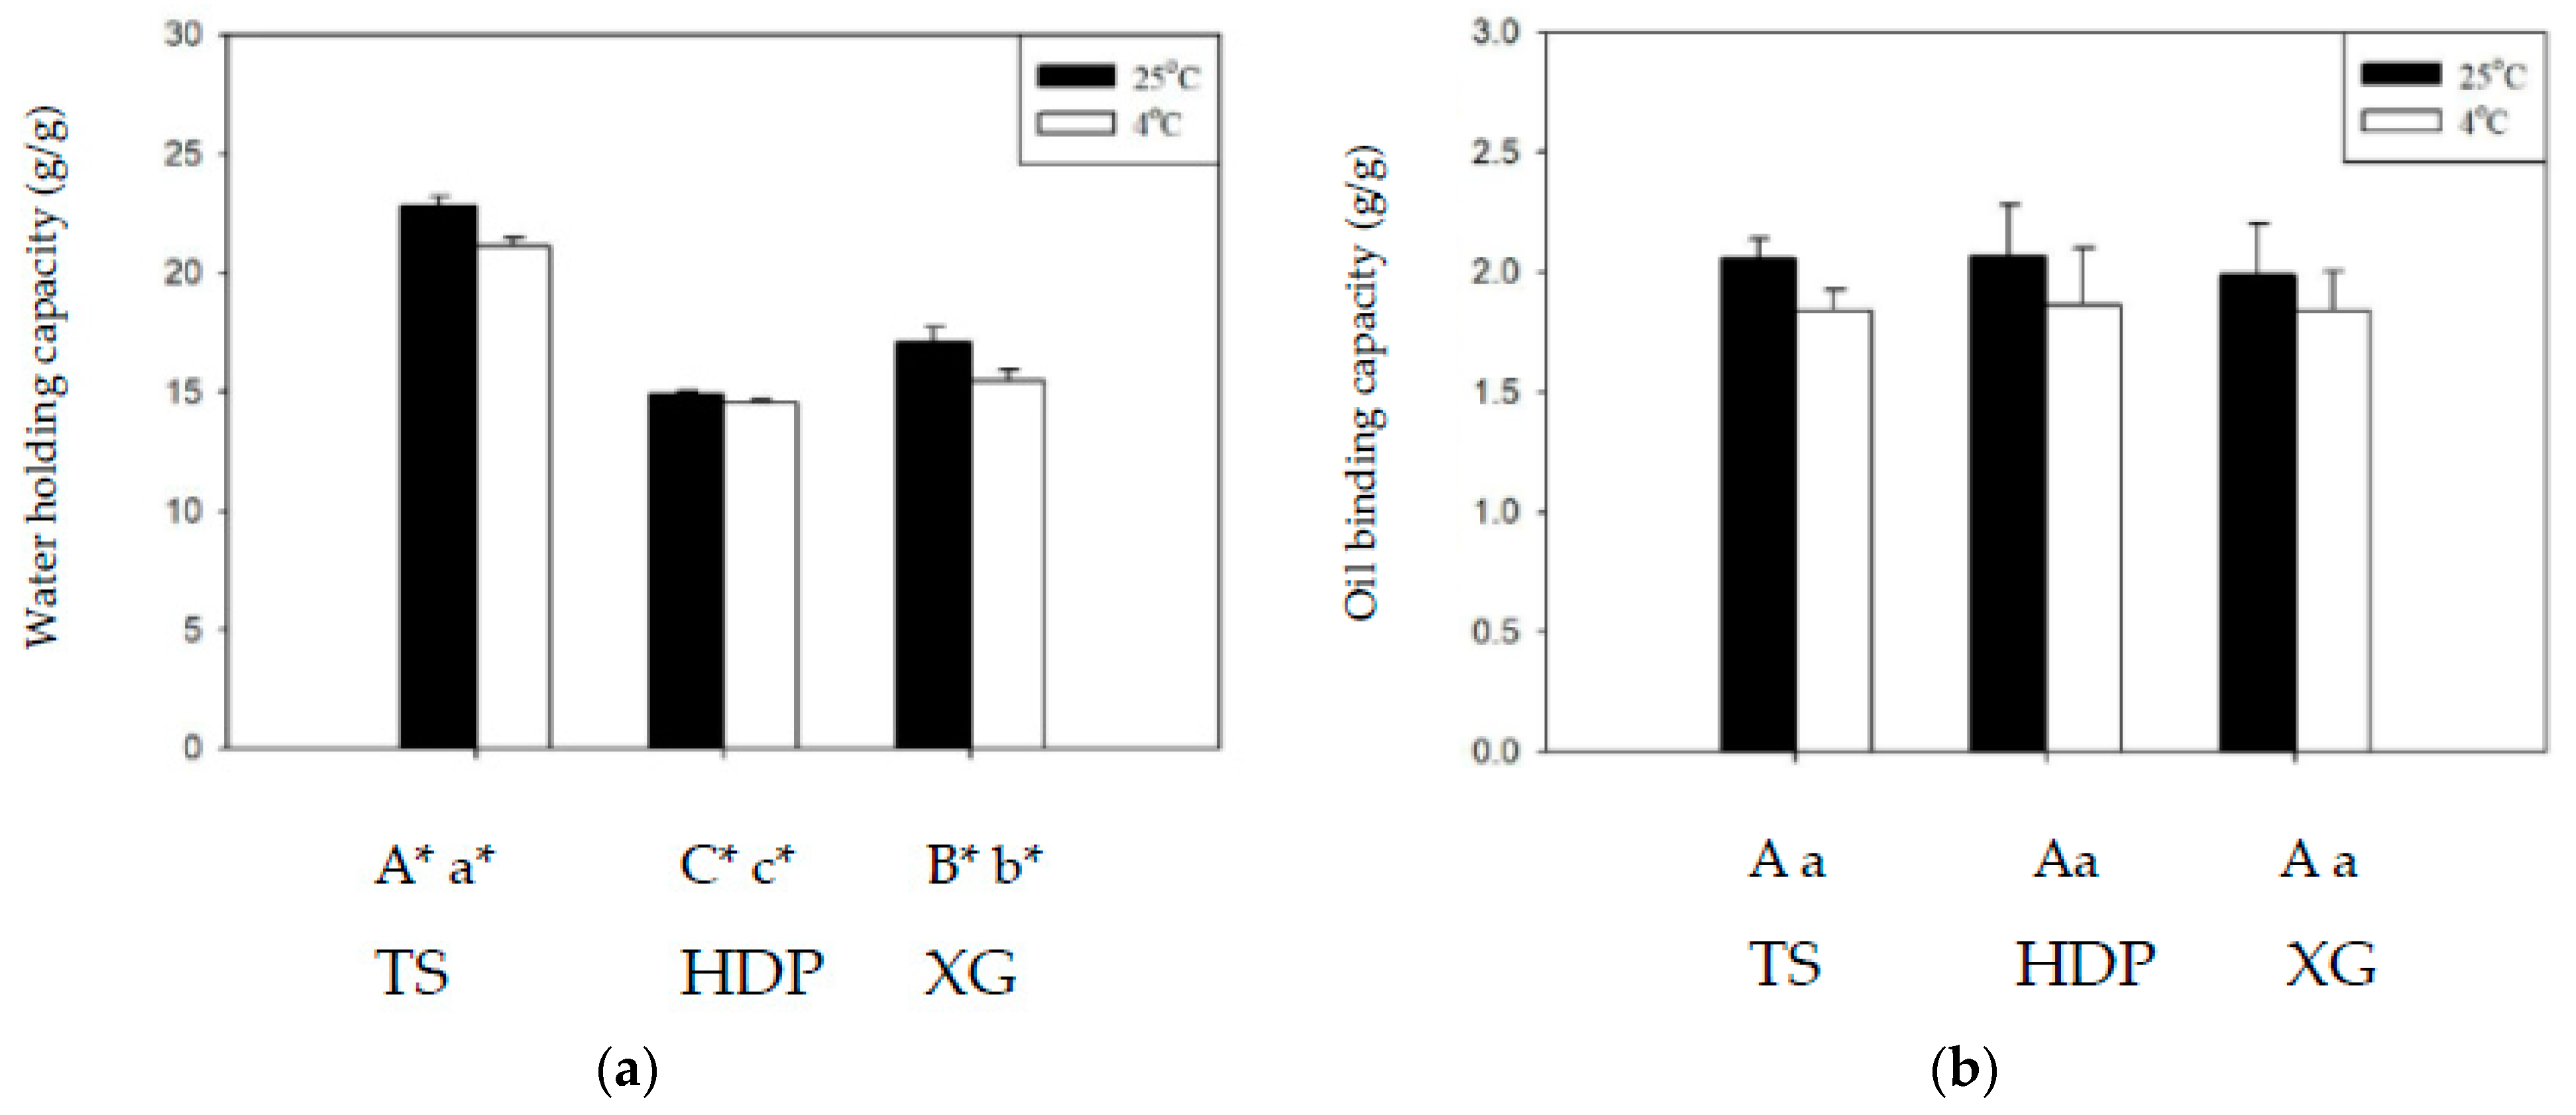
Figure 3 shows the WHC and OBC of the employed thickeners at 4 and 25 °C. Across all groups, WHC was higher at 25 °C than at 4 °C, with significant statistical differences (
p < 0.05), whereas differences in OBC at different temperatures were not statistically significant. At 25 °C and 4 °C, the TS group exhibited the highest WHC values of 22.81 g/g and 21.12 g/g, whereas the lowest values of 14.88 g/g and 14.57 g/g, respectively, were obtained for the HDP group, with statistically significant (
p < 0.05) differences between these groups. With regard to OBC, the HDP group had the highest values of 2.07 g/g and 1.86 g/g, and the TS group had the lowest values of 2.06 g/g and 1.84 g/g, at 25 °C and 4 °C, respectively, with statistically insignificant differences between these groups. Cross-linking modifications of starches enable the reduction in retrogradation at low temperatures, but also result in a decrease in clarity and WHC [
36]. Proteins in starches affect OBC as the hydrophobic amino side chains of proteins can form bonds with lipids [
27,
28,
29,
30].
Previous research had mainly adopted SI, SP, WHC, and OBC as the functional characteristics of starches or starch-hydrocolloid gel mixtures, with few studies performing measurements on pure hydrocolloid gels. In the present study, we compared the differences between XG and the other two types of starches. The SI of the XG group decreased with an increase in temperature, with the highest value of 50.85% achieved at 60 °C. At 60, 70, and 80 °C, differences in SI between the XG and HDP groups were statistically significant (p < 0.05); at 90 °C, the difference in SI between the XG and TS groups was statistically significant (p < 0.05) but the difference with the HDP group was statistically insignificant. The SP of the XG group exhibited an initial increase and subsequent decrease as the temperature increased, reaching the highest value of 21.99 g/g at 80 °C. At 60, 70, and 80 °C, differences in SP were statistically significant between the XG and TS groups (p < 0.05) and statistically insignificant between the XG and HDP groups; at 90 °C, differences in SP among the three groups were not statistically significant. The WHC values of the XG group at 25 and 4 °C were significantly different from those of the TS and HDP groups (p < 0.05), but differences in OBC at both temperatures were not significant. In general, the values of the functional characteristics (SI, SP, WHC, and OBC) of XG were between those of TS and HDP. Our present study also indicates that XG can be considered as a refined candidate to be employed as long as the aforementioned physicochemical properties, except OBC, require minor adjustment to meet certain specifications that are not able to be achieved using HDP or TS alone.
3.2. Weight-Dependent Apparent Viscosity with Respect to Different Thickeners
Thickened fluid matrices can assist in the safe consumption of liquids by dysphagia patients. Apparent viscosity may be used as a criterion for classifying and determining the stability of thickened liquids [
37].
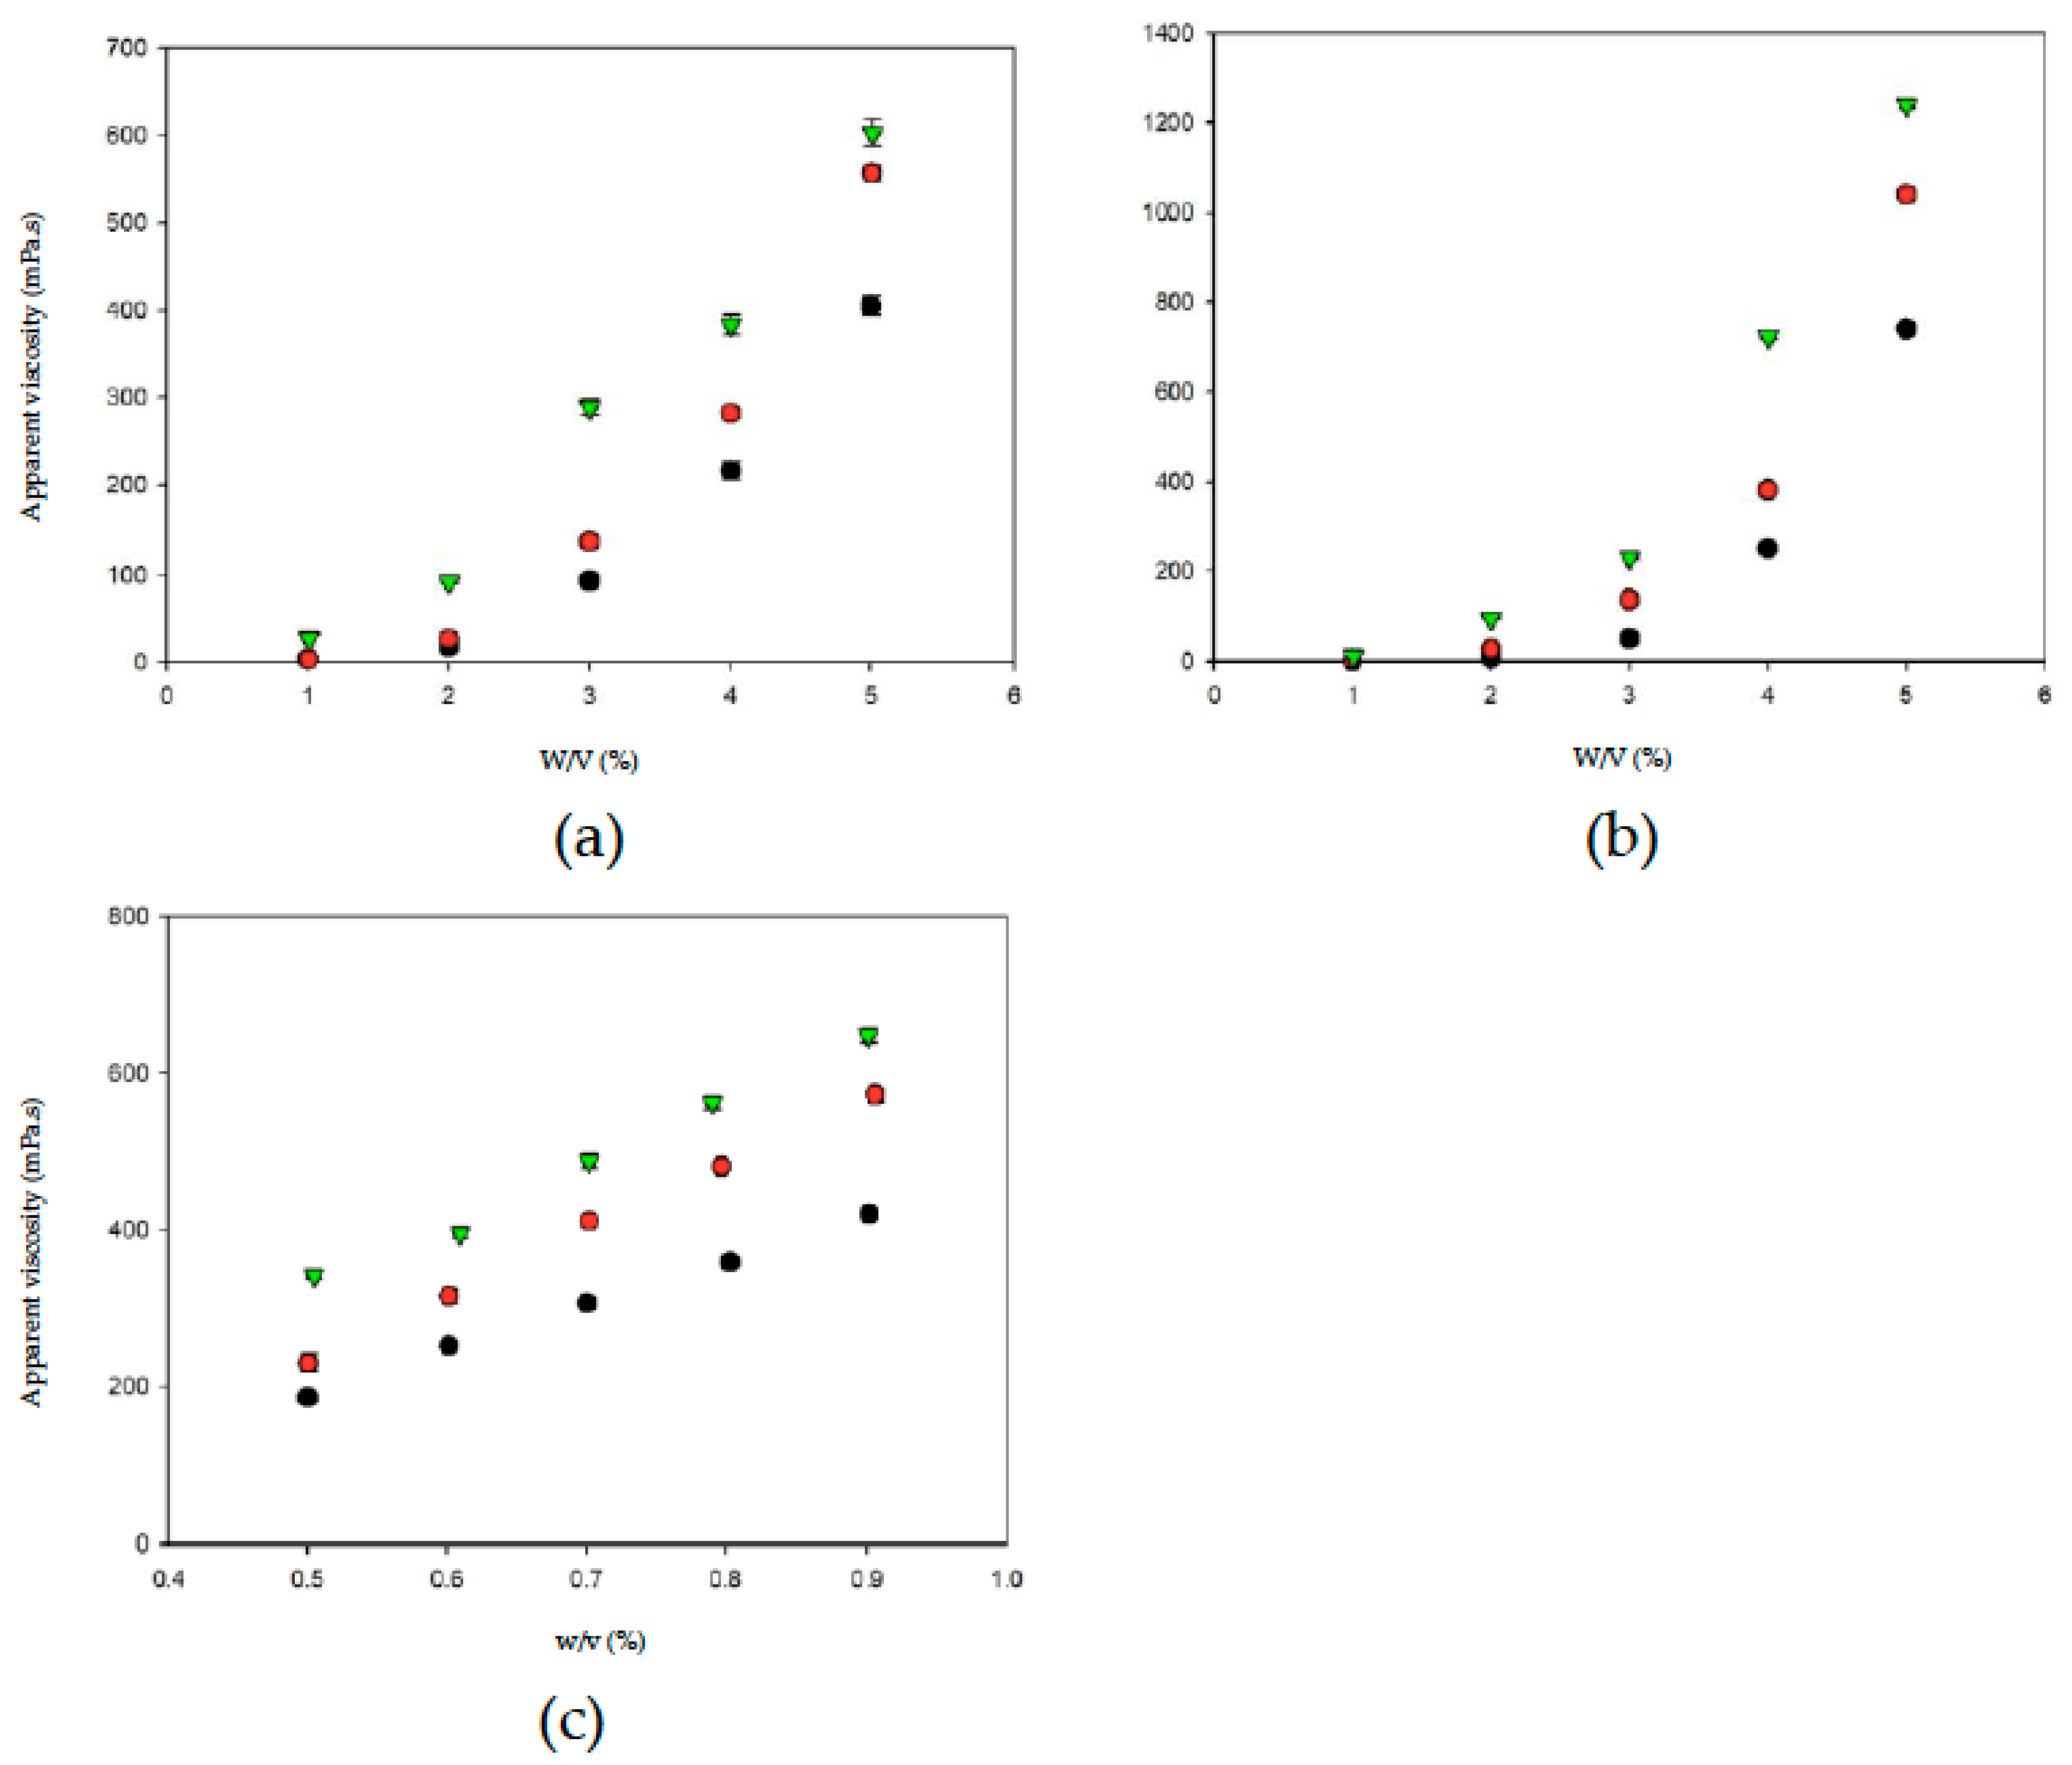
Figure 4 shows the relationships between thickener weight and apparent viscosity in different aquatic continuous phases/bases. With the same thickener weight, OJ exhibited the highest degree of thickening, followed by the SD and DW. When the thickener weight increased, the apparent viscosities of the thickened aquatic continuous phases/bases showed different tendencies of increase. The change in apparent viscosity followed a power tendency in continuous bases thickened with TS or HDP and a linear tendency in continuous bases thickened with XG, as shown in
Table 1. In general, with the same thickener weight, the degree of thickening was higher in continuous bases with XG followed by HDP and TS; with the same type of thickener, the degree of thickening was higher in OJ followed by SD and DW. The results described above indicate that the apparent viscosity of food products increases with an increase in the amount of thickener used, which is consistent with the results of previous studies that investigated the viscosity stability of TS and the viscosities of aqueous XG solutions at different concentrations [
38,
39].
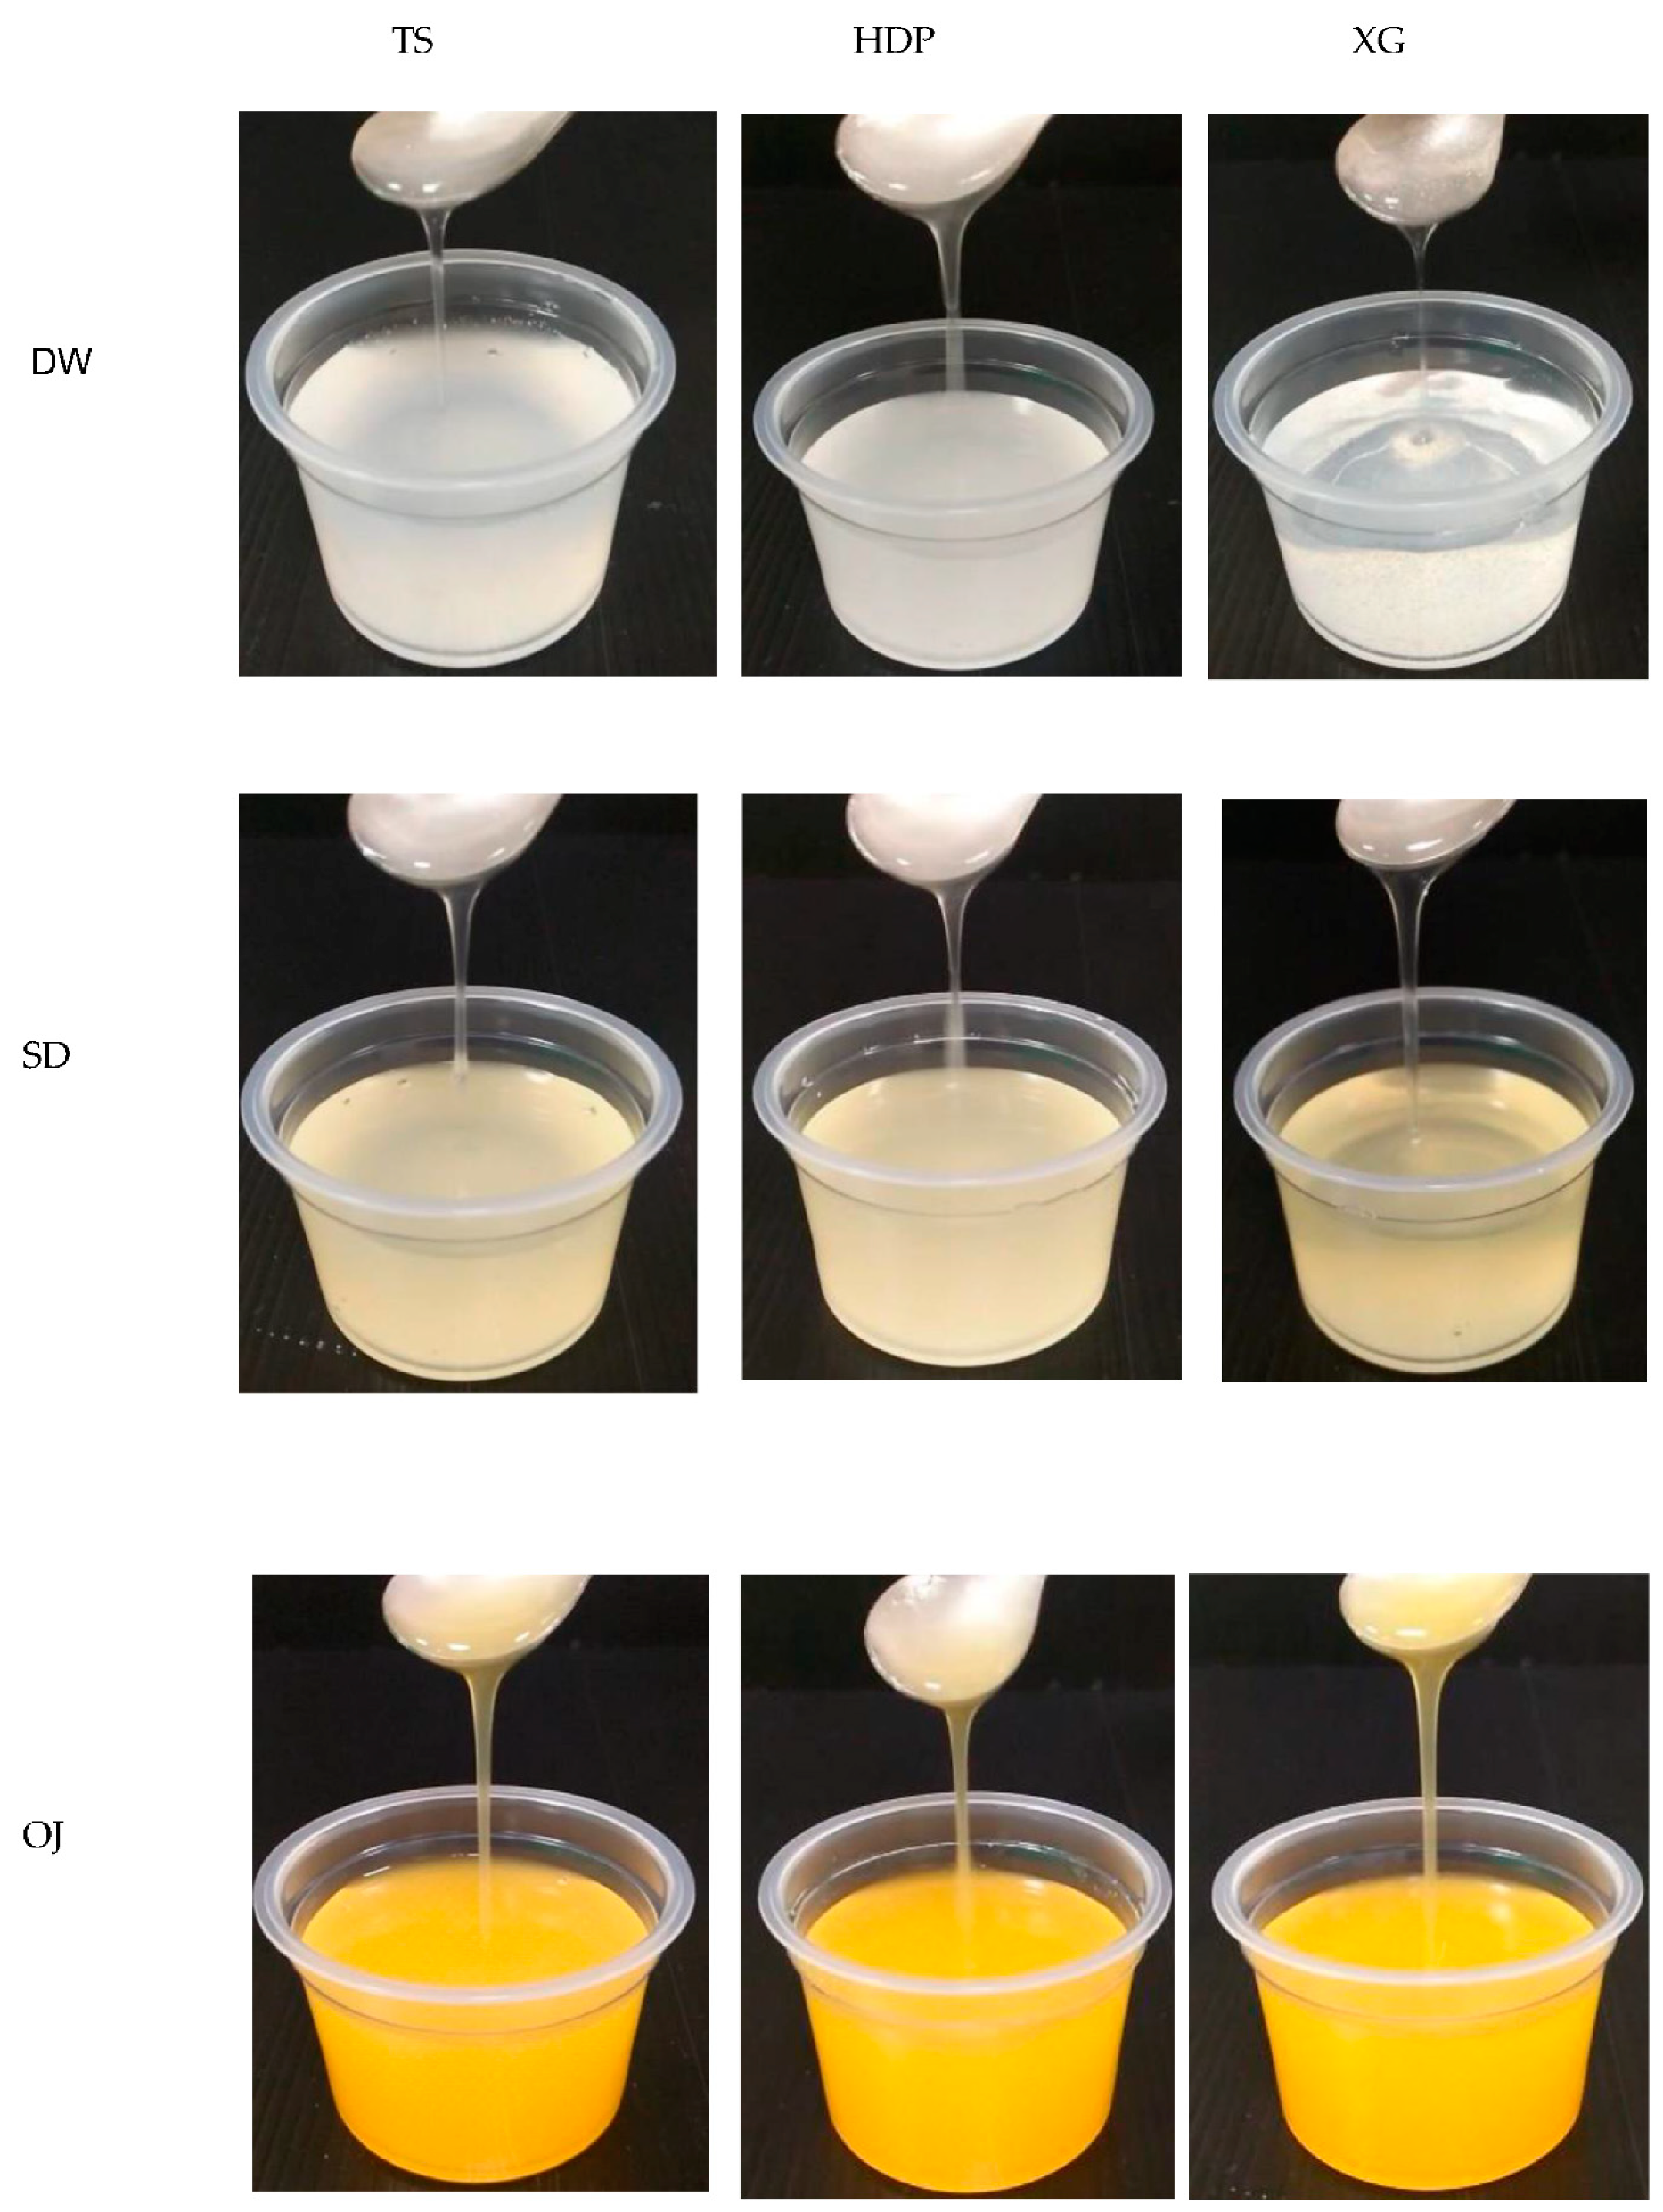
Table 2 and
Figure 5 show the formulas and appearance traits of the prepared thickened continuous bases, respectively. We have previously reported that 10.40 g of germ rice flour and a proximal amount of XG per 100 mL of distilled water achieves a nectar-like consistency [
22]. The present results indicate that the TS sample starch used is in a more condensed form (3.374–4.505 g) in terms of capability to associate water molecules for consistency promotion. The results of a survey on the use of thickened liquids in long-term care facilities showed that, among the residents receiving thickened liquids, approximately 60% received nectar-thick liquids, 33% received honey-thick liquids, and 6% received pudding-thick liquids [
40]. Therefore, the apparent viscosity of the thickened continuous bases in this study was constrained at 300 ± 20 mPa.s to achieve a nectar-like consistency for ongoing experimentations as detection limits of facilitate apparatus and feasibility of product attributes.
3.3. Flow Properties of Formulated Nectar-Like Fluids
Previous studies have shown that fluid characteristic parameters such as flow behavior index (n), consistency index (K), and yield index (σ
0) are related to the swallowing process [
24,
41,
42]. In particular, K is related to the speed of the food bolus movement, n is related to the oral sensation of the food bolus smoothness, and σ
0 is related to the ease of swallowing of food boluses [
43,
44].
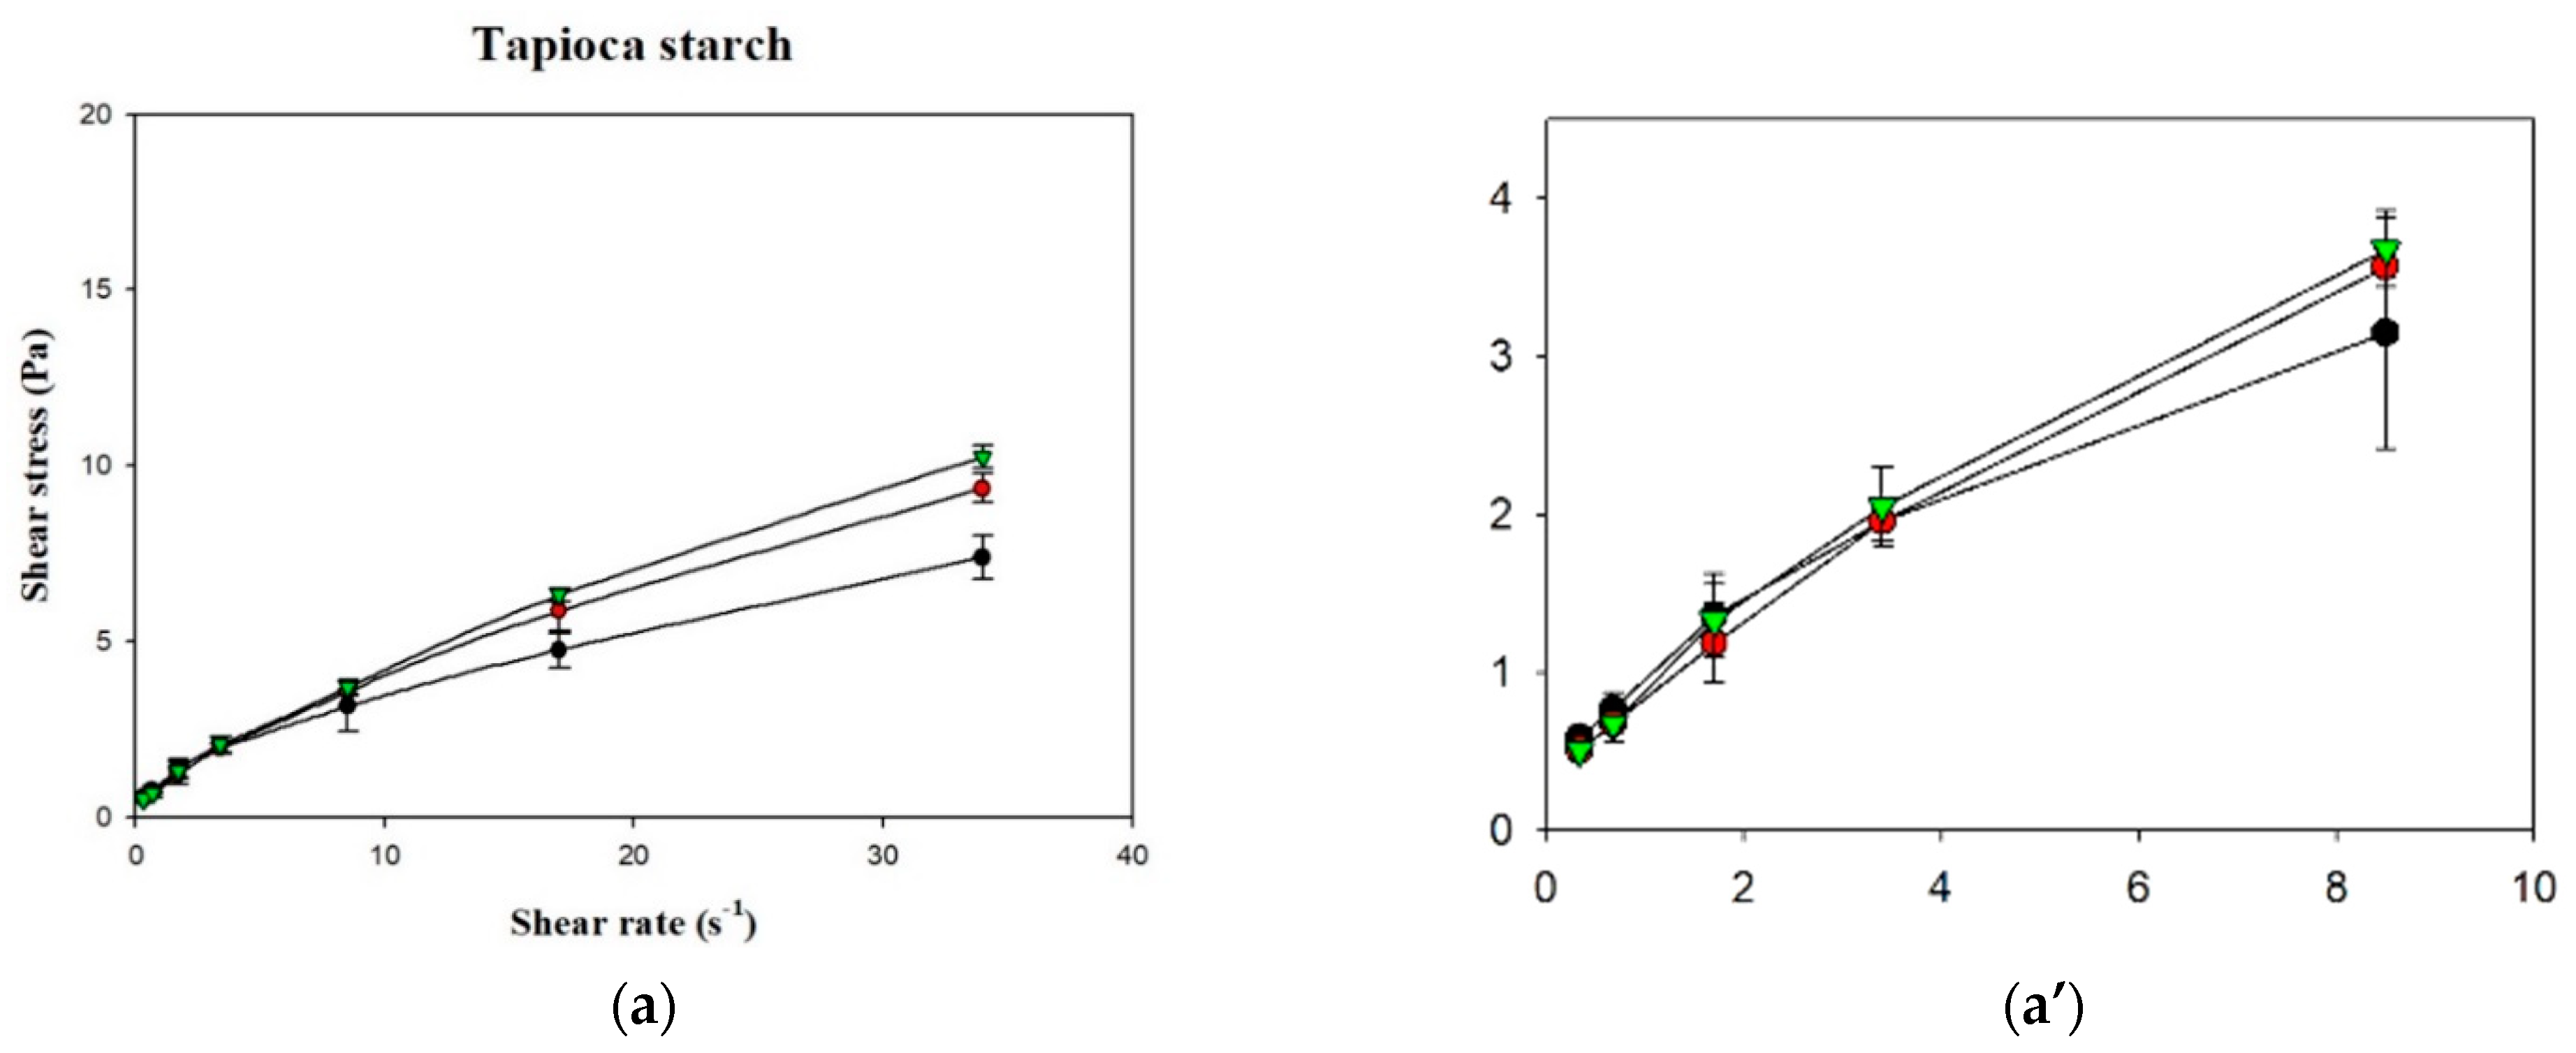
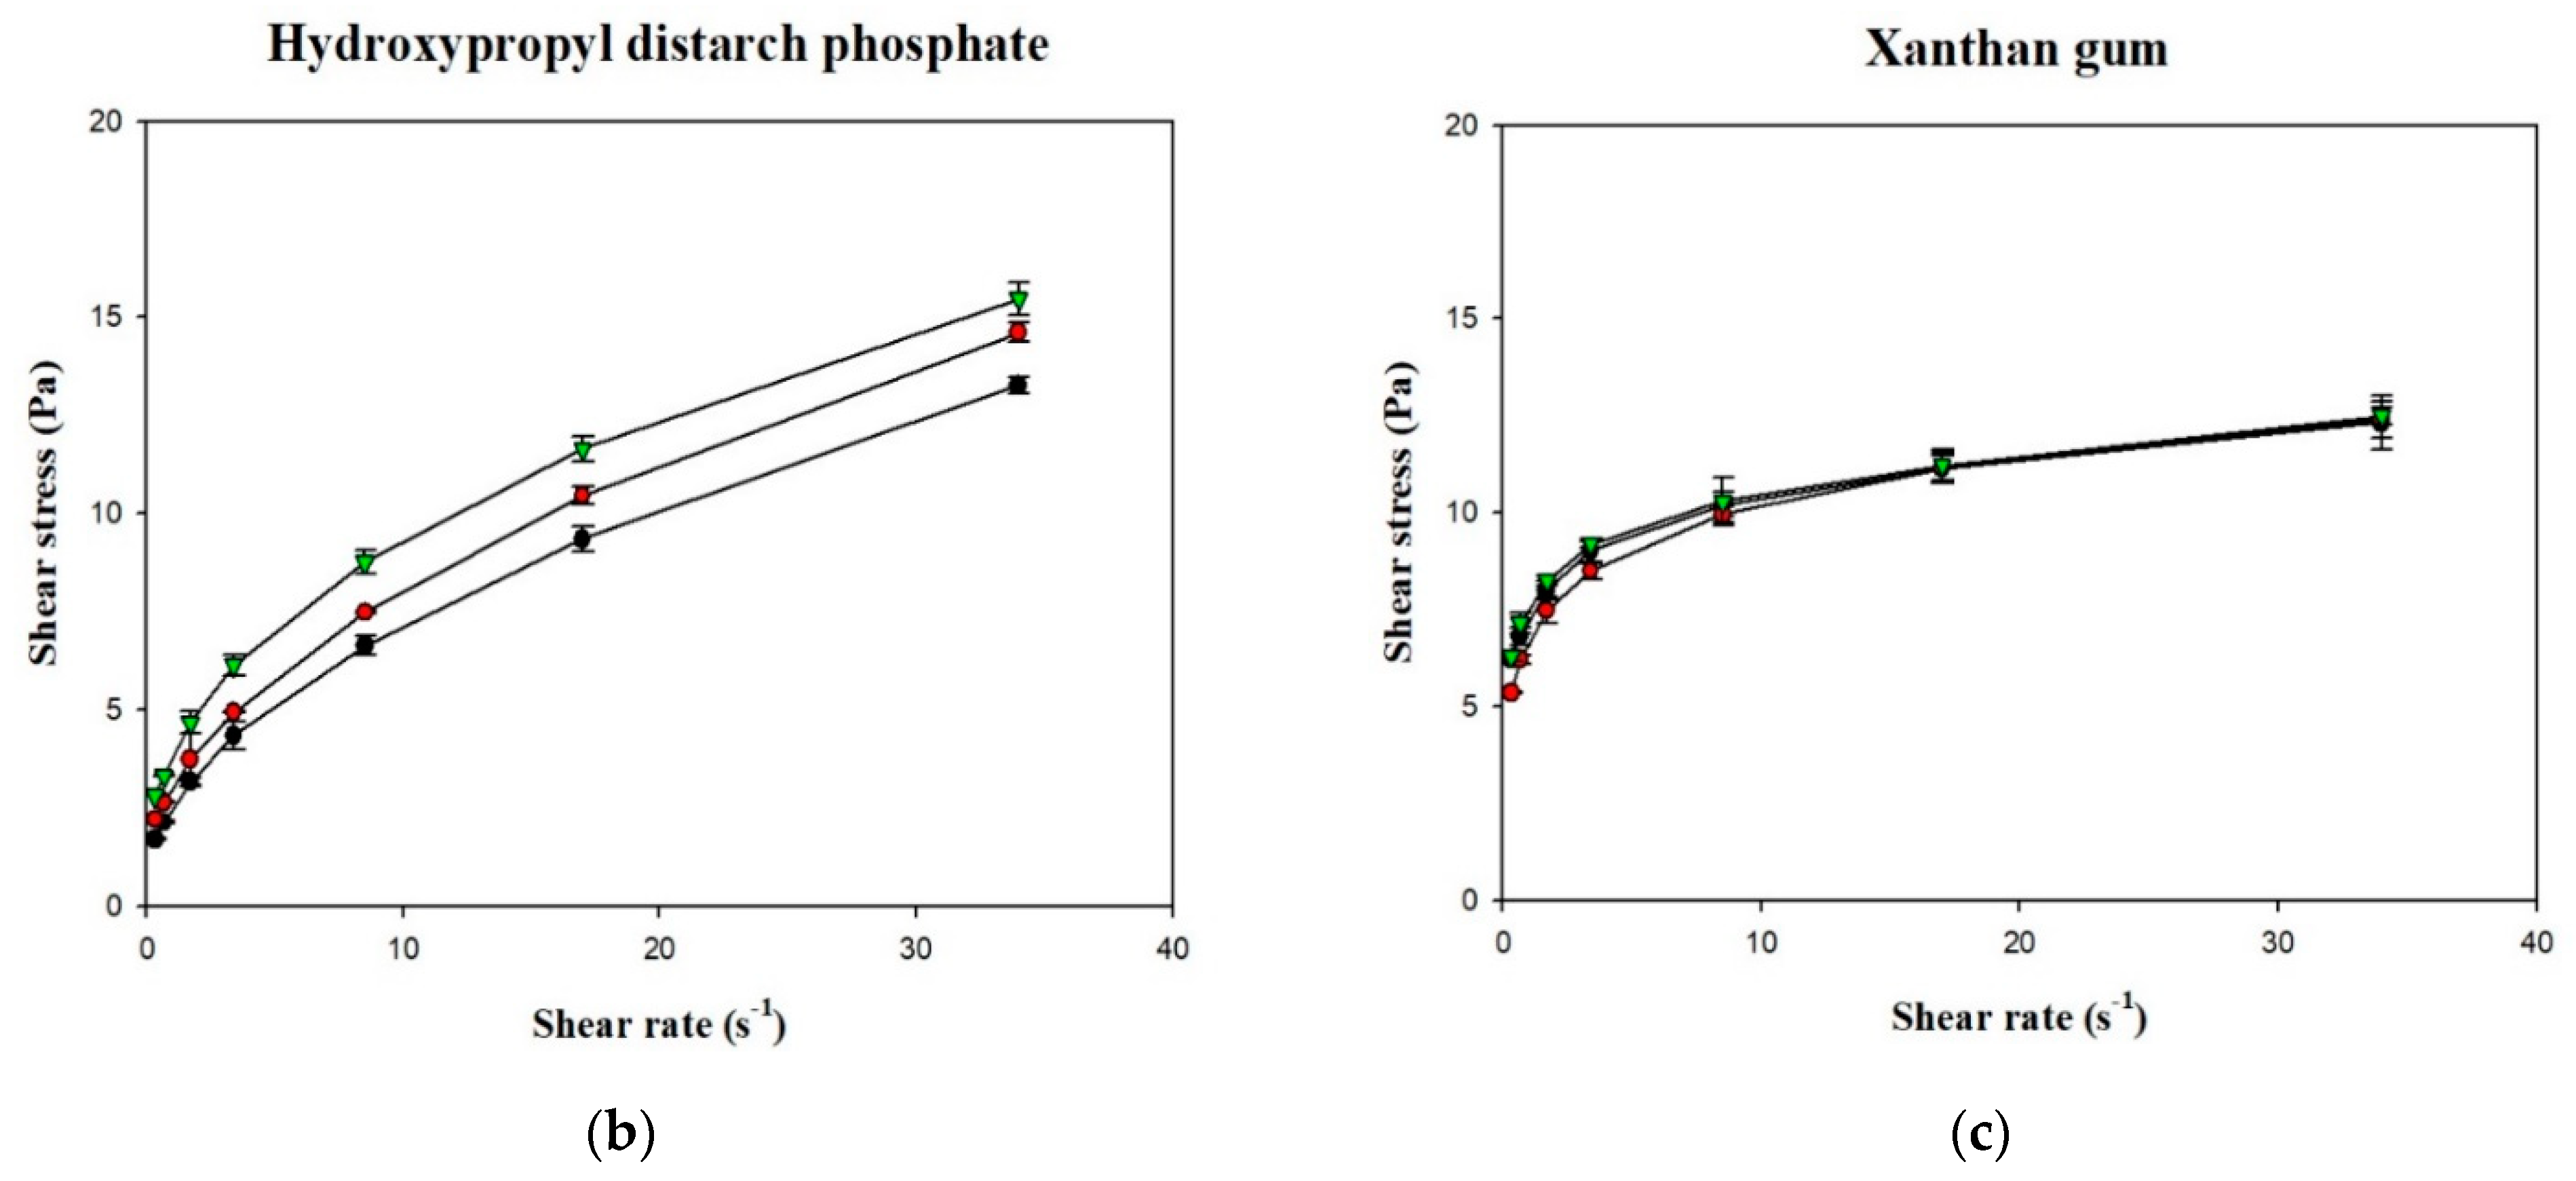
Figure 6 shows the shear stress-shear rate curves of the various samples plotted using measurements obtained with a rotational viscometer. It can be seen that the curves for the various groups were non-linear with an intercept on the vertical axis (shear stress), which indicates that the liquids were non-Newtonian fluids with a yield stress. Using the Herschel–Bulkley model, the values of n, K, and σ
0 were calculated, as shown in
Table 3. Although R
2 of the various groups ranged from 0.9987 to 0.9999, the groups in which XG was used as the thickener had σ
0 values <0, which shows that the Herschel–Bulkley model is not applicable for XG-thickened continuous bases. Therefore, by adopting the method proposed by Yoon and Yoo [
10], the power law was used for the calculation of n and K and the Casson model was used for the calculation of σ
0, as shown in
Table 4. It was found that the K and σ
0 values were higher in continuous bases thickened with XG and lower in continuous bases thickened with HDP. The opposite tendency was observed with the n values, which were higher in continuous bases thickened with TS followed by continuous bases thickened with HDP and XG. With the same beverage base, the K, n, and σ
0 values significantly differed among the various groups (
p < 0.05). When TS was used as the thickener, the DW group had the highest K and σ
0 values of 0.9334 Pa·s
n and 0.4047 Pa, respectively, and the lowest n value of 0.5835. K was significantly higher in the DW group compared to the other two groups (
p < 0.05), and σ
0 and n significantly differed among the three groups (
p < 0.05). When HDP was used as the thickener, the OJ group had the highest K and σ
0 values of 3.8295 Pa·s
n and 2.4338 Pa, respectively, and the lowest n value of 0.3940. The n value of the OJ group was significantly lower than that of the other two groups (
p < 0.05), and σ
0 and K significantly differed among the three groups (
p < 0.05). When XG was used as the thickener, the OJ group exhibited the highest K and σ
0 values of 7.5538 Pa·s
n and 6.6054 Pa, respectively, and the lowest n value of 0.1432. The SD group had a significantly lower σ
0 value (
p < 0.05) and a significantly higher n value compared with the other two groups, and K was significantly different among the various groups (
p < 0.05).
Fluids with n < 1 exhibit shear-thinning behavior. In the present study, the n values of the various thickened continuous bases ranged from 0.1432 to 0.7048, indicating that thickened continuous bases prepared by thickening DW, SD, and OJ with TS, HDP and XG were non-Newtonian fluids with shear-thinning characteristics. R2 ranged from 0.9970 to 0.9997 for K and n values obtained using the power law and from 0.9120 to 0.9958 for σ0 values obtained using the Casson model, which shows that the power law and Casson models could adequately describe the fluid characteristics of the thickened continuous bases prepared in this study.
In addition, it can be observed that K was positively correlated with σ
0 and negatively correlated with n, which is similar to the fluid characteristics of the TS matrices investigated by Chen and Ramaswamy [
25]; they measured the flow curves of native tapioca starch using a different brand name of rotational viscometer (Haake Model RV20) and an MV1 spindle considered comparable to our present study. The concentration used in their study is 4%
w/
v, which is close to our TS-containing sample incorporated into DW (4.505 g/100 mL); however, our TS is a commercial product which had been pre-gelatinized. Therefore, their experimental setup involved the hydrothermal cooking process up to 40 min for modeling the flow curves. The models used in their study are identical to our study. As for the Herschel–Bulkley model, our TS–DW matrices show a good agreement with their time-dependent modeling results: K ranging 0.64–1.08, n ranging 0.42–0.78; however, our σ
0 (0.2328) falls beyond their reported lower range (0.41–0.95). As aforementioned, yield index, σ
0, is related to the ease of swallowing of food boluses [
43,
44]. The commercial TS we employed would be better suited for dysphagia-friendly application. We also noted that the R
2 values studied by Chen and Ramaswamy [
25], ranging 0.95–0.99, compared to our values ranging 0.9987–0.999; nevertheless, there should not be a clue of better regression results of ours because their experimental framework regarding TS flow curve determination facilitated a more stretched shear rate range up to 200 s
−1.
These results are also in agreement with the results of a study on the fluid characteristics of thickened infant formula prepared with commercial thickeners [
10]. Yoon and Yoo [
10] reported the rheological behavior of thickened infant formula prepared with XG for dysphasia infants; their formulated matrices contained ions of calcium, phosphate, magnesium, iron, zinc, copper, and iodine with an XG-based concentration of at least 1%, which is greater than our inclusive concentration (0.467–0.694%). We noted that they have also fitted to the power law and Casson model, and the fitness index of R
2 was reported to be over 0.95. The flow behavior index modeled by power law of the 1% combined thickener-base containing XG, guar gum, and dextrin (ratio not revealed) gives a considerable low value of 0.24, which is comparable to our XG-containing fluid matrices regardless of the use of DW, SD, or OJ bases with values ranging 0.14–0.18, an indication of better smoothness of mouthfeel.
3.4. Rheological Behaviors of Formulated Nectar-Like Fluids
The rheological behaviors of the samples were analyzed using a dynamic rheometer, and the analysis was carefully performed within the linear viscoelastic range to ensure that sample structures were not destroyed by the applied stress or strain.
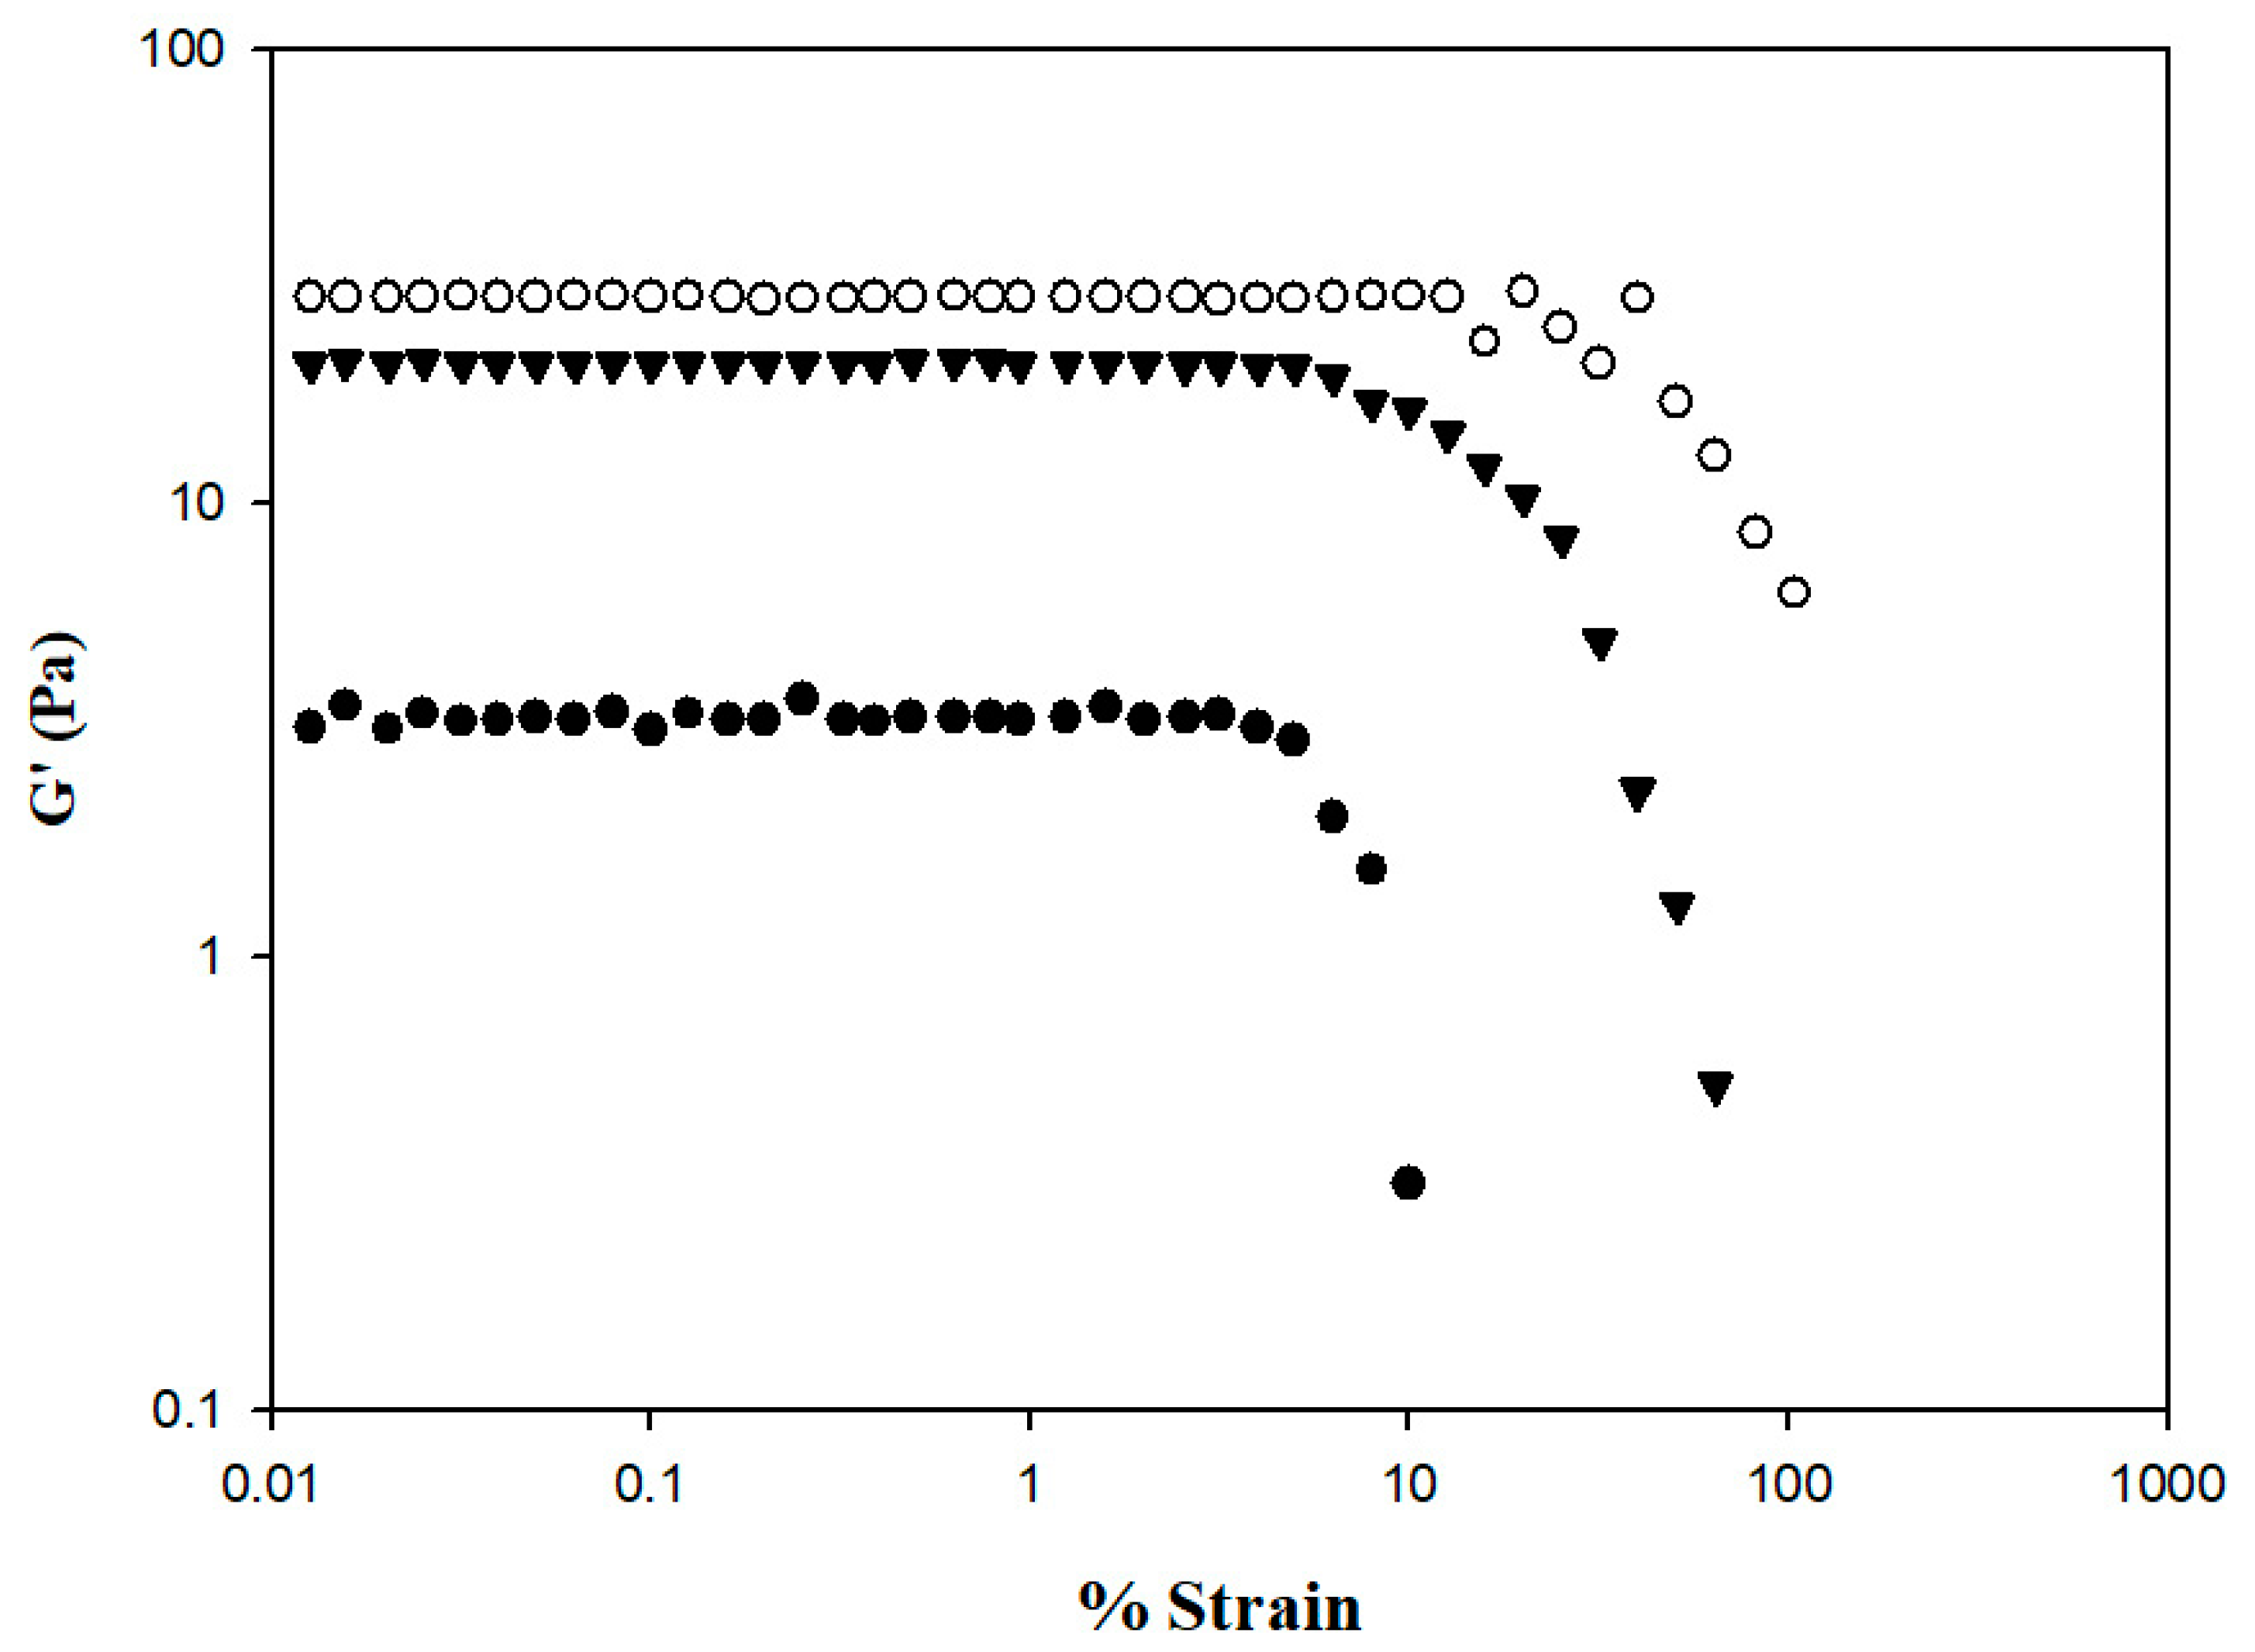
Figure 7 shows the changes in storage modulus (G′) from 0.01 to 100% strain. At the same % strain value, HDP-thickened SD exhibited the highest G′ value, followed by the XG- and TS-thickened SD. The G′ of the TS-thickened liquid exhibited a sharp decrease starting from a % strain value of approximately 4.99; a similar tendency was observed in the XG-thickened liquid starting from a % strain value of approximately 6.32. The G′ of the HDP-thickened liquid started to fluctuate at a % strain value of approximately 15.85 and in sequence decreased, indicating that the linear viscoelastic limit had been reached. Therefore, the subsequent temperature, time, and frequency sweeps for viscoelasticity measurements of samples were performed at 0.1% strain. Bi et al. have reported a strain sweep case of 0.25%
w/
v XG (G810381, USP grade) that allows us to make it possible as good reference [
45]; the linear viscoelastic range is between % strain of 0.1 up to certain values between 1–10 with G′ falling between 10–100. The linear viscoelastic range of our XG–DS matrices is comparable to this previous study. We would like to remark that the rheological behavior of XG can be varied from one commercial source to another, even though their molecular weight is stated somewhat between 800–1000k Dalton (E-415); it is also necessary to report that in the case of Bi et al., deionized water was used, whereas we used distilled water instead. Therefore, as discussed, we would consider and be confident that the ongoing rheological behaviors we conducted should be considerably reliable.
3.4.1. Behaviors Affected by Thermal and Possible Mechanical Processes
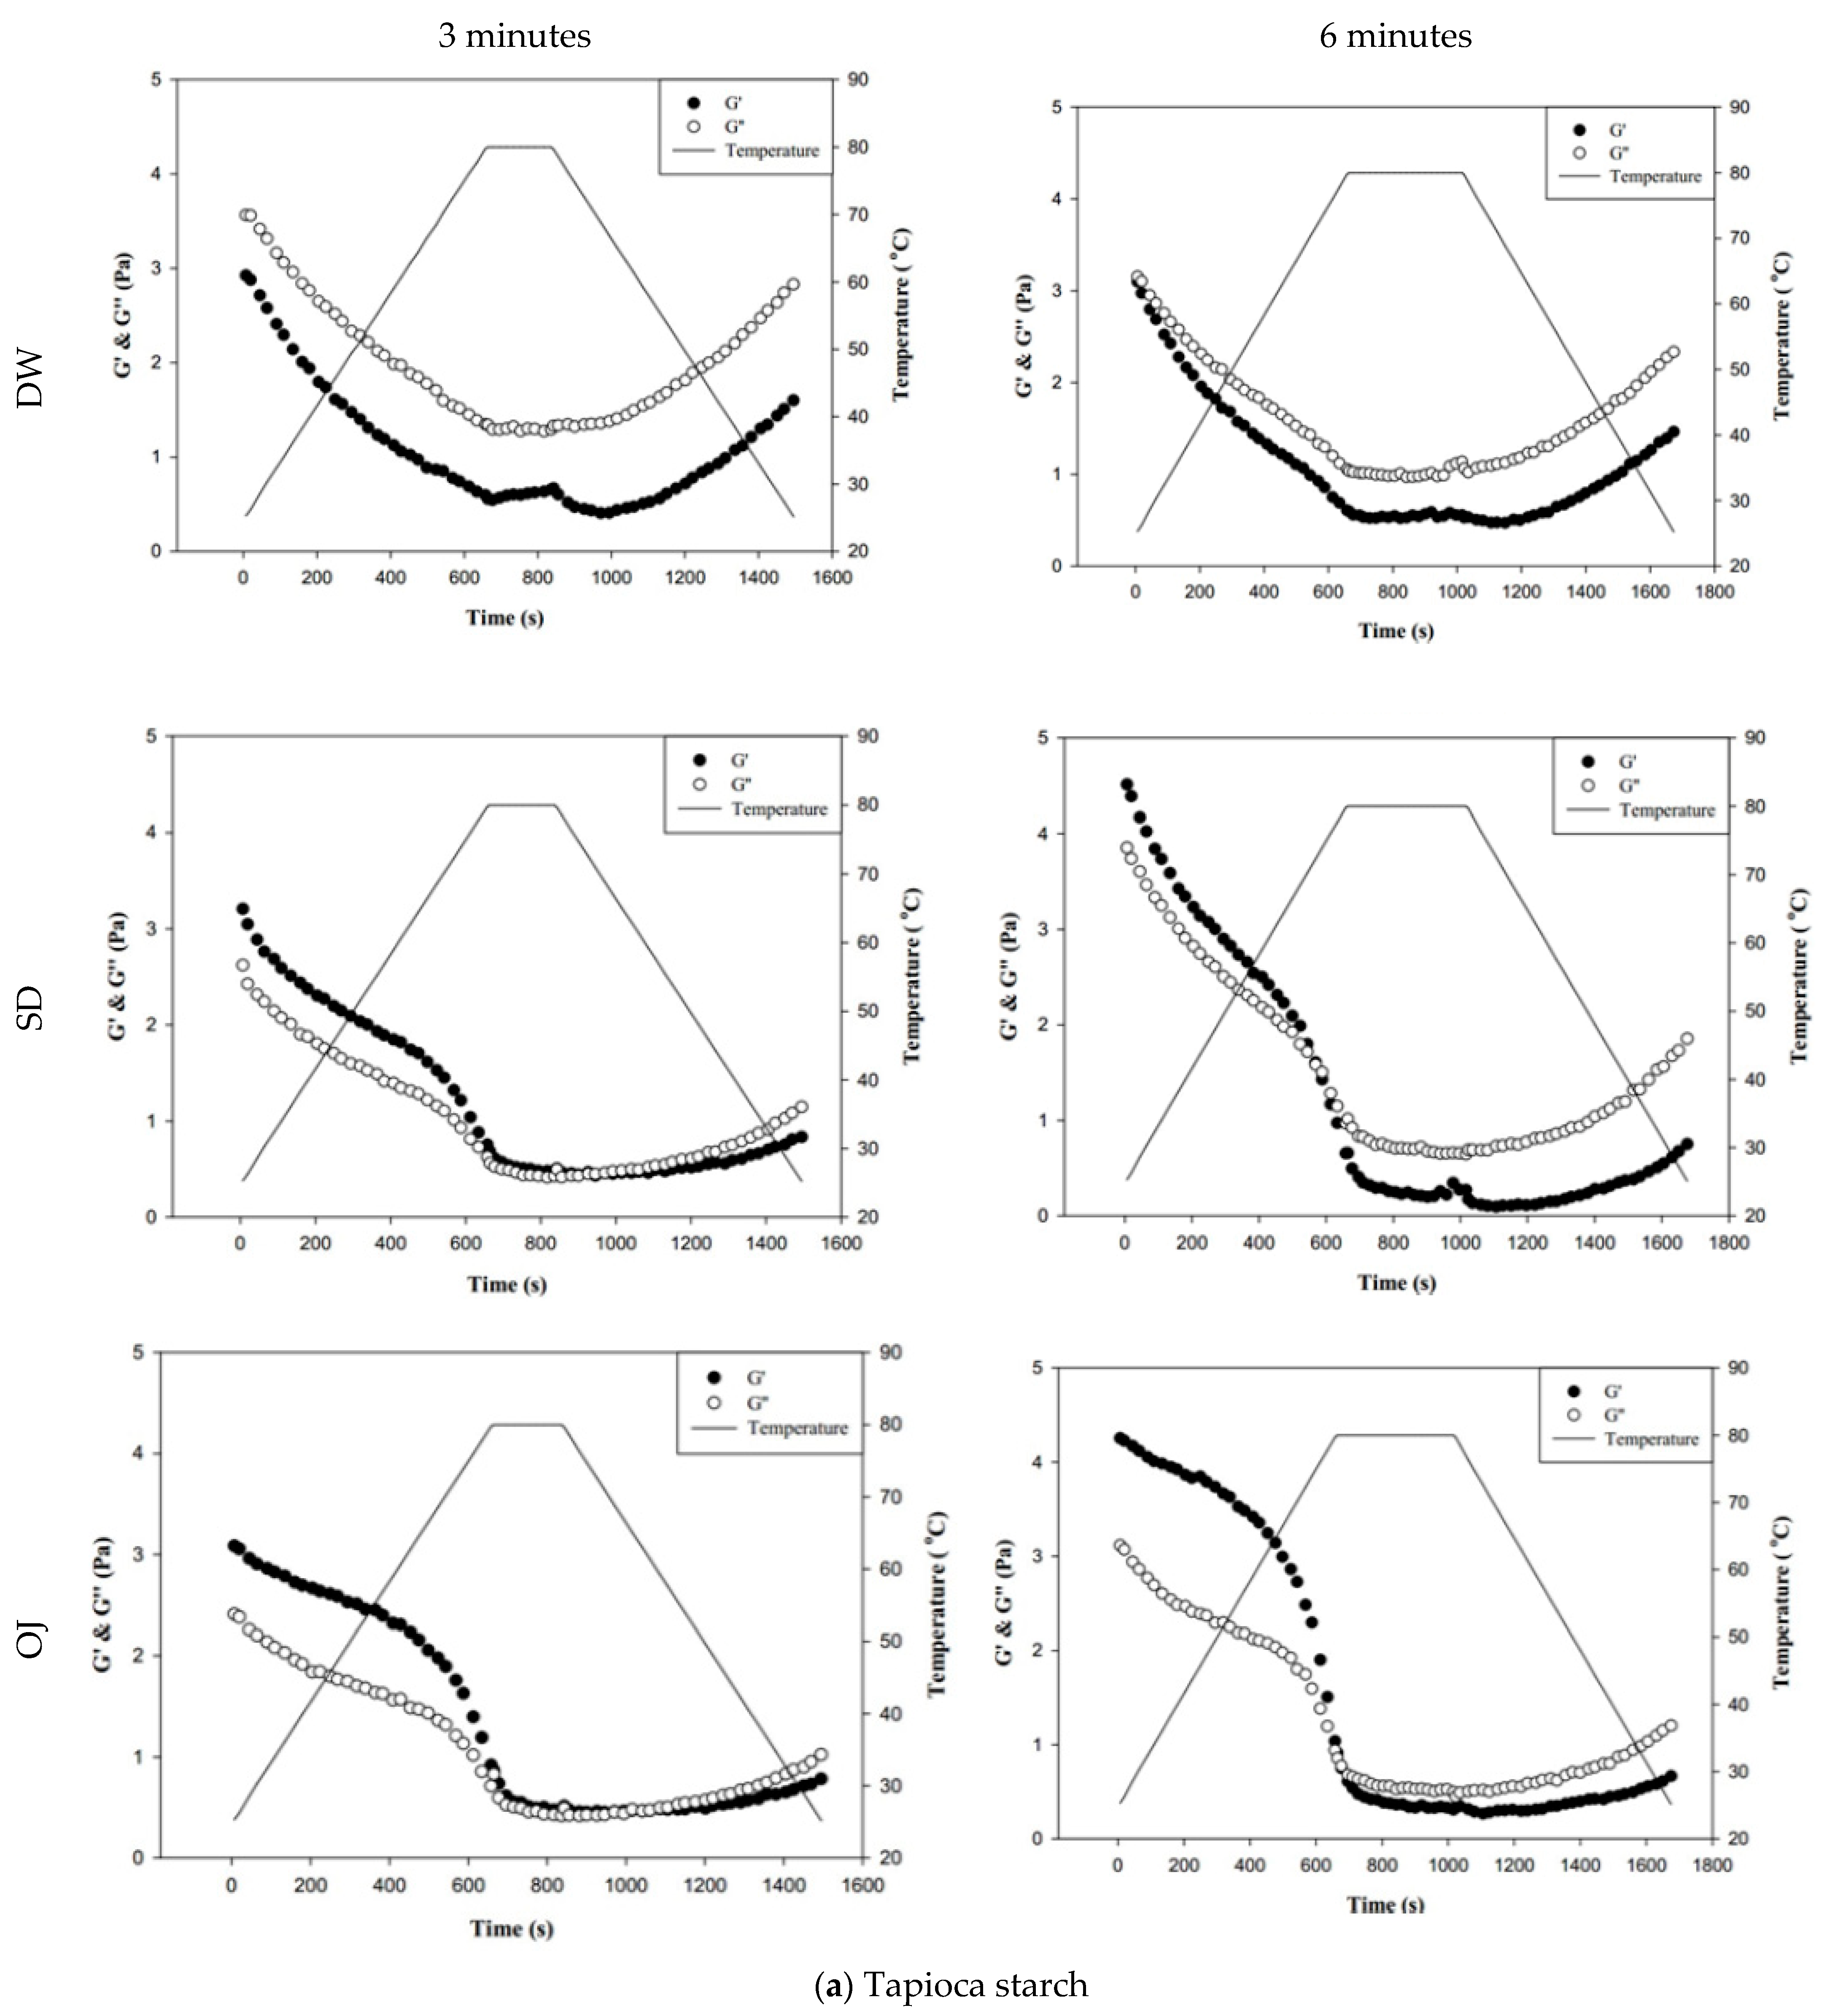
Figure 8 shows the changes in fluid properties of the various thickened continuous bases during thermal processing; the significances between the corresponding G′
initial and G′
end values, and the G″
initial and G″
end values of the thickened fluid matrices are indicated by the colored triangles in
Figure 8.
Figure 8-a indicates the changes in fluid properties of TS-thickened continuous bases during thermal processing. When DW was used as the fluid base, the G′
end and G″
end values of the TS-thickened liquid were lower than the G′
initial and G″
initial values, which indicates that the thermal processing decreased the elastic and viscous characteristics of the thickened liquid. The G′
end values of both the 3 min and 6 min processing groups were significantly lower than the corresponding G′
initial values (
p < 0.05), but there were no significant differences in G″
end and G″
initial. In addition, G″ was always higher than G′ during thermal processing, which indicates viscous characteristics during processing. When SD was used as the fluid base, the G′
end and G″
end values of the TS-thickened liquid were significantly lower than the G′
initial and G″
initial values. The G′ values of both the 3 min and 6 min processing groups were higher than the corresponding G″ values at the initial stage, indicating elastic characteristics. During the late stage of processing, the G″ values were higher than the G′ values, which indicates viscous characteristics. Therefore, it can be deduced that phase transition occurred during thermal processing, as shown in
Figure 8. When OJ was used as the fluid base, the G′
end and G″
end values of the TS-thickened liquid were significantly lower than the G′
initial and G″
initial values (
p < 0.05). The fluid properties of the thickened OJ showed a tendency similar to that of thickened SD, with the G′ values of both the 3 min and 6 min processing groups higher than the corresponding G″ values at the initial stage and the G″ values higher than the G′ values after the phase transition from elastic to viscous characteristics.
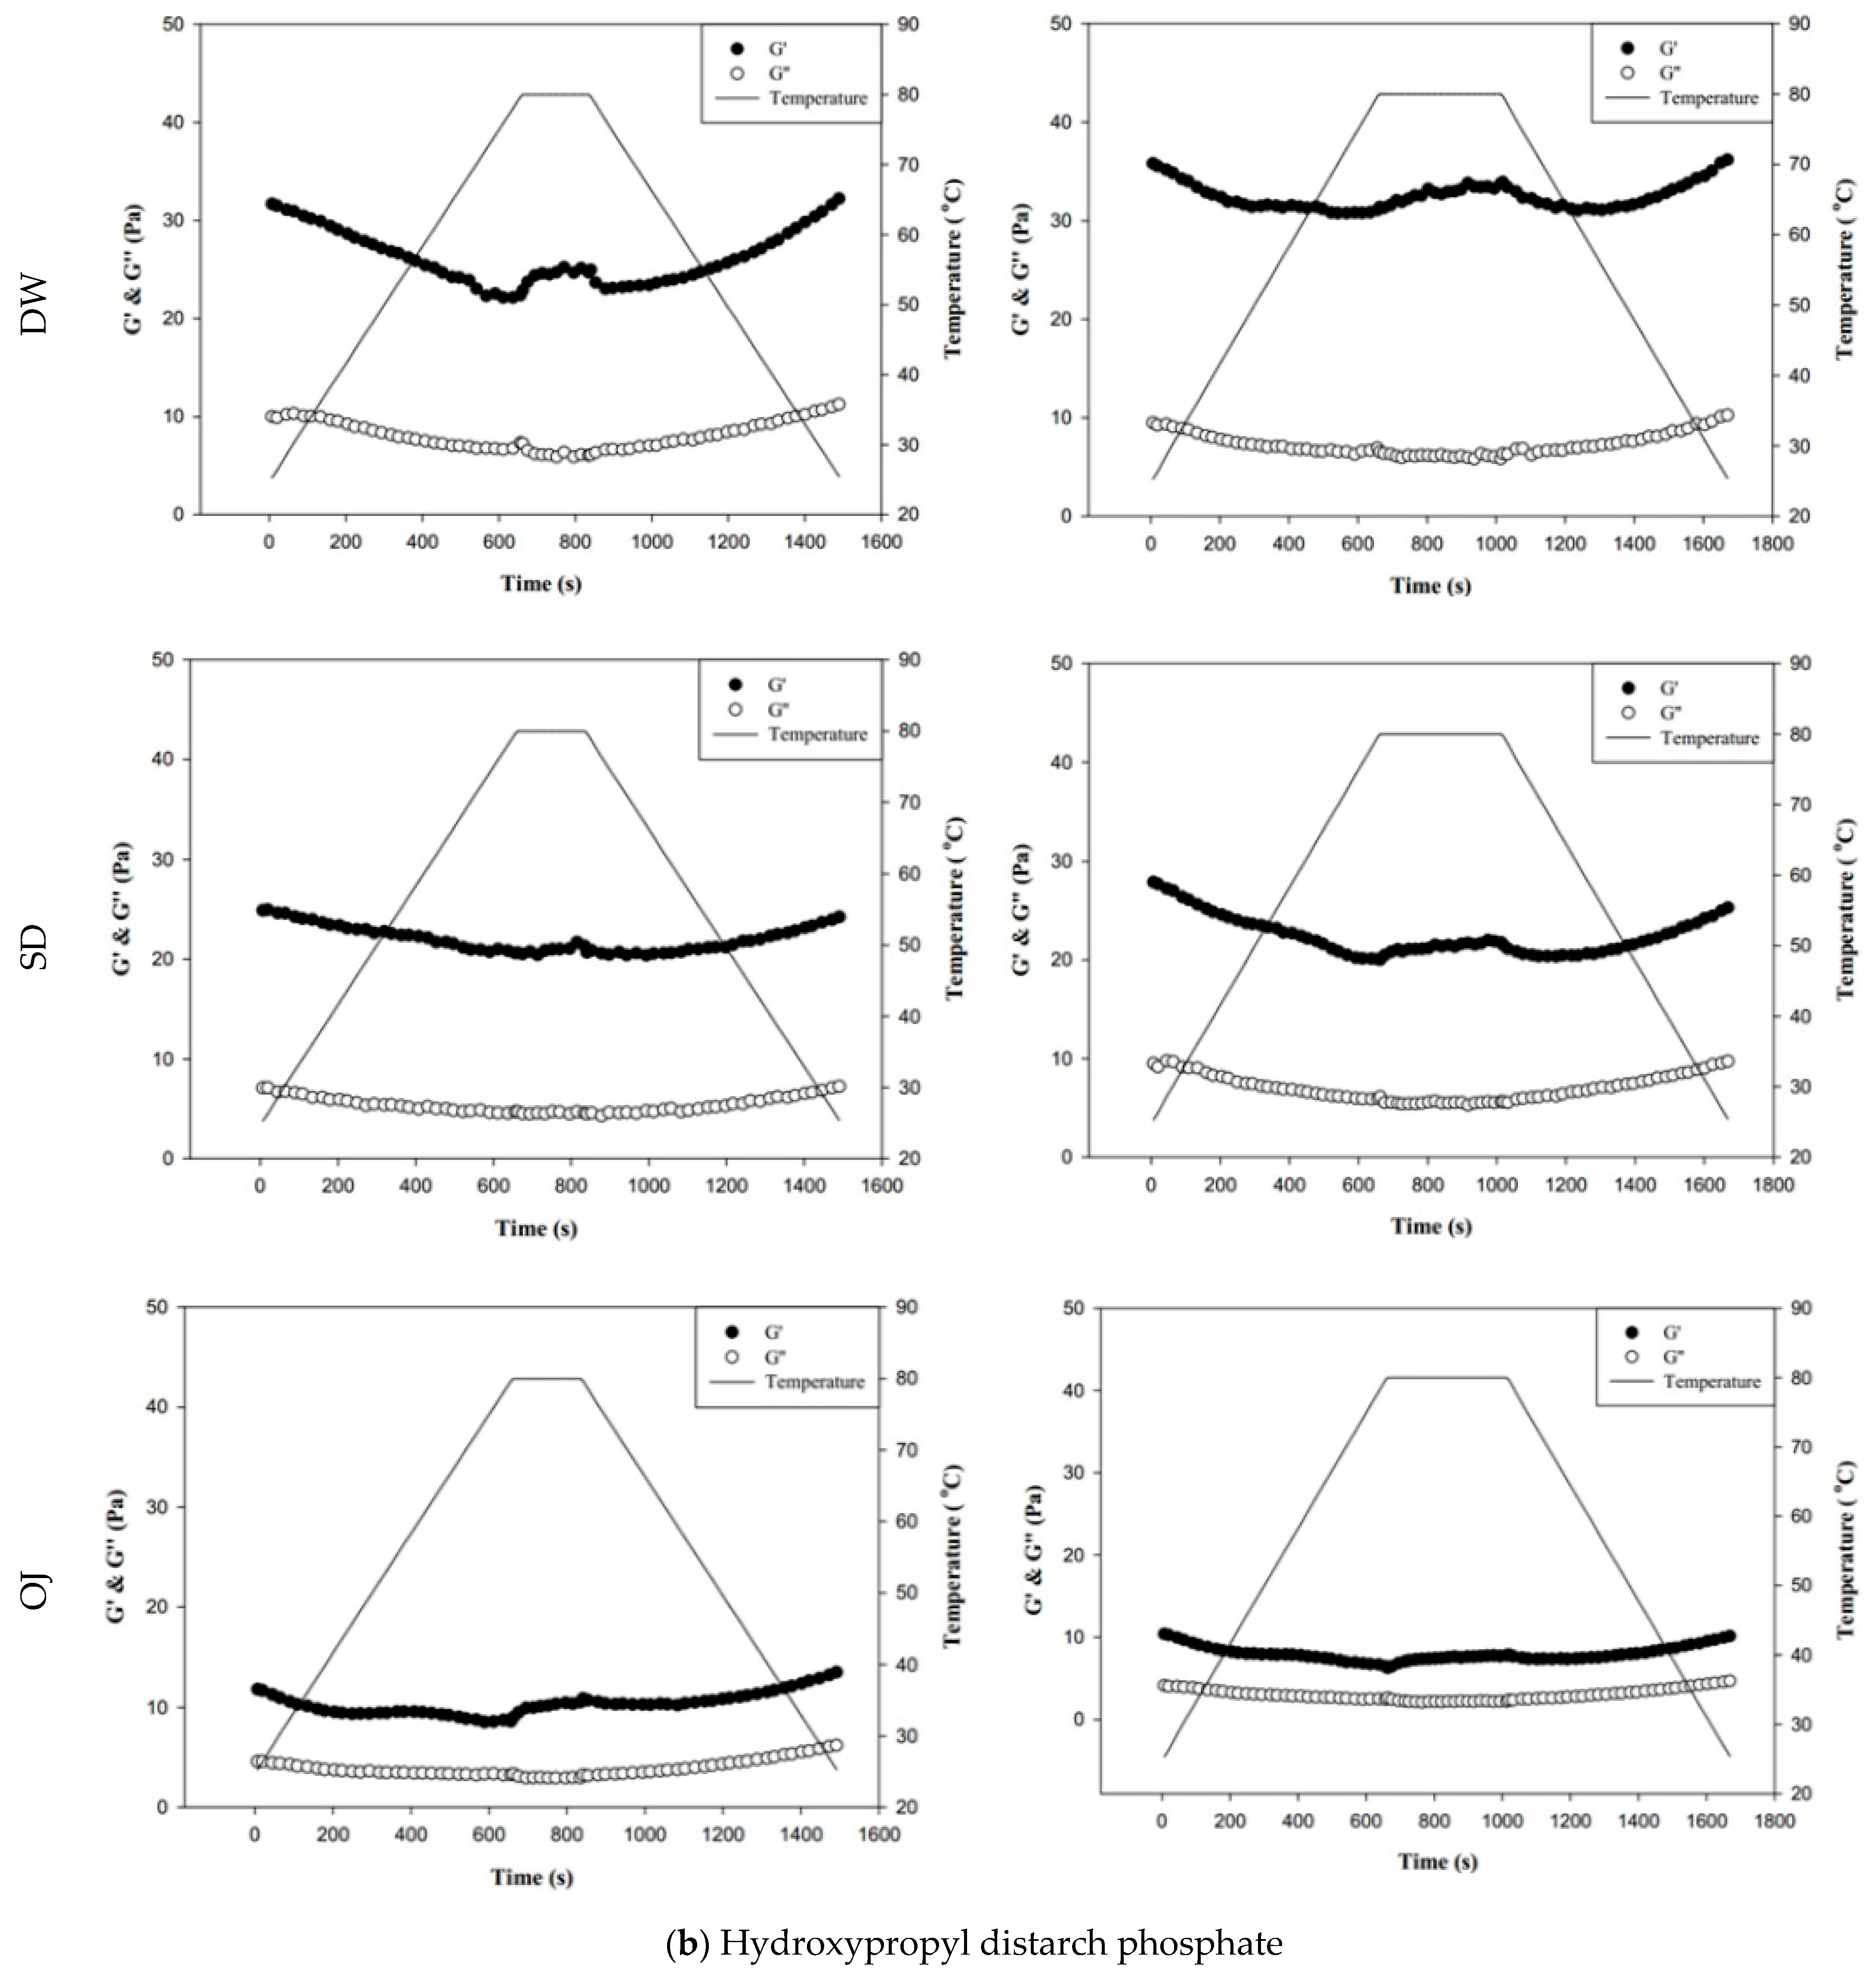
Figure 8b indicates the changes in fluid properties of HDP-thickened continuous bases during thermal processing. The initial and final values of G′ and G″ of the HDP-thickened continuous bases did not differ significantly; the same was observed in the 3 min and 6 min processing groups. During thermal processing, the G′ values of both the 3 min and 6 min processing groups were higher than the corresponding G″ values, indicating that the fluids did not undergo phase transition and displayed elastic characteristics.
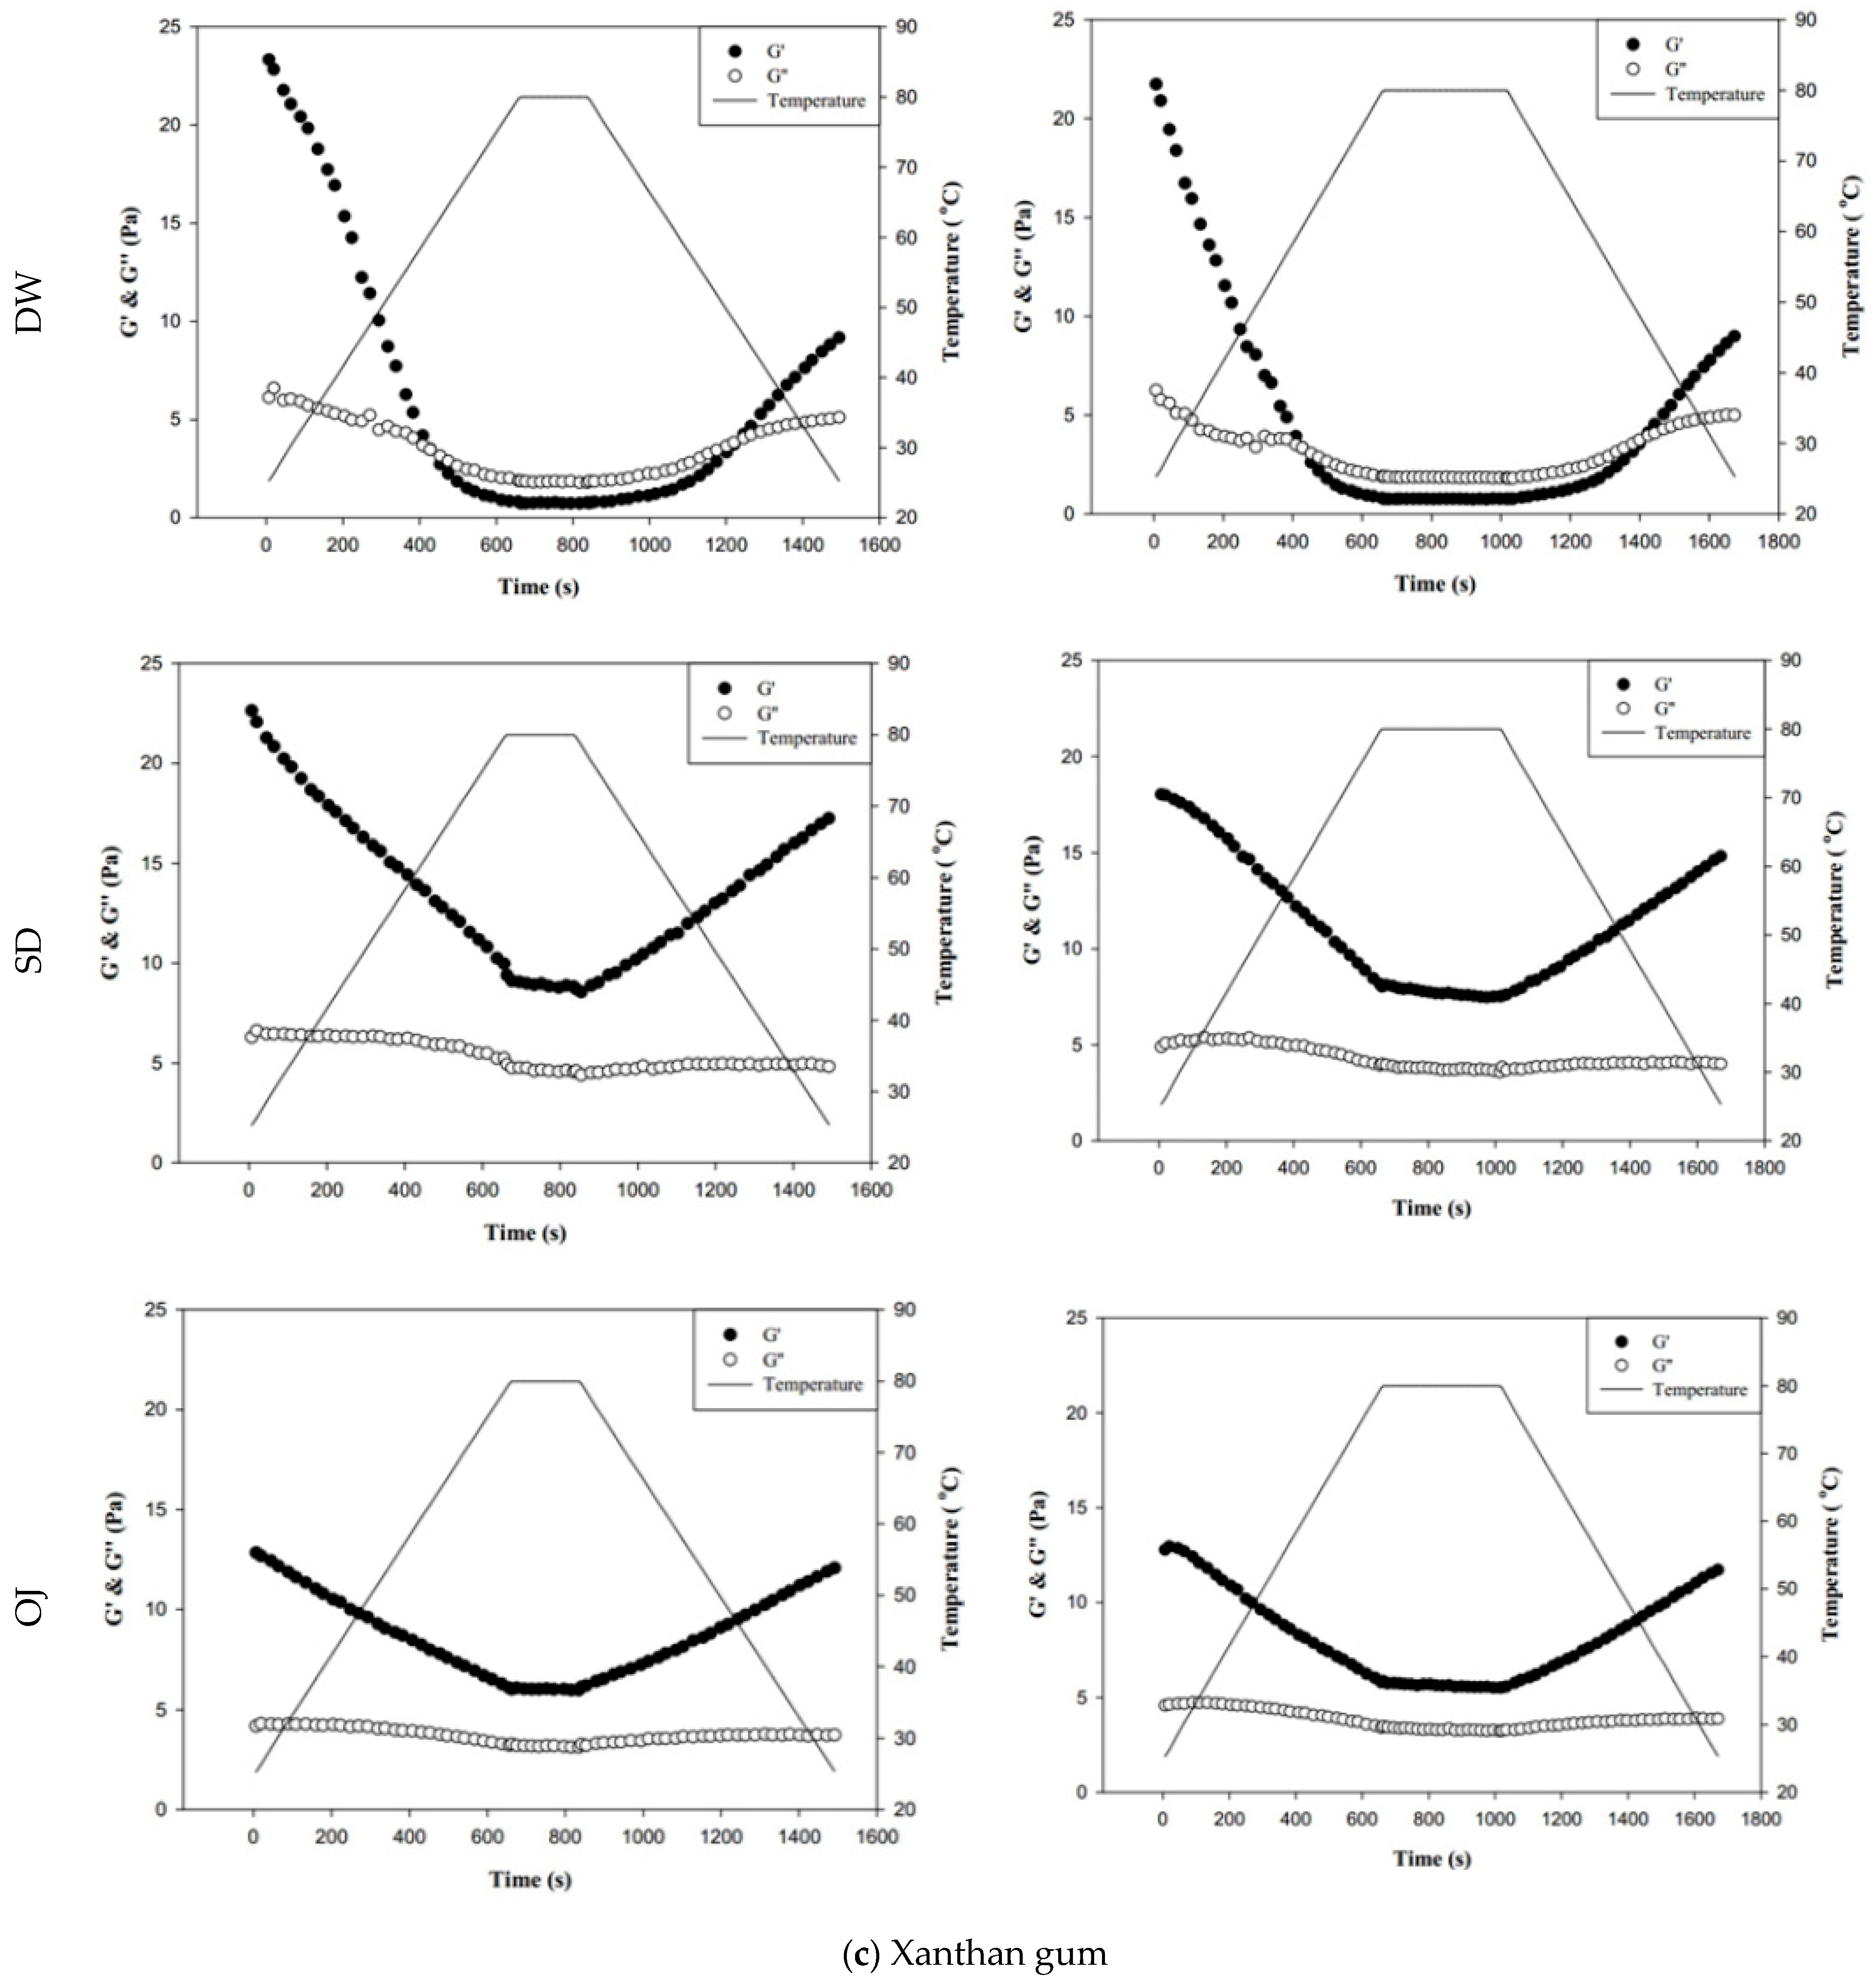
Figure 8c shows the changes in fluid properties of XG-thickened continuous bases during thermal processing. When DW was used as the fluid base, the G′
end values of both the 3 min processing and 6 min processing groups were significantly lower than the corresponding G′
initial values (
p < 0.05), whereas G″
end and G″
initial did not differ significantly. Two phase transitions occurred in both the 3 min and 6 min processing groups during thermal processing. In the 3 min processing group, the first phase transition occurred when the temperature was increased to approximately 60 °C. Thereafter, G′ gradually decreased and became lower than G″, and the fluid exhibited a transition from elastic to viscous characteristics. The second phase transition occurred when the temperature was decreased to approximately 50 °C. G′ showed a gradual increase and became higher than G″, and the fluid exhibited a transition from viscous to elastic characteristics. Similar tendencies were observed in the 6 min processing group, with the first and second phase transitions occurring when the temperature was increased to 60 °C and decreased to approximately 47 °C, respectively. When SD was used as the fluid base, the G′
end and G″
end values of the 3 min processing group were significantly lower than the G′
initial and G″
initial values (
p < 0.05), respectively, whereas the differences in values of the 6 min processing group were not significant. The fluids of both thermal processing groups did not undergo phase transition and had higher G′ values than G″ values, indicating elastic characteristics during thermal processing. When OJ was used as the fluid base, the G′
end and G″
end values of both the 3 min and 6 min processing groups were lower than the corresponding G′
initial and G″
initial values, but the differences were not statistically significant. The fluids of both thermal processing groups did not undergo phase transition and had higher G′ values than G″ values, indicating elastic characteristics during thermal processing.
Jyothi, Moorthy and Rajasekharan have reported pasting behaviors of cassava (tapioca) starch in native form and cross-linked form, which resembles HDP of tapioca origin used in our experiments, using a rapid visco-analyzer [
30]. They prepared 10%
w/
v starchy slurry by heating from 50 to 95 °C with a 12 °C/min temperature increasing rate at 160 rpm rotor speed followed by a holding time of 2 min at 95 °C. The cooling stage is the reversed analogue (−12 °C/min). Their reported RVA (rapid visco analyzer) viscosity patterns of TS–DW and HDP–DW also reveal the observable “dips” during the holding period. The cross-linked tapioca starch (analogue to our HDP) could result in an almost 4-fold increase of the measured viscosity value as compared to the native starch. These observations make our rheological measurements somewhat sustained in a solid base.
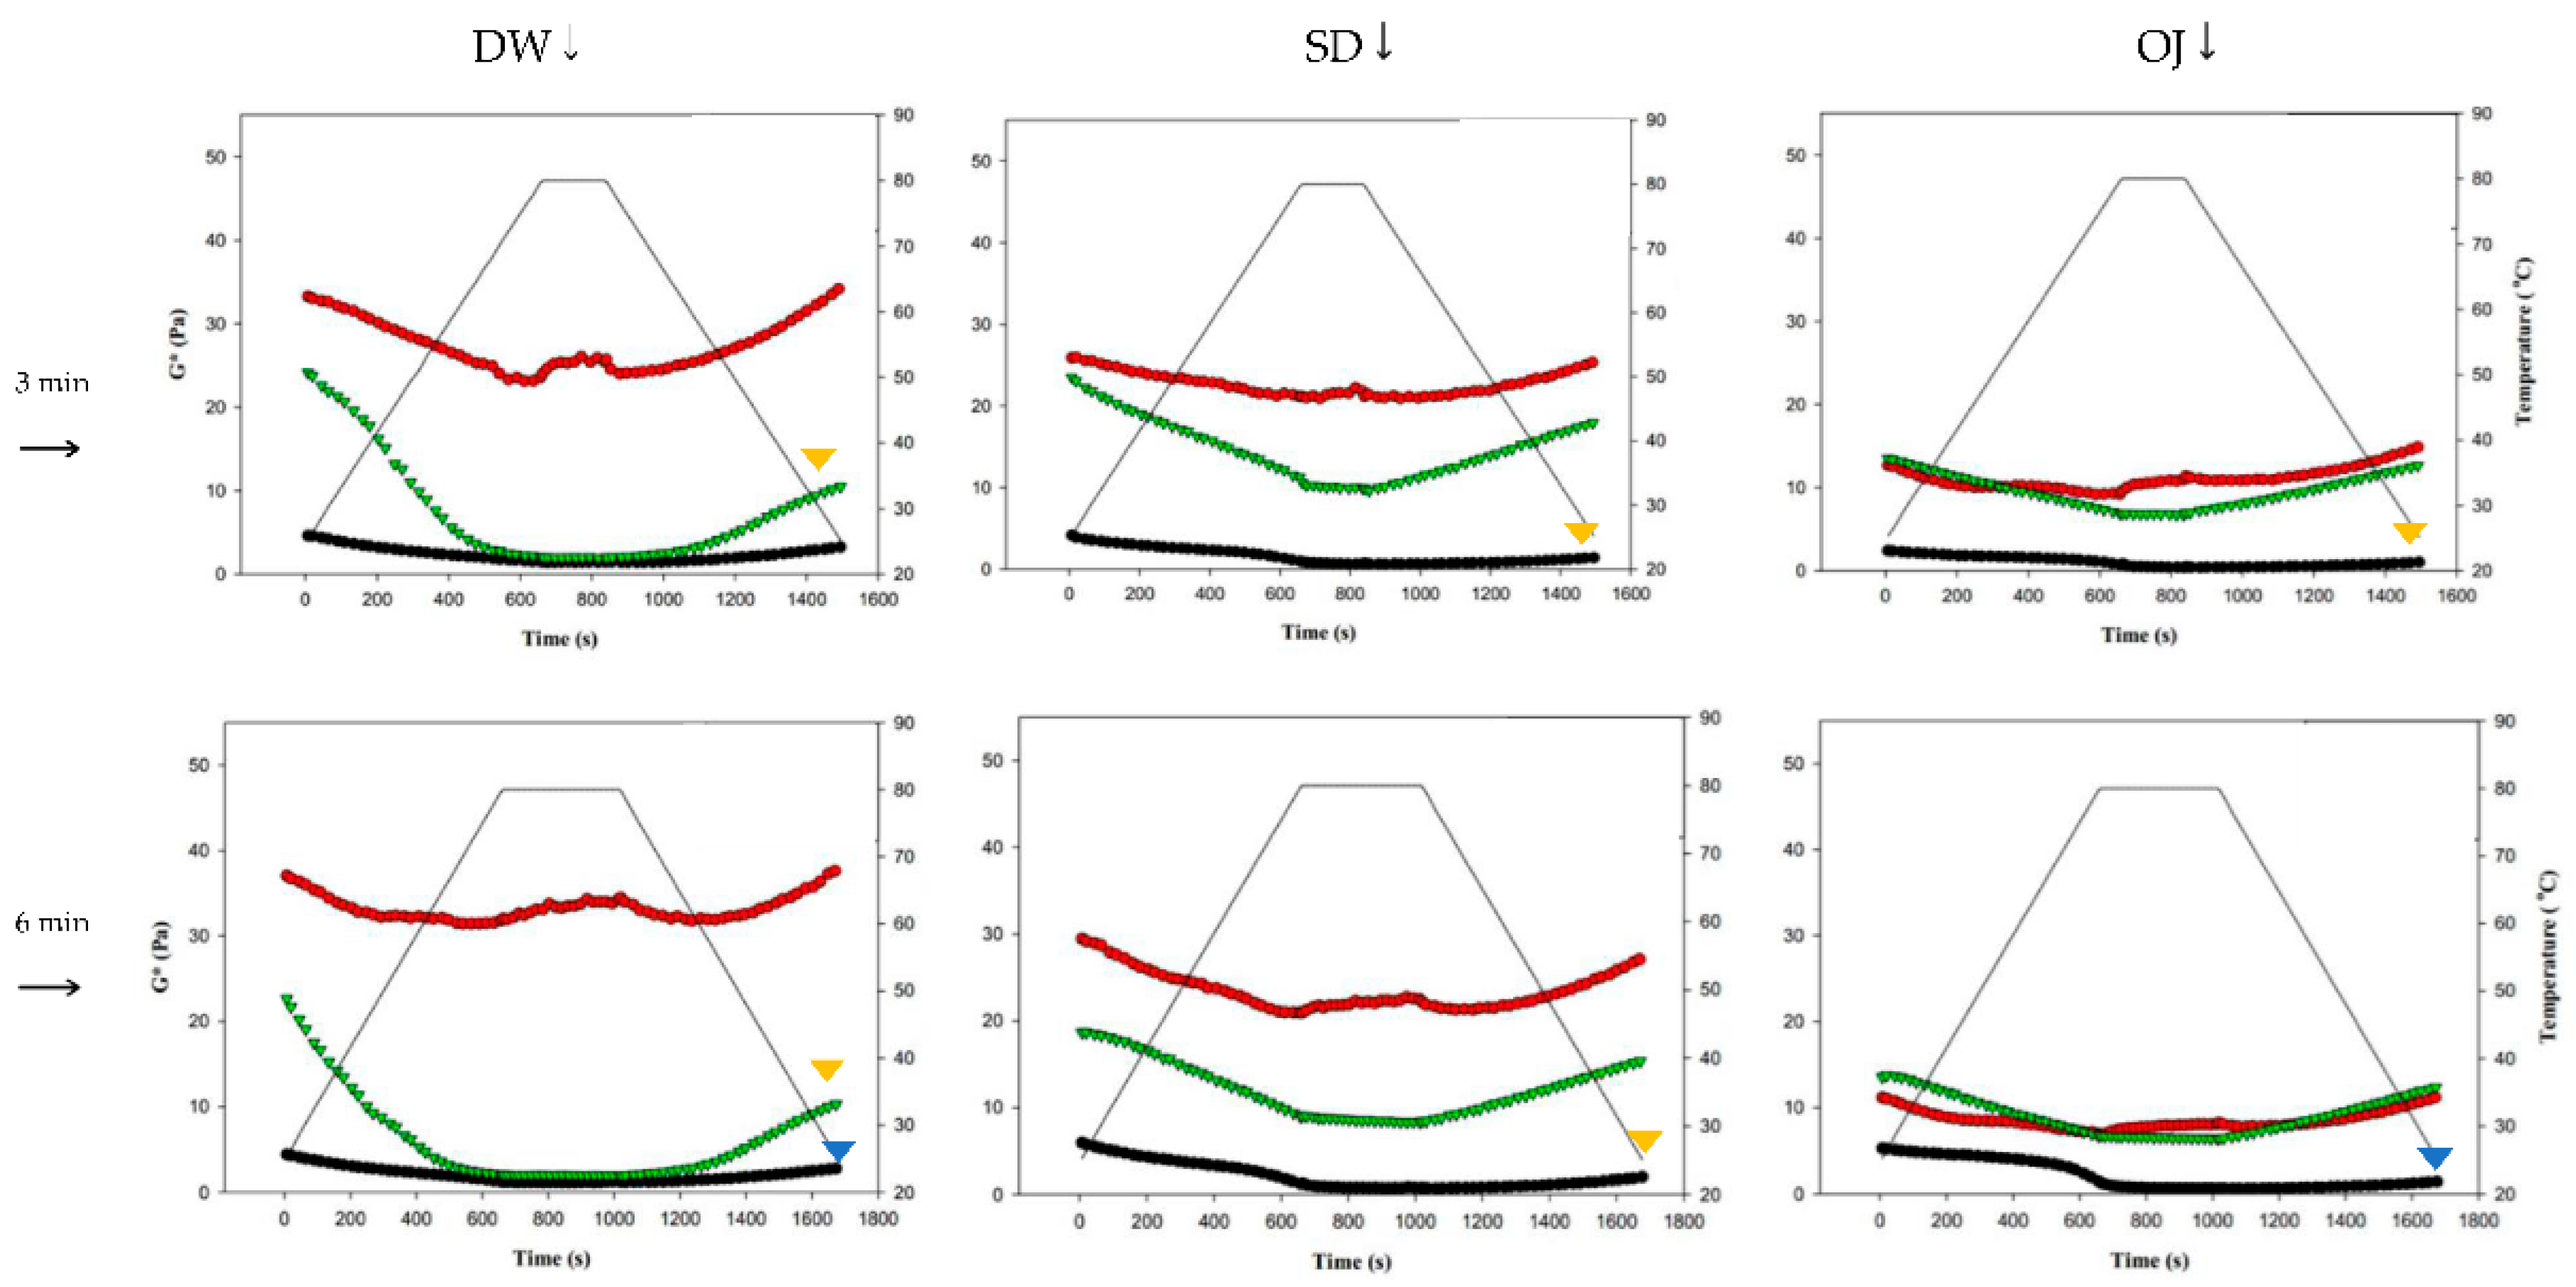
Figure 9 shows the changes in complex modulus (G*) during thermal processing in groups with different combinations of fluid base, thickener, and holding time. The colored triangles indicate significances between G* at the start (G*
initial) and end points (G*
end). When TS was used as the thickener, G*
end was significantly lower than G*
initial in almost all of the 3 min and 6 min processing groups (
p < 0.05), with highly significant differences in the sugar-containing acidic beverages (SD and OJ) (
p < 0.01). When HDP was used as the thickener, there were no significant differences between G*
initial and G*
end in all groups; when XG was used as the thickener, the G*
end values of the 3 min and 6 min processing groups were significantly lower than the corresponding G*
initial values (
p < 0.05) for thickened DW, but did not differ significantly for the thickened SD and OJ samples. Therefore, when HDP was used as the thickener, product quality could be maintained after thermal processing as the fluid properties of the thickened liquid were not altered by heat. With TS used as the thickener, the fluid properties of the thickened liquid were altered by thermal processing. In addition, it was also found that the effects of thermal processing on product quality were more pronounced.
The viscoelasticity of starches is determined by factors such as starch granules’ soluble matter content, morphology, size, degree of swelling, and complexes formed with other components (e.g., lipid–amylose) [
46]. Gels formed from amylose tend to be elastic, whereas gels formed from amylopectin tend to be viscous. Both amylose and amylopectin swell and decompose upon heating, which causes a reduction in viscoelasticity [
47]. As starch molecules swell, melting of the crystalline regions disrupts the gel structure, thereby causing the softening or breakage of starch granules. With the loss of interactions among granules, the network structure is destroyed, resulting in a decrease in G′ [
47,
48,
49]. Chemical modifications can lead to considerable changes in viscoelasticity; studies have shown that acetylated, hydroxypropylated and cross-linked starches have significantly higher G′ and G″ values than natural starches [
50,
51].
3.4.2. Viscoelastic Characteristics
Table 5 shows the frequency sweep results described using the equation G′ = kw
n. As the 3 min and 6 min processing groups for TS- and XG-thickened DW and the 6 min processing group of TS-thickened SD exhibited unstable G′ values when sweeping was performed at frequencies >1 Hz, results within the frequency range of 0.1–1 Hz were displayed for these groups. The R
2 of G′ and G″ ranged from 0.9009 to 0.9984 and 0.9417 to 0.9995, respectively, indicating that the viscoelasticity of the thickened continuous bases obtained by the frequency sweep could be adequately described by G′ = kw
n.
The viscoelasticity of thickened continuous bases can be determined by the frequency sweep test, and the fluids can be classified into dilute and concentrated solutions and gels based on the resultant spectra [
52].
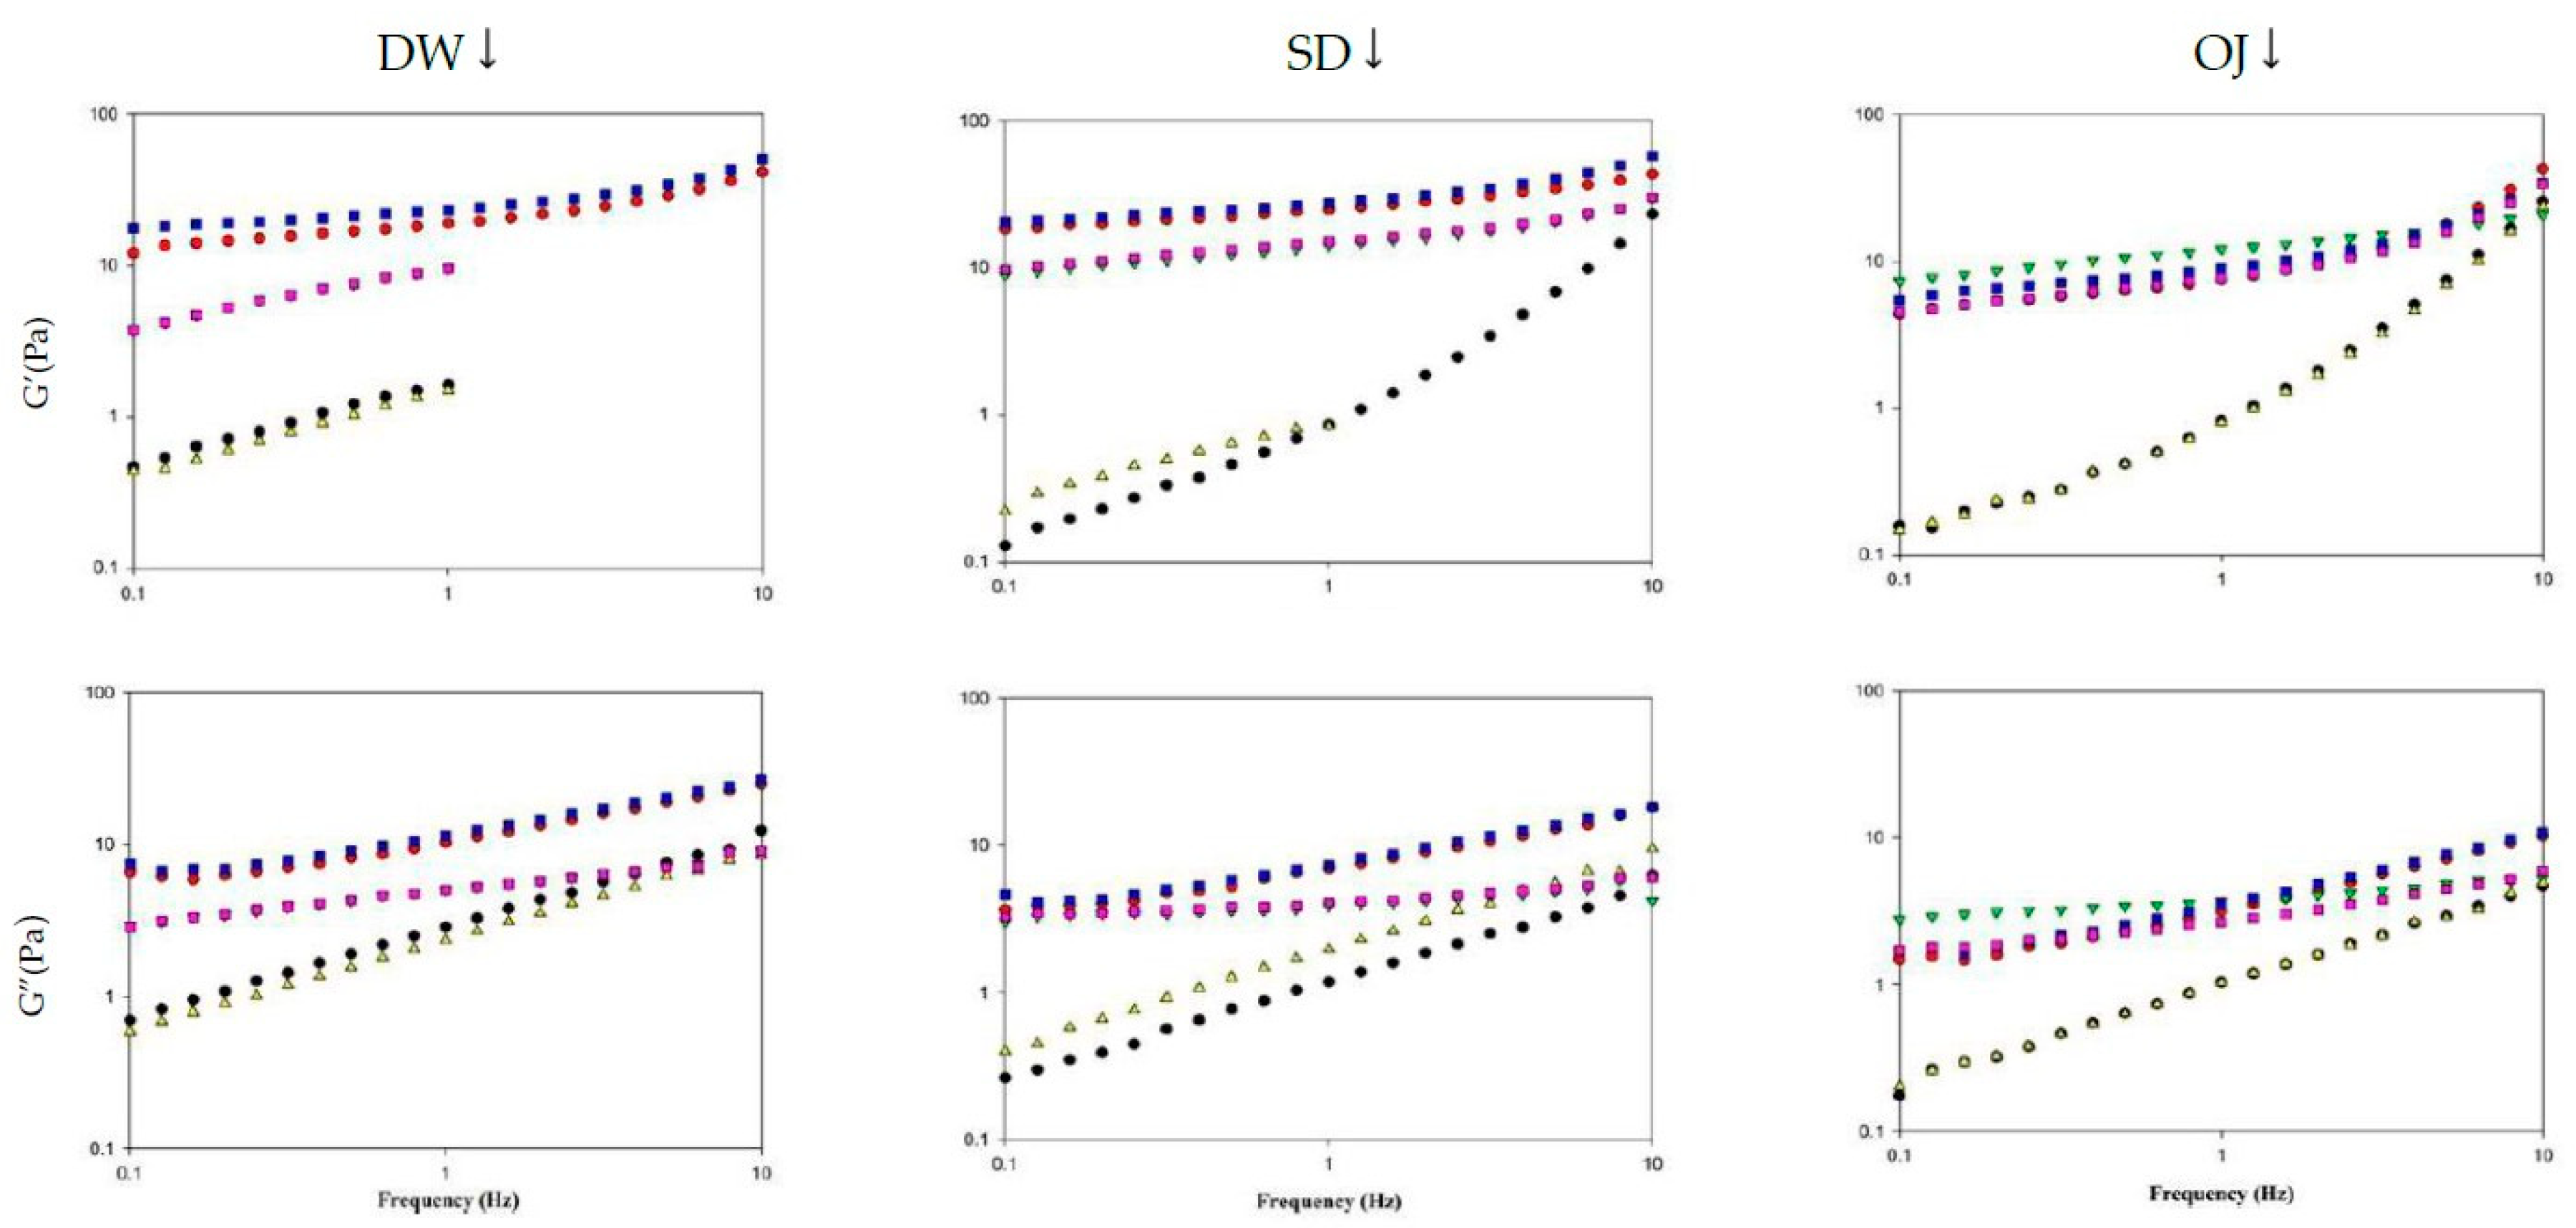
Figure 10 shows the spectra obtained from frequency sweeps of the various thickened continuous bases. When DW was used as the fluid base, the G′ and G″ values of the various processing groups increased with frequency and were higher in the HDP-thickened liquids followed by the XG-thickened liquids. TS-thickened DW had lower G′ values than G″ values and exhibited viscous characteristics. In contrast, HDP- or XG-thickened DW had higher G′ values than G″ values and exhibited elastic characteristics. As the tendencies of G′ and G″ indicated the presence of a weak gel network structure, the fluids were classified as weak gels.
When SD was used as the fluid base, the G′ and G″ values of the various processing groups increased with frequency and were higher in the HDP-thickened liquids followed by the XG- and TS-thickened liquids. HDP- and XG-thickened SD had higher G′ values than G″ values and exhibited elastic characteristics; the tendencies of G′ and G″ also indicated the presence of a weak gel network structure. When TS was used as the thickener, the 3 min processing group had lower G′ values than G″ values and exhibited viscous characteristics at low frequencies. At a frequency of 1.9950 Hz, the G′ and G″ values were 1.8677 Pa and 1.8607 Pa, respectively, and G′ started to exceed G″. Elastic characteristics were observed at high frequencies and the fluids were classified as concentrated solutions based on the G′ and G″ tendencies.
When OJ was used as the fluid base, the G′ and G″ values of the various groups increased with an increase in frequency. At low frequencies, the 3 min and 6 min processing groups for HDP-thickened OJ had lower G′ values than G″ values and exhibited viscous characteristics. When the frequency was increased to 1.9950 Hz, phase transition occurred in both groups and G′ started to exceed G″, with G′ values of 1.8173 and 1.6980 Pa for the 3 min and 6 min groups, and G″ values of 1.6060 and 1.5963 Pa for the 3 min and 6 min groups, respectively. Elastic characteristics were observed at high frequencies and the fluids were classified as concentrated solutions based on the G′ and G″ tendencies.
Table 6 shows the viscoelasticity parameters of the thickened continuous bases formulated with different thickeners and continuous bases, measured at a frequency of 1 Hz. When DW was used as the fluid base, the 3 min and 6 min processing groups of HDP-thickened DW had G′ values of 34.0733 Pa and 46.3567 Pa, respectively, and G″ values of 10.2430 Pa and 11.9710 Pa, respectively, with G′ and G″ being significantly higher compared with the other processing groups (
p < 0.05). The 3 min and 6 min processing groups of TS-thickened DW had the highest
tanδ values of 1.75 and 1.56, respectively, which were significantly higher compared with other groups (
p < 0.05). When SD was used as the fluid base, the 3 min and 6 min processing groups of HDP-thickened SD had G′ values of 24.98 Pa and 27.59 Pa, respectively, and G″ values of 6.98 Pa and 7.38 Pa, respectively, with G′ and G″ significantly higher compared with the TS-thickened SD groups (
p < 0.05). The G′ and G″ values of XG-thickened SD did not differ significantly compared with the other processing groups. The 6 min processing group of TS-thickened SD had the highest
tanδ value of 2.40, which was significantly higher compared to that of the other processing groups (
p < 0.05). When OJ was used as the fluid base, the 3 min and 6 min processing groups of TS-thickened OJ had G′ values of 0.82 Pa and 0.80 Pa, respectively, and G″ values of 1.03 Pa and 1.03 Pa, respectively, which were significantly lower compared with the other processing groups (
p < 0.05). In addition, the 3 min and 6 min processing groups of TS-thickened OJ had the highest
tanδ values of 1.26 and 1.30, respectively, which were significantly higher than those of the other processing groups (
p < 0.05).
In general, the HDP-thickened liquids exhibited relatively high G′ and G″ values, and the TS-thickened liquids had relatively low tanδ values. tanδ can be used as the basis for determining the viscoelasticity of fluids, as tanδ >1 indicates G′ < G″ and tanδ < 1 indicates G′ > G″. When TS was used as the thickener, the tanδ values of the various thickened continuous bases ranged from 1.26 to 2.40, which indicated that G′ < G″; when HDP was used as the thickener, the tanδ values of the various thickened continuous bases ranged from 0.25 to 0.42, which indicated that G′ > G″; when XG was used as the thickener, the tanδ values of the various thickened continuous bases ranged from 0.27 to 0.52, which indicated that G′ > G″. Therefore, at a frequency of 1 Hz, TS-thickened continuous bases exhibited viscous characteristics and behaved like viscous materials, whereas HDP- and XG-thickened materials exhibited elastic characteristics and behaved like elastic materials.
3.5. Variations of Flow and Textural Parameters with Respect to Maintenance of Quality
The effects of different thermal processes on the apparent viscosities and textural parameters (viscosity and consistency indexes) of the various thickened continuous bases were investigated, and the changes after 28 days of storage were compared.
Table 7 and
Table 8 show the comparison of the parameter values on the day of processing and after 28 days of storage at 4 °C. The various processing temperatures promoted different effects on apparent viscosity, with statistically significant (
p < 0.05) differences between the various processing and control groups. In particular, processing at 121 °C for 15 min provided the greatest effect (
Table 8), which resulted in percentage changes of −28.12% to −98.14%. Apparent viscosity obtained with processing at 80 °C for 3 min was lower than that obtained with processing at 80 °C for 6 min in TS-thickened DW, HDP-thickened DW, and XG-thickened OJ, but similar results were not observed in other thickened continuous bases. This may be attributed to the lower degree of gelatinization with 3 min of processing than that with 6 min of processing in the previously mentioned groups.
The consistency index values of the various processing groups did not differ significantly from those of the control groups and exhibited a similar tendency to firmness (data not shown). This is due to the fact that firmness, which represents the maximum positive force in textural analysis, is related to the consistency index, which is the positive peak area under the force-time curve [
40]. For TS-thickened DW, TS-thickened SD, HDP-thickened SD, and XG-thickened SD, the viscosity index values obtained with processing at 80 °C for 3 min and 6 min were significantly different from the values of the corresponding control groups (
p < 0.05) and exhibited a similar tendency to cohesiveness (data not shown). This is due to the fact that cohesiveness, which represents the maximum negative force in textural analysis, is related to the viscosity index, which is the negative peak area under the force-time curve [
53].
The results described above indicate that, among the various thickened continuous bases, those prepared using SD as the fluid base exhibited considerable changes in apparent viscosity and textural parameters after thermal processing. Continuous bases thickened with XG exhibited relatively stable properties after thermal processing compared with continuous bases thickened with other thickeners. Apparent viscosity showed more significant changes (p < 0.05) after thermal processing compared with the other parameters. Among the various processing conditions, a temperature of 121 °C and a hold time of 15 min promoted the greatest effects on the physicochemical properties and textures of thickened continuous bases. After processing at 121 °C for 15 min, the apparent viscosities of most of the thickened continuous bases were below 50 mP.s. As liquids were classified as thin liquids and unsuitable for consumption by dysphagic patients, they were excluded from the subsequent storage experiment. In addition, it can be observed that the apparent viscosities provided by the various thickeners were similar, but differences were observed in the various textural parameters. This indicates that the textural parameters could be more related to the type of thickened liquid, but such differences may also be caused by differences in the methods used for textural analysis or the speed at which the compression plate was raised or lowered.
When starch is heated in hot water, thermal energy promotes the entry of water into its amorphous regions. With sustained heating, the hydrogen bonds of the crystalline regions are ruptured, enabling the entry of water into the crystalline regions. The destruction of crystalline regions during the gelatinization process leads to a gradual loss of birefringence and the formation of loose granular structures. When the starch granules imbibe water and swell, their density decreases and granule size increases, causing an increase in internal friction and resulting in increased viscosity [
41,
54]. The types and contents of sugar in continuous bases also affect the viscosities and textures of the thickened continuous bases. In previous studies on wheat starch-milk-sugar systems (WMS) and corn starch-milk-sugar systems (CMS), it was reported that the highest increase in the viscosities of WMS and CMS was obtained with the addition of fructose and glucose, respectively [
55,
56,
57]. In addition, the presence of an acidic environment leads to partial hydrolysis of molecules on the surface of starch granules and increases the hygroscopicity of starch granule surfaces, thereby increasing the viscosity. However, excessive hydrolysis can also cause starch granules to rupture, which results in a decrease in the gelation ability [
58].
Our results indicated that the apparent viscosity changed with storage time. TS- or XG-thickened continuous bases exhibited gradual changes in apparent viscosity, which ranged from 81.73 mPa.s to 300.33 mPa.scP, and were classified as nectar-like liquids. In contrast, HDP-thickened continuous bases exhibited relatively unstable apparent viscosities. A comparison of the apparent viscosities on day 28 and day 0 indicated that HDP- and TS-thickened continuous bases exhibited the highest and lowest values, respectively. Among the groups subjected to processing at 80 °C for 3 min, the TS-thickened continuous bases had the highest decrease in apparent viscosity (−25.31%), whereas the HDP-thickened OJ exhibited the highest increase (+25.84%). Among the groups subjected to processing at 80 °C for 6 min, the TS-thickened continuous bases had the highest decrease in apparent viscosity (−30.99%), whereas the HDP-thickened DW exhibited the highest increase (+19.62%). In general, the various thickened continuous bases only exhibited gradual changes in consistency index over the storage period. Among the various thickened DW samples, the HDP group exhibited the highest consistency index, followed by the XG group. For the thickened SD and OJ samples, the XG group had the highest consistency index within groups of the same fluid base, followed by the HDP and TS groups. The thickened continuous bases also exhibited gradual changes in viscosity index over the storage period. Similarly, the HDP group had the highest viscosity index among the various thickened DW samples, followed by the XG group. For the thickened SD and OJ samples, the XG group had the highest consistency index within groups of the same fluid base, followed by the HDP and TS groups.
The recruited thickeners, TS, HDP, and XG, in our study could result in different related properties while being prepared as thickened fluid matrices; in this light, we provide functional property data (SI, SP, WHC, and OBC) as well as weight-dependent apparent viscosity to different thickeners. Amongst the recruited thickeners, HDP is classified as a type IV resistant starch manifested as a functional ingredient with intra-molecule cross-linked modification to reduced glycemic response compared to digestible carbohydrate, consequently having resulted in an approved European Union health claim or elsewhere in the world [
59]. Our sample OJ is often referred to as orange-flavored cordial; there has already been a solid rheological report regarding a raspberry flavored cordial; however, their sample fluid matrices were prepared by manual mixing with a spatula until homogenous as a fresh-preparation scenario without further thermal processing [
16]. Dynamic rheological behaviors with respect to both cases of 80 °C and holding for 3 and 6 min in the present study can be considered as the thermal pasteurization practice for packaged fluid matrices being accommodated in containers with different critical length associated with thermal penetration; furthermore, the dynamic oscillation might as well be a related pipeline conveying or pumping progression in an aseptic package system as the shear force somehow theoretically attributing viscoelastic change of the prepared fluid matrices. Finally, we would like to make a humble note that video-fluoroscopy is commonly employed to diagnose dysphagia severity and evaluate the effectiveness of texture or viscoelasticity modification with respect to confirming safe swallowing progression in different liquid consistencies [
60]; therefore, such videoscope technology is to be introduced in our future study for ensuring formulas possessing dysphagia-friendly potential.


