3.3. Fire Behavior at Bench Scale
Cone calorimeter tests were performed on both foams at different heat fluxes. This first series was tested on light samples (2 cm). The main results are listed in
Table 3 and the HRR curves are shown in
Figure 4.
HRR curves show only one pHRR reached quickly after ignition and followed by a fast HRR decrease up to extinction, especially at high heat flux; it is typical of materials exhibiting thermally thin behaviour. Indeed, amounts of the samples did not exceed 5 g.
Time-to-ignition (TTI) is very short due to low heat conductivity, as already discussed above. TTI is slightly higher for the HD foam, especially at low heat flux. Ignition occurs when the upper layer of the sample reaches a critical temperature high enough to produce fuels. The amount of energy needed is proportional to the product of the mass and specific heat (see for example typical equations for the prediction of TTI in the cone calorimeter [
24]). While the HD foam is denser, the time to reach this critical temperature is also higher. These values are in agreement with those reported by Gunther et al., who have measured times-to-ignition of 8–10 s at 20 kW/m
2 for different flexible PU foams exhibiting a density close to 30 kg/m
3 [
9]. Critical heat flux (i.e., the minimum heat flux for which the foams ignite) is very low. Indeed, even at 10 kW/m
2 (see below for thicker foams), ignition occurs, even if the time-to-ignition is significantly higher.
The peak of the heat release rate is reached 10–15 s and 25–30 s after ignition for the LD and HD foams, respectively. Its value is in the range 270–380 kW/m
2 and it increases with heat flux. Its value may be slightly higher for HD foam (probably because the sample mass is higher) but the difference between both foams is limited. The total heat release is around 27 kJ/g and the residue yield is negligible. Therefore the effective heat of combustion (EHC) is also close to 27 kJ/g, in good agreement with Gunther et al. [
9]. The combustion efficiency is then calculated as the ratio between EHC and the heat of complete combustion measured in PCFC, and is close to 1. In other words, the combustion is complete.
Figure 5 shows the evolution of the temperature of the upper surface recorded by an infrared camera. Foams are positioned under the radiant cone only a few seconds before the beginning of the test and the shutter opening. Due to the heat flux irradiated from the shutter, the temperature is already high at the beginning of the test (120–160 °C). Indeed, for low conductivity materials, all the heat flux is accumulated on the surface and heat transfer from the surface to the bulk is almost negligible. Temperature increases quickly and stabilizes around 345–380 °C up to ignition. After ignition, the temperature rises rapidly and reaches a plateau around 600 °C. There is no significant difference between both foams at a fixed heat flux: the heating rate, the temperature at ignition as well as the temperature after burning are similar. Nevertheless, the delay before ignition is higher for HD foam, especially at low heat flux. As already explained, it is assigned to the higher material amount to heat after foam melting. Nevertheless, at high heat flux, the time-to-ignition is very short for both foams and no significant difference is observed between them. The dependence of the ignition temperature on the heat flux is very limited: it increases from 345–370 °C at 25 kW/m
2 to 380 °C at 50 kW/m
2.
Cone calorimeter tests were also performed on 10 cm-thick foams to study the foam collapse during burning. In order to easily study the collapse, the external heat flux was fixed at 10, 25 and 35 kW/m
2. Note that, in all cases, ignition occurs before the start of the collapse. Therefore, it was not needed to ignite the samples with a small flame as performed by Kramer et al. [
20]. HRR curves are shown in
Figure 6 for both foams at 10 and 35 kW/m
2. They significantly differ from the curves obtained for thin foams. Indeed, the heat release rate increases after ignition up to a pseudo-plateau. After this step a second increase to pHRR is observed. For LD foam at 35 kW/m
2, the pseudo-plateau reaches the pHRR without sudden increase. After pHRR, the heat release rate decreases quickly due to fuel depletion up to flame out. Other researchers have already explained the main features of such curves [
9,
20]. The first part of the curve (a pseudo-plateau in our case, a peak in Kramer’s study) corresponds to the foam collapse. The second part for which a high pHRR is reached is related to the fire pool. Note that the peak is much higher for the HD foam because the amount of fuel in the fire pool is greater. Nevertheless, due to the removal of aluminium foil on a face of the foam, a part of the fuel flows at the end of the test (after collapse). For this reason, the calorimetric data were not analysed in detail.
Collapse was studied using a digital camera and an infrared camera. Pictures from the digital camera are shown in
Figure 7 for HD foam at 35 kW/m
2. Similar behaviour is observed for other foams and/or heat flux. As already identified by Kramer et al., a thin layer is formed at the surface constituted by melted material and black islets of char. The buoyancy of the surface is vigorous. The islets are more numerous for HD foam but they are not thermally stable. Therefore, no stable char layer is formed during the fire. At the end of the test, the residue yield is negligible. On the foam face recorded by the digital camera, the layer moves through the thickness and the layer front is parallel to the surface (yellow arrow), at least at the centre of the face. On the sides (see black arrow), the layer front progresses more quickly. It is probably due to the presence of aluminium foil. There is no close contact between the foil and the foam, and the aluminium foil may reflect the heat flux, allowing a faster heating of the foam. The collapse at the middle of the foam is slower. The following discussion is only based on the rate of front recession on the centre of the foam face (yellow arrow). Note that the rate of the front recession is constant during most of the collapse. Kramer et al. have shown that there is an almost constant ratio between the layer front rate at edge and at foam middle (ratio close to 2).
Pictures from the IR camera are shown in
Figure 8 for the HD foam at 35 kW/m
2. Once again, these pictures are similar for other tests. There is a strong heat gradient and a clear border between the upper boiling material and the lower intact foam. The luminous upper part is due to the high temperature foam under burning (temperature of the upper surface reaches 600 °C while the temperature range measures by the infrared camera in this test is 0–275 °C), but also due to the aluminium foil gradually as the foam collapses. Once again the border moves through the foam thickness parallel to the surface. Black arrows show the foam sides moving at a higher rate. The white arrow highlights the flowing of the melted material at the end of the test (after collapsing).
Temperature was recorded along a profile line through the thickness (perpendicular to the foam surface). Twenty datapoints were measured on the whole thickness of 10 cm, i.e., one point each 0.53 cm. The temperature evolution of all these 20 points is shown in
Figure 9 for the HD foam tested at 35 kW/m
2. By fixing a temperature criterion, the displacement rate of the border between the boiling matrix and the unpyrolyzed foam can be calculated. The criterion was fixed at 250 °C. This temperature is close to the temperature of the pyrolysis zone (270–330 °C) estimated by Gunther et al. [
9]. However, other criteria would give the same results, taking into account the very fast increase of the temperature. Indeed, the heat gradient is very strong. When the temperature of the first point reaches 250 °C (i.e., when the extreme upper surface starts to burn), the temperature of the following point (only 0.53 cm below) is still 90 °C. When half the foam has already collapsed (i.e., when the point 10 reaches 250 °C), the point 11 just below is still at 70 °C. Gunther et al. have also observed using thermocouples that heat conduction is limited in PU foams [
9].
It is obvious that the temperature at a fixed point increases very fast from the moment it exceeds 70–90 °C. This temperature range may be roughly considered for which the mechanical properties of PU drop quickly and the foam collapses.
Figure 10 shows the temperature front (at 250 °C) versus time for the HD foam at 35 kW/m
2. It is obvious that the front moves through the foam thickness at a constant rate except at the end of the collapse (corresponding to the 1 cm-thick bottom side of the foam).
Both methods (i.e., using digital camera and infrared camera) were applied to measure the foam collapse rate for all the foams at various heat fluxes (10, 25 and 35 kW/m
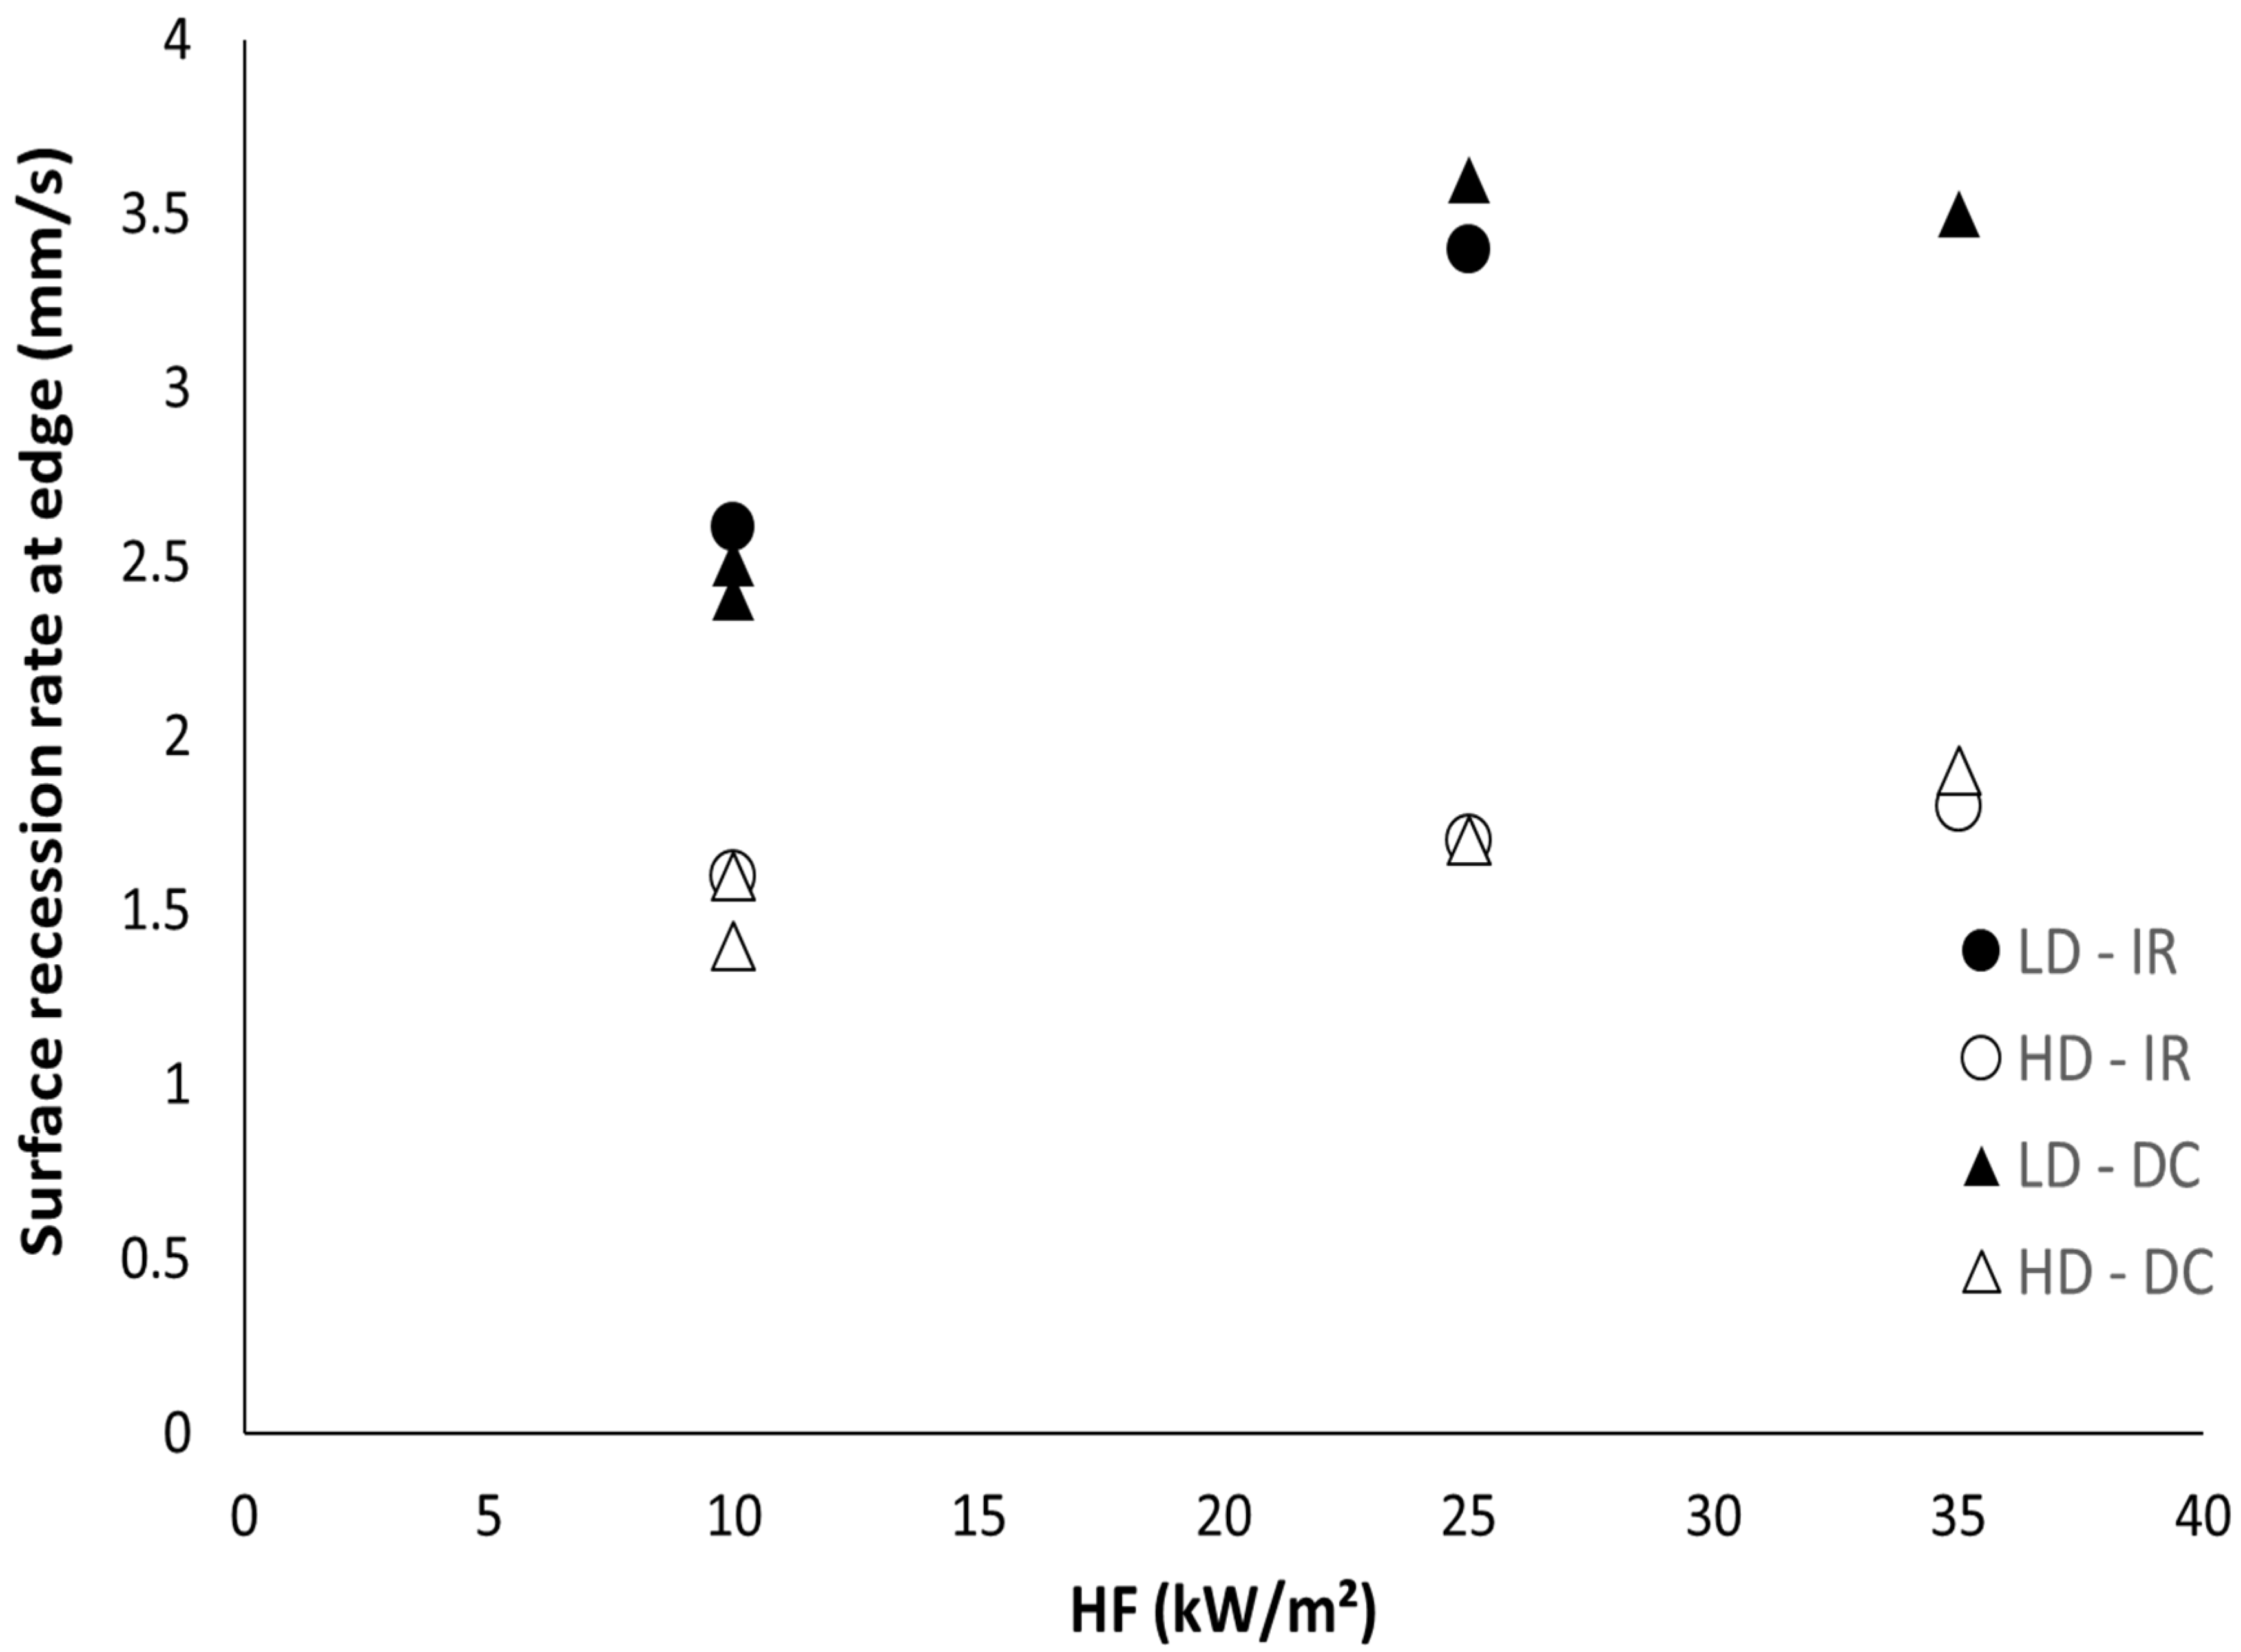
2). The collapse rate (i.e., the surface recession rate) is similar using both methods (
Figure 11). Moreover, two tests on the same foam at a fixed heat flux provide close values. The collapse rate is almost independent of the heat flux for the denser foam: around 1.6–1.7 mm/s, confirming that the heating mainly comes from the flame (and not the cone radiant), as already stated by Kramer et al.
The denser foam is very comparable to the PU foams studied by Kramer et al. which provide the collapse rate (or surface recession rate) at the middle and at the edges of the foam. Nevertheless, they provide these data only for the flame retarded foam. They observed an increase of the surface recession rate with heat flux. Their value at low heat flux (11 kW/m2) is in good agreement with ours: slightly lower than 1.6 mm/s. However, they measure a surface recession rate close to 2.4 mm/s at 35 kW/m2.
The collapse rate is significantly higher for lighter foam: 2.5–3.5 mm/s and the rate seems to increase when heat flux increases from 10 to 25 kW/m
2. While the amount of fuel is lower in a fixed volume of LD foam, a reduced delay is needed to heat the material up to a temperature allowing its collapse. Note that heat conductivity is very low, then, the heat diffusion by conduction into the bulk is limited. The heating comes from the flame above the surface and concerns the small volume directly in contact with the flame. The heat needed to increase the temperature of this volume up to the critical value corresponding to its collapse is directly related to the product of its heat capacity and its mass. Therefore, the ratio between the collapse rate
V between LD and HD should be equal to the reciprocal ratio between their density
(taking into account that the heat capacity is the same for both foams).
According to the heat flux, is in the range 0.49–0.67 while is 0.58. This confirms that the collapse rate is mainly dependent on the foam density.
Interestingly, the relative mass loss at the end of the collapse step is similar for both foams (around 25%). Kramer et al. also observed that only 29% of total heat was released at the end of collapse. It means that only a minor fraction of the material was effectively burnt during collapse. The main fraction was just liquefied and burnt during the second step. Once again, this fraction is minimally dependent on heat flux, evidencing that the burning is piloted by the flux coming from the flame. This fraction is also similar for both foams, i.e., the fuel amount released in the gas phase is much higher for the HD foam. In fact, during the collapse, mainly isocyanate compounds are burnt. Indeed, their decomposition temperature is low: 280 °C versus 400 °C for the polyol part according to the PCFC data. It may be assumed that the heating during collapse leads to the decomposition of isocyanate but not polyol in the liquefied layer. This is in agreement with the temperature of pyrolysis zone estimated by Gunther et al. [
9]: 270–330 °C (even if the extreme surface is at around 600 °C).
Of course, while 75% of the material has not been burnt yet at the end of collapse, the amount of fuel during the pool fire step is much higher for denser foam and explains why the second pHRR is very high for this foam.
3.4. Preliminary Simulations
As explained in the Materials and Methods Section, preliminary simulations considering equivalent homogeneous materials were carried out. A contour map of the surface temperatures for the
HD foam under the heat flux of 35 kW/m
2 is given in
Figure 12 (values being capped in the range of 0 to 250 °C). This temperature (250 °C) was chosen to allow a direct comparison with the experimental cartographies (
Figure 8). Keep in mind that these cartographies allow following the collapse, because the experimental temperature front at 250 °C is correlated to the surface recession rate. As expected, simulation results plotted in
Figure 13 confirm that the thermal conduction rate increases with a higher heat flux or lower foam density, this latter parameter being the most important one.
However, the predicted evolution of the temperature front (at 250 °C) in
Figure 12 and
Figure 13 is much slower than the experimental observations displayed in
Figure 8 and
Figure 10 or
Figure 11. Obviously, the simulations do not perfectly fit the experimental conditions. For example, the edges are not fully isolated as assumed in the numerical analyses. After ignition, heat flux from the flame contributes to the heating. Nevertheless, even if considering a much higher heat flux, the simulated temperature front rate remains very low. Moreover,
Figure 10 shows that the temperature front moves through the thickness at a constant rate. On the contrary, the simulated temperature front rate decreases progressively. Indeed, the heat diffusion slows down due to the insulating PU foam as the temperature front progresses. This is not the case from an experimental point of view, due to foam collapse.
The comparison between the simulation results and the experimental observations leads to the conclusion that the thermal conduction simulation of a macrohomogeneous material with appropriate material values for the foam was unable to predict the correct evolution of the temperature front associated with the local collapse. This leads to assume that microstructural features of the foam should be involved in the observed phenomenon. Buckling of the foams cell walls due to local loss of stiffness induced by temperature increase could occur and drive the foam collapse at a macroscopic level. Further numerical analyses are needed to clarify this point.

 ,
, 


