Investigation on the Flexural–Tensile Rheological Behavior and Its Influence Factors of Fiber-Reinforced Asphalt Mortar

Abstract
1. Introduction
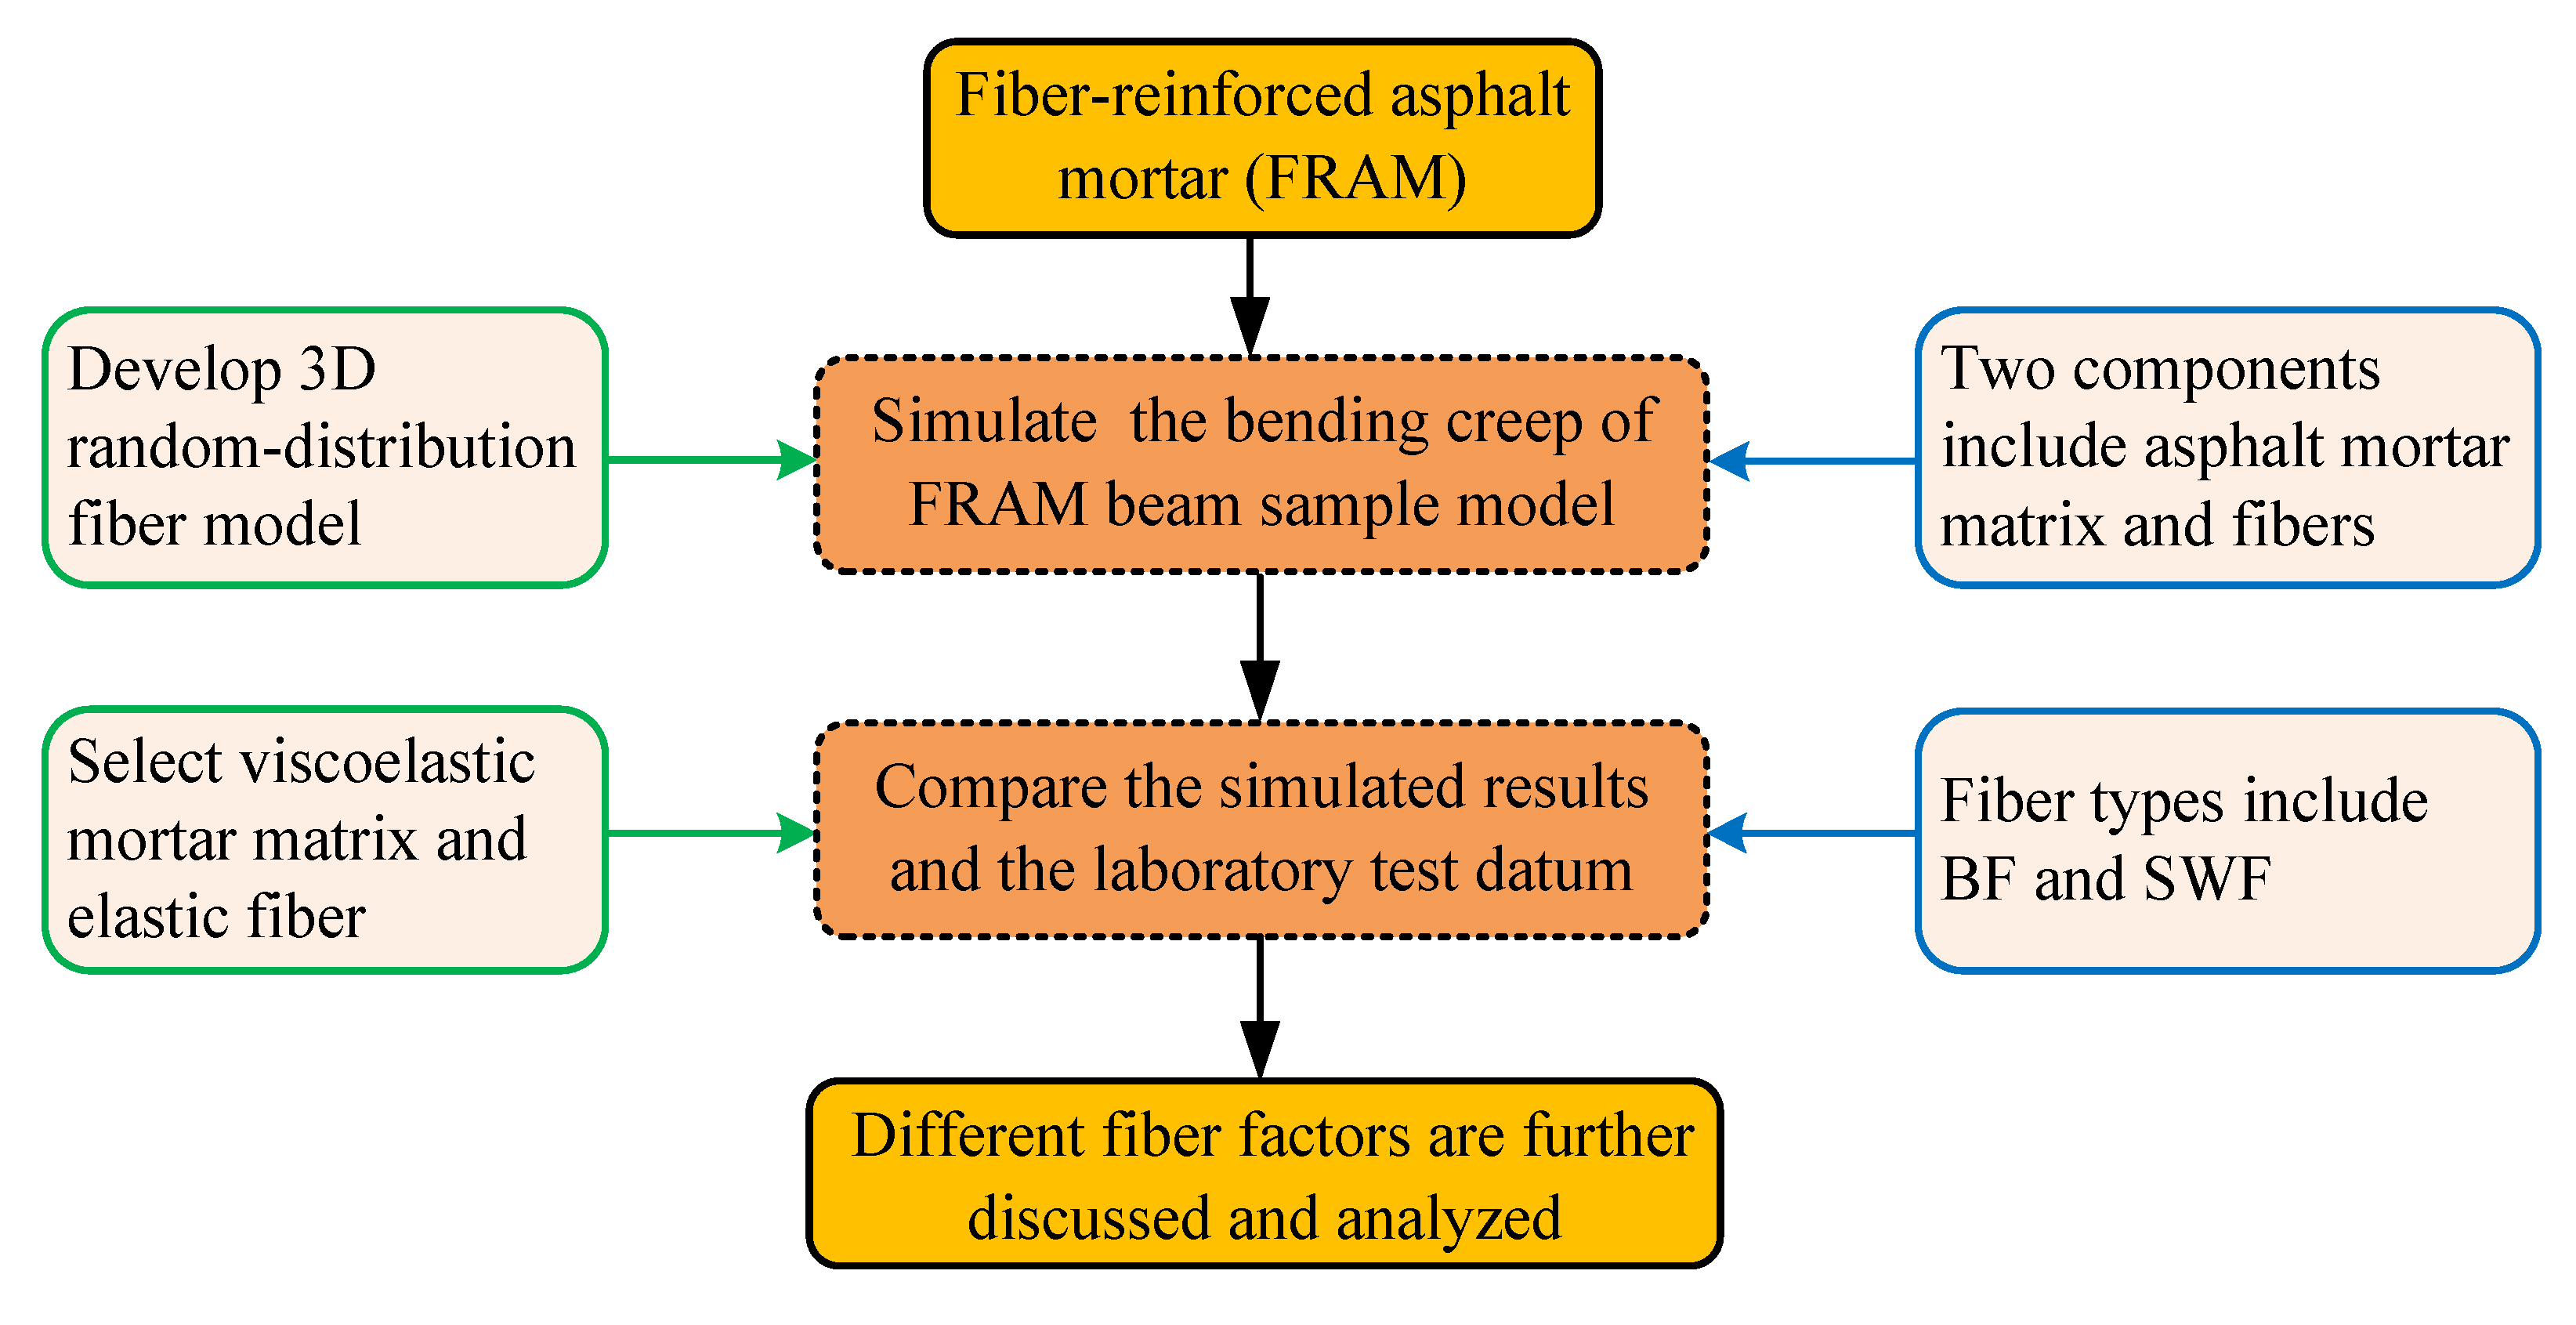
2. Objectives
3. Testing and Simulation Method
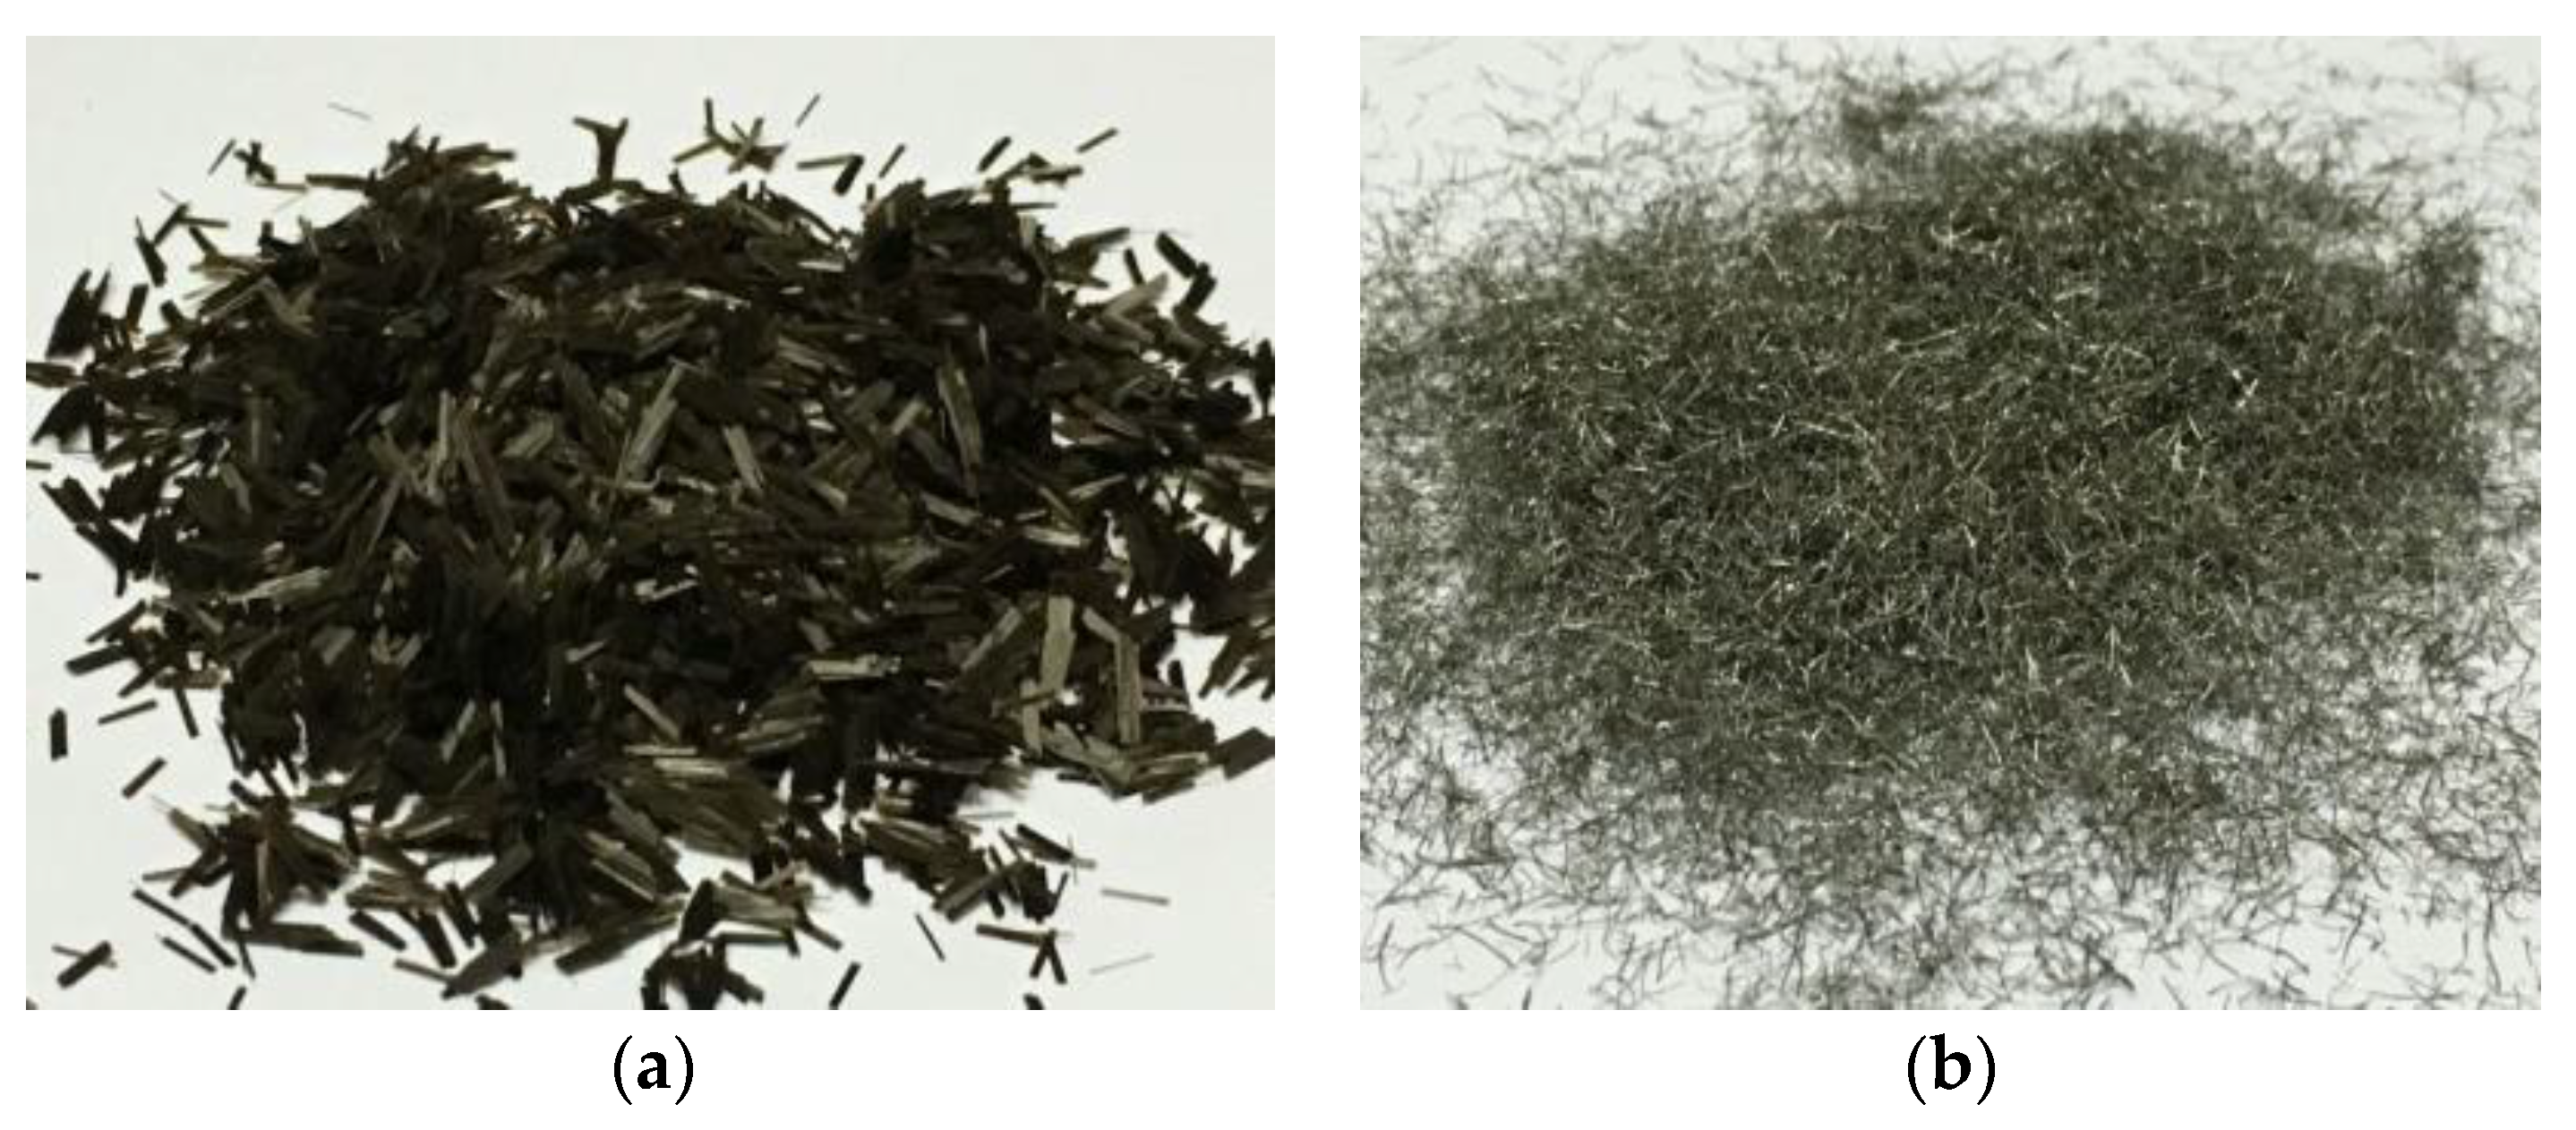
3.1. Materials
3.2. Testing Method
3.3. Numerical Simulation of Pure Asphalt Mortar
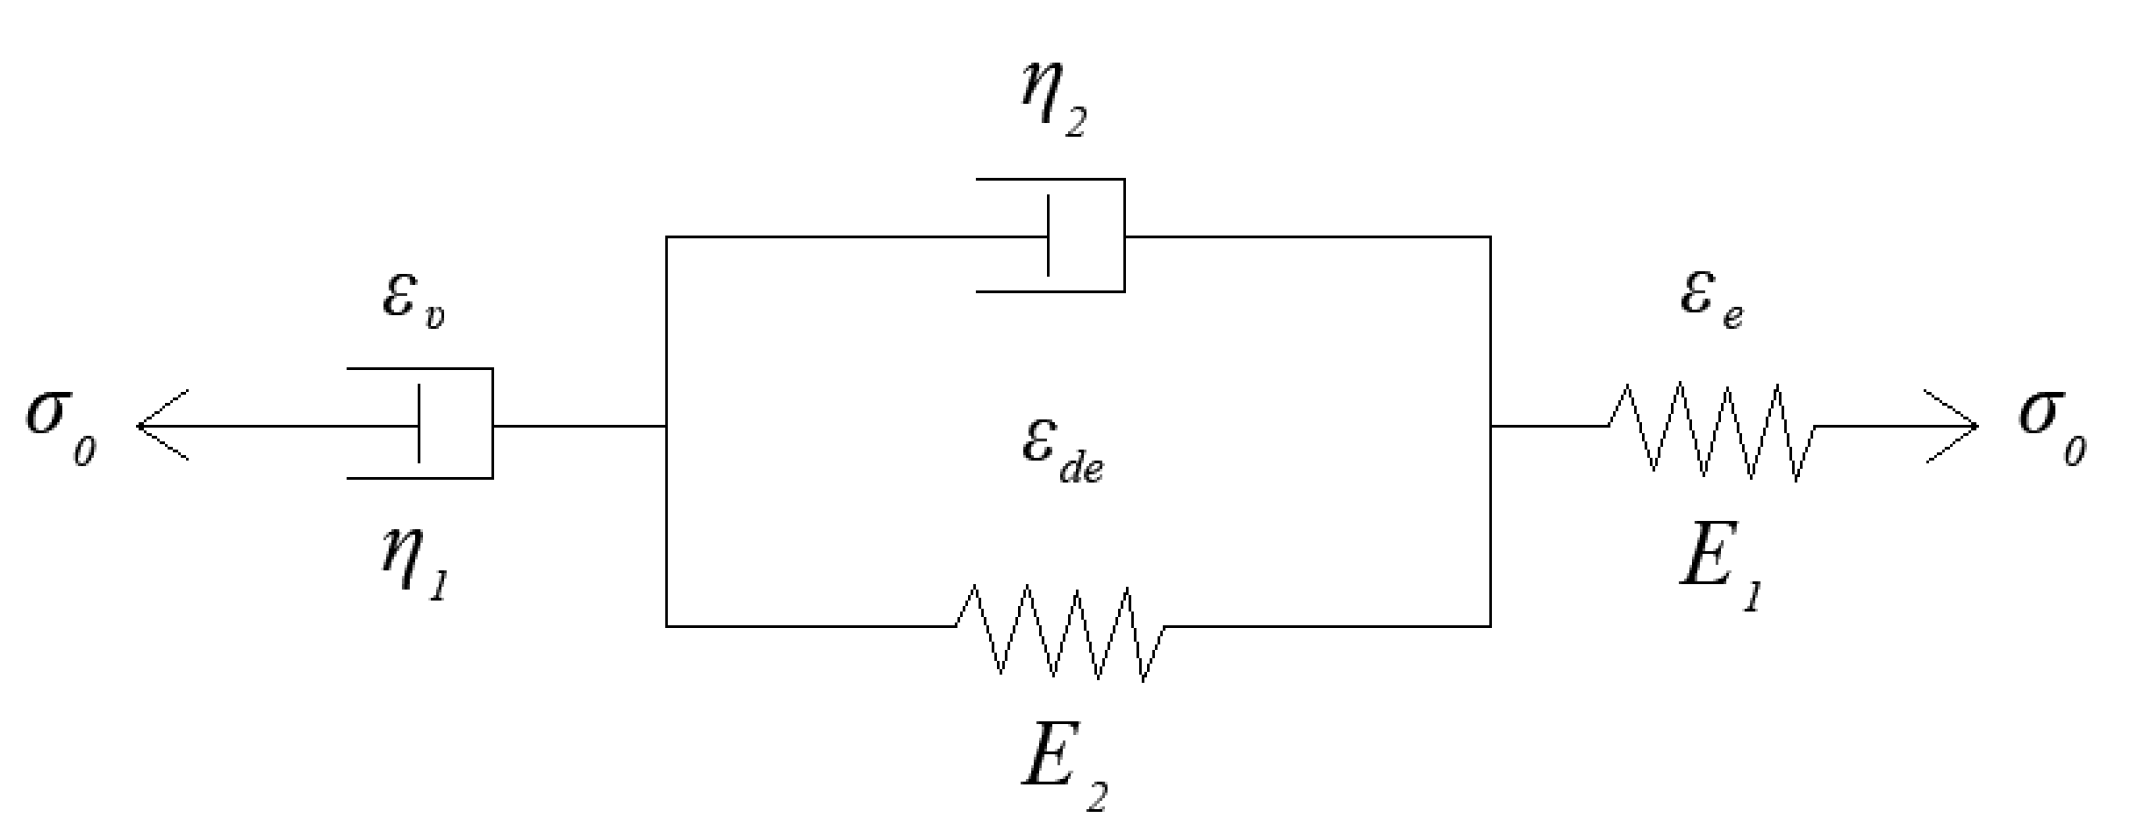
3.3.1. Viscoelastic Parameters of Pure Asphalt Mortar
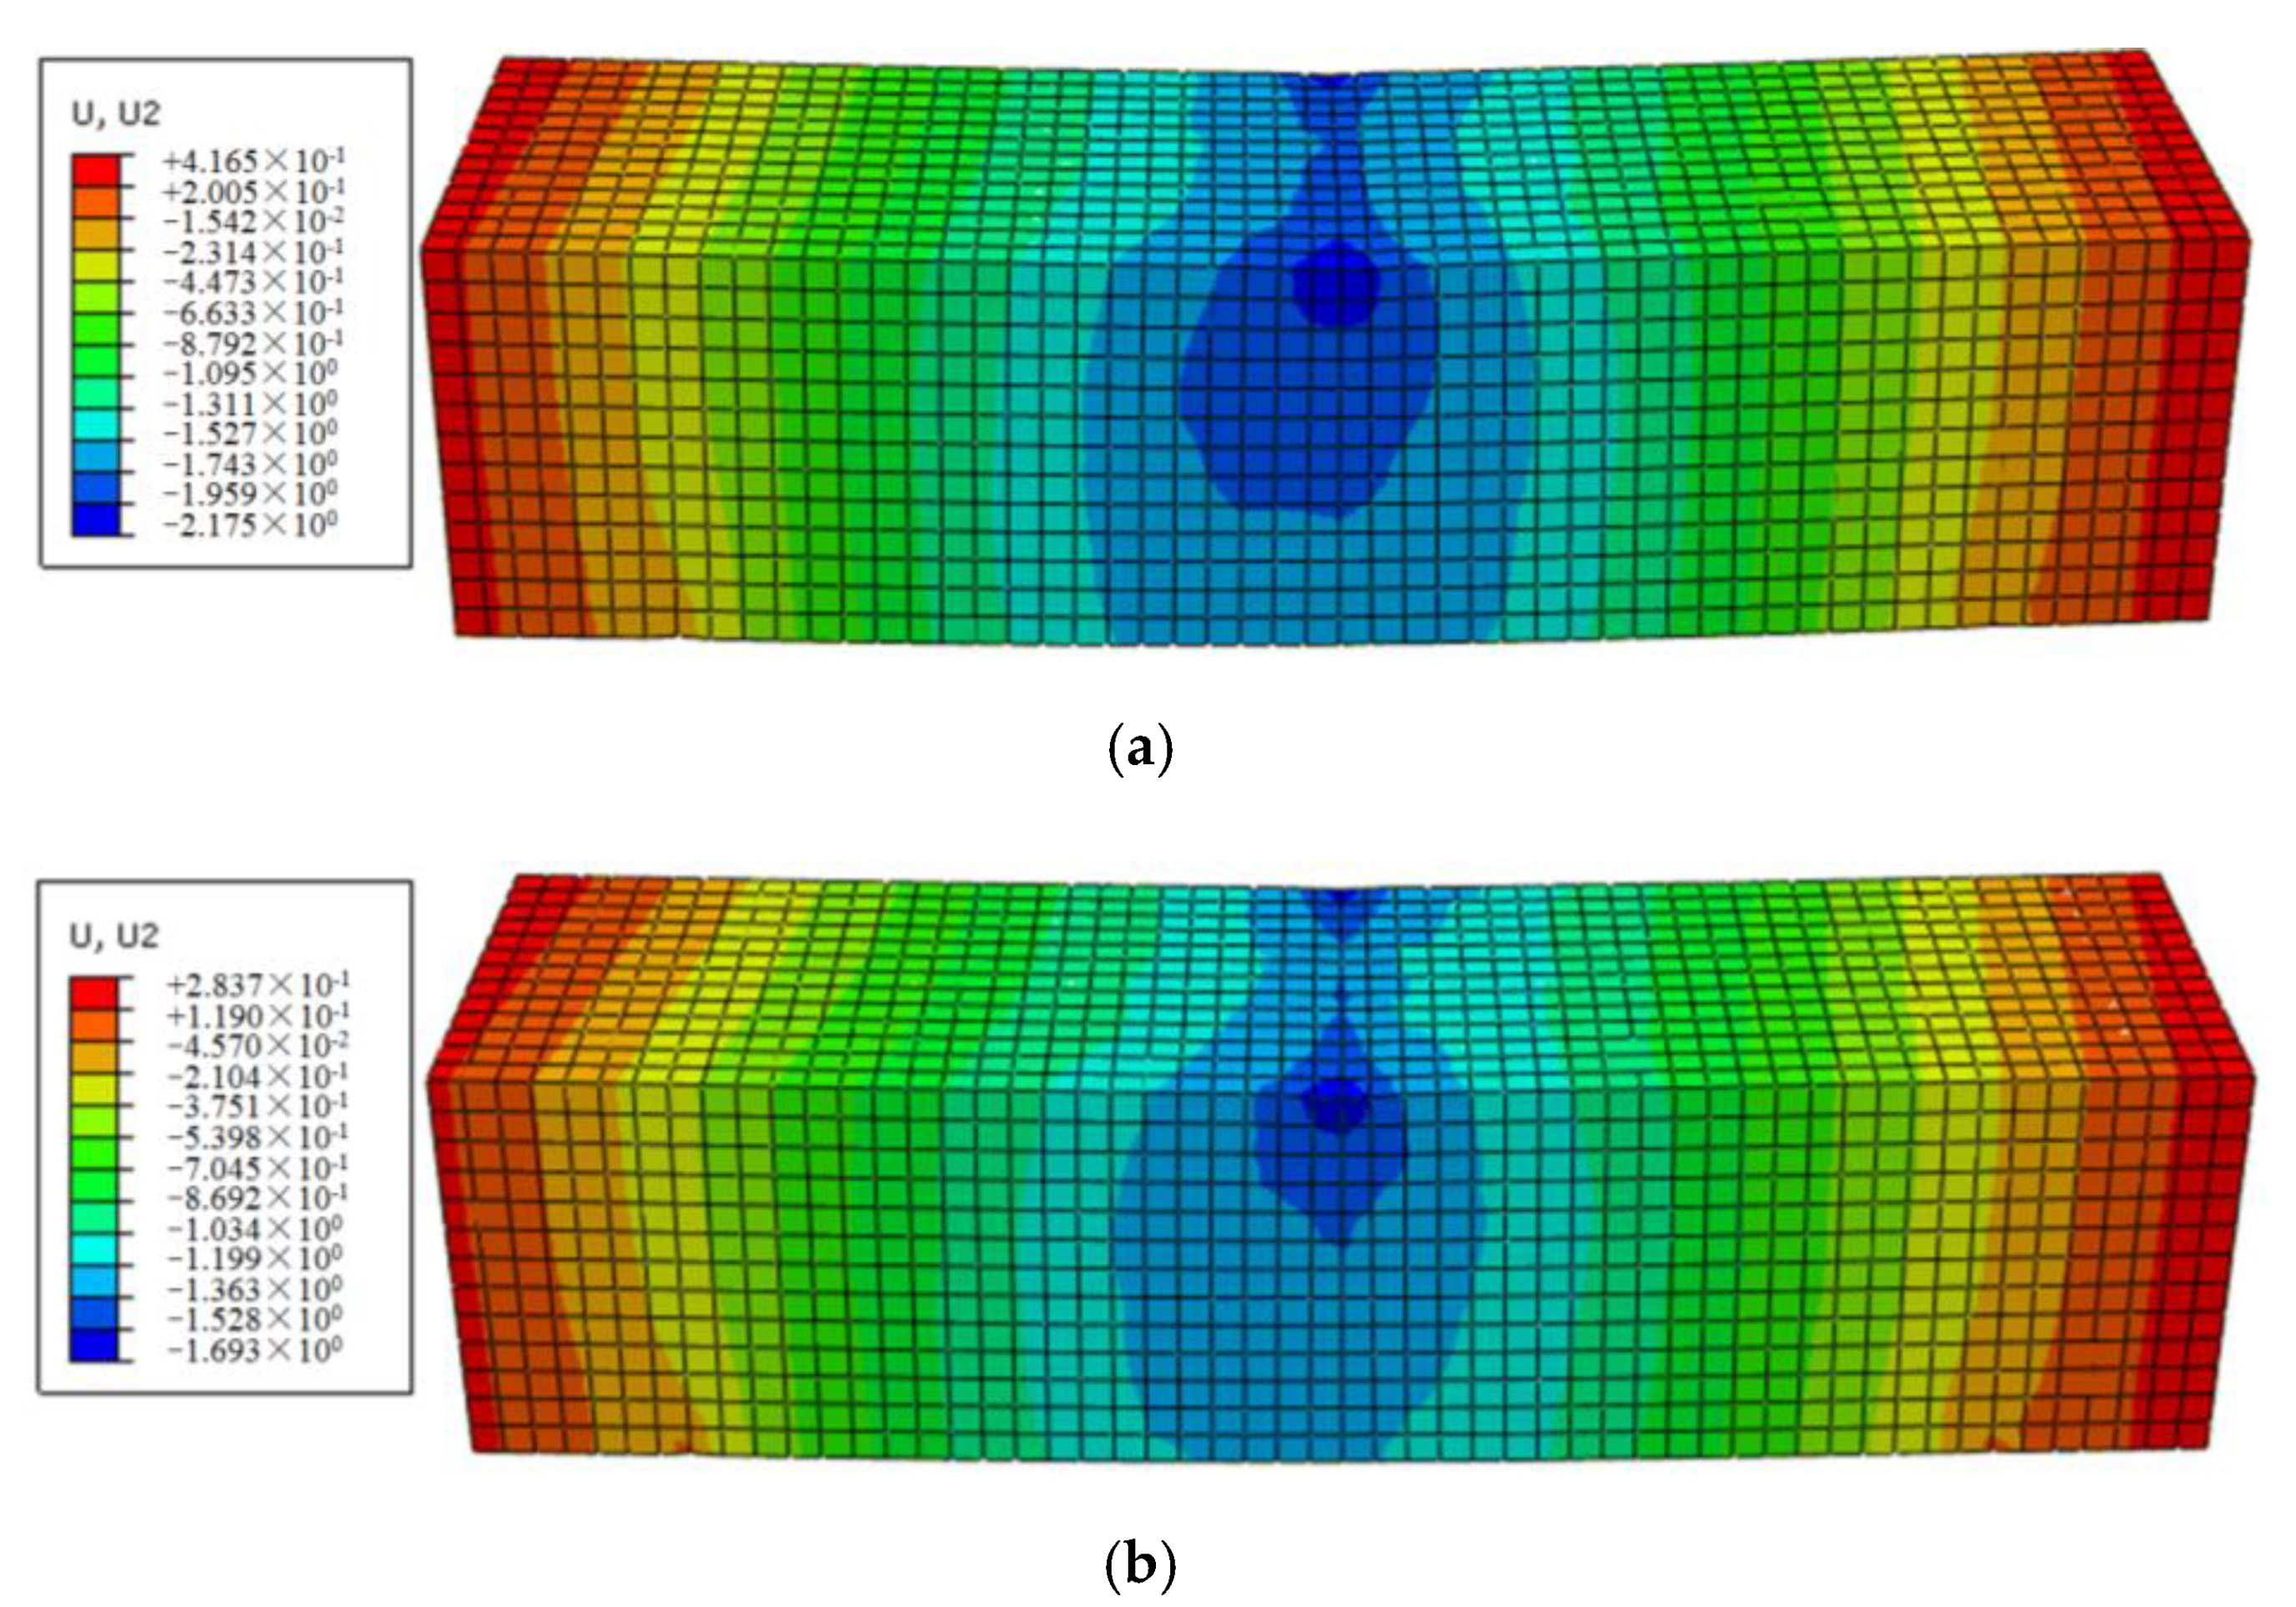
3.3.2. Simulation of Flexural–Rheological Behaviors for Pure Asphalt Mortar
3.4. Numerical Simulation of FRAM
3.4.1. Generation of A 3D Beam Sample Model for Fibers
3.4.2. Conversion of Fiber Contents
3.4.3. FE Modeling of FRAM
4. Results and Analysis
4.1. Effect of Fiber Contents
4.2. Effect of Fiber Aspect Ratios
4.3. Effect of Fiber Types
4.4. Sensitivity Analysis of Viscoelastic Properties for FRAM
5. Conclusions
Author Contributions
Funding
Acknowledgments
Conflicts of Interest
References
- Slebi-Acevedo, C.J.; Lastra-González, P.; Pascual-Muñoz, P. Mechanical performance of fibers in hot mix asphalt: A review. Constr. Build. Mater. 2019, 200, 756–769. [Google Scholar] [CrossRef]
- Chen, H.; Xu, Q.; Chen, S. Evaluation and design of fiber-reinforced asphalt mixtures. Mater. Des. 2009, 30, 2595–2603. [Google Scholar] [CrossRef]
- Abtahi, S.M.; Sheikhzadeh, M.; Hejazi, S.M. Fiber-reinforced asphalt-concrete—A review. Constr. Build. Mater. 2010, 24, 871–877. [Google Scholar] [CrossRef]
- Lee, S.J.; Rust, J.P.; Hamouda, H. Fatigue cracking resistance of fiber-reinforced asphalt concrete. Text. Res. 2005, 75, 123–128. [Google Scholar] [CrossRef]
- Liu, X.; Wu, S. Study on the graphite and carbon fiber modified asphalt concrete. Constr. Build. Mater. 2011, 25, 1807–1811. [Google Scholar] [CrossRef]
- Wu, S.; Ye, Q.; Li, N. Effects of fibers on the dynamic properties of asphalt mixtures. J. Wuhan. Univ. Technol. Mater. Sci. Ed. 2007, 22, 733–736. [Google Scholar] [CrossRef]
- Wu, S.; Ye, Q.; Li, N. Investigation of rheological and fatigue properties of asphalt mixtures containing polyester fibers. Constr. Build. Mater. 2008, 22, 2111–2115. [Google Scholar] [CrossRef]
- Ye, Q.; Wu, S.; Li, N. Investigation of the dynamic and fatigue properties of fiber-modified asphalt mixtures. Int. J. Fatigue. 2009, 31, 1598–1602. [Google Scholar] [CrossRef]
- Guo, Q.; Li, L.; Cheng, Y. Laboratory evaluation on performance of diatomite and glass fiber compound modified asphalt mixture. Mater. Des. 2015, 66, 51–59. [Google Scholar] [CrossRef]
- García, A.; Norambuena-Contreras, J.; Partl, M.N. Uniformity and mechanical properties of dense asphalt concrete with steel wool fibers. Constr. Build. Mater. 2013, 43, 107–117. [Google Scholar] [CrossRef]
- Morova, N. Investigation of usability of basalt fibers in hot mix asphalt concrete. Constr. Build. Mater. 2013, 47, 175–180. [Google Scholar] [CrossRef]
- Cheng, Y.; Yu, D.; Gong, Y. Laboratory evaluation on performance of eco-friendly basalt fiber and diatomite compound modified asphalt mixture. Materials 2018, 11, 2400. [Google Scholar] [CrossRef] [PubMed]
- Gu, X.; Zhang, X.; Lv, J. Laboratory Performance Evaluation of Reinforced Basalt Fiber in Sealing Asphalt Chips. J. Mater. 2017, 46, 1269–1279. [Google Scholar] [CrossRef]
- García, A.; Norambuena-Contreras, J.; Bueno, M. Influence of steel wool fibers on the mechanical, termal, and healing properties of dense asphalt concrete. J. Test. Eval. 2014, 42, 1107–1118. [Google Scholar] [CrossRef]
- Wang, X.; Qiu, Y.J.; Xue, S.Y. Study on durability of high-modulus asphalt mixture based on TLA and fibre composite modification technology. Int. J. Pavement Eng. 2018, 19, 930–936. [Google Scholar] [CrossRef]
- Miao, Y.; Wang, T.; Wang, L. Influences of interface properties on the performance of fiber-reinforced asphalt binder. Polymers 2019, 11, 542. [Google Scholar] [CrossRef] [PubMed]
- Wang, W.; Cheng, Y.; Zhou, P. Performance evaluation of Styrene-Butadiene-Styrene-Modified stone mastic asphalt with basalt fiber using different compaction methods. Polymers 2019, 11, 1006. [Google Scholar] [CrossRef]
- Wang, M.; Zhang, Z.; Li, Y. Chemical durability and mechanical properties of alkali-proof basalt fiber and its reinforced epoxy composites. J. Reinf. Plast. Compos. 2008, 27, 393–407. [Google Scholar] [CrossRef]
- Wang, D.; Wang, L.; Gu, X. Effect of basalt fiber on the asphalt binder and mastic at low temperature. J. Mater. Civ. Eng. 2013, 25, 355–364. [Google Scholar] [CrossRef]
- Ralph, C.; Lemoine, P.; Summerscales, J. Relationships among the chemical, mechanical and geometrical properties of basalt fibers. Text. Res. 2019, 89, 3056–3066. [Google Scholar] [CrossRef]
- Lackner, R.; Spiegl, M.; Blab, R. Is low-temperature creep of asphalt mastic independent of filler shape and mineralogy?—arguments from multiscale analysis. J. Mater. Civ. Eng. 2005, 17, 485–491. [Google Scholar] [CrossRef]
- Kandhal, P.S.; Lynn, C.Y.; Parker, F. Characterization tests for mineral fillers related to performance of asphalt paving mixtures. Transp. Res. Rec. 1998, 1638, 101–110. [Google Scholar] [CrossRef]
- Bonnetti, K.S.; Nam, K.; Bahia, H.U. Measuring and defining fatigue behavior of asphalt binders. Transp. Res. Rec. 2002, 1810, 33–43. [Google Scholar] [CrossRef]
- Kim, Y.R.; Allen, D.H.; Little, D.N. Computational constitutive model for predicting nonlinear viscoelastic damage and fracture failure of asphalt concrete mixtures. Int.J.Geo. 2007, 7, 102–110. [Google Scholar] [CrossRef]
- Tayfur, S.; Ozen, H.; Aksoy, A. Investigation of rutting performance of asphalt mixtures containing polymer modifiers. Constr. Build. Mater. 2007, 21, 328–337. [Google Scholar] [CrossRef]
- Tapkın, S. The effect of polypropylene fibers on asphalt performance. Build. Envi. 2008, 43, 1065–1071. [Google Scholar] [CrossRef]
- Xu, Q.; Chen, H.; Prozzi, J.A. Performance of fiber reinforced asphalt concrete under environmental temperature and water effects. Constr. Build. Mater. 2010, 24, 2003–2010. [Google Scholar] [CrossRef]
- Zhang, X.; Gu, X.; Lv, J. Numerical analysis of the rheological behaviors of basalt fiber reinforced asphalt mortar using ABAQUS. Constr. Build. Mater. 2017, 157, 392–401. [Google Scholar] [CrossRef]
- Zhang, X.Y.; Gu, X.Y.; Lv, J.X. 3D model to investigate the rheological properties of basalt fiber reinforced asphalt-like materials. Constr. Build. Mater. 2017, 138, 185–194. [Google Scholar] [CrossRef]
- Zhang, X.Y.; Gu, X.Y.; Lv, J.X. Effect of basalt fiber distribution on the flexural–tensile rheological performance of asphalt mortar. Constr. Build. Mater. 2018, 179, 307–314. [Google Scholar] [CrossRef]
- Wang, Z.; Smith, D.E. Numerical analysis on viscoelastic creep responses of aligned short fiber reinforced composites. Compos. Struct. 2019, 229, 111394. [Google Scholar] [CrossRef]
- Standard JTG E42-2005. Test Methods of Aggregate for Highway Engineering; China Communications Press: Beijing, China, August 2005; pp. 8–133. [Google Scholar]
- Standard JTG E20-2011. Standard Test Methods of Bitumen and Bituminous Mixtures for Highway Engineering; China Communications Press: Beijing, China, December 2011; pp. 186–356. [Google Scholar]
- Standard JTG F40-2004. Technical Specifications for Construction of Highway Asphalt Pavements; China Communications Press: Beijing, China, November 2004; pp. 23–39. [Google Scholar]
- Głodkowska, W.; Kobaka, J. Modelling of properties and distribution of steel fibres within a fine aggregate concrete. Constr. Build. Mater. 2013, 44, 645–653. [Google Scholar] [CrossRef]
- Fang, Q.; Zhang, J. Three-dimensional modelling of steel fiber reinforced concrete material under intense dynamic loading. Constr. Build. Mater. 2013, 44, 118–132. [Google Scholar] [CrossRef]


| Sieve Size (mm) | Retained Weight Percentage of Gradation (%) | |||||
|---|---|---|---|---|---|---|
| 1.18 | 0.6 | 0.3 | 0.15 | 0.075 | <0.075 | |
| Asphalt mixture for AC13 | 9.0 | 7.8 | 5.5 | 2.7 | 2.3 | 7.9 |
| Asphalt mortar for AC13 | 25.6 | 22.2 | 15.6 | 7.7 | 6.5 | 22.4 |
| Types | Elongation (%) | Elastic Modulus (GPa) | Tensile Strength (MPa) | Density (g/cm3) |
|---|---|---|---|---|
| BF | 3.1 | 100 | 4500 | 2.70 |
| SWF | 6.2 | 200 | 1500 | 7.50 |
| Parameters | E1 (MPa) | η1 (MPa·s) | E2 (MPa) | η2 (MPa·s) | R-square |
|---|---|---|---|---|---|
| Values | 16.6 | 1.57×10⁴ | 4.82 | 2.38 × 10³ | 0.998 |
| Parameters | E1 (MPa) | E2 (MPa) | η1 (MPa·s) | η2 (MPa·s) | g1 | g2 | τ1 | τ2 |
|---|---|---|---|---|---|---|---|---|
| Values | 16.6 | 4.82 | 1.57 × 10⁴ | 2.38 × 10³ | 0.812 | 0.188 | 102 | 4.61 × 10³ |
| Types | Values of Fiber Contents | ||
|---|---|---|---|
| Fiber contents in asphalt mixture (%) | 0.1 | 0.2 | 0.3 |
| Fiber contents in asphalt mortar (%) | 0.26 | 0.53 | 0.79 |
© 2020 by the authors. Licensee MDPI, Basel, Switzerland. This article is an open access article distributed under the terms and conditions of the Creative Commons Attribution (CC BY) license (http://creativecommons.org/licenses/by/4.0/).
Share and Cite
Zhang, X.; Xu, L.; Lv, J. Investigation on the Flexural–Tensile Rheological Behavior and Its Influence Factors of Fiber-Reinforced Asphalt Mortar. Polymers 2020, 12, 1970. https://doi.org/10.3390/polym12091970
Zhang X, Xu L, Lv J. Investigation on the Flexural–Tensile Rheological Behavior and Its Influence Factors of Fiber-Reinforced Asphalt Mortar. Polymers. 2020; 12(9):1970. https://doi.org/10.3390/polym12091970
Chicago/Turabian StyleZhang, Xiaoyuan, Li Xu, and Junxiu Lv. 2020. "Investigation on the Flexural–Tensile Rheological Behavior and Its Influence Factors of Fiber-Reinforced Asphalt Mortar" Polymers 12, no. 9: 1970. https://doi.org/10.3390/polym12091970
APA StyleZhang, X., Xu, L., & Lv, J. (2020). Investigation on the Flexural–Tensile Rheological Behavior and Its Influence Factors of Fiber-Reinforced Asphalt Mortar. Polymers, 12(9), 1970. https://doi.org/10.3390/polym12091970