Article

Sequestration of Sulfate Anions from Groundwater by Biopolymer-Metal Composite Materials

by
Md. Mehadi Hassan
1,2,†,
Mohamed H. Mohamed
1,†,
Inimfon A. Udoetok
1,†,
Bernd G. K. Steiger
1 and
Lee D. Wilson
1,*
1
Department of Chemistry, University of Saskatchewan, 110 Science Place, Saskatoon, SK S7N 5C9, Canada
2
Department of Arts and Sciences, Bangladesh Army University of Science and Technology, Saidpur 5311, Bangladesh
*
Author to whom correspondence should be addressed.
Denotes equal authorship contributions to this work.
Polymers 2020, 12(7), 1502; https://doi.org/10.3390/polym12071502
Submission received: 2 June 2020 / Revised: 25 June 2020 / Accepted: 4 July 2020 / Published: 6 July 2020

Abstract

:
Binary (Chitosan-Cu(II), CCu) and Ternary (Chitosan-Alginate-Cu(II), CACu) composite materials were synthesized at variable composition: CCu (1:1), CACu1 (1:1:1), CACu2 (1:2:1) and CACu3 (2:1:1). Characterization was carried out via spectroscopic (FTIR, solids C-13 NMR, XPS and Raman), thermal (differential scanning calorimetry (DSC) and TGA), XRD, point of zero charge and solvent swelling techniques. The materials’ characterization confirmed the successful preparation of the polymer-based composites, along with their variable physico-chemical and adsorption properties. Sulfate anion (sodium sulfate) adsorption from aqueous solution was demonstrated using C and CACu1 at pH 6.8 and 295 K, where the monolayer adsorption capacity (Qm) values were 288.1 and 371.4 mg/g, respectively, where the Sips isotherm model provided the “best-fit” for the adsorption data. Single-point sorption study on three types of groundwater samples (wells 1, 2 and 3) with variable sulfate concentration and matrix composition in the presence of composite materials reveal that CACu3 exhibited greater uptake of sulfate (Qe = 81.5 mg/g; 11.5% removal) from Well-1 and CACu2 showed the lowest sulfate uptake (Qe of 15.7 mg/g; 0.865% removal) from Well-3. Generally, for all groundwater samples, the binary composite material (CCu) exhibited attenuated sorption and removal efficiency relative to the ternary composite materials (CACu).

Graphical Abstract

1. Introduction

Sulfate is one of the naturally occurring ubiquitous oxyanions commonly found in most water supplies. Sulfate contamination of water originates from both natural and anthropogenic sources. The natural sources include dissolution and oxidation of sulfate minerals such as gypsum and pyrite along with precipitation and volcanic activity. On the other hand, anthropogenic sources include sewage streams, synthetic detergents, industrial wastewater, mining drainage and mineral tailings, where levels can reach 10,000 mg/L [1,2,3,4]. The sulfate anions can exist in various forms with varying concentrations according to the water source and the nature of the industrial activities of the region [4,5]. The toxicological effects of sulfate in humans and animals have been reported to include catharsis, diarrhea, and dehydration as well as changes in methaemoglobin and sulfhaemoglobin levels [1,6]. In freshwater species, sulfate can be lethal at elevated concentrations due to osmoregulatory stress [7,8]. The latter occurs upon bacterial reduction of sulfate under anaerobic conditions to produce hydrogen sulfide (H2S) [9] The weak acid properties of aqueous hydrogen sulfide solution can be significantly harmful to human beings, while also raising corrosion concerns [10,11]. The presence of aqueous hydrogen sulfide is a serious toxicity concern since it does not alter the physicochemical properties (odour and taste) of water and may not be easily detected at low concentrations [11]. The consumption of a toxic dose of H2S in drinking water can cause dehydration, cardiac arrhythmias, amnesia, pulmonary edema, neural paralysis and other physiological problems [12,13,14]. Microbially assisted formation of H2S has led to water quality guidelines that recommend sulfate levels ca. 250–500 mg/L sulfate to ensure safe water for human and livestock consumption [6,15,16].
The toxicity challenges presented by the presence of sulfate species in water along with its high solubility and mobility calls for an efficient and cost-effective strategy for its controlled removal from groundwater as well as industrial effluent [17,18]. Techniques for sulfate removal such as precipitation [1,19], biological degradation [20,21], reverse osmosis [22], membrane filtration [23], electrocoagulation [24], crystallization [25], adsorption [26] and/or ion exchange [27], are commonly known methods. Among these techniques, adsorption-based removal with biopolymer adsorbents may offer advantages (minimal infrastructure and operational cost) over synthetic adsorbent materials or conventional treatment methods such as reverse osmosis [26]. As well, the synthetic utility of biopolymers for tailored modification add to its technical feasibility, cost effectiveness, sustainability, selectivity and treatment efficiency for diverse effluent sources with variable sulfate concentration [28,29]. Additionally, the aforementioned properties of biopolymers lend to their suitability for various environmental applications that include but are not limited to flocculation, drug delivery and agriculture [30,31,32,33,34,35]. By contrast, conventional materials such as zeolites are naturally occurring minerals, however; the production and regeneration costs may pose limitations on their sustainable utility as adsorbents. By contrast, renewable biomass such as alginate and chitosan continue to generate great interest due to their relative abundance and synthetic versatility [36,37,38].
Chitosan has found many applications that build upon its unique properties such as biocompatibility, lack of odour and biodegradability [39]. In particular, chitosan is a partially deacetylated form of chitin that is characterized by available amino and hydroxyl groups. At pH conditions below 6.5, the amino groups of chitosan are protonated, which results in variable water solubility according to the type of acid media and the degree of deacetylation [40]. The –OH and –NH2 groups of chitosan offer potential ligation sites to form complexes with transition metal ions [41,42,43] along with anionic biopolymers such as alginate [44,45]. On the other hand, alginate is an anionic biopolymer obtained from brown algae and bacteria where, α-L-guluronic (G) and β-D-mannuronic (M) acid constitute its monomer units [44,46]. The formation of chitosan- or alginate-metal ion binary complexes afford modification of the physicochemical and structural properties of the biopolymer or metal ion precursors upon complex formation due to changes in electrostatic potential. The unique properties of such complexes has led to their utility as dialysis and ultrafiltration membranes [47], drug delivery agents [48] and biosorbent materials [49]. Recent review articles [39,50,51,52] on alginate and chitosan-based adsorbents reveal their application as adsorbents for cation and anion species. As well, such biopolymers are established for removal of dyes and heavy metals, whereas studies of biopolymer-metal ion complexes are sparsely reported for the adsorption of sulfate from aqueous solution, according to the examples provided in Table 1.
This study focuses on the synthesis and characterization of binary (two-component) and ternary (three-component) composite materials that contain animal and/or plant biopolymers (chitosan and alginate) as building blocks in conjunction with copper (II) species. The unique contribution of Cu(II) species to the formation the ternary biopolymer composites yield enhanced adsorption capacity of sulfate anions for laboratory and groundwater samples will be demonstrated herein. A comparison of related materials in this study will reveal that the composition of composites (binary and ternary) and their sulfate uptake properties are unique at pH 7.

2. Materials and Methods

2.1. Materials

Low molecular weight industrial grade chitosan (C) powder with ~75–85% deacetylation, copper (II) chloride (≥97%), barium chloride (≥99.9%), KBr (spectroscopic grade), sodium hydroxide, HCl, sodium chloride (≥99.9% crystalline), sodium sulfate anhydrous (≥99.9%) and acetic acid were obtained from Sigma Aldrich (St. Louis, MO, USA). Alginic (A) acid sodium salt (low viscosity) was obtained from Alfa Aesar (Tewksbury, MA, USA). All materials were used as received without further purification.

2.1.1. Synthesis of a Chitosan Copper (II) Binary Composite: CCu

Chitosan (1 g) was dissolved in 50 mL (5% acetic acid) solution. The pH of the solution was raised to pH 5.6 using 1M NaOH. CuCl2 solution (0.006 mol) was then added dropwise to the chitosan solution and incubated for 3 h, where the final solution pH was near pH 7. The pH of the resulting mixture was adjusted to 7 with 2M NaOH to precipitate the chitosan-copper (CCu) binary composite. The composite was washed with copious amount of Millipore water to remove the unreacted reagents. The product was dried in an oven at 60 °C and the composite was ground in a mortar and pestle and passed through a 40-mesh sieve prior to use.

2.1.2. Synthesis of Chitosan, Alginate and Copper-Based Ternary Composites: CACu

The synthesis of CACu1 ternary composite was carried out according to the procedure reported in Section 2.2.1 with minor modification, as follows: 1 g (0.006 mol) of chitosan was dissolved in 50 mL of 5% acetic acid solution, while 1.3 g (0.006 mol) of alginate (A) was dissolved in 50 mL of Millipore water. The pH of the solution was adjusted to pH 5.6 using 1M NaOH added dropwise to the alginate solution with stirring until a homogeneous blend was obtained. CuCl2 solution (0.006 mol) was added to the chitosan-alginate blend with stirring and incubated for 3 h. The pH of the mixture was adjusted to 7 with 2M NaOH to precipitate the chitosan-alginate-copper (CACu1) ternary composite. The composite was washed with a generous amount of Millipore water to get rid of unreacted reagents. The product was dried in an oven at 60 °C and the composite was ground in a mortar and pestle and passed through a 40-mesh sieve prior to use. The other composite materials CACu2 and CACu3 were synthesized according to the above procedure, where the weight of chitosan and alginate were varied to yield the desired weight ratio (cf. Table 2).

2.2. Characterization

2.2.1. Fourier Transform Infrared (FTIR) Spectroscopy

The FTIR spectra of the chitosan (C), alginate (A), CCu and CACu composite materials were obtained using a Bio-RAD FTS-40 IR spectrophotometer (Bio-Rad Laboratories, Inc., Philadelphia, PA, USA). Dried powder samples were mixed with pure spectroscopic grade KBr in a 1:10 weight ratio with grinding in a small mortar and pestle. The DRIFT (Diffuse Reflectance Infrared Fourier Transform) spectra were obtained in reflectance mode at 295 K with a resolution of 4 cm−1 over a spectral range of 400–4000 cm−1. Multiple scans were recorded and corrected relative to a KBr background.

2.2.2. X-ray diffraction (XRD)

X-ray diffraction (XRD) profiles of the composite materials were obtained using a Rigaku Ultima IV X-Ray diffractometer, Cu-source, wavelength 1.54056Å (Austin, TX, USA) in the range of 2θ = 10°–80° at 40 kV potential and 40 mA current.

2.2.3. Thermal Gravimetric Analysis (TGA)

Thermal profiles of the composite materials were obtained using a TA Instruments Q50 TGA system (New Castle, DE, USA) using a heating rate of 5 °C/min up to 500 °C and nitrogen as the carrier gas. The results reported herein are shown as first derivative (DTG) plots of weight with temperature (%/°C) against temperature (°C).

2.2.4. Solids C-13 NMR Spectroscopy

A Bruker AVANCE III HD spectrometer (Bruker Bio Spin Corp., Billerica, MA, USA) furnished with a 4 mm DOTY CP-MAS (cross-polarization with magic angle spinning) solids probe operating at 125.8 MHz (1H frequency at 500.2 MHz) was used to acquire the C-13 solids NMR spectra of the chitosan, alginate and the composite materials. The experimental conditions are given as follows: spinning speed of 10 kHz, a 1H 90° pulse of 3.5 µs, a contact time of 0.75 ms, with a ramp pulse on the 1H channel, MAS rate of 10 kHz, a 13C 90° pulse width of 3.15 µs and a 25 kHz SPINAL-64 1H decoupling sequence during acquisition. In general, 600–5000 scans were accumulated, with a recycle delay of 2 s. All experiments were recorded using a 71 kHz SPINAL-64 decoupling sequence during acquisition, and the 13C NMR chemical shifts were referenced to adamantane at 38.48 ppm (low field signal).

2.2.5. Raman Spectroscopy

One-dimensional (1–D) Raman spectra were obtained using a Renishaw InVia Reflex Raman microscope (785 nm solid state diode laser with a 1200 lines/mm grating system) (Renishaw plc, New Mills, UK) with a Pelletier cooled CCD (charge coupled device) detector (400 × 576 pixels). The instrument wavelength was calibrated at 520 cm−1 using an internal Si (110) sample.

2.2.6. Differential Scanning Calorimetry (DSC)

DSC thermograms were acquired using a TA Q50 (New Castle, DE, USA) thermal analyzer over a variable temperature range (30–180 °C). The scan rate was set to 10 °C/min while nitrogen gas was used to regulate the sample temperature and purge the sample compartment housing, where ca. 10 mg of sample was used for analysis.

2.2.7. Point-of-Zero-Charge (PZC)

The point-of-zero-charge (PZC) of sample materials was determined according to a reported method [59]. A stock solution of NaCl (0.01 M) was prepared and 25 mL portions were transferred into five vials (8-dram). The solution pH conditions of the samples were adjusted between pH 2 to 10 using aqueous NaOH or HCl solutions. The sorbent materials (ca. 50 mg) were added to each solution and allowed to equilibrate for 48 h before the final pH was recorded.

2.2.8. Solvent Swelling Test

The solvent swelling properties in water of the composite materials (ca. 100 mg) was measured upon equilibration in Millipore water (30 mL) for 24 h. The degree of swelling (Sw) in water for the composites was calculated according to Equation (1):
S w = W s W d W d × 100 %
Ws is the wet sample weight, and Wd refers to the dry sample weight after oven drying at 60 °C for 24 h to a constant value.

2.2.9. X-ray Photoelectron Spectroscopy (XPS)

All XPS measurements were collected using a Kratos (Manchester, UK) AXIS Supra system equipped with a 500 mm Rowland circle monochromated Al K-α (1486.6 eV) source, combined hemi-spherical analyzer (HSA) and spherical mirror analyzer (SMA). A spot size of hybrid slot (300 × 700 microns) was used. All survey scan spectra were collected in the 5 to 1200 binding energy range in 1 eV steps with a pass energy of 160 eV. An accelerating voltage of 15 keV and an emission current of 15 mA were used for the XPS data collection.

2.2.10. Leaching of Cu(II) Species

For the leaching test, the adsorbent (ca. 100 mg) was added to 30 mL Millipore water and equilibrated at 295 K on a horizontal shaker table for 24 h to determine whether the Cu(II) concentration exceeded 1000 µg/L, according to measurements acquired using ICP-OES.

2.3. Adsorption Studies

2.3.1. Equilibrium Adsorption Experiments

The equilibrium adsorption studies were carried out in batch mode using Na2SO4 (aq) at variable concentration (100–5000 ppm) as the adsorbate system. A fixed amount of adsorbent (~10 mg) was added to 6-dram vials and 15 mL of Na2SO4 (aq) solution at variable concentration at pH 6.8 was transferred to the vials. The mixtures were equilibrated at 295 K on a horizontal shaker table for 24 h. The initial concentration (C0) before sorption and residual concentration after sorption were determined using a Thermo ScientificTM SPECTRONIC 200E (Ottawa, ON, Canada) spectrophotometer at 420 nm. The samples were centrifuged prior to UV-vis spectroscopy analyses as required. The uptake of sulfate ions by the adsorbents was determined according to Equation (2). For the ground water samples, ~100 mg of the composite materials and 30 mL of the groundwater samples were used for the batch mode experiments.
Q e = C 0 C e m   V
Qe is the quantity of adsorbed species (SO42−) in the solid phase at equilibrium (mg/g); C0 is initial concentration of the adsorbate (mg/L) in solution; Ce is concentration of SO42− at equilibrium (mg/L) in aqueous solution; V is volume of adsorbate solution (L) and m is the weight (g) of sorbent. Herein, four adsorbents were used for the removal of sulfate ions for a synthetically prepared solution, along with groundwater samples labeled as Well-1, -2 and -3. The elemental analyses of these water samples are listed in Tables S1–S3, respectively, as listed in the Supplementary Materials (SI).

2.3.2. Sorption Isotherms and Modeling

The adsorption results were analyzed using the Sips isotherm model (Equation (3)) where the “best fit” of Equation (3) to the data was obtained by minimizing the SSE (Equation (4)) for all data across the range of conditions [60]. Qei is the experimental value, Qef is the calculated value from the data fitting and N is the number of Qe data points.
Q e = Q m ( K s C e ) n s 1 + ( K s C e ) n s
SSE = ( Q ei Q ef ) 2 N

3. Results and Discussion

The structural characterization of the composites is described in the following sections by several complementary spectroscopic, thermal analysis and other methods. As well, the sulfate adsorption properties were studied using laboratory and groundwater field samples at variable conditions.

3.1. Fourier Transform Infrared (FTIR) Spectral Analysis

Functional groups and chemical bonds of a molecule can be characterized by use of IR spectral results. Figure 1 shows the DRIFT spectra of the biopolymers and composites (C, A, CACu1 CACu2, CACu3 and CCu) over the 4000 to 500 cm−1 spectral region. The IR spectrum of pristine chitosan has a broad band at 3473 cm−1, which is assigned to the N–H and hydrogen bonded O–H vibrational bands. The absence of a sharp absorption band near 3500 cm−1 in all composite materials indicates the relative absence of free OH groups. Moreover, the C–H stretch region had a high intensity (2898 cm−1) and lower intensity band (2877 cm−1) assigned to the symmetric and asymmetric modes of the CH2 groups, respectively [61]. A characteristic CH2 scissoring band is present at 1418 cm−1 along with a C=O stretch of an amide band at 1663 cm−1 for chitosan, where the bending vibrations of a secondary amide (δN–H) is noted at 1596 and 1541 cm−1 [62]. The IR spectrum of sodium alginate has a characteristic –OH stretching band at 3480 cm−1, C–H stretching vibrations at 2927 cm−1 and asymmetric stretching vibration for –COOH at 1648 cm−1. The bands at 1306 and 1426 cm−1 relate to symmetric C–O stretching of the carboxyl groups, whereas the IR bands at 937 and 1104 cm−1 were assigned to elongation of C–O groups [63,64,65]. Upon composite formation, the C=O stretching and bending bands exhibit broadening along with a shift to lower wavenumber values, respectively. The broadening and shifting of the IR bands indicate the involvement of the C=O groups in composite formation between chitosan and alginate along with Cu(II) species [66]. The IR results indicate the coordination of amine groups and the amide C=O groups with Cu(II) species yield the formation of composites. However, in the case of CACu2, asymmetric and symmetric stretching vibrations for the –COOH groups of alginate did not reveal any significant change. Thus, these results suggest that limited coordination occurs between alginate and the Cu(II) species upon ternary composite formation.

3.2. Raman Spectroscopy

While IR spectroscopy provides insight on functional groups that undergo a change in the dipole moment, Raman spectroscopy is complementary due to its sensitivity to transitions that undergo a change in polarizability. The Raman spectral data of the biopolymers and their composites is inferred to provide additional information on the binary and ternary composites reported herein. For example, in the case of IR spectra, it is evident that the amide (C=O) and amine groups undergo coordination with Cu(II) species to form both binary and ternary composites. The Raman spectra of chitosan, alginate and the films for the composite materials CCu, CACu1, CACu2 and CACu3 are shown in Figure 2. The characteristic Raman bands that reveal an interaction between Cu(II) species ion and carbonyl groups (C=O) of chitosan for the composites are observed between 281 to 349 cm−1 [67,68,69]. The formation of composites is also supported by the DRIFTS results, as evidenced by broadening of the C=O stretching band of amide groups between 1647 and 1655 cm−1 (cf. Figure 1). In the case of the CACu1, characteristic Raman spectral shifts are noted for interactions between the Cu(II) species and the carbonyl groups of chitosan but were not clearly observed for the other composites as noted in Figure 2. Additionally, Raman bands at 219/226/230/422/439/441/442/443 cm−1 may relate to the interaction between Cu(I) species and the amide carbonyl group (C=O) of chitosan for the composite materials [70].
The Raman results provide support that reduction of Cu(II) species to Cu(I) species may occur upon binding with the C=O groups of chitosan. A noteworthy observation is the absence of obvious signatures related to interactions between the carboxyl groups of alginate and Cu(II) species in the Raman spectra. The absence of such bands provide support that coordination occurs between Cu(II) species with chitosan. This may be due to steric interactions that occur due to hydration of the carboxylate anion that screens interactions with the Cu(II) species. In the case of the C=O groups of chitosan, a more apolar environment exists at ambient pH conditions that may favour complexation of chitosan with Cu(II) species versus the –COO– groups of alginate.

3.3. Thermogravimetric Analysis (TGA)

Thermal stability, resistance to oxidation and physical phenomena that show weight-loss events relates to the compositional nature of copolymer materials which can be studied from TGA-Differential Thermal Analysis (TGA-DTA) profiles [71,72]. Moreover, TGA is particularly sensitive for the detection of differences in structurally similar materials and complex multicomponent systems that vary according to their composition. The latter case applies to the composite materials reported herein. The thermal decomposition behavior of chitosan, alginate, CCu1 and the ternary composite materials are illustrated in Figure 3 and Figure S2a–f. These profiles reveal two or three thermal events that vary across a temperature range up to 400 °C, in parallel agreement with a related study [73]. In general, the first thermal event occurs between 36 to 120 °C that relates to loss of bound surface water and/or entrapped water from the composite network [74]. The first thermal event (36 to 120 °C) for the composite materials reveal a large fractional weight loss (8.2%) for CACu2, whereas 3.0% was observed for CACu2. This affirms the presence of abundant polar groups in CAlCu3 that affirm the formation of hydrogen bonds with water relative to CACu2. However, the weight loss of CCu and CACu1 was similar (6.9% and 7.2% respectively), as noted in Figure S2a–f. The thermal events above 150 °C relate to decomposition of the polymer framework. In the case of the biopolymers (C and A), thermal event occur at different Tmax values: 295 °C for C and 247 °C for A. These thermal events relate to the depolymerization and dehydration of the saccharide rings [75]. In the case of CCu, the weight loss events at ~215 °C result due to the breakdown of the biopolymer framework, whereas the thermal event at ~267 °C relates to bond breaking between Cu(II) species and the carbonyl group (C=O) of chitosan. The thermal event between 170–350 °C for CACu1, ca.180–320 °C for CACu2 and CACu3 materials relate to decomposition of C and A domains, along with bond breaking between Cu(II) ions and the carbonyl (C=O) group of chitosan, respectively. The lowest onset degradation temperature displayed by CACu2 may arise due to the higher alginate content in the composite; thereby resulting in a weaker interaction of Cu(II) species with the carbonyl group of chitosan. By comparison, CACu2 and CACu1 composites exhibit lower thermal stability relative to CCu and CACu3, in agreement with the more efficient binding of Cu(II) species to chitosan.

3.4. Solid State 13C NMR Spectroscopy

Solid state 13C NMR spectroscopy allows for the elucidation of changes in the chemical environment of biopolymer materials due to changes in the chemical shifts of nuclei that undergosolvation or interactions with other chemical species. The spectral assignment of chitosan in Figure 4 is given: δ105.1 = C-1; δ57.1 = C-2; δ74.9 = C-3/C-5; δ83.1 = C-4 and δ61.1 = C-6. Since the deacetylation of chitosan (~75–85%) is moderate, the acetyl group signature is noted at δ173.9 = C7 and δ23.6 = C8 [76]. The spectral assignment for alginate is also provided: δ101.1 for C-1; the four ring carbon (C-2, C-3, C-4 and C-5) lines at δ59.87 to δ85.3, where the characteristic C=O group appears at δ175.4. In the spectra of CACu1, CACu2, CACu3 and CCu composite materials, the merging of the signals for both carbonyl groups (C-7 for chitosan and C-6 for alginate) along with a broader 13C NMR signature at δ59.87–85.3 are observed. A new upfield 13C NMR line occurs for all composites near the δ28.7-35.9 region. These signals appear at δ31.4, δ30.1, δ30.8 and δ31.7 for CACu1, CACu2, CACu3 and CCu, respectively. These new peaks provide evidence of effective interaction between the copper species and the carbonyl oxygen of chitosan rather than interaction between Cu(II) with the carboxylate group of alginate, in agreement with the Raman spectral results in Figure 2. Moreover, the C-8 peak of chitosan becomes broadened for all composites, in agreement with the interaction of Cu(II) species and the C=O (acetyl) group of chitosan. In addition, ring carbon signatures for chitosan and alginate show broadening in the composites upon complex formation between the precursor units (Cu(II), chitosan and alginate). The 13C NMR spectra (Figure 4) and other results (cf. Figure 1, Figure 2 and Figure 3) provide support that interactions occur between Cu(II), chitosan and alginate, where the Cu(II) species are bound at the C=O (acetyl) moiety of chitosan, in agreement with the TGA and Raman results.

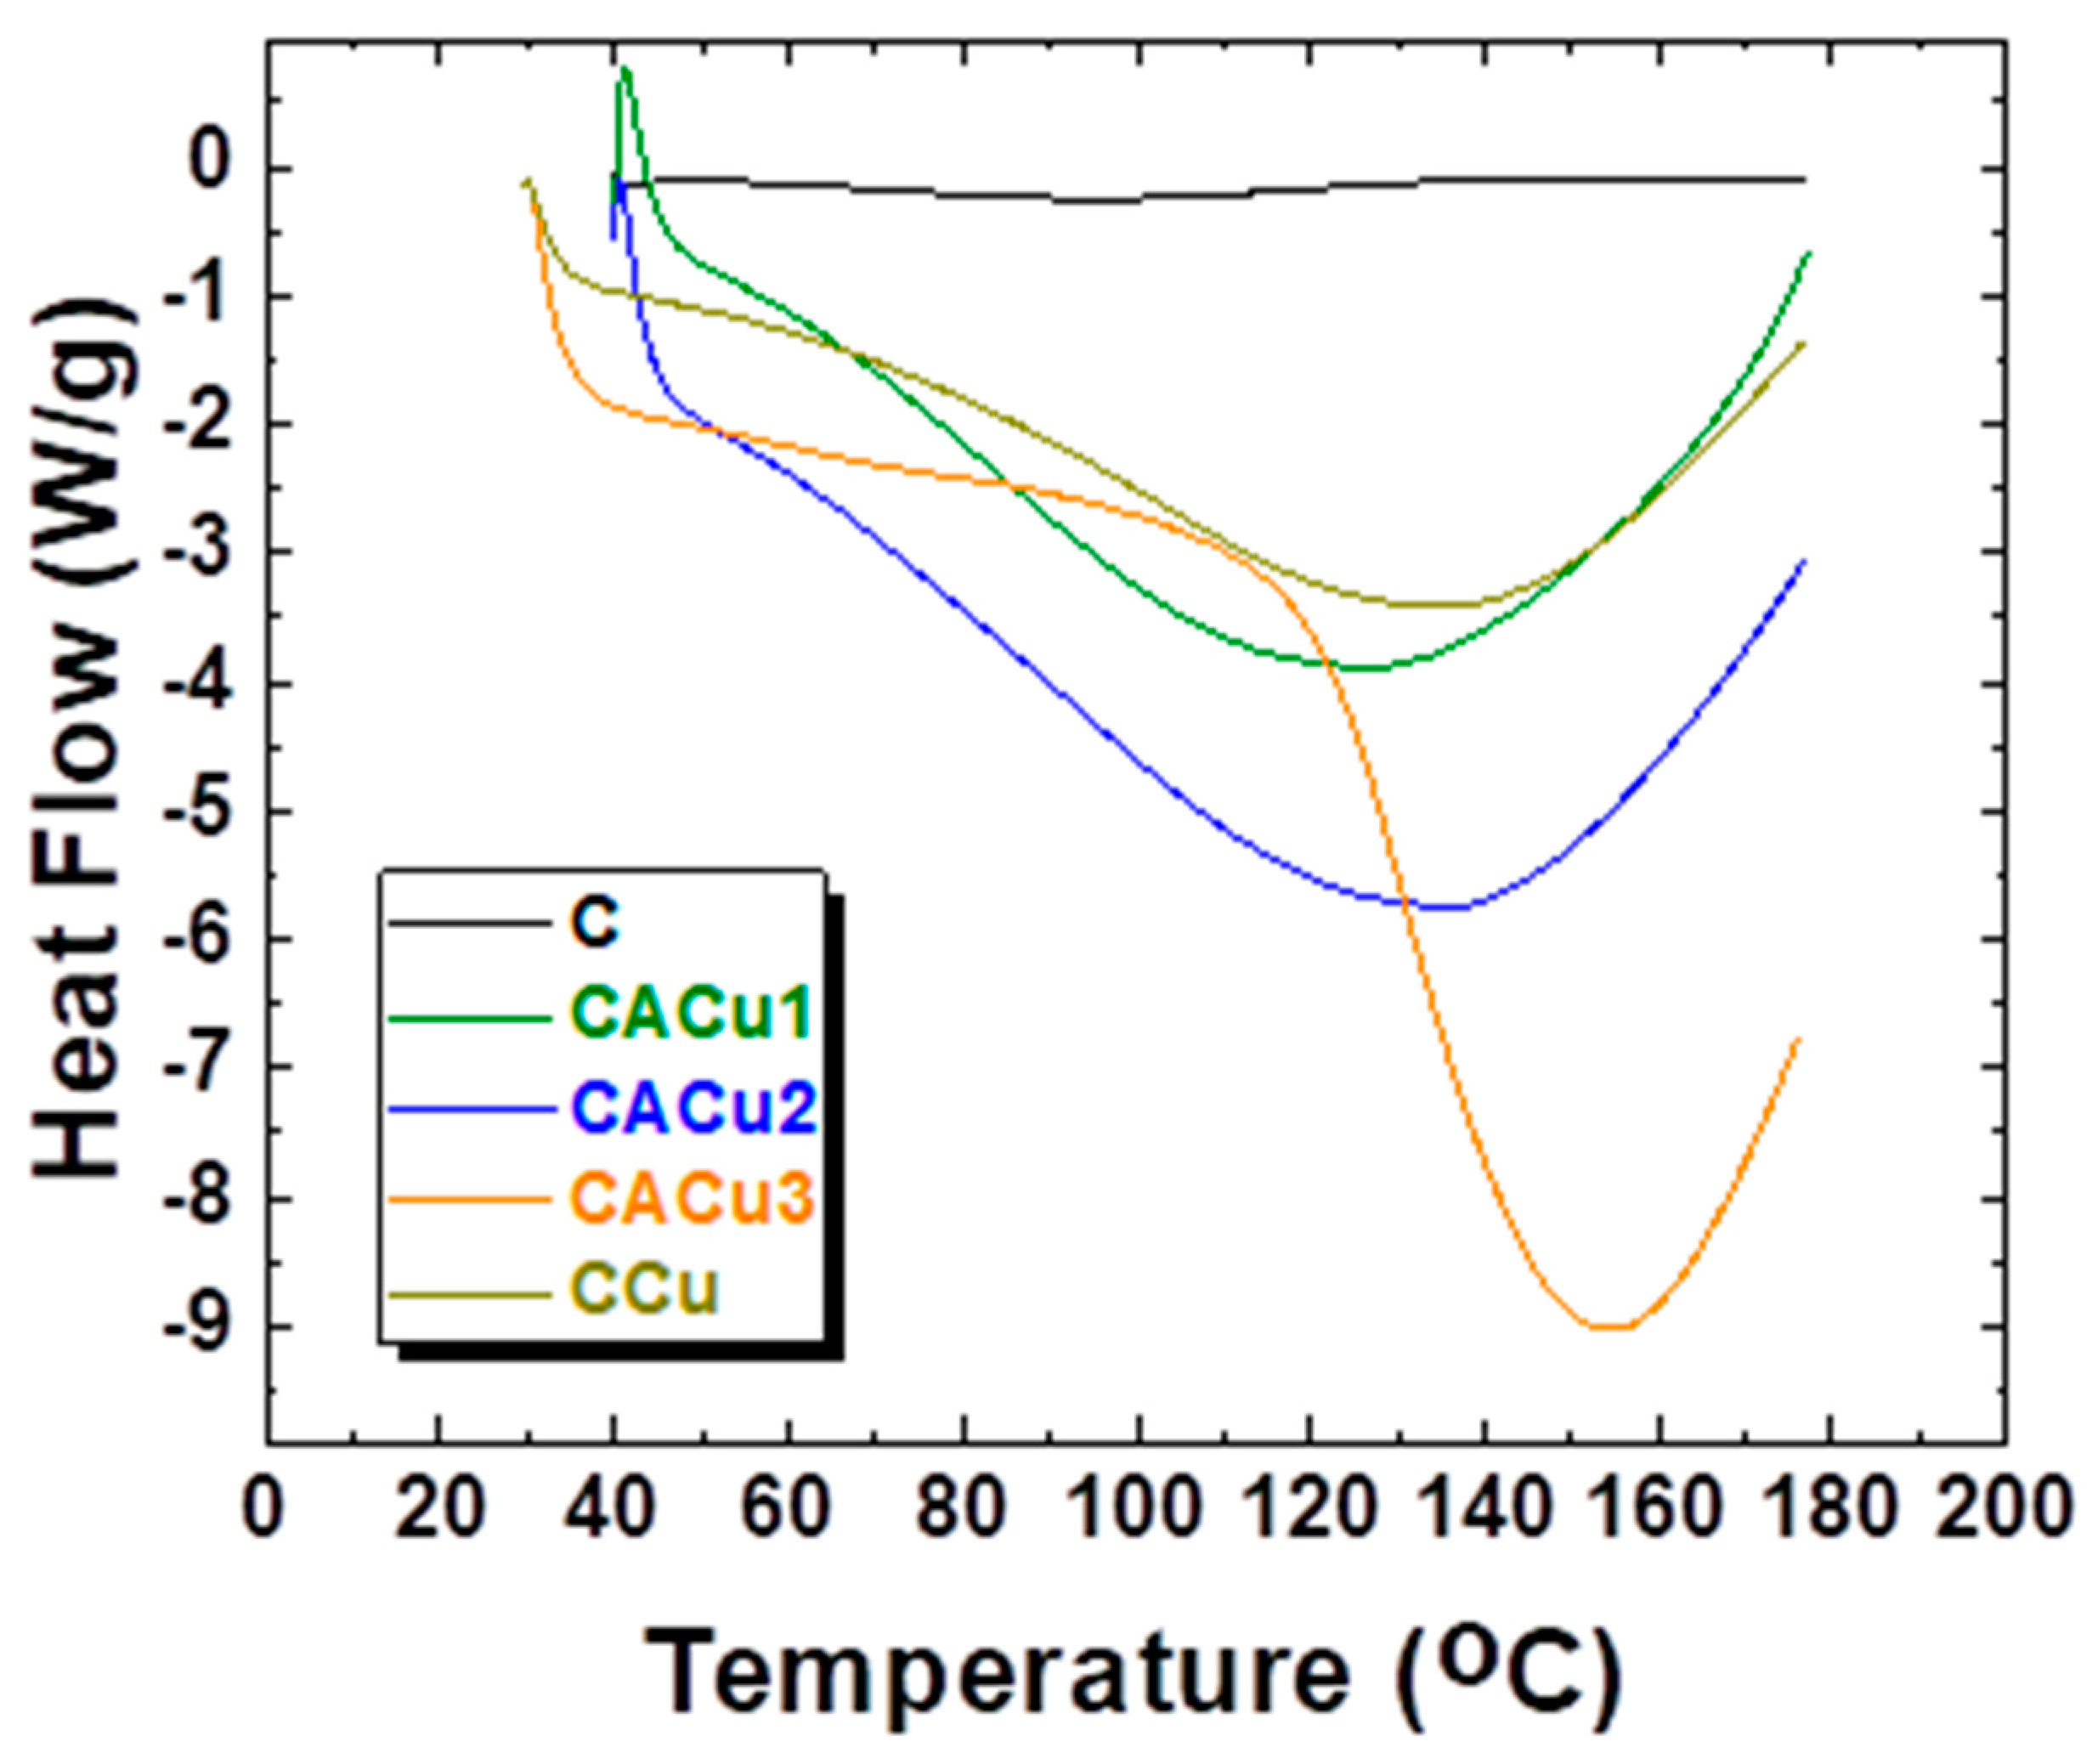
3.5. Differential Scanning Calorimetry (DSC)

DSC studies were carried out to identify the effect of structural differences on the hydration of C, CCu and CACu composite materials since hydration effects are known to play a key role in the adsorption properties of biopolymer materials. The DSC results are summarized in Table 3 along with the accompanying thermograms in Figure 5.
In general, all composite materials display one endothermic peak within the range of 30–180 °C with Tmax values between 97.5–146.6 °C while onset temperatures resided between 51.9–120.9 °C. The endotherms reveal characteristic features of water desorption that concur with the temperature range observed by TGA analysis. Among the four composites, CACu2 showed the lowest Tmax value of 125.3 °C while CACu3 displays the highest the Tmax value (146.6 °C). The maximum ΔHdes value (2016 J g−1) for CACu1 composite material provides evidence of strongly bound water with the active sites of the biopolymers and/or with Cu(II) species. Based on these results, a higher portion of bound water can be found in the CACu1 composite versus the other composites. The DSC results provide support that accounts for trends in water swelling at equilibrium that are further described in Section 3.6.

3.6. Swelling Tests

The relative hydrophile-lipophile balance (HLB) of chitosan and the composite materials can be estimated via solvent swelling (Sw) in water at equilibrium conditions. The estimated Sw values for the composites were reported as a triplicate average at ambient pH and 23 °C. The values of Sw provide an account of the accessibility of polar functional groups on the biopolymer surface. It can be inferred that the level of crosslinking and/or interaction between Cu(II) species and chitosan likely play an important role in the overall hydrophilicity of the composite materials. CCu showed the lowest swelling ratio (Sw = 87.4%) among the composites due to more effective Cu(II) coordination with chitosan. Similarly, greater crosslinking between the biopolymers (chitosan/alginate) is also likely to influence the relative accessibility of the polar functional groups of the composites. In turn, reduced accessibility of polar groups contribute to a lowering of the Sw values. An increased amount of alginate (beyond the stoichiometric equivalency) in the case of CACu2 led to a slightly higher Sw (91.37%) value relative to CCu, in agreement with the DSC results. The role of incomplete crosslinking or the accessibility of active functional groups for Cu(II) species in CACu2 material contributes to its slightly higher Sw ratio relative to CCu. By comparison, CACu1 and CACu3 showed higher Sw values (148.6% and 162.6%, respectively) which concur with an observed stronger interaction of Cu(II) species with the active sites of chitosan that account for greater hydration and increased Sw values for these composite materials.

3.7. X-ray Photoelectron Spectroscopy (XPS)

Atomic composition (At. %) of CACu1 was studied using XPS after exposure to the various groundwater samples (Well-1, Well-2 and Well-3) that contain SO42− ions. The XPS results are shown in Figure S5a–c and Table 4. In general, comparable C, N, O and Cu bands were observed with acceptable atom content (At. %) in Table 4 that indicate negligible leaching of Cu(II) ions occur from the composites into water. The wide scan spectra in Figure S5a–c indicate that the composition of the sorbent does not change markedly before and after the adsorption process. However, no pronounced sulfur signature was observed in the XPS spectra for CACu1.

3.8. X-ray Diffraction (XRD) Results

X-ray diffraction (XRD) is a complementary structural method that can provide insight on the atomic arrangement or the crystalline nature of biopolymers. X-ray diffraction provides insight on the lattice arrangement and is dependent on the scattering of X-rays by the electron density of atoms, and the crystalline nature of multi-component materials. XRD studies of powdered chitosan show two broad signatures at 2θ = 13° and 27° (cf. Figure S3). These XRD features provide support that chitosan exists in a semi-crystalline form [77]. By contrast, alginate shows a comparatively sharp band at 2θ = 32°. However, no significant broad and sharp XRD bands are observed from the profiles of CCu- and the CACu-based composites. These results suggest that the composite materials possess more amorphous structural features relative to that of chitosan in its semi-crystalline state. This trend compares well with the anticipated amorphous composite structure for such multi-component biopolymer systems.

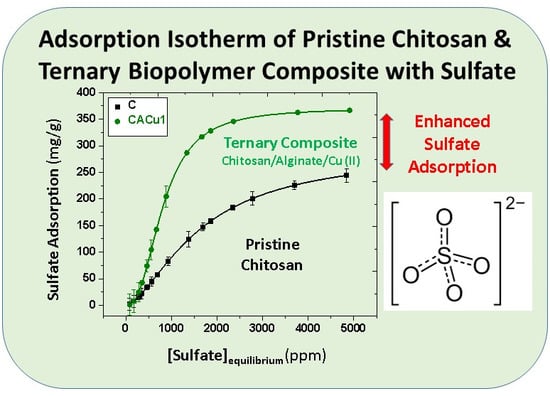
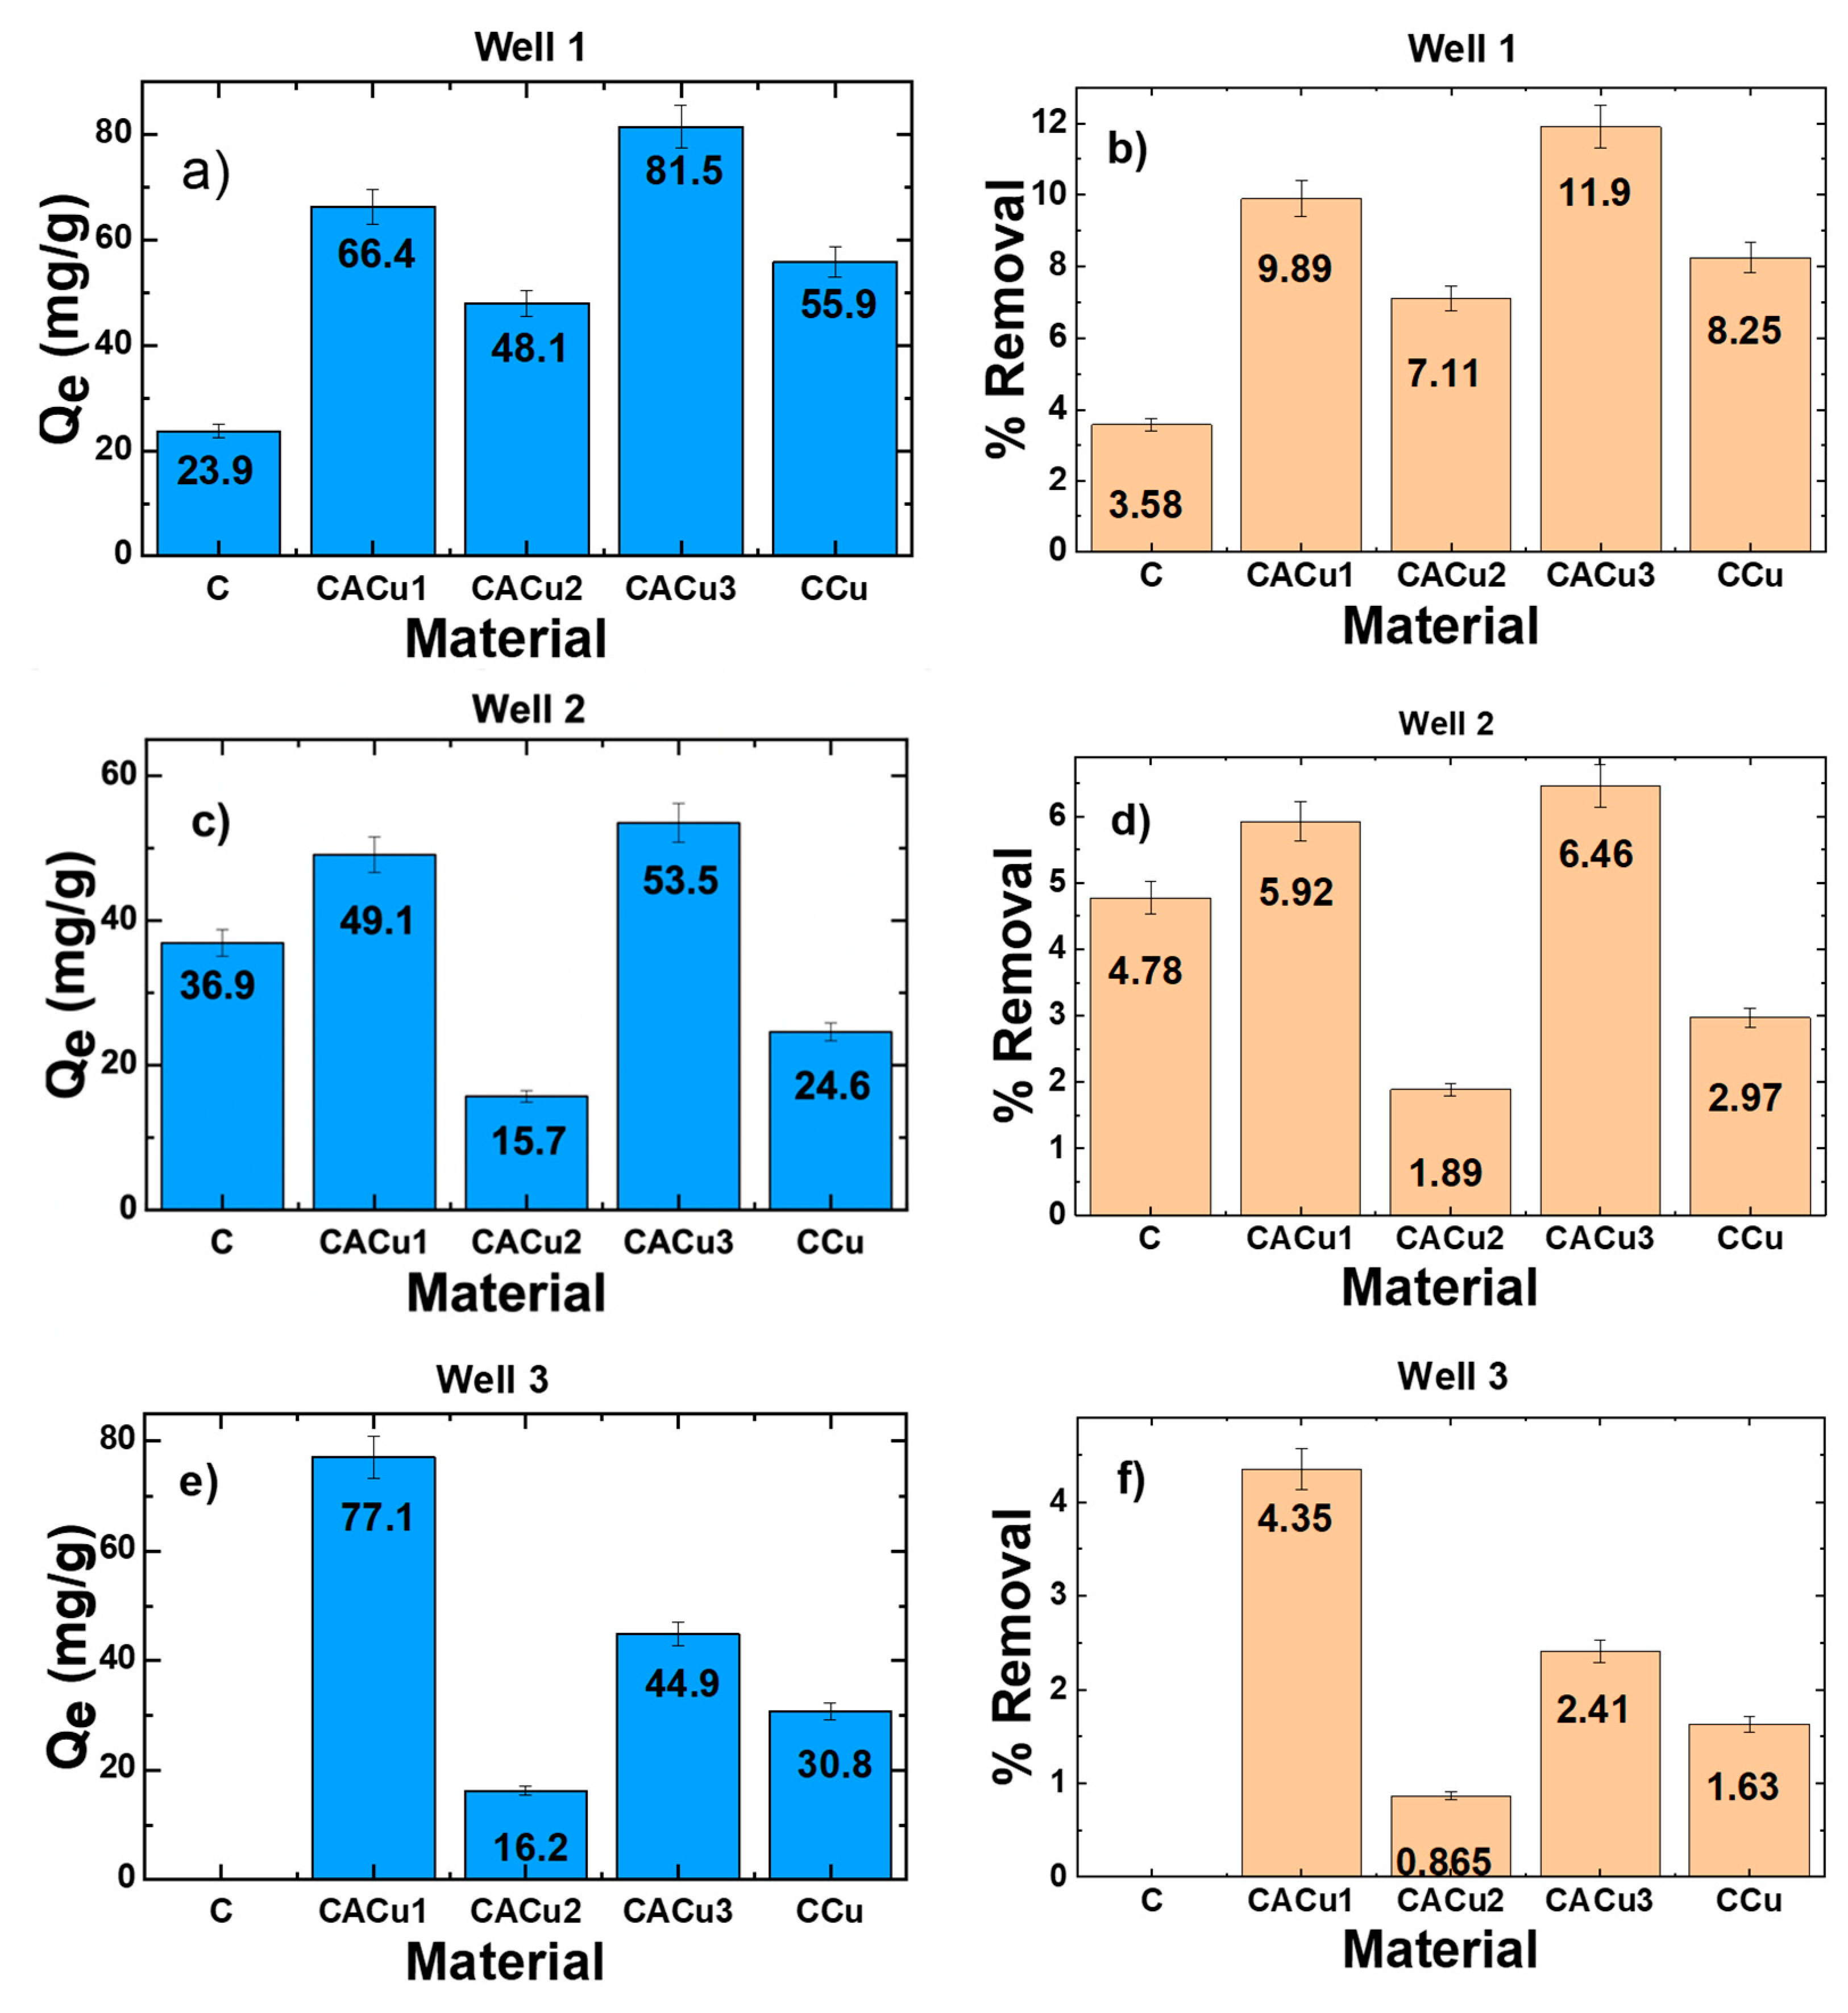
3.9. Sorption Studies

Adsorption isotherm studies enable an investigation on the role of functional groups, surface structure, morphology and chemical composition of binary and ternary composite materials that contain Cu(II) species. The variation in composite structure in relation to the uptake of sulfate is inferred to provide insight on the structure-adsorption properties of binary and ternary systems. In this work, the sorption capacities of the composite materials were studied with a synthetic sodium sulfate solution to assess their inherent sulfate removal properties. In addition, three Saskatchewan groundwater samples with a multitude of potentially interfering anions was investigated to ascertain the sulfate adsorption properties in environmental matrices of variable composition. The equilibrium adsorption isotherms of sulfate species with powdered chitosan and CACu1 are shown in Figure 6. For both sorbents, the adsorption of sulfate increases nonlinearly as Ce increases, until the surface-active sites become saturated at elevated sulfate levels, as evidenced by the appearance of the plateau region in the isotherm.
Unmodified chitosan powder has comparatively lower adsorption than the CACu1 composite. The trend can be accounted for by the increase in surface area (SA) and availability of favourable adsorption sites on the CACu1 composite material. The trend may relate to the presence of Cu(II) along with the greater amorphous nature of such ternary composites versus the semi-crystalline properties of chitosan (cf. XRD pattern in Figure S3). The isotherm parameters are well described by the Sips model according to the best-fit results (R2 = 0.98 to 0.99 for C and CACu1), where the best-fit parameters are summarized in Table S4. At pH 7, a comparison of the adsorption capacity Qe (mg/g) of various sorbents for SO42− anion removal from the aqueous phase are listed in Table 3. According to the data in Table 5, CACu1 showed greater adsorption capacity (Qm = 371.4 mg/g) at pH 6.8 and 295 K relative to other reported adsorbents adsorbents (cf. Table 6). Furthermore, to assess the suitability of the composite materials for practical removal of sulfate anions from water, the sorption capacity of C and CACu1, along with three chitosan-based materials (CACu2, CACu3 and CCu) were independently evaluated with three groundwater (Well-1, -2 and -3) samples. The variable concentration of sulfate ions and other chemical components for the groundwater sample are listed in Tables S1–S3 in the SI.
Figure 7a–f display the results for Qe (mg/g) and removal efficiency (%) of sulfate ions for the various composite materials. A comparison of the results reveal that the uptake (Qe; mg/g) of sulfate for the CACu1 composite was greatest (Qe = 77.1 mg/g) for the Well-3 sample. This result suggests that the presence of Cu(II) species in the chitosan-alginate network enhanced the affinity toward SO42− ions. Among the ternary composites, CACu3 displayed the best sorption capacity for Well-1 and Well-2 samples, whereas unmodified chitosan displays the lowest SO42− removal of for the Well-3 sample. This may be explained by the composition of the different well water samples with respect to effects due to the role of competing anions in the groundwater samples, as shown in Table 5.
The comparison of groundwater in Table 5 reveals variation in sulfate concentration, overall hardness and matrix anion composition of the samples. The variance in anion compositions provides an account of competitive binding to the adsorption sites of the biopolymer materials. CACu1 showed the lowest sulfate uptake capacity for Well-2, where the nitrate concentration is notably higher relative to Well-1 and -3 samples. Greater uptake of sulfate by CACu1 for the Well-3 sample parallels its greater sulfate content. CACu2 shows low uptake for Well-2 and -3 samples irrespective of the sulfate concentration, indicating that other anions exhibit greater affinity with this composite material. CACu3 exhibited the highest capacity at the lowest sulfate concentration in conjunction with the lowest chloride and bicarbonate concentration in the Well-1 sample. The lowest performance was observed in Well-3 sample despite its 3-fold-greater sulfate concentration as in the Well-1 sample. This trend may indicate that bicarbonate and nitrate are competitor ions for the active sites, despite the increase in sulfate concentration. Also, CCu showed the highest sulfate uptake capacity with the lowest concentration of nitrate, bicarbonate and chloride, whereas the Well-3 sample had marginally higher uptake than the Well-2 sample. This trend indicates that bicarbonate, and nitrate show competitive ion adsorption with sulfate. Regarding the influence of Cu(II) chloride or sulfate salts, it has been reported that sulfate anions tend to preferentially exchange with chloride [78]. The sulfate uptake properties by the various biopolymer materials differ significantly with regards to the matrix composition of the water samples, and this should be considered for practical applications of such composite materials for sulfate uptake in different aquatic environments.
Based on the characterization results reported herein, an adsorption mechanism for the removal of sulfate ions from the groundwater is proposed to involve electrostatic attractions between the sulfate ions and the free amine groups of chitosan as well as the accessible sites of complexed Cu(II) species within the composite material (cf. Figure 8). While leaching of Cu(II) can pose a risk to aquatic organisms, the ICP-OES results (cf. Table S5) show that minor Cu(II) leaching from the biopolymer materials was observed. It is noted that the presence of Cu(II) in the aqueous phase remained below 1000 µg/L. This value is below the drinking water regulatory standards set forth by the Saskatchewan Health Authority (cf. Tables S1–S3) and provides additional support for the use of Cu(II) in the biopolymer composites reported herein for practical applications.

4. Conclusions

Binary chitosan-Cu(II) (CCu)- and ternary chitosan-alginate-Cu(II) (CACu)-based composite materials were synthesized at variable composition. The products were characterized by several complementary methods: spectroscopic (FTIR, solids C-13 NMR, XPS and Raman), thermal analysis (DSC and TGA), XRD, point-of-zero-charge and solvent swelling. The incorporation of Cu(II) species into the chitosan-alginate composite was supported by the materials’ characterization results. Batch adsorption reveals a favourable adsorption of sulfate anions in laboratory-prepared samples of sodium sulfate, along with adsorption of sulfate anions in a complex groundwater matrix. The adsorption data are well described by the Sips isotherm model, where CACu1 had a Qm value of 371.4 mg/g, notably higher than a selection of reported literature values (cf. Table 6). Under similar reaction conditions, various ternary chitosan-alginate-Cu(II)-containing adsorbents displayed variable sorption capacities for sulfate anions in groundwater. CACu3 displays the best uptake properties (Qe = 81.5 mg/g; 11.9% removal efficiency) among the adsorbents reported herein. The results obtained in this study provide support on the role of Cu(II) species in stabilizing the chitosan-alginate network that additionally favour sulfate adsorption for environmental water samples. This research highlights a green strategy for tuning the adsorption properties of binary and ternary composite materials that contain chitosan and alginate along with Cu(II) species to afford enhanced uptake of sulfate ions from laboratory and groundwater samples. Such types of binary and ternary biopolymer-based adsorbents have practical utility as green adsorbents for the treatment of industrial wastewater and other types of anion pollutants in aquatic environments. The unique contribution of Cu(II) species in the biopolymer framework of composite materials is shown via a modular synthetic strategy that yield enhanced adsorption properties (cf. Table 5) toward sulfate anions.

Supplementary Materials

The following are available online at https://www.mdpi.com/2073-4360/12/7/1502/s1. Table S1: Chemical analysis report of Well-1 sample, Table S2: Chemical analysis report of Well-2 sample, Table S3: Chemical analysis report of Well-3 sample, Table S4: Sips isotherm adsorption parameters for sulfate dianion species at 298 K and pH 6.8 in aqueous solution, Table S5: Measured (ICP-OES) copper concentration in well water samples and various composite materials (chitosan powder (C), chitosan pellet (CP), CAAl (chitosan-alginate-aluminium) and two CPCu (chitosan pellet; copper) as well as two CACu (chitosan, alginate, copper) materials) to assess potential health hazards from copper leaching of the polyelectrolyte composite materials and comparison to C-BMS, where copper was replaced with aluminum to compare it with the copper containing materials concerning leaching, Figure S1: DSC thermograms of composite materials (a) CCu, (b) CACu1, (c) CACu2 and (d) CACu3, Figure S2: Derivative plot from TGA for C, A, CCu, CACu1, CACu2, and CACu3, Figure S3: XRD patterns of C, A, CACu1, CACU2, CACu3 and CCu, Figure S4: PZC graph for C, A, CCu and CACu1-3 materials, Figure S5: XPS wide scan spectra of CACu1 after the adsorption process.

Author Contributions

Conceptualization: I.A.U. and M.H.M.; methodology, I.A.U., M.H.M., B.G.K.S. and M.M.H.; software, M.M.H., M.H.M., B.G.K.S. and I.A.U.; validation, M.H.M., I.A.U., M.M.H. and L.D.W.; formal analysis, M.M.H., M.H.M. and I.A.U.; investigation, M.M.H., M.H.M., and I.A.U. and L.D.W.; resources, L.D.W.; data curation M.M.H., M.H.M. and I.A.U.; writing—original draft preparation, M.M.H., M.H.M. and I.A.U.; writing—review and editing, I.A.U., M.H.M., M.M.H., B.G.K.S. and L.D.W.; supervision, L.D.W.; project administration, L.D.W.; funding acquisition, L.D.W. All authors have read and agreed to the published version of the manuscript.

Funding

This research was funded by the Ministry of Agriculture and the Canadian Agriculture Partnership, through the Agriculture Development Fund (Project #20170247). The APC was funded by the journal Polymers (www.mdpi.com/journal/polymers) as part of a special issue entitled “Chemical and Physical Properties of Polysaccharides and Their Derivatives”, by invitation from the guest editor to the corresponding author.

Acknowledgments

M.M.H. acknowledges the University of Saskatchewan for administering the Visiting Research Student (VRS) program that aided this collaborative research with the Bangladesh Army University of Science and Technology, Bangladesh. The Saskatchewan Structural Sciences Centre (SSSC) and the technical contributions of Leila Dehabadi, Chen Xue and Danielle Covelli related to the analysis of DSC, Raman spectroscopy and XPS are gratefully acknowledged. L.D.W acknowledges Adam Neuert and Thoia Chau at Saskatchewan Polytechnic for technical support and providing access to ICP-OES instrumentation.

Conflicts of Interest

The authors declare no conflict of interest.

References

  1. Runtti, H.; Tolonen, E.T.; Tuomikoski, S.; Luukkonen, T.; Lassi, U. How to tackle the stringent sulfate removal requirements in mine water treatment—A review of potential methods. Environ. Res. 2018, 167, 207–222. [Google Scholar] [CrossRef]
  2. Miao, Z.; Brusseau, M.L.; Carroll, K.C.; Carreón-Diazconti, C.; Johnson, B. Sulfate reduction in groundwater: Characterization and applications for remediation. Environ. Geochem. Health 2012, 34, 539–550. [Google Scholar] [CrossRef] [Green Version]
  3. Wang, H.; Zhang, Q. Research Advances in Identifying Sulfate Contamination Sources of Water Environment by Using Stable Isotopes. Int. J. Environ. Res. Public Health 2019, 16, 1914. [Google Scholar] [CrossRef] [Green Version]
  4. Hao, T.; Xiang, P.; Mackey, H.R.; Chi, K.; Lu, H.; Chui, H.; van Loosdrecht, M.C.M.; Chen, G.H. A review of biological sulfate conversions in wastewater treatment. Water Res. 2014, 65, 1–21. [Google Scholar] [CrossRef] [PubMed]
  5. Moreno, P.; De Ingeniería, F.; Portales, U.D. Environmental Impact and Toxicology of Sulphate. In Proceedings of the EnviroMine 2009, Santiago, Chile, 30 September–2 October 2009; pp. 1–10. [Google Scholar]
  6. Mbakop, S.; Mthombeni, N.H.; Leswifi, T.Y.; Onyango, M.S. Evaluation of Chitosan-Bentonite Composite Performance towards Remediation of Sulphate Containing Effluent. In Proceedings of the 2016 Annual Conference on Sustainable Research and Innovation, Nairobi, Kenya, 4–6 May 2016; pp. 65–70. [Google Scholar]
  7. Soucek, D.J.; Kennedy, A.J. Effects of Hardness, Chloride, and Acclimation on the Acute Toxicity of Sulfate to Freshwater Invertebrates. Environ. Toxicol. Chem. 2005, 24, 1204–1210. [Google Scholar] [CrossRef] [PubMed]
  8. Soucek, D.J.; Linton, T.K.; Tarr, C.D.; Dickinson, A.; Wickramanayake, N.; Delos, C.G.; Cruz, L.A. Influence of Water Hardness and Sulfate on the Acute Toxicity of Chloride to Sensitive Freshwater Invertebrates. Environ. Toxicol. Chem. 2011, 30, 930–938. [Google Scholar] [CrossRef]
  9. Bernardez, L.A.; de Andrade Lima, L.R.P.; de Jesus, E.B.; Ramos, C.L.S.; Almeida, P.F. A kinetic study on bacterial sulfate reduction. Bioprocess Biosyst. Eng. 2013, 36, 1861–1869. [Google Scholar] [CrossRef] [PubMed]
  10. Ma, H.; Cheng, X.; Li, G.; Chen, S.; Quan, Z.; Zhao, S.; Niu, L. The influence of hydrogen sulfide on corrosion of iron under different conditions. Corros. Sci. 2000, 42, 1669–1683. [Google Scholar] [CrossRef]
  11. Jiang, J.; Chan, A.; Ali, S.; Saha, A.; Haushalter, K.J.; Lam, W.L.M.; Glasheen, M.; Parker, J.; Brenner, M.; Mahon, S.B.; et al. Hydrogen Sulfide--Mechanisms of Toxicity and Development of an Antidote. Sci. Rep. 2016, 6, 20831. [Google Scholar] [CrossRef]
  12. Enning, D.; Garrelfs, J. Corrosion of Iron by Sulfate-Reducing Bacteria: New Views of an Old Problem. Appl. Environ. Microbiol. 2014, 80, 1226–1236. [Google Scholar] [CrossRef] [Green Version]
  13. Doujaiji, B.; Al-Tawfiq, J.A. Hydrogen sulfide exposure in an adult male. Ann. Saudi Med. 2010, 30, 76–80. [Google Scholar] [CrossRef] [PubMed]
  14. Reiffenstein, R.J.; Hulbert, W.C.; Roth, S.H. Toxicology of Hydrogen Sulfide. Annu. Rev. Pharmacol. Toxicol. 1992, 32, 109–134. [Google Scholar] [CrossRef]
  15. Cocchetto, D.M.; Levy, G. Absorption of Orally Administered Sodium Sulfate in Humans. J. Pharm. Sci. 1981. [Google Scholar] [CrossRef] [PubMed]
  16. Gomez, G.G.; Sandler, R.S.; Seal, E. High Levels of Inorganic Sulfate Cause Diarrhea in Neonatal Piglets. J. Nutr. 1995. [Google Scholar] [CrossRef]
  17. Silva, A.M.; Lima, R.M.F.; Leão, V.A. Mine water treatment with limestone for sulfate removal. J. Hazard. Mater. 2012, 221, 45–55. [Google Scholar] [CrossRef] [Green Version]
  18. Fernando, W.A.M.; Ilankoon, I.M.S.K.; Syed, T.H.; Yellishetty, M. Challenges and opportunities in the removal of sulphate ions in contaminated mine water: A review. Miner. Eng. 2018, 117, 74–90. [Google Scholar] [CrossRef]
  19. Benatti, C.; Tavares, C.; Lenzi, E. Sulfate Removal From Waste Chemicals By Precipitation. J. Environ. Manag. 2008, 90, 504–511. [Google Scholar] [CrossRef] [PubMed]
  20. Maree, J.P.; Strydom, W.F. Biological sulphate removal from industrial effluent in an upflow packed bed reactor. Water Res. 1987, 21, 141–146. [Google Scholar] [CrossRef]
  21. Maree, J.P.; Strydom, W.F. Biological sulphate removal in an upflow packed bed reactor. Water Res. 1985, 19, 1101–1106. [Google Scholar] [CrossRef]
  22. Bowell, R.; Dill, S.; Cowan, J.; Wood, A. A review of sulfate removal options for mine waters. In Proceedings of the International Mine Water Association Symposium, Johannesburg, South Africa, 7–13 September 1998; pp. 329–342. [Google Scholar]
  23. Maddah, H.A.; Alzhrani, A.S.; Bassyouni, M.; Abdel-Aziz, M.H.; Zoromba, M.; Almalki, A.M. Evaluation of various membrane filtration modules for the treatment of seawater. Appl. Water Sci. 2018, 8, 150. [Google Scholar] [CrossRef] [Green Version]
  24. Arahman, N.; Mulyati, S.; Lubis, M.R.; Takagi, R.; Matsuyama, H. Removal profile of sulfate ion from mix ion solution with different type and configuration of anion exchange membrane in elctrodialysis. J. Water Process Eng. 2017, 20, 173–179. [Google Scholar] [CrossRef]
  25. De Luna, M.D.G.; Rance, D.P.M.; Bellotindos, L.M.; Lu, M.C. Removal of sulfate by fluidized bed crystallization process. J. Environ. Chem. Eng. 2017, 5, 2431–2439. [Google Scholar] [CrossRef]
  26. Gu, Y.; Ma, Y.; Wan, J.; Wang, Y.; Guan, Z. Removal of Sulfate Ions from Aqueous Solution by Adsorption with Hydrotalcite- like Composite. Huan Jing Ke Xue 2016, 37, 1000–1007. [Google Scholar]
  27. Pavlikova, P.; Balintova, M.; Holub, M. Study of sulphate ions removal from acidic waters using ion exchange resin. Sel. Sci. Pap. J. Civ. Eng. 2018, 13, 51–58. [Google Scholar] [CrossRef] [Green Version]
  28. Moshoeshoe, M.; Silas Nadiye-Tabbiruka, M.; Obuseng, V. A Review of the Chemistry, Structure, Properties and Applications of Zeolites. Am. J. Mater. Sci. 2017, 7, 196–221. [Google Scholar] [CrossRef]
  29. Dong, R.; Liu, Y.; Wang, X.; Huang, J. Adsorption of Sulfate Ions from Aqueous Solution by Surfactant-Modified Palygorskite. J. Chem. Eng. Data 2011, 56, 3890–3896. [Google Scholar] [CrossRef]
  30. Ramos, B.G.Z.; Kundu, P.P.; Sarkar, K. Biopolymers Employed in Drug Delivery. In Biopolymers; Wiley Online Library, Scrivener Publishing: Beverly, MA, USA, 2011; pp. 559–573. [Google Scholar] [CrossRef]
  31. Erõs, I.; Ramos, B.G.Z.; Kundu, P.P.; Sarkar, K. Polymers and Biopolymers in Pharmaceutical Technology. In Biopolymers; Scrivener Publishing: Beverly, MA, USA, 2011; pp. 525–558. ISBN 9780470639238. [Google Scholar]
  32. Raj, S.N.; Lavanya, S.N.; Sudisha, J.; Shetty, H.S.; Boufi, S.; Alila, S.; Erõs, I.; Ramos, B.G.Z.; Kundu, P.P.; Sarkar, K. Applications of Biopolymers in Agriculture with Special Reference to Role of Plant Derived Biopolymers in Crop Protection. In Biopolymers; Scrivener Publishing: Beverly, MA, USA, 2011; pp. 459–481. [Google Scholar]
  33. Fahnestock, K.J.; Austero, M.S.; Schauer, C.L. Natural Polysaccharides: From Membranes to Active Food Packaging. In Biopolymers: Biomedical and Environmental Applications; Wiley Online Books; Scrivener Publishing: Beverly, MA, USA, 2011; pp. 59–80. [Google Scholar] [CrossRef]
  34. Agbovi, H.K.; Wilson, L.D. Optimisation of Orthophosphate and Turbidity Removal Using an Amphoteric Chitosan-Based Flocculant-Ferric Chloride Coagulant System. Environ. Chem. 2019, 16, 599–612. [Google Scholar] [CrossRef]
  35. Wilson, L.; Tewari, B.T. Chitosan-Based Adsorbents: Environmental Applications for the Removal of Arsenicals; Nasar, A., Ed.; MRF: Millersville, PA, USA, 2018; pp. 133–160. ISBN 9781945291753. [Google Scholar]
  36. Mohammadzadeh Pakdel, P.; Peighambardoust, S.J. Review on Recent Progress in Chitosan-Based Hydrogels for Wastewater Treatment Application. Carbohydr. Polym. 2018, 201, 264–279. [Google Scholar] [CrossRef] [PubMed]
  37. Desbrières, J.; Guibal, E. Chitosan for wastewater treatment. Polym. Int. 2018, 67, 7–14. [Google Scholar] [CrossRef]
  38. Wang, J.; Zhuang, S. Removal of various pollutants from water and wastewater by modified chitosan adsorbents. Crit. Rev. Environ. Sci. Technol. 2017, 47, 2331–2386. [Google Scholar] [CrossRef]
  39. Crini, G.; Badot, P.M. Application of chitosan, a natural aminopolysaccharide, for dye removal from aqueous solutions by adsorption processes using batch studies: A review of recent literature. Prog. Polym. Sci. 2008, 33, 399–447. [Google Scholar] [CrossRef]
  40. Guibal, E. Heterogeneous Catalysis on Chitosan-Based Materials: A Review. Prog. Polym. Sci. 2005, 30, 71–109. [Google Scholar] [CrossRef]
  41. Mekahlia, S.; Bouzid, B. Chitosan-Copper (II) complex as antibacterial agent: Synthesis, characterization and coordinating bond- activity correlation study. Phys. Procedia 2009. [Google Scholar] [CrossRef] [Green Version]
  42. Wan Ngah, W.S.; Teong, L.C.; Hanafiah, M.A.K.M. Adsorption of dyes and heavy metal ions by chitosan composites: A review. Carbohydr. Polym. 2011, 83, 1446–1456. [Google Scholar] [CrossRef]
  43. Zhang, L.; Zeng, Y.; Cheng, Z. Removal of Heavy Metal Ions Using Chitosan and Modified Chitosan: A Review. J. Mol. Liq. 2016, 214, 175–191. [Google Scholar] [CrossRef]
  44. Baysal, K.; Aroguz, A.Z.; Adiguzel, Z.; Baysal, B.M. Chitosan/alginate crosslinked hydrogels: Preparation, characterization and application for cell growth purposes. Int. J. Biol. Macromol. 2013, 59, 342–348. [Google Scholar] [CrossRef]
  45. Tao, H.C.; Li, S.; Zhang, L.J.; Chen, Y.Z.; Deng, L.P. Magnetic chitosan/sodium alginate gel bead as a novel composite adsorbent for Cu(II) removal from aqueous solution. Environ. Geochem. Health 2018. [Google Scholar] [CrossRef]
  46. Conzatti, G.; Faucon, D.; Castel, M.; Ayadi, F.; Cavalie, S.; Tourrette, A. Alginate/chitosan polyelectrolyte complexes: A comparative study of the influence of the drying step on physicochemical properties. Carbohydr. Polym. 2017, 172, 142–151. [Google Scholar] [CrossRef] [Green Version]
  47. Richau, K.; Schwarz, H.H.; Apostel, R.; Paul, D. Dehydration of organics by pervaporation with polyelectrolyte complex membranes: Some considerations concerning the separation mechanism. J. Membrane Sci. 1996, 113, 31–41. [Google Scholar] [CrossRef]
  48. Liao, I.C.; Wan, A.C.A.; Yim, E.K.F.; Leong, K.W. Controlled release from fibers of polyelectrolyte complexes. J. Control. Release 2005, 104, 347–358. [Google Scholar] [CrossRef]
  49. Ayoub, A.; Venditti, R.A.; Pawlak, J.J.; Salam, A.; Hubbe, M.A. Novel Hemicellulose–Chitosan Biosorbent for Water Desalination and Heavy Metal Removal. ACS Sustain. Chem. Eng. 2013, 1, 1102–1109. [Google Scholar] [CrossRef]
  50. Crini, G.; Lichtfouse, E.; Wilson, L.D.; Morin-Crini, N. Conventional and non-conventional adsorbents for wastewater treatment. Environ. Chem. Lett. 2019, 17, 195–213. [Google Scholar] [CrossRef]
  51. Wang, B.; Wan, Y.; Zheng, Y.; Lee, X.; Liu, T.; Yu, Z.; Huang, J.; Ok, Y.S.; Chen, J.; Gao, B. Alginate-Based Composites for Environmental Applications: A Critical Review. Crit. Rev. Environ. Sci. Technol. 2019, 214, 175–191. [Google Scholar] [CrossRef]
  52. Crini, G. Recent developments in polysaccharide-based materials used as adsorbents in wastewater treatment. Prog. Polym. Sci. 2005, 30, 38–70. [Google Scholar] [CrossRef]
  53. Moret, A.; Rubio, J. Sulphate and molybdate ions uptake by chitin-based shrimp shells. Miner. Eng. 2003, 16, 715–722. [Google Scholar] [CrossRef]
  54. Chmielewská, E.; Sabova, L.; Sitek, J.; Gaplovska, K.; Morvova, M. Removal of nitrates, sulfate and Zn(II) ions from aqueous solutions by using biopolymeric alginate/ clinoptilolite rich tuff pellets. Fresenius Environ. Bull. 2010, 19, 884–891. [Google Scholar]
  55. Guo, Y.J.; Xue, J.Q.; Zhang, J.; Ma, J.; Quan, X.T.; Liu, Y. Adsorption behaviors of protonation modified chitosan and the analysis of spectra. Spectrosc. Spectr. Anal. 2014, 34, 78–81. [Google Scholar]
  56. Fosso-kankeu, E.; Waanders, F.; Steyn, B. Chitosan-graft-Polyacrylamide adsorbent for Sulphate removal from water. In Proceedings of the 7th International Conference on Latest Trends in Engineering and Technology (ICLTET’2015), Pretoria, South Africa, 26–27 November 2015; International Institute of Engineers: Desumajra, Kharar, India, 2015; pp. 7–10. [Google Scholar]
  57. Schwarz, S.; Schwarz, D.; Ohmann, W.; Neuber, S. Adsorption and desorption studies on reusing chitosan as an efficient adsorbent. In Proceedings of the 3rd World Congress on Civil, Structural, and Environmental Engineering (CSEE’18), Budapest, Hungary, 8–10 April 2018. [Google Scholar]
  58. Tian, Z.; Feng, T.; Yang, G.; Zhao, T.; Wang, L. Removal of sulfate from aqueous solution by magnetic chitosan microspheres. Desalin. Water Treat. 2019, 161, 293–303. [Google Scholar] [CrossRef] [Green Version]
  59. Singh, J.; Mishra, N.S.; Banerjee, S.; Sharma, Y.C. Comparative Studies of Physical Characteristics of Raw and Modified Sawdust for Their Use as Adsorbents for Removal of Acid Dye. Bioresources 2011, 6, 2732–2743. [Google Scholar]
  60. Sips, R. On the Structure of a Catalyst Surface. II. J. Chem. Phys. 1950, 18, 1024–1026. [Google Scholar] [CrossRef]
  61. Yasmeen, S.; Kabiraz, M.; Saha, B.; Qadir, M.; Gafur, M.; Masum, S. Chromium (VI) Ions Removal from Tannery Effluent Using Chitosan-Microcrystalline Cellulose Composite as Adsorbent. Int. Res. J. Pure Appl. Chem. 2016, 10, 1–14. [Google Scholar] [CrossRef]
  62. Xing, R.; Liu, S.; Yu, H.; Guo, Z.; Wang, P.; Li, C.; Li, Z.; Li, P. Salt-assisted acid hydrolysis of chitosan to oligomers under microwave irradiation. Carbohydr. Res. 2005, 340, 2150–2153. [Google Scholar] [CrossRef]
  63. Sadiq, A.; Choubey, A.; Bajpai, A.K. Biosorption of chromium ions by calcium alginate nanoparticles. J. Chil. Chem. Soc. 2018, 63, 4077–4081. [Google Scholar] [CrossRef] [Green Version]
  64. Pereira, R.; Tojeira, A.; Vaz, D.C.; Mendes, A.; Bártolo, P. Preparation and characterization of films based on alginate and aloe vera. Int. J. Polym. Anal. Charact. 2011. [Google Scholar] [CrossRef]
  65. Fertah, M.; Belfkira, A.; Dahmane, E.M.; Taourirte, M.; Brouillette, F. Extraction and Characterization of Sodium Alginate from Moroccan Laminaria Digitata Brown Seaweed. Arab. J. Chem. 2017, 10, S3707–S3714. [Google Scholar] [CrossRef] [Green Version]
  66. Rashid, S.; Shen, C.; Chen, X.; Li, S.; Chen, Y.; Wen, Y.; Liu, J. Enhanced catalytic ability of chitosan-Cu-Fe bimetal complex for the removal of dyes in aqueous solution. RSC Adv. 2015. [Google Scholar] [CrossRef]
  67. Chan, H.Y.H.; Takoudis, C.G.; Weaver, M.J. Oxide Film Formation and Oxygen Adsorption on Copper in Aqueous Media as Probed by Surface-Enhanced Raman Spectroscopy. J. Phys. Chem. B 1999, 103, 357–365. [Google Scholar] [CrossRef]
  68. Debbichi, L.; Marco de Lucas, M.C.; Pierson, J.F.; Krüger, P. Vibrational Properties of CuO and Cu4O3 from First-Principles Calculations, and Raman and Infrared Spectroscopy. J. Phys. Chem. C 2012, 116, 10232–10237. [Google Scholar] [CrossRef]
  69. Deng, Y.; Handoko, A.D.; Du, Y.; Xi, S.; Yeo, B.S. In Situ Raman Spectroscopy of Copper and Copper Oxide Surfaces during Electrochemical Oxygen Evolution Reaction: Identification of Cu III Oxides as Catalytically Active Species. ACS Catal. 2016, 6, 2473–2481. [Google Scholar] [CrossRef]
  70. Singhal, A.; Pai, M.R.; Rao, R.; Pillai, K.T.; Lieberwirth, I.; Tyagi, A.K. Copper(I) Oxide Nanocrystals—One Step Synthesis, Characterization, Formation Mechanism, and Photocatalytic Properties. Eur. J. Inorg. Chem. 2013, 2013, 2640–2651. [Google Scholar] [CrossRef]
  71. Mohamed, M.H.; Wilson, L.D.; Headley, J.V. Design and Characterization of Novel β-Cyclodextrin Based Copolymer Materials. Carbohydr. Res. 2011, 346, 219–229. [Google Scholar] [CrossRef] [PubMed]
  72. Iakovleva, E.; Mäkilä, E.; Salonen, J.; Sitarz, M.; Sillanpää, M. Industrial Products and Wastes as Adsorbents for Sulphate and Chloride Removal from Synthetic Alkaline Solution and Mine Process Water. Chem. Eng. J. 2015, 259, 364–371. [Google Scholar] [CrossRef]
  73. Udoetok, I.A.; Faye, O.; Wilson, L.D. Adsorption of Phosphate Dianions by Hybrid Inorganic–Biopolymer Polyelectrolyte Complexes: Experimental and Computational Studies. ACS Appl. Polym. Mater. 2020, 2, 899–910. [Google Scholar] [CrossRef]
  74. Gopalakannan, V.; Viswanathan, N. One Pot Synthesis of Metal Ion Anchored Alginate–Gelatin Binary Biocomposite for Efficient Cr(VI) Removal. Int. J. Biol. Macromol. 2016, 83, 450–459. [Google Scholar] [CrossRef]
  75. Vijayalakshmi, K.; Devi, B.M.; Sudha, P.N.; Venkatesan, J.; Anil, S. Synthesis, Characterization and Applications of Nanochitosan/Sodium Alginate/Microcrystalline Cellulose Film. J. Nanomed. Nanotechnol. 2016, 7, 419. [Google Scholar] [CrossRef]
  76. Saito, H.; Tabeta, R.; Ogawa, K. High-Resolution Solid-State Carbon-13 NMR Study of Chitosan and Its Salts with Acids: Conformational Characterization of Polymorphs and Helical Structures as Viewed from the Conformation-Dependent Carbon-13 Chemical Shifts. Macromolecules 1987, 20, 2424–2430. [Google Scholar] [CrossRef]
  77. Vueva, Y.; Connell, L.S.; Chayanun, S.; Wang, D.; McPhail, D.S.; Romer, F.; Hanna, J.V.; Jones, J.R. Silica/alginate hybrid biomaterials and assessment of their covalent coupling. Appl. Mater. Today 2018, 11, 1–12. [Google Scholar] [CrossRef]
  78. Vold, I.; Vårum, K.M.; Guibal, E.; Smidsrød, O. Binding of ions to chitosan—Selectivity studies. Carbohydr. Polym. 2003, 54, 471–477. [Google Scholar] [CrossRef]
  79. Geethamani, C.K.; Ramesh, S.T.; Gandhimathi, R.; Nidheesh, P.V. Alkali-Treated Fly Ash for the Removal of Fluoride from Aqueous Solutions. Desalin. Water Treat. 2014, 52, 3466–3476. [Google Scholar] [CrossRef]
  80. Chen, W.; Liu, H.C. Adsorption of sulfate in aqueous solutions by organo-nano-clay: Adsorption equilibrium and kinetic studies. J. Cent. South Univ. 2014, 21, 1974–1981. [Google Scholar] [CrossRef]
  81. Runtti, H.; Luukkonen, T.; Niskanen, M.; Tuomikoski, S.; Kangas, T.; Tynjälä, P.; Tolonen, E.T.; Sarkkinen, M.; Kemppainen, K.; Rämö, J.; et al. Sulphate Removal over Barium-Modified Blast-Furnace-Slag Geopolymer. J. Hazard. Mater. 2016, 317, 373–384. [Google Scholar] [CrossRef] [PubMed] [Green Version]
Figure 1. FTIR spectra of chitosan (C) and alginate (A) biopolymers, and its composite forms: CACu1, CACu2, CACu3 (ternary) and CCu (binary) materials.
Polymers 12 01502 g001
Figure 2. Raman spectra of the biopolymers (C, A), ternary composites (CACu1, CACu2, CACu3) and binary composite (CCu) materials.
Polymers 12 01502 g002
Figure 3. Derivative plot from TGA for the biopolymers (C, A), ternary composites (CACu1, CACu2, CACu3) and a binary composite (CCu) material.
Polymers 12 01502 g003
Figure 4. Solid state C-13 NMR of the biopolymers (C, A), binary (CCu) and ternary (CACu1, CACu2, CACu3) composites.
Polymers 12 01502 g004
Figure 5. DSC of chitosan (C)), ternary composites (CACu1, CACu2, CACu3) and binary composite (CCu) materials.
Polymers 12 01502 g005
Figure 6. Sips isotherm profiles of C and CACu1 at 298 K and pH 6.8 for adsorption of sulfate from aqueous solution.
Polymers 12 01502 g006
Figure 7. (af) Experimental results of Qe and sulfate removal (%) by five sorbents in Well-1, -2 and -3 groundwater samples.
Polymers 12 01502 g007
Figure 8. Proposed adsorption mechanism of SO42− anions by a ternary biopolymer composite that contains Cu(II).
Polymers 12 01502 g008
Table 1. Summary of various chitosan/alginate-based sorbent materials reported in the literature for the removal of SO42− species from aqueous solution.
AdsorbentYearReferences
Chitin-based shrimp shells2003Moret and Rubio [53]
Biopolymeric alginate/clinoptilolite pellets2009Chmielewská et al. [54]
Protonation modified chitosan2014Guo et al. [55]
Chitosan-grafted-polyacrylamide2015Fosso-Kankeu et al. [56]
Chitosan-bentonite composite2016Mbakop et al. [6]
Chitosan flakes2018Schwarz et al. [57]
Magnetic chitosan microspheres2019Tian et al. [58]
Table 2. Mass of reactants used in the preparation of binary and ternary composite materials.
Reaction ConditionsCCuCACu1CACu2CACu3
Mass of Alginate (g)01.32.61
Mass of Chitosan (g)1112
Mass of CuCl2 (g)0.830.830.830.83
Table 3. TGA parameters for the differential scanning calorimetry (DSC) thermogram profiles for chitosan and its composite materials.
MaterialTmax (°C)T0 (°C)DSC Peak Area (J g−1)
C97.559.145.9
CCu135.570.3811.4
CACu1130.852.72016
CACu2125.351.91491
CACu3146.6120.8786.6
Note: Tmax = maximum peak temperature; T0 = onset temperature.
Table 4. Atom content (At. %) of CACu1 from the XPS wide scan spectra.
ElementWell-1 (At. %)Well-2 (At. %)Well-3 (At. %)
C56.3553.3554.01
N2.142.271.42
O27.2725.9925.89
Cu1.171.191.42
S---
Table 5. Anion concentration and total hardness (calculated) of the groundwater samples.
Water CompositionWell-1 (mg/L)Well-2 (mg/L)Well-3 (mg/L)
Sulfate2062.62653.76030.0
Nitrate6.927.61.6
Chloride98.3146.8328.1
Bicarbonate422593722
Total Hardness191221984194
Note: additional compositional analysis is provided in the Supporting Material.
Table 6. Comparison of adsorption capacity Qm (mg/g) of various sorbents for the removal of SO42− anions from aqueous solution.
AdsorbentQm (mg/g)Reaction ConditionsReferences
Pulp and paper waste2.786Adsorbent: 40 g
Mixture SO42−/Cl 1000 mL
pH: not reported
Time: 480 h
Lakovleva [72]
Alkali-treated fly ash43.0Adsorbent: 2 g
SO42− soln: 1000 mL
pH: 7
Time: 2.5 h
Geethamani [79]
Organo-nano-clay63.5Adsorbent: 500 mg
SO42− soln: 100 mL
pH: 7
Time: 2 h
Wei and Hai-cheng [80]
Ba-modified blast-furnace-slag geopolymer119Adsorbent: 10 g
SO42− soln: 1000 mL
pH: 7–8
Time: 3 h
Runtti [81]
Chitin-based shrimp shells250.7Adsorbent: 750 mg
SO42− soln: 200 mL
pH: 7
Time: 1 h
Moret and Rubio [44]
Chitosan power (C)288.1Adsorbent: 20 mg
SO42− soln: 15 mL
pH: 6.8–7
Time: 24 h
This study
CACu1371.4Adsorbent: 10 mg
SO42− soln: 15 mL
pH: 6.8
Time: 24 h
This study

