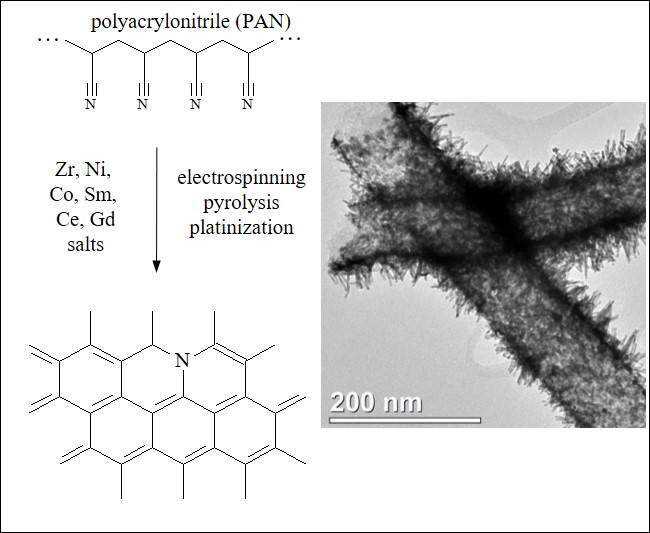
New Carbon Nanofiber Composite Materials Containing Lanthanides and Transition Metals Based on Electrospun Polyacrylonitrile for High Temperature Polymer Electrolyte Membrane Fuel Cell Cathodes


 , ,
, , 
Abstract
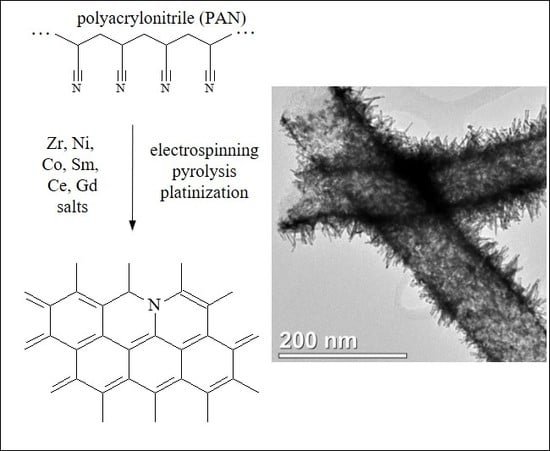
1. Introduction
2. Materials and Methods
2.1. Electrospinning and CNF-Based Composite Obtaining
2.1.1. General Data
2.1.2. CNF/Zr/Ni/Gd Composites
2.1.3. CNF/Sm/Co Composite
2.1.4. CNF/Zr/Ni/Ce Composite
2.2. CNF Platination
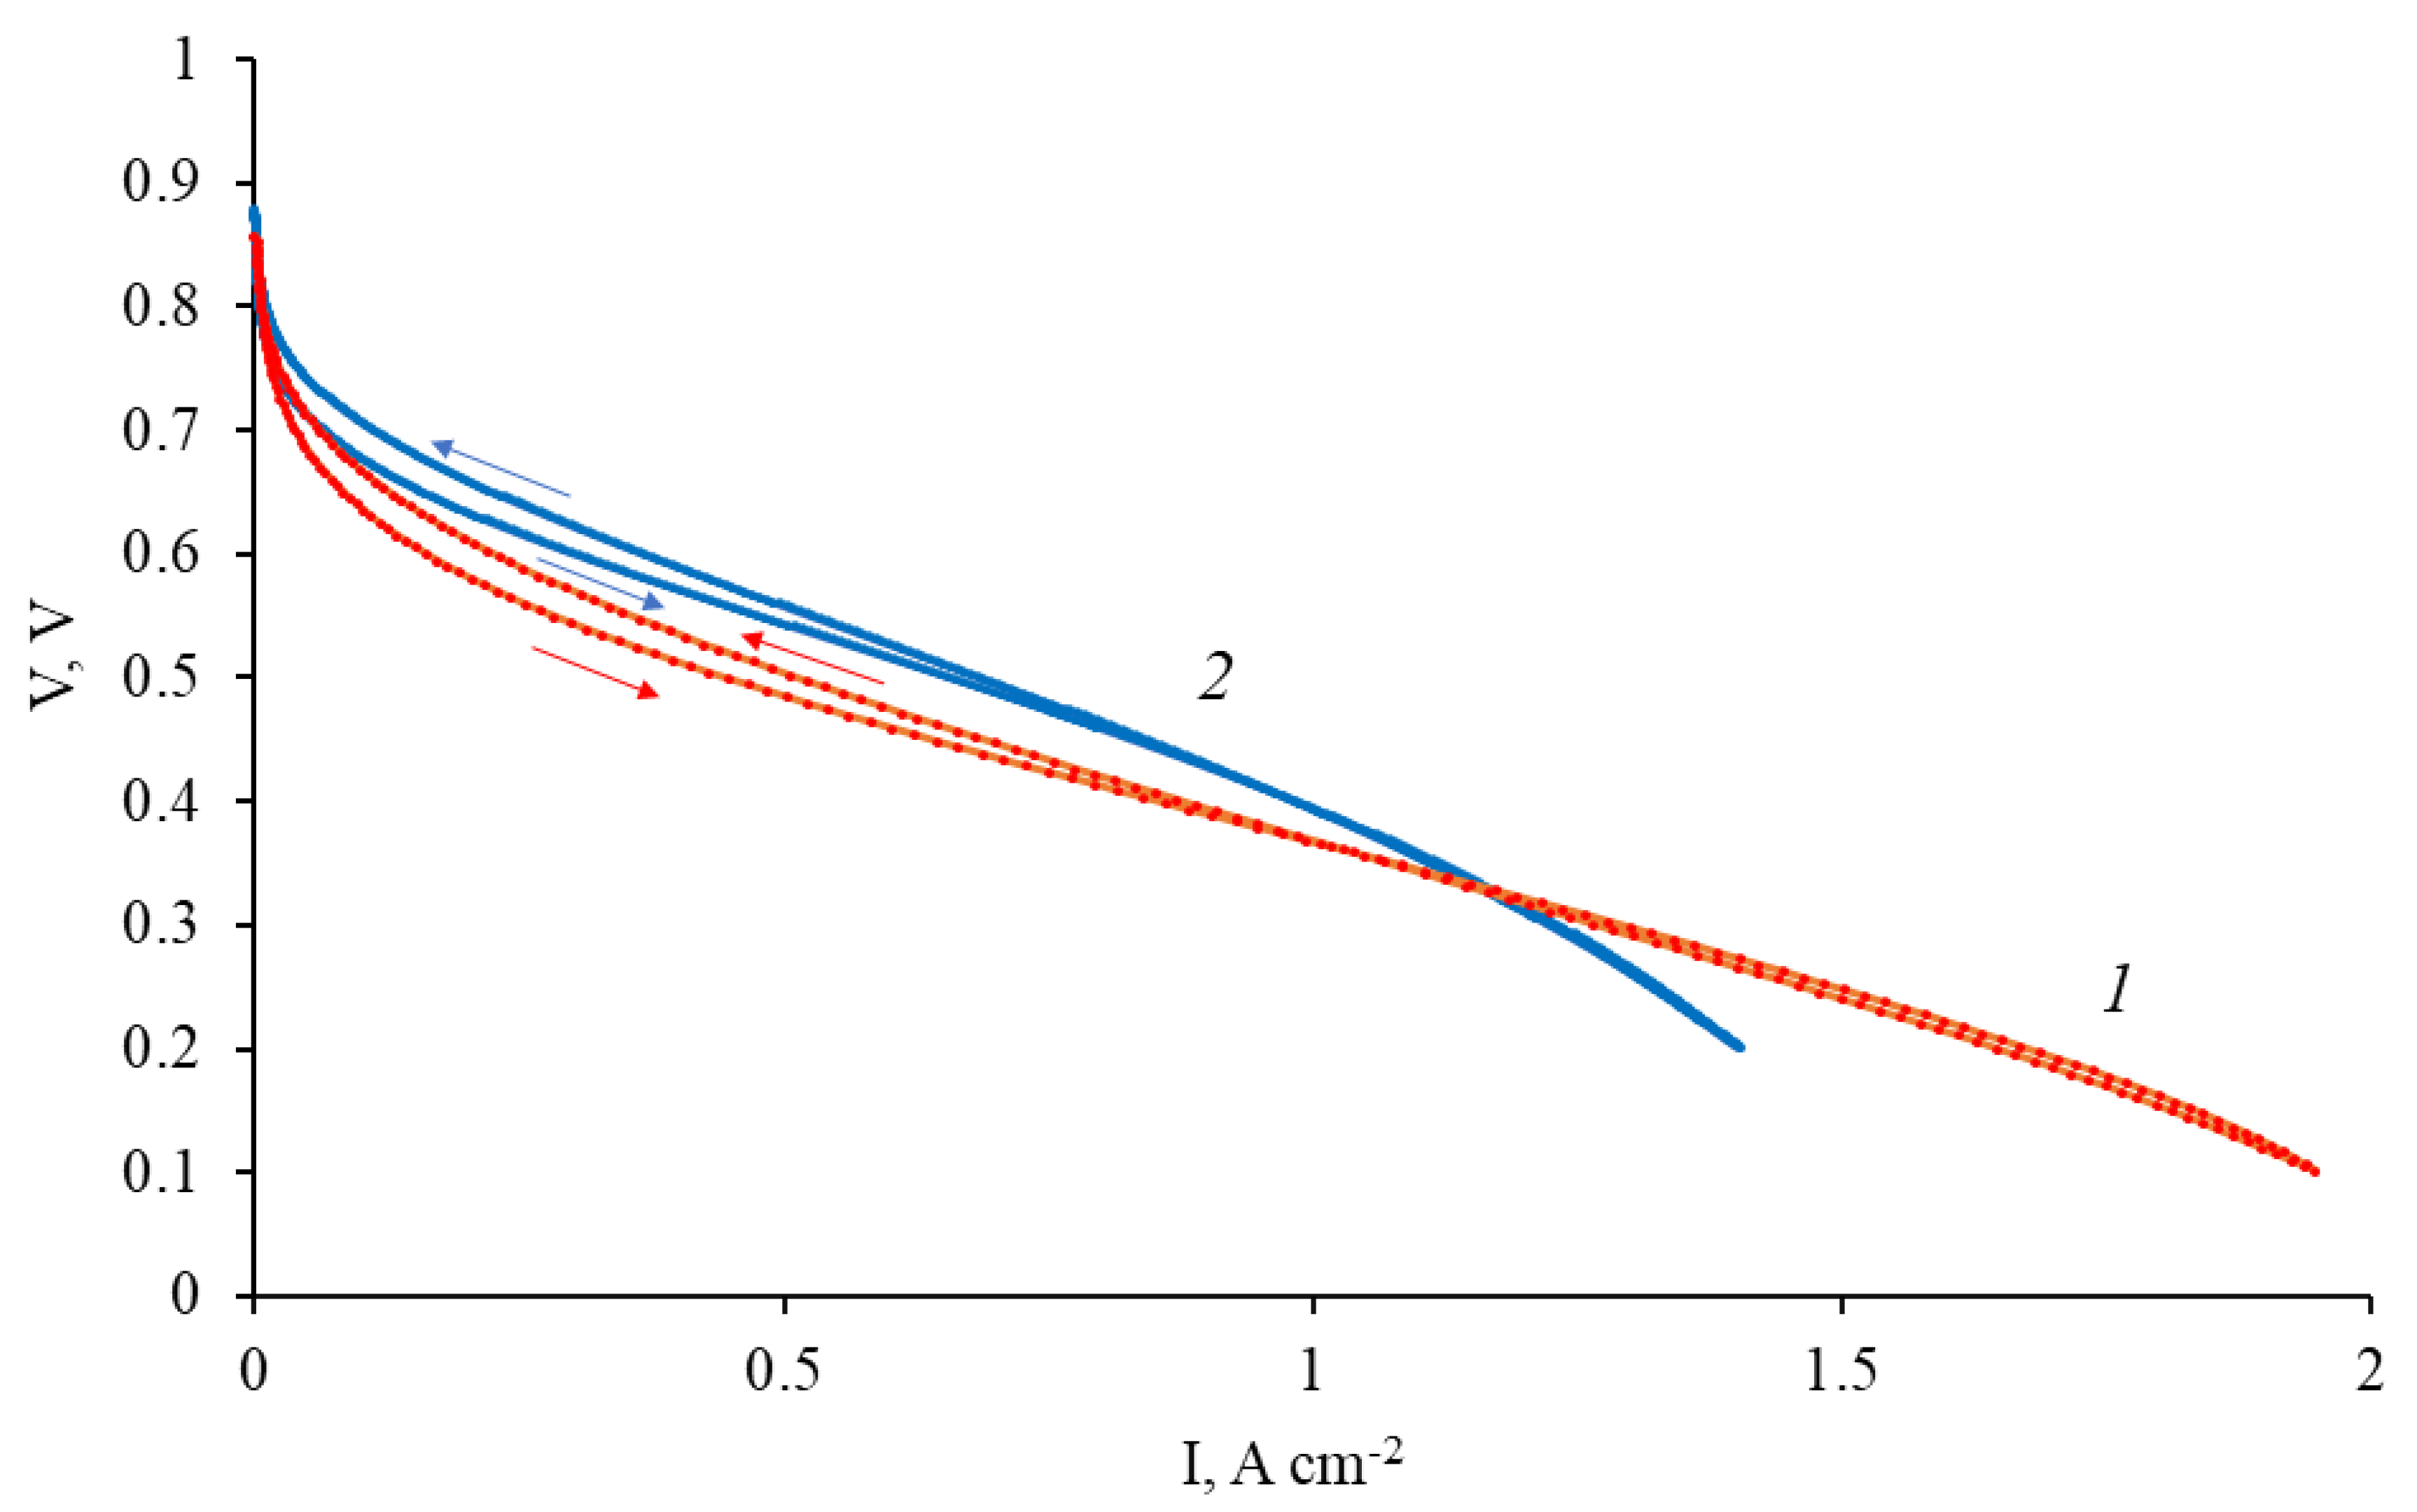
2.3. Fuel Cell Testing
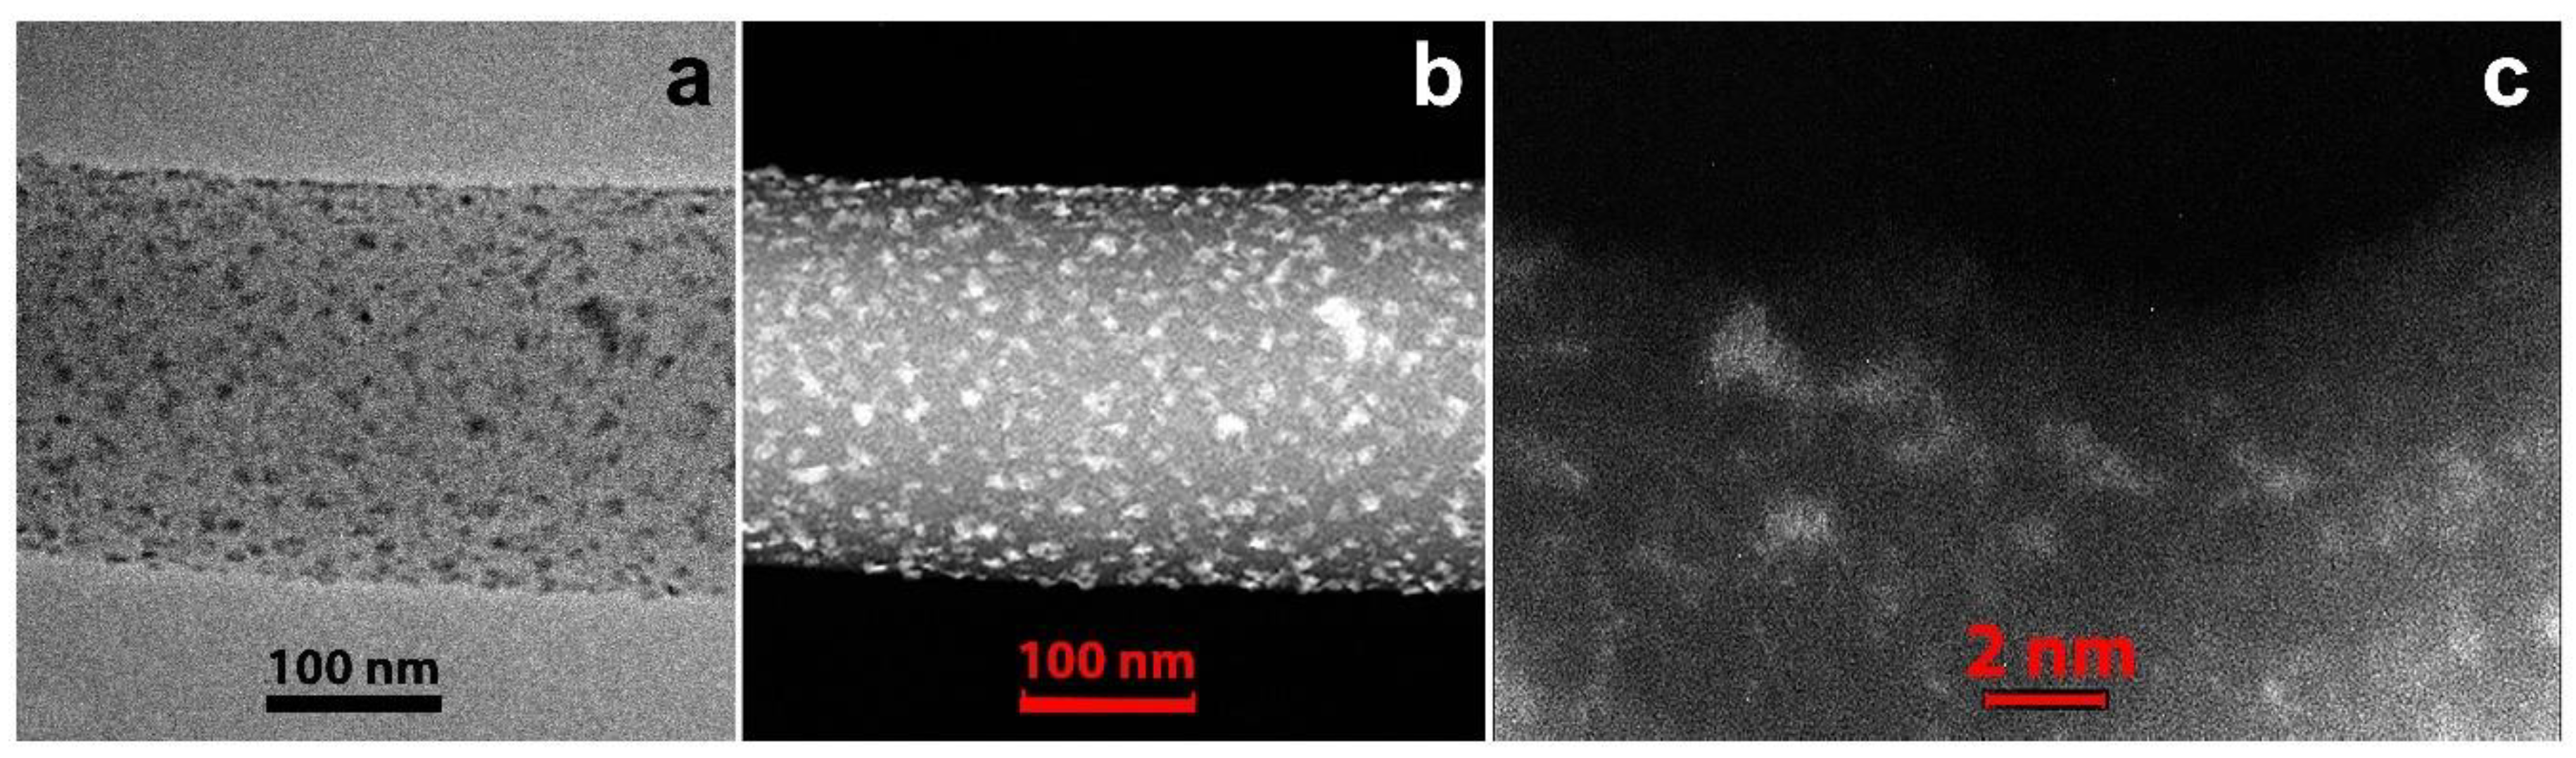
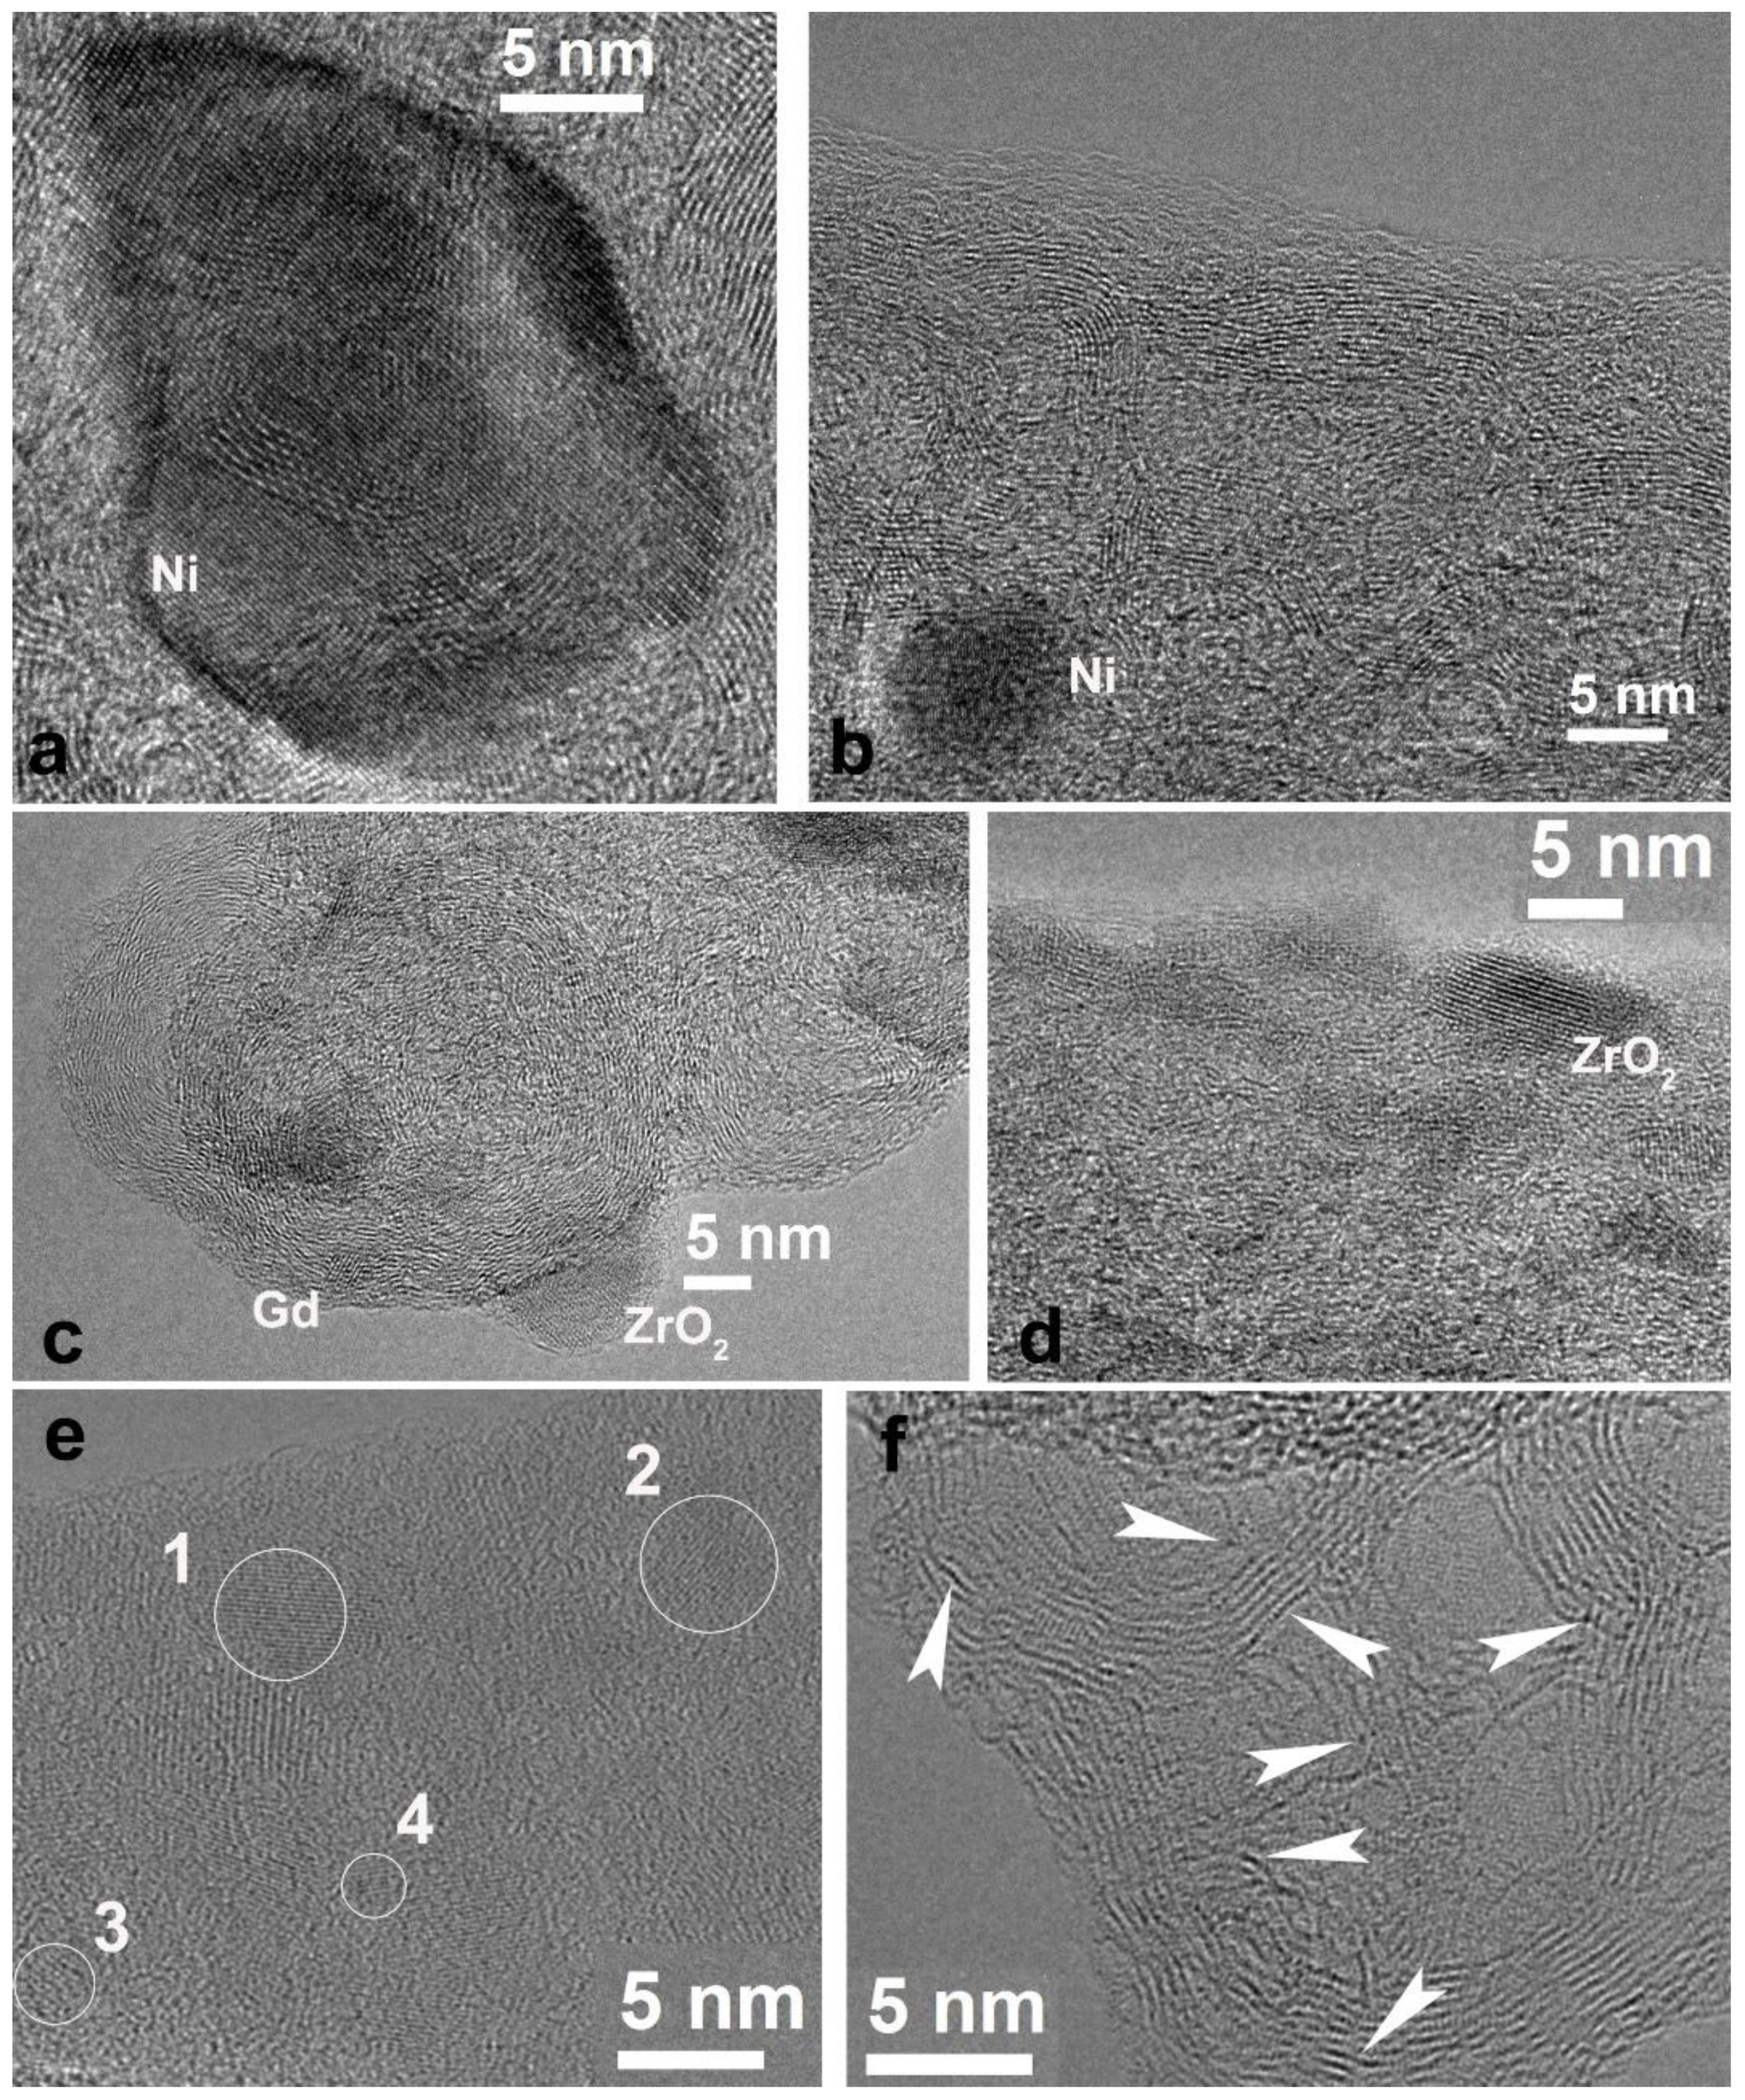
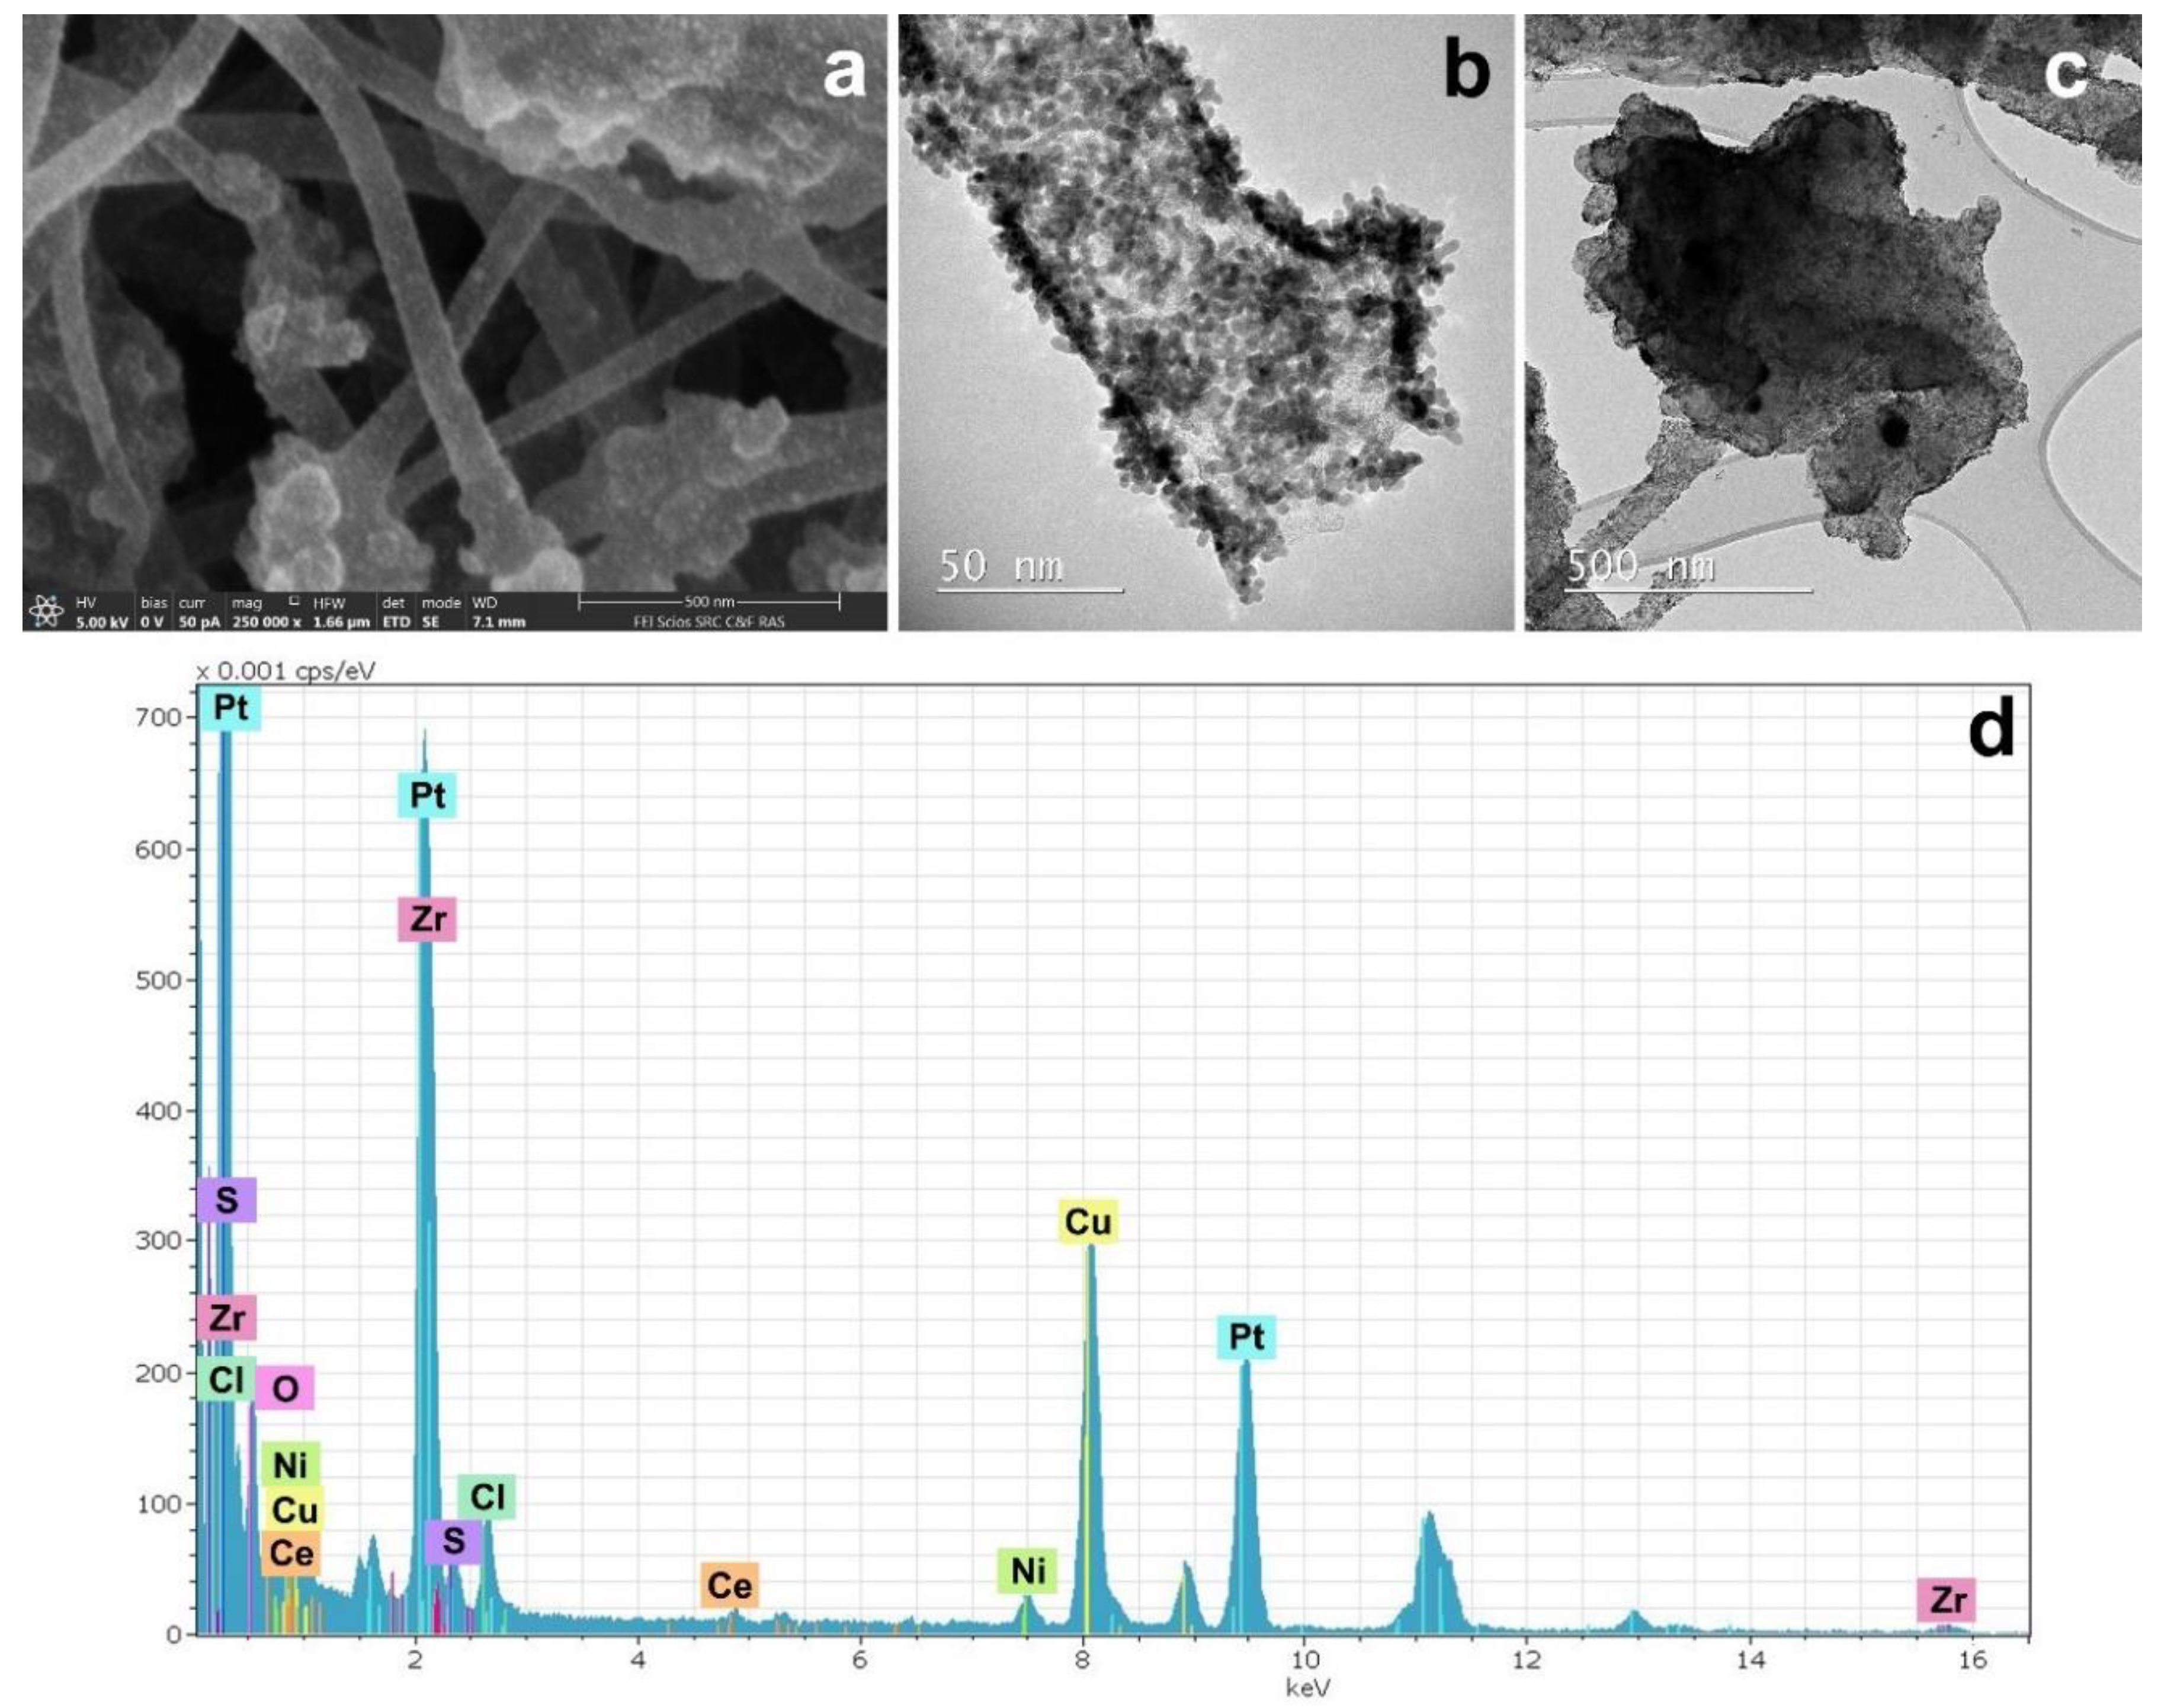
2.4. Electron Microscopy
2.5. X-Ray Photoelectron Spectroscopy
2.6. Cyclic Voltammetry
3. Results and Discussion
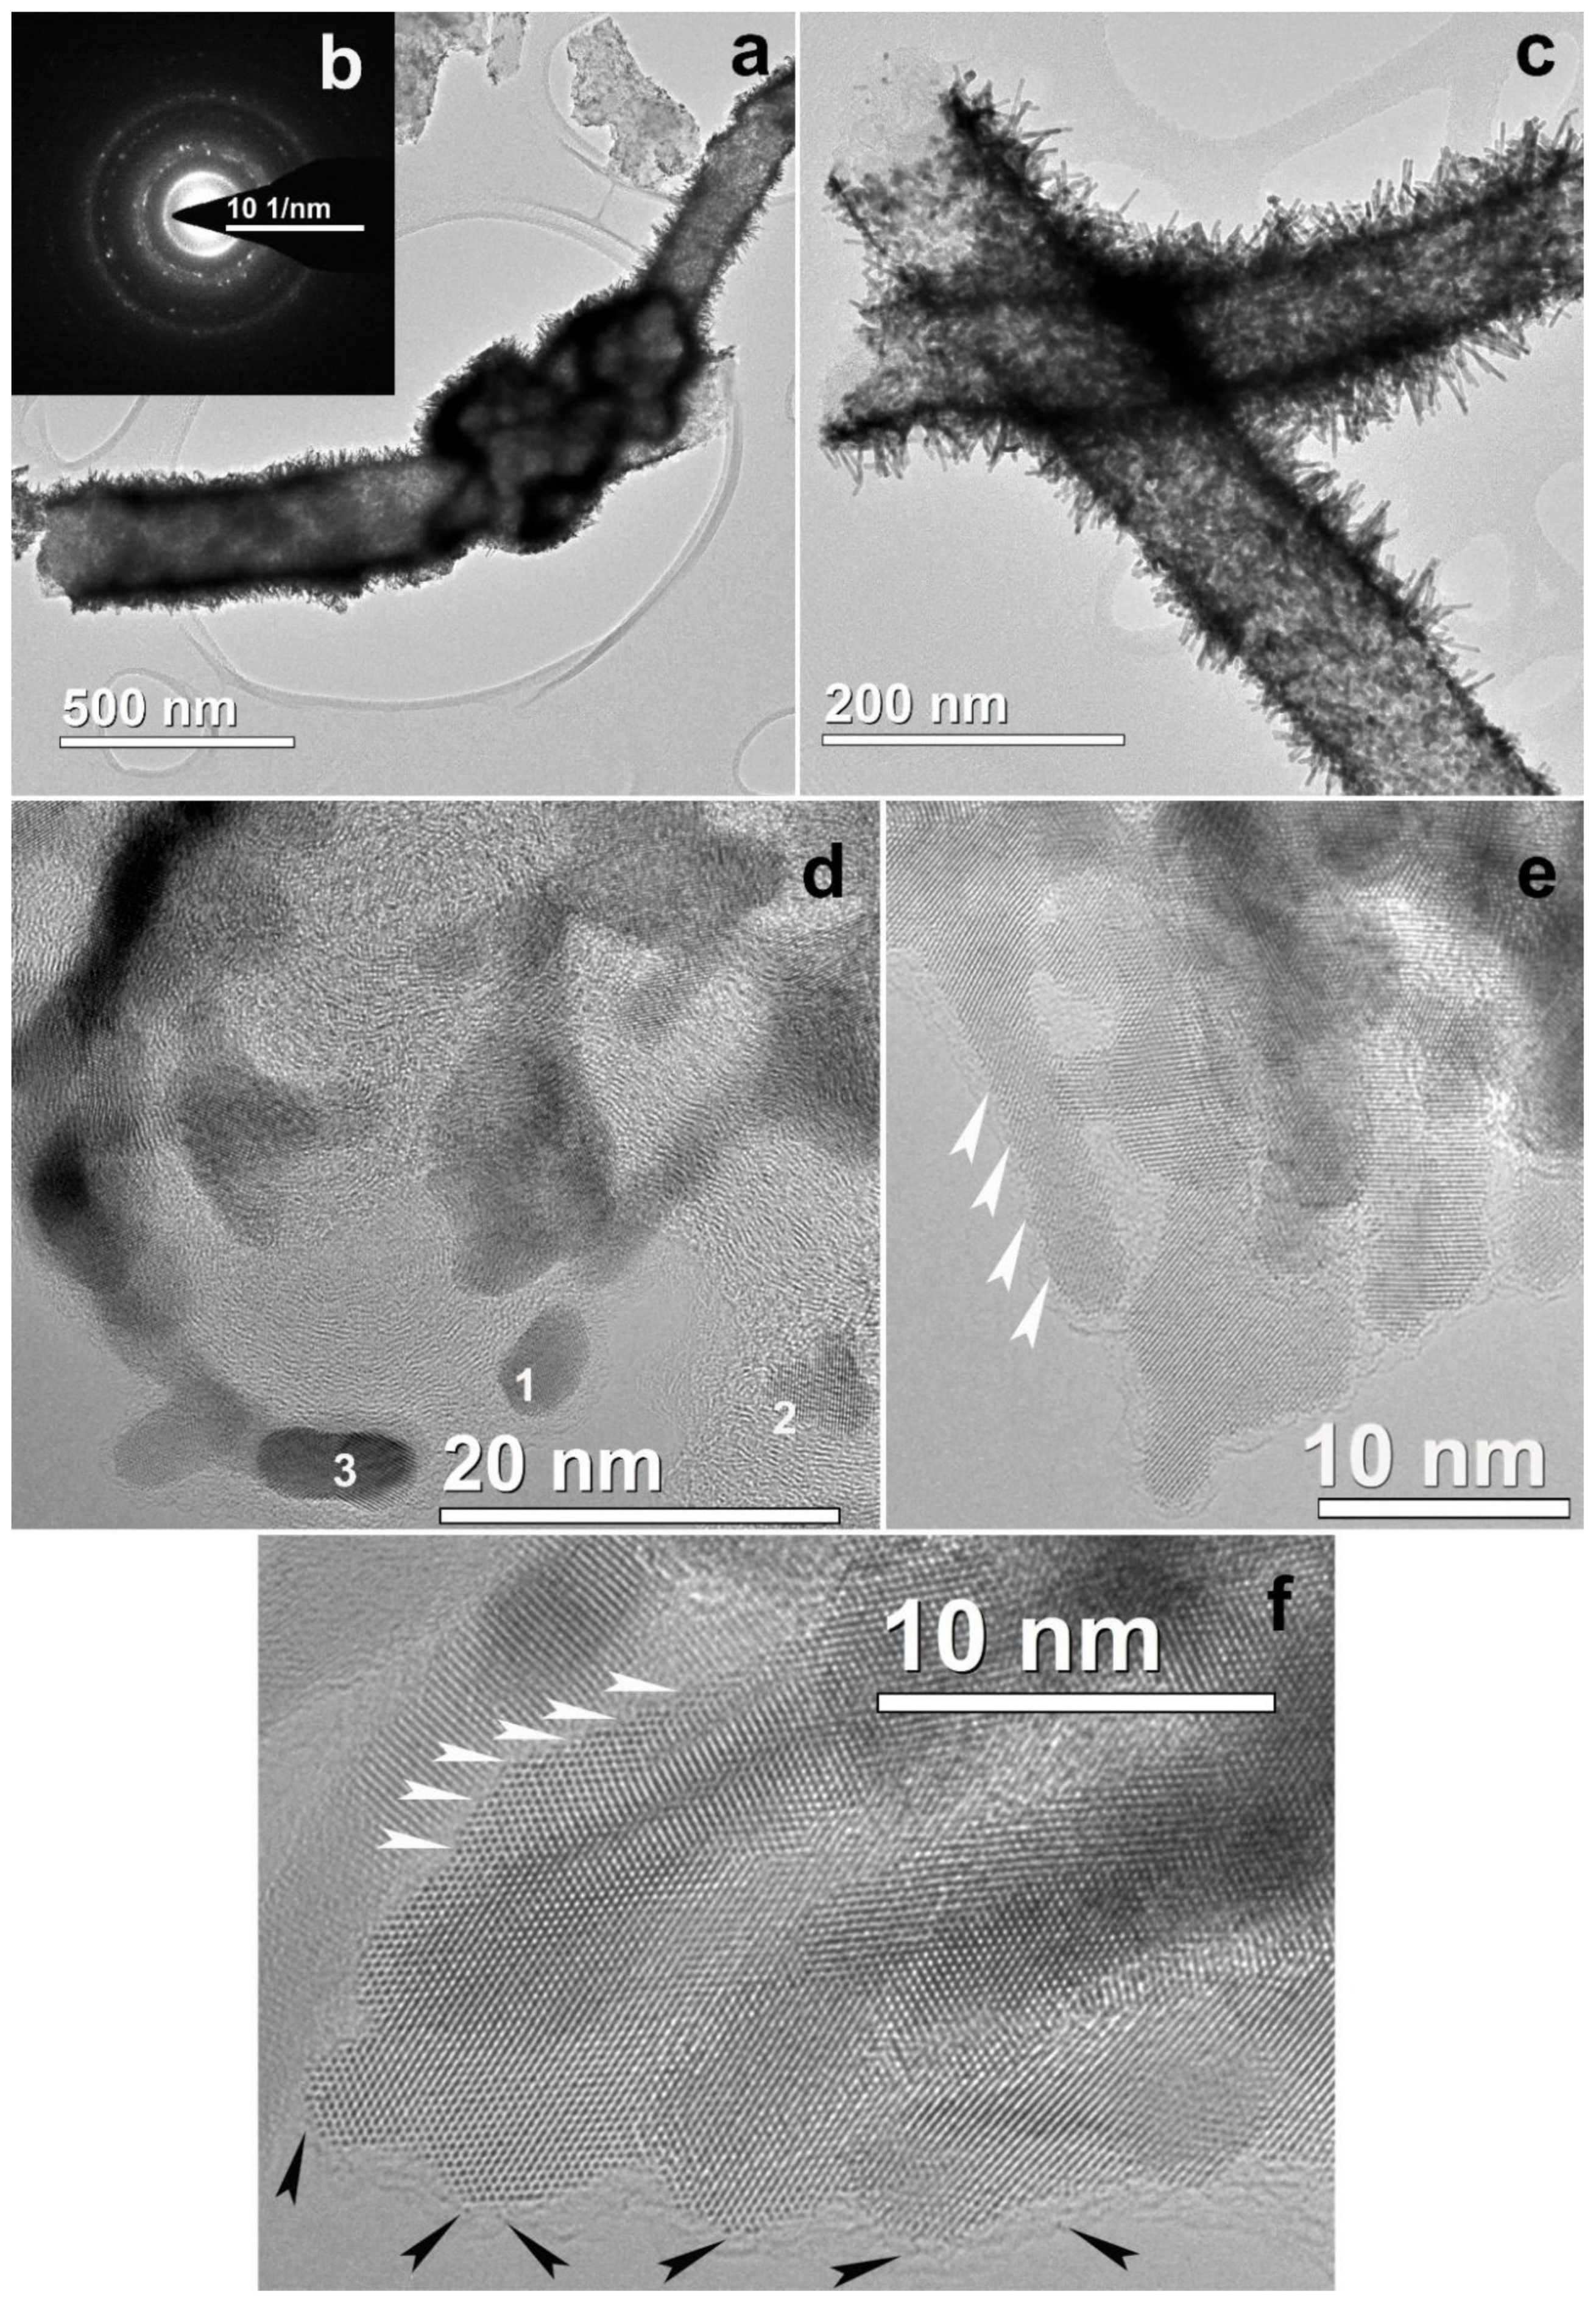
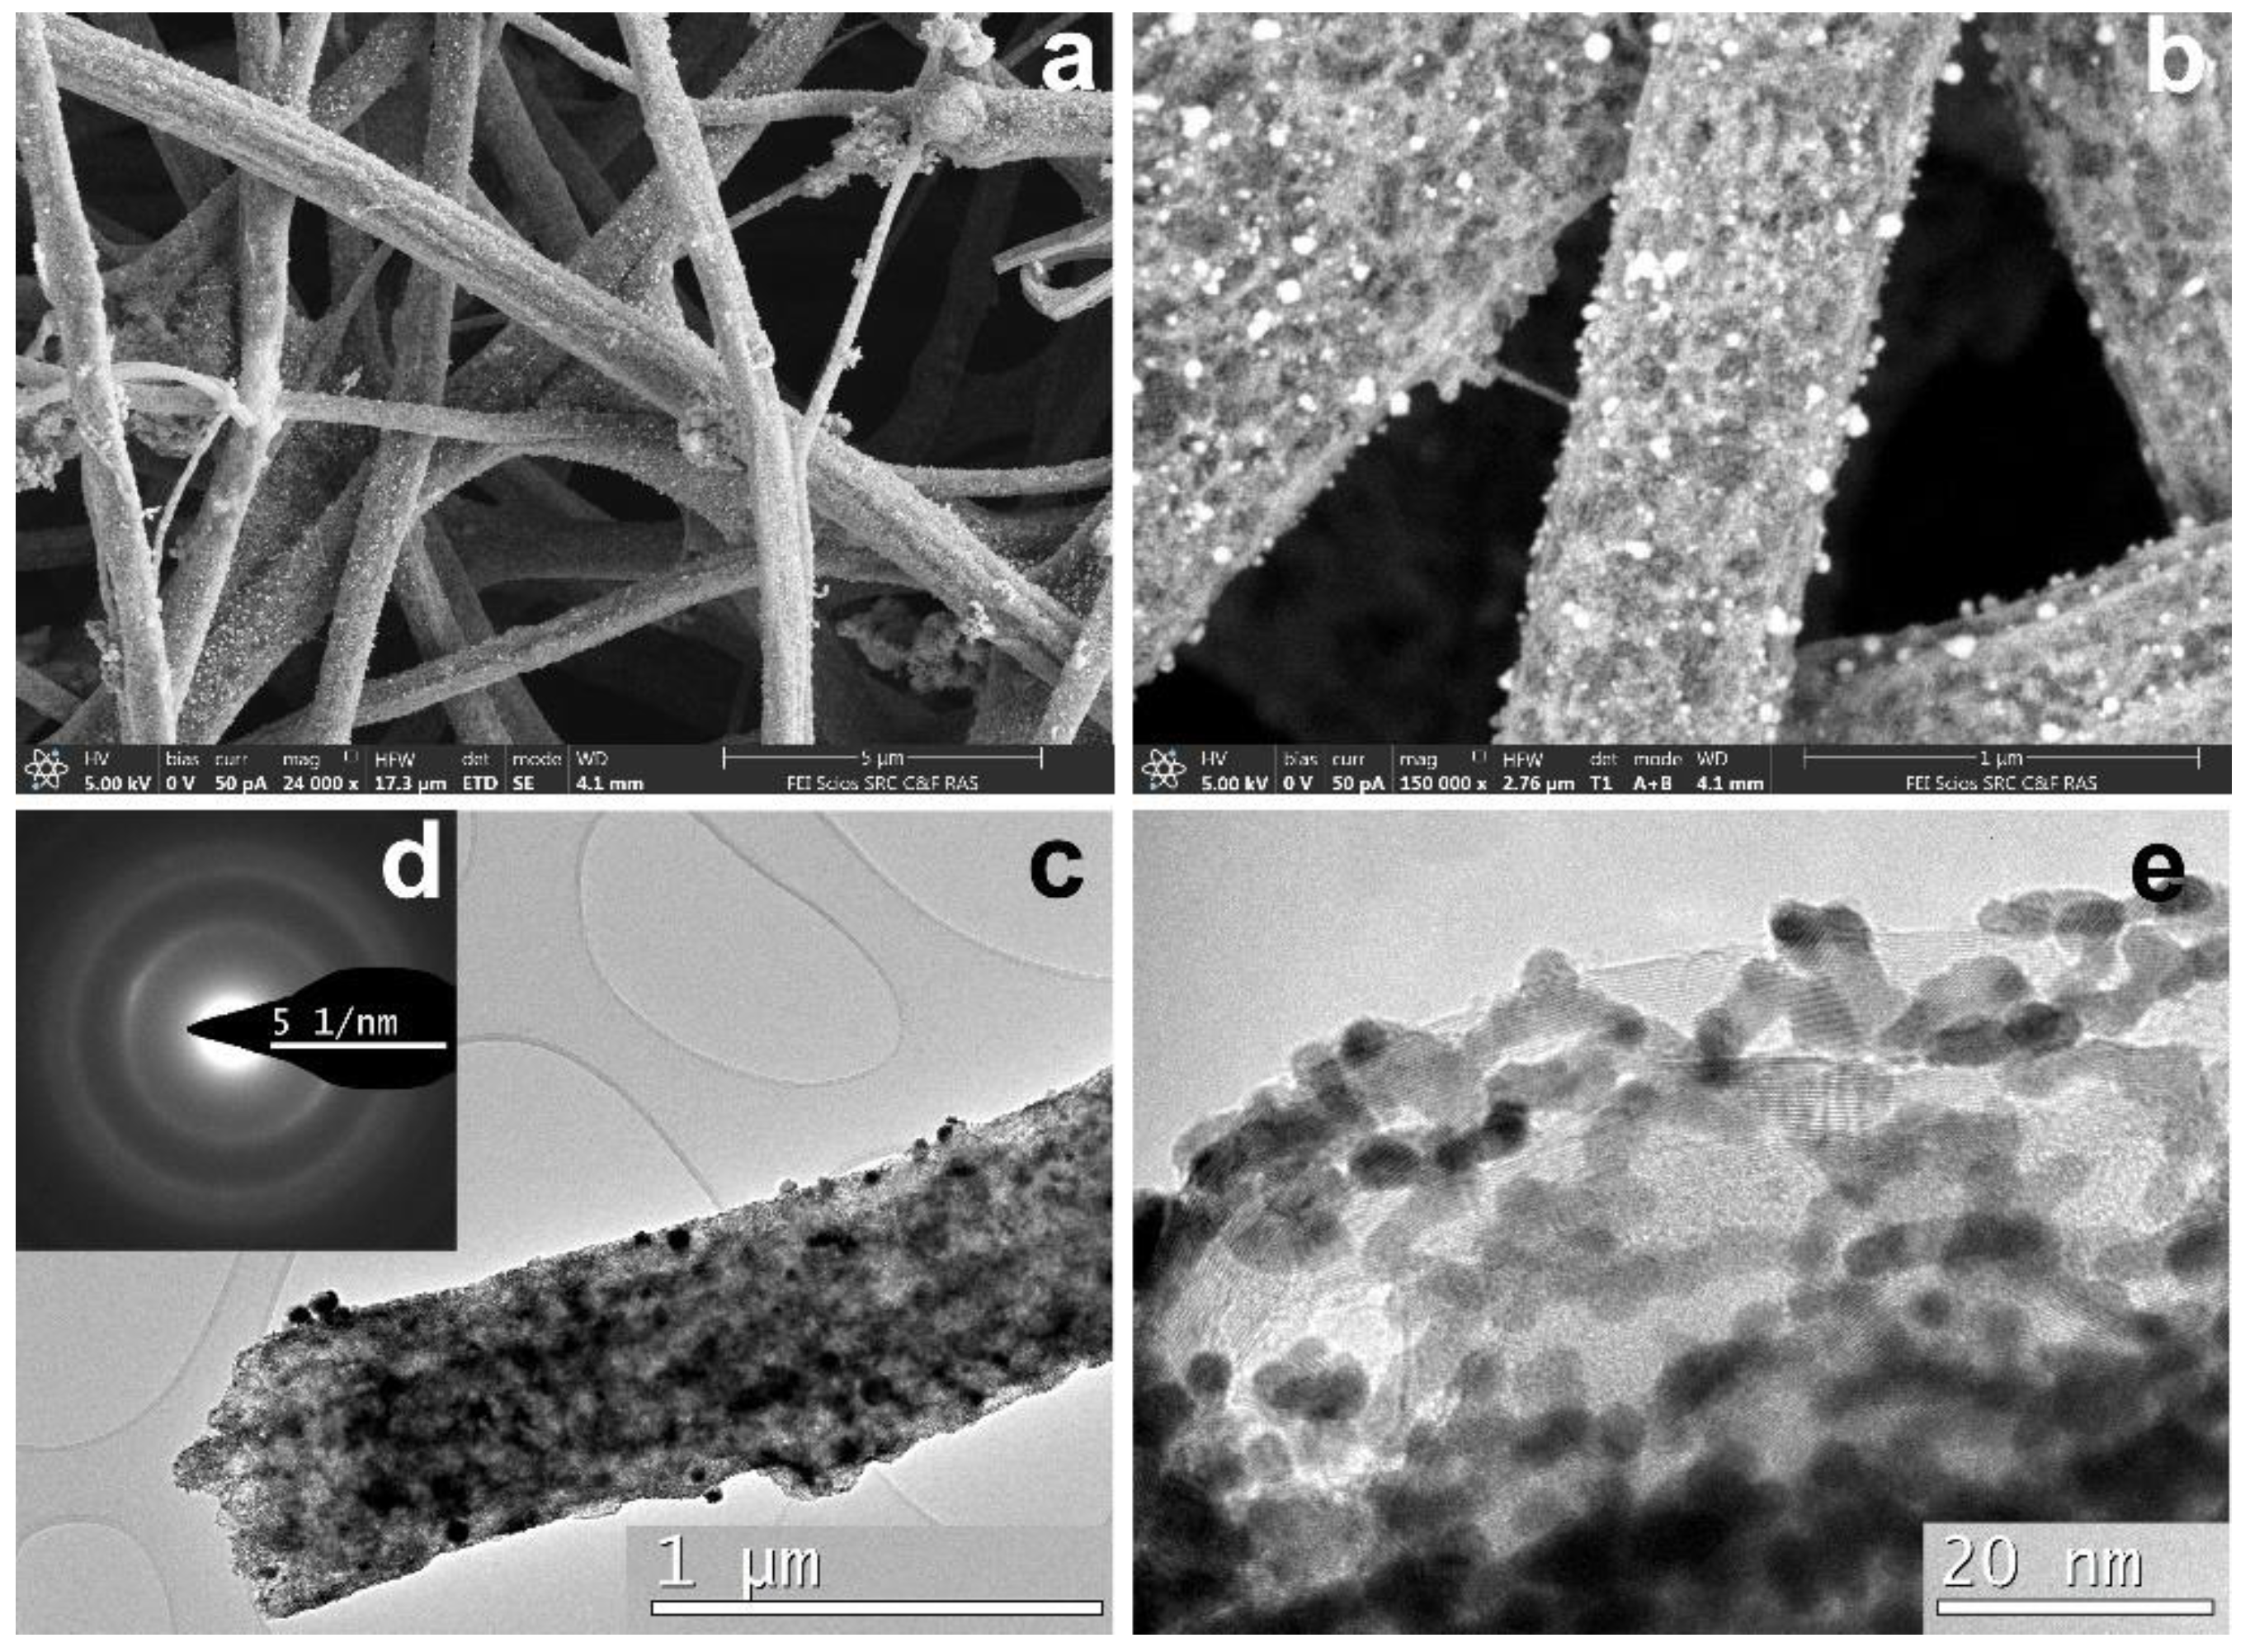
3.1. Electrospun CNF Composite
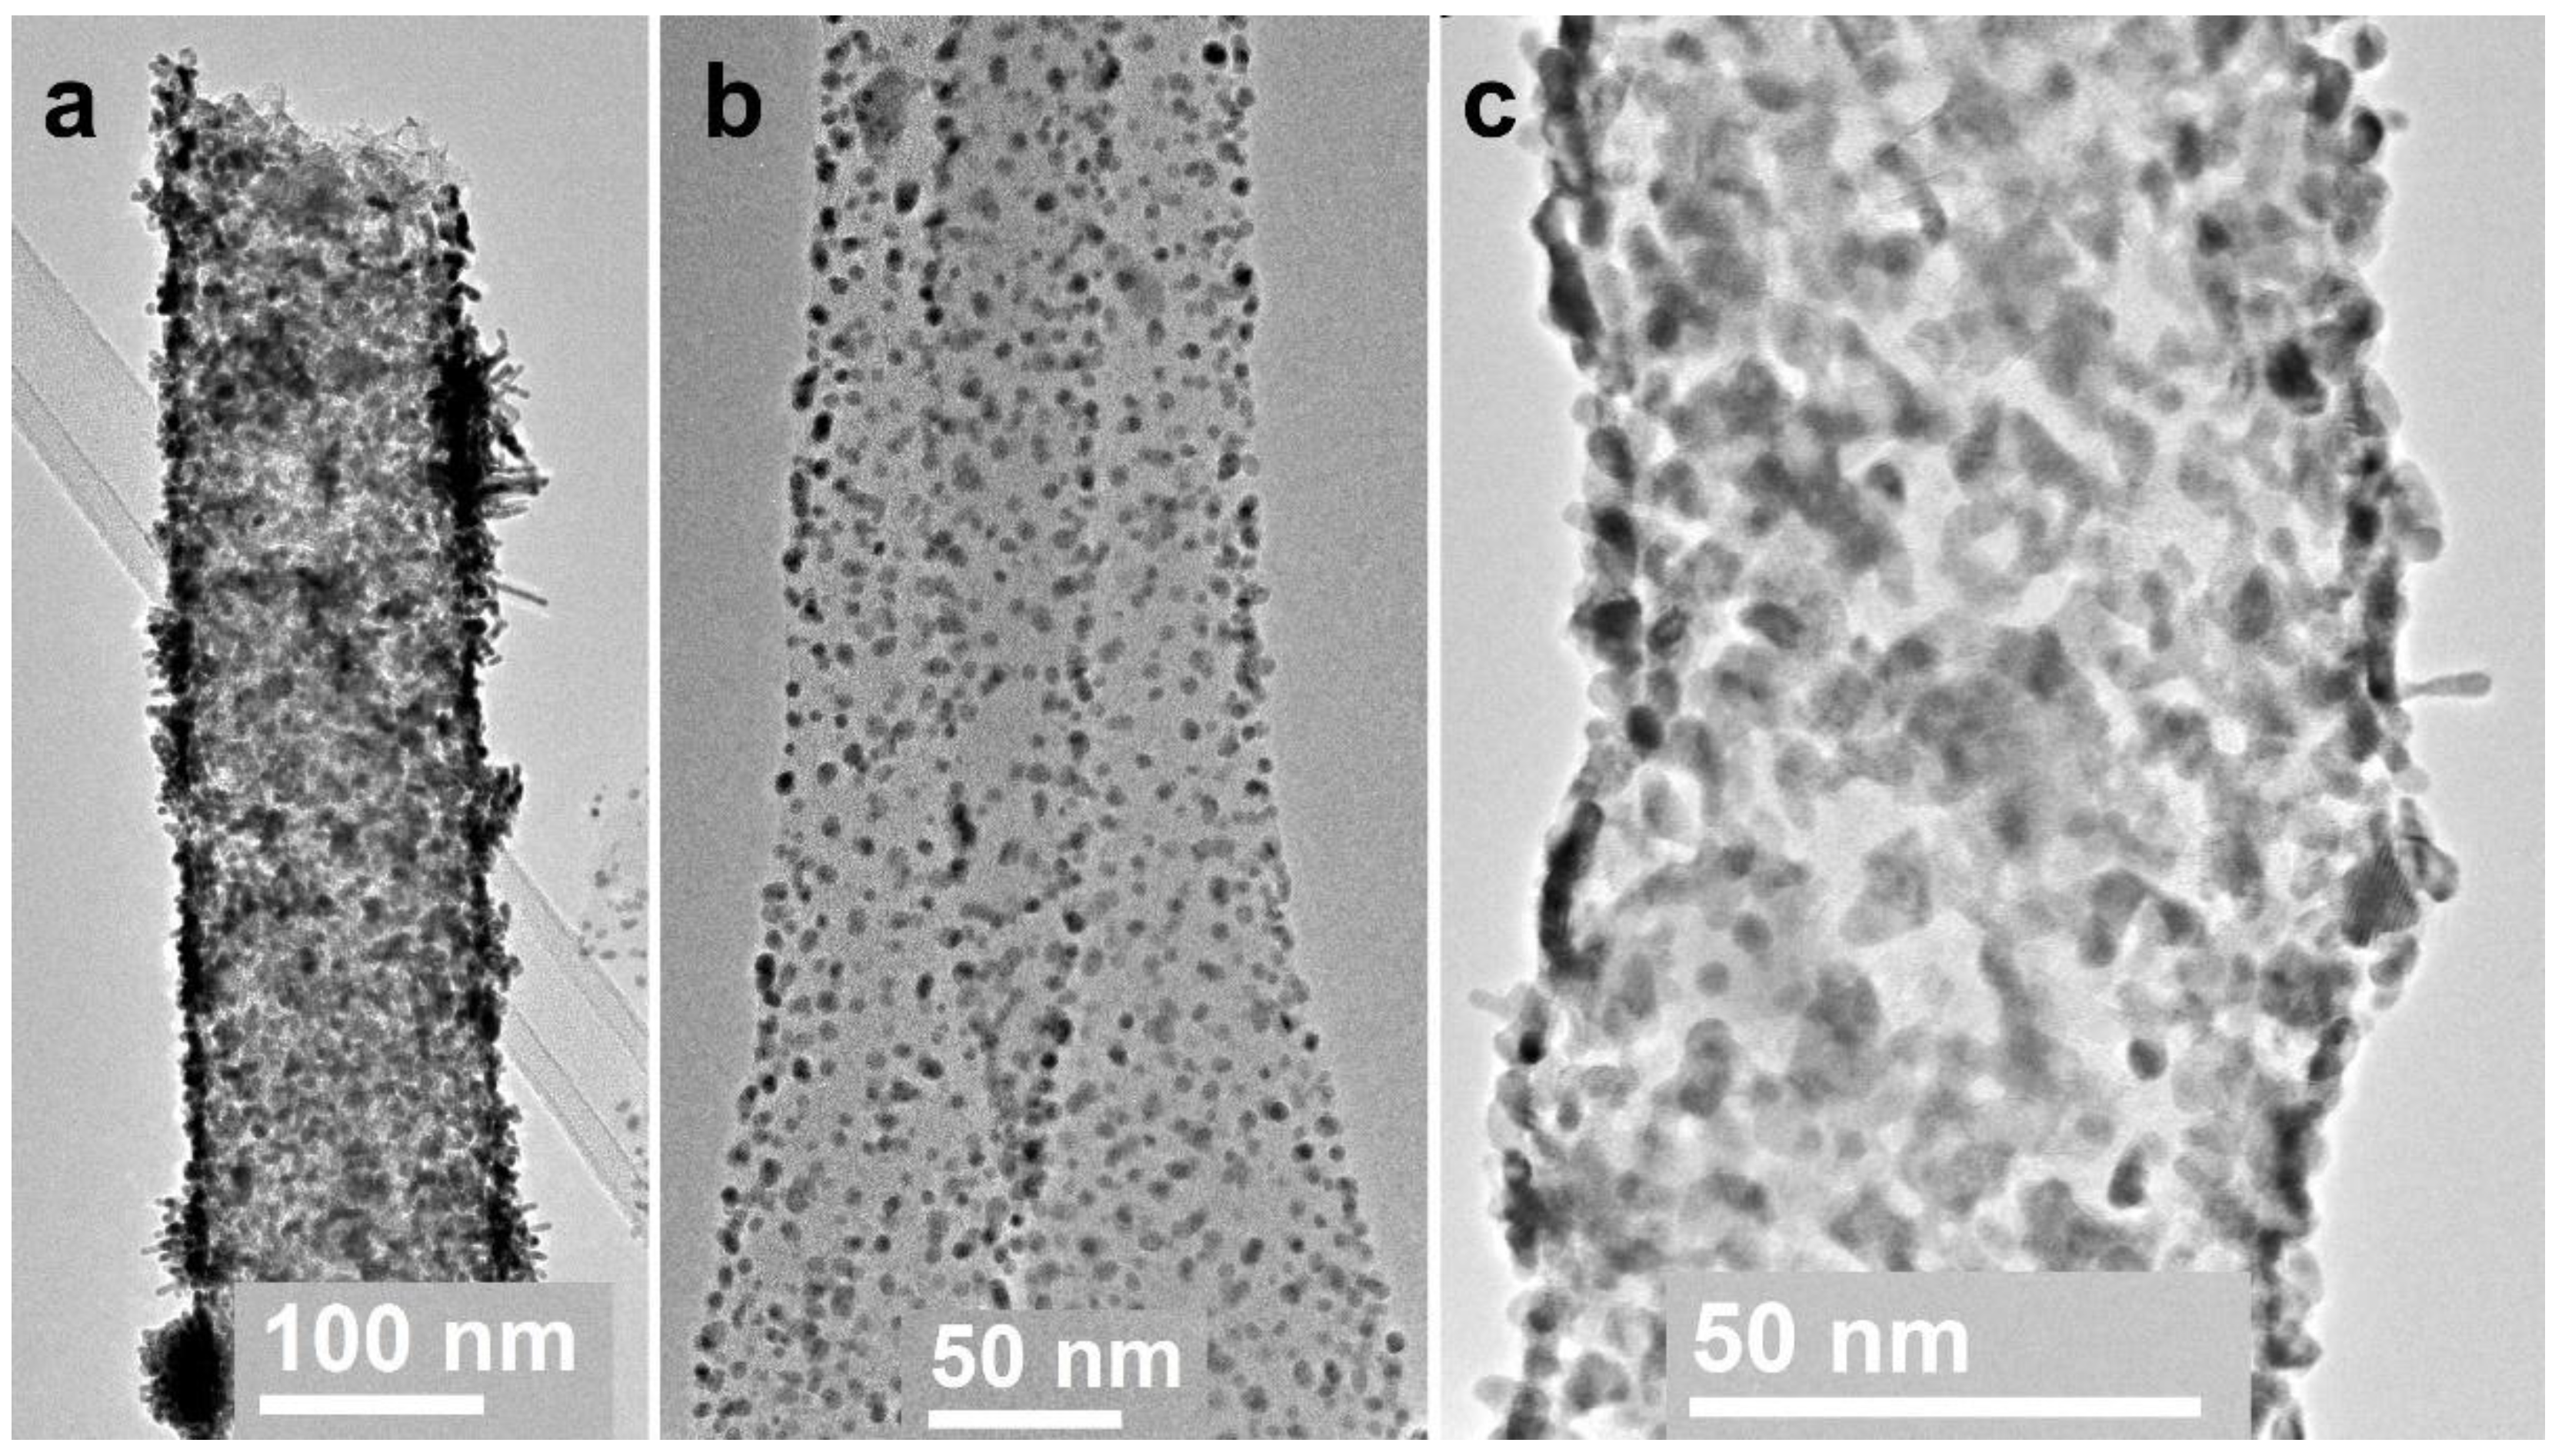
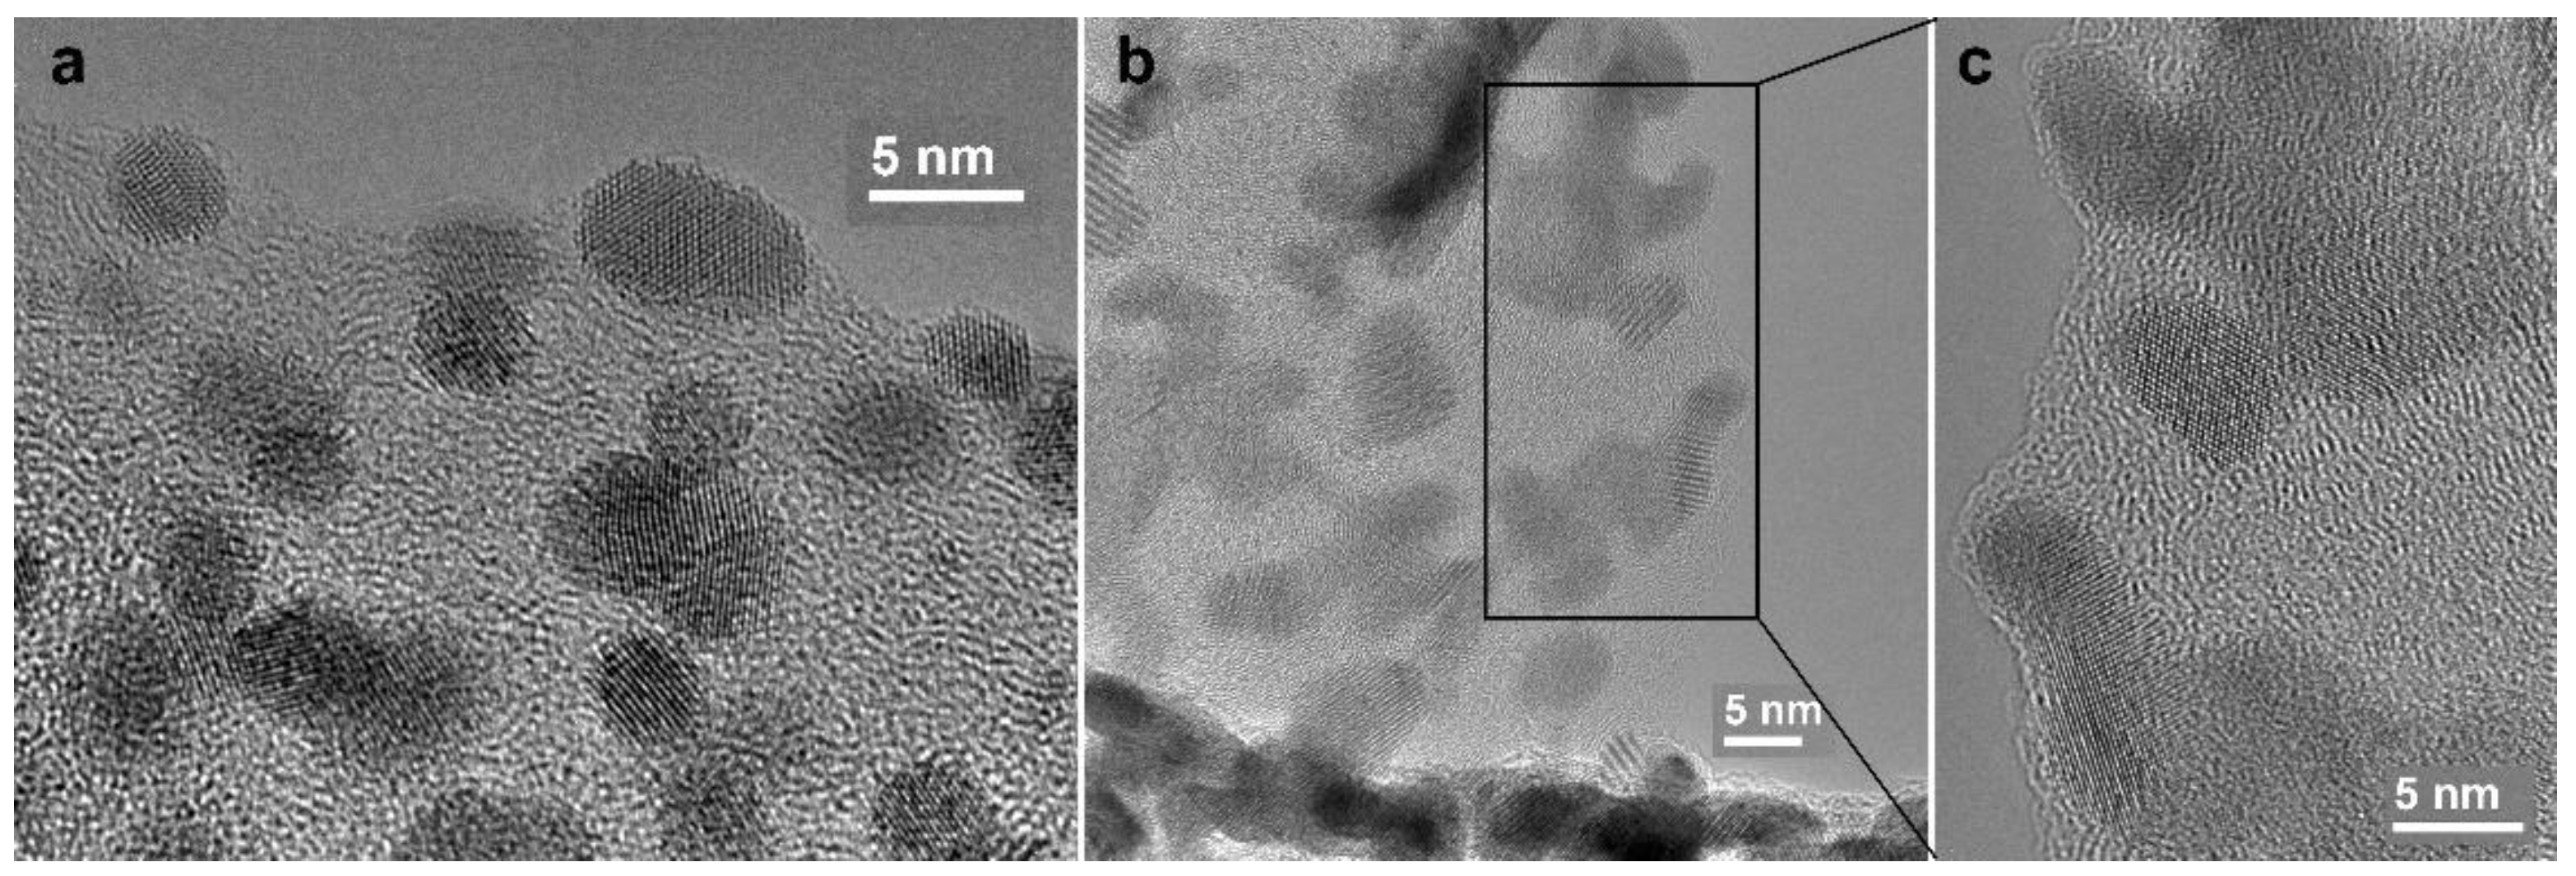
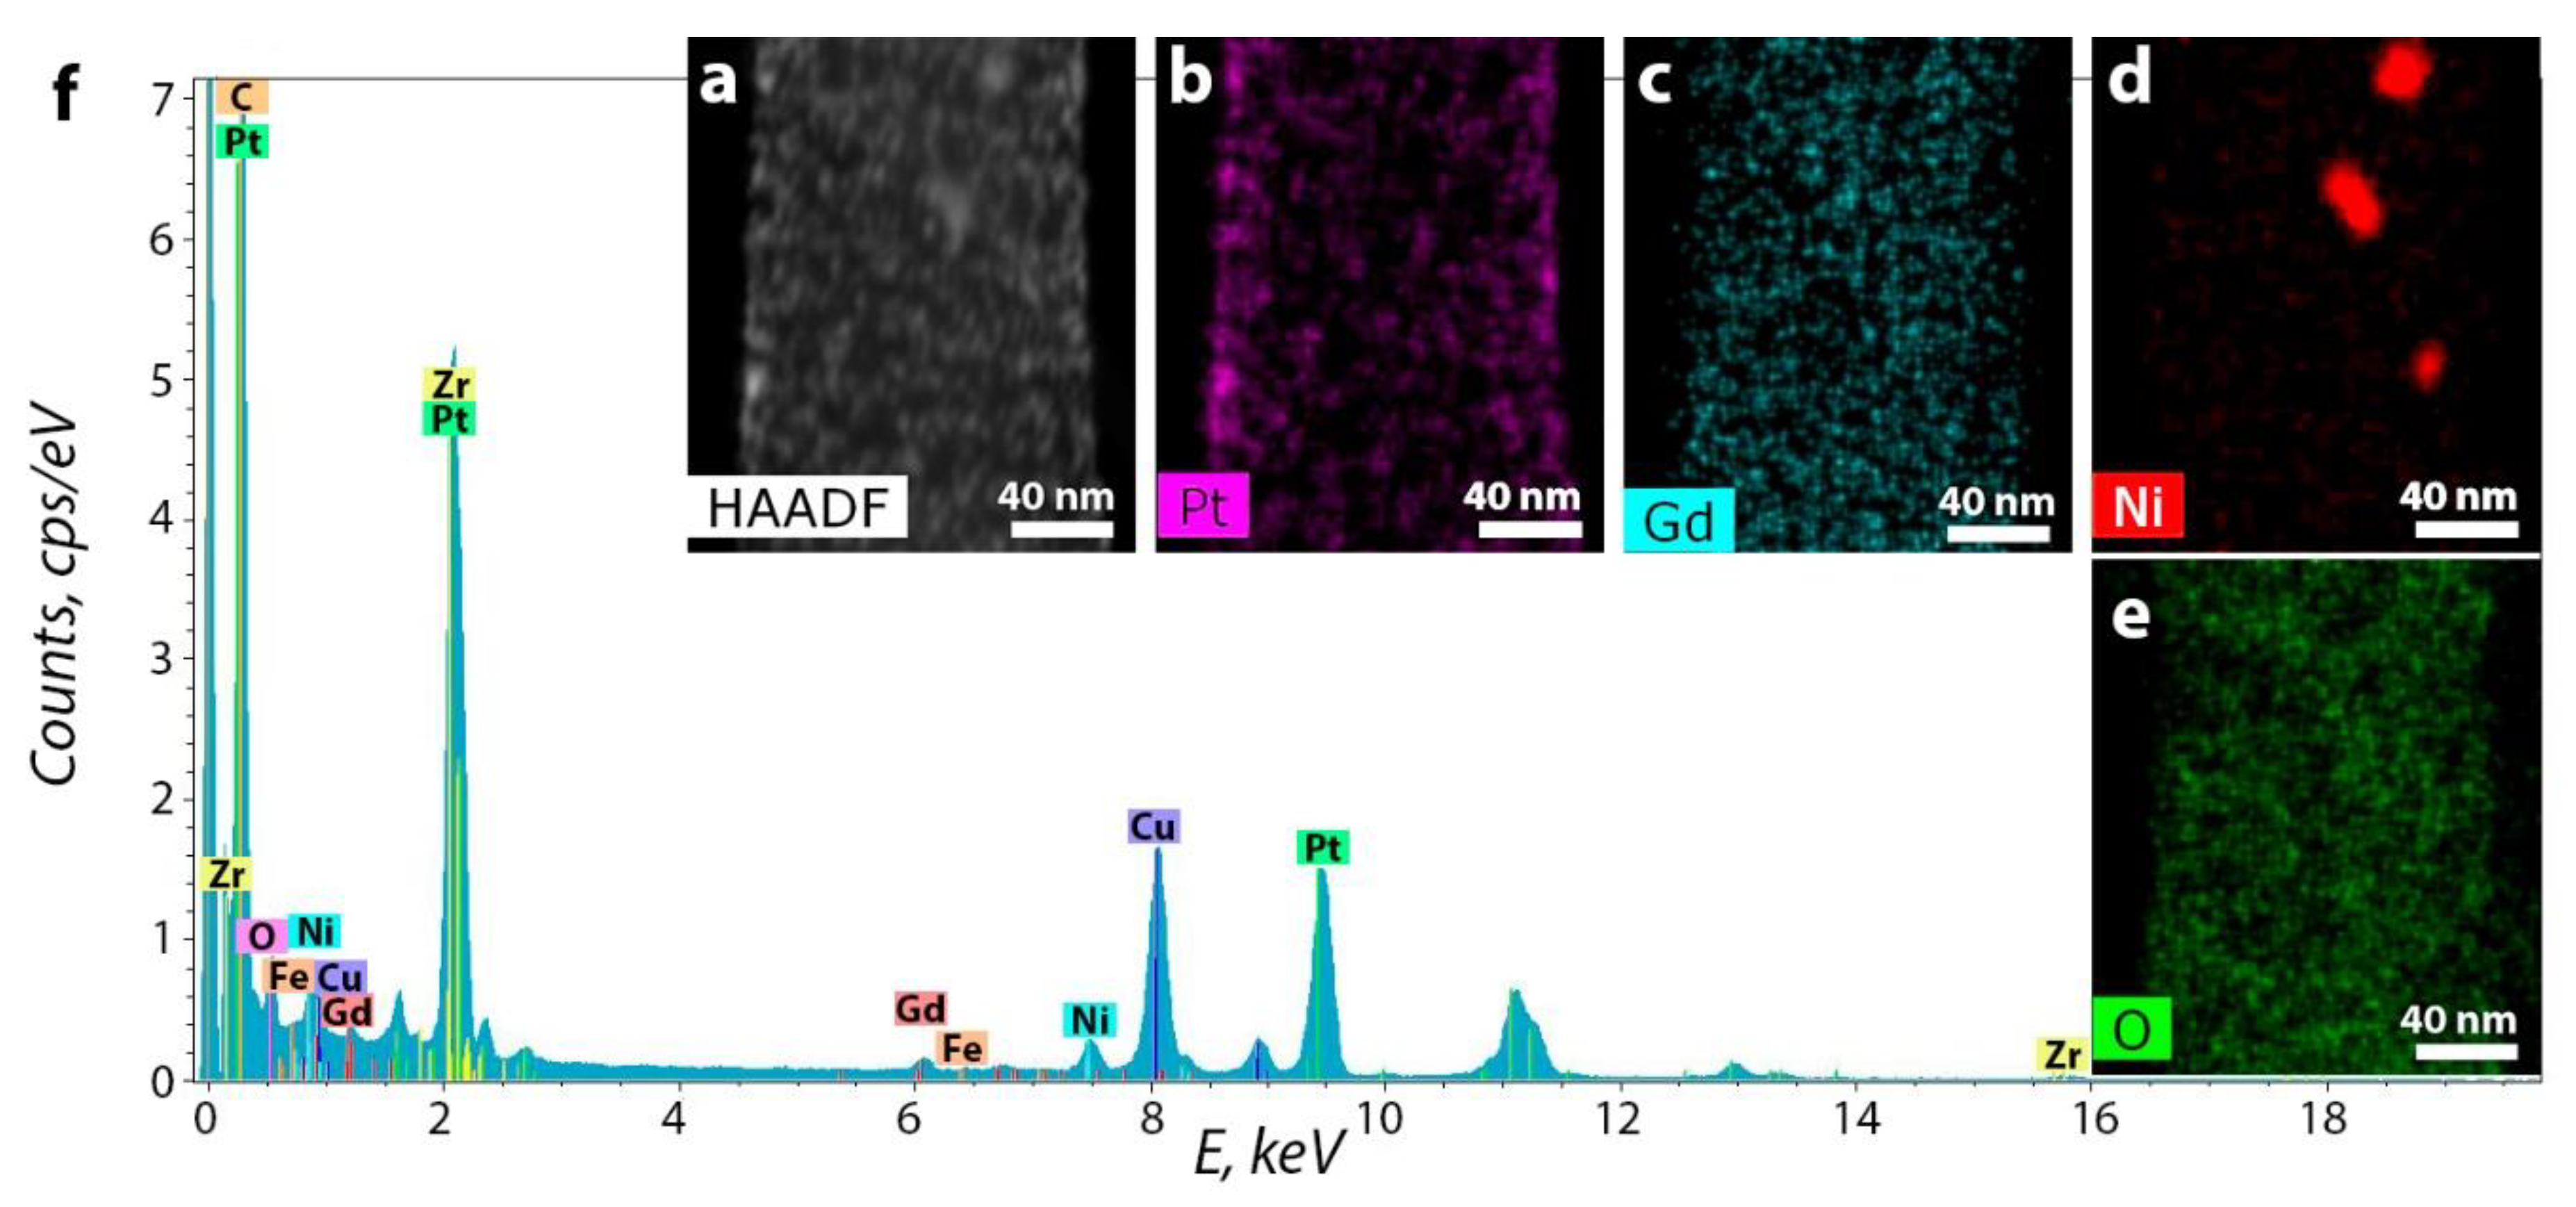
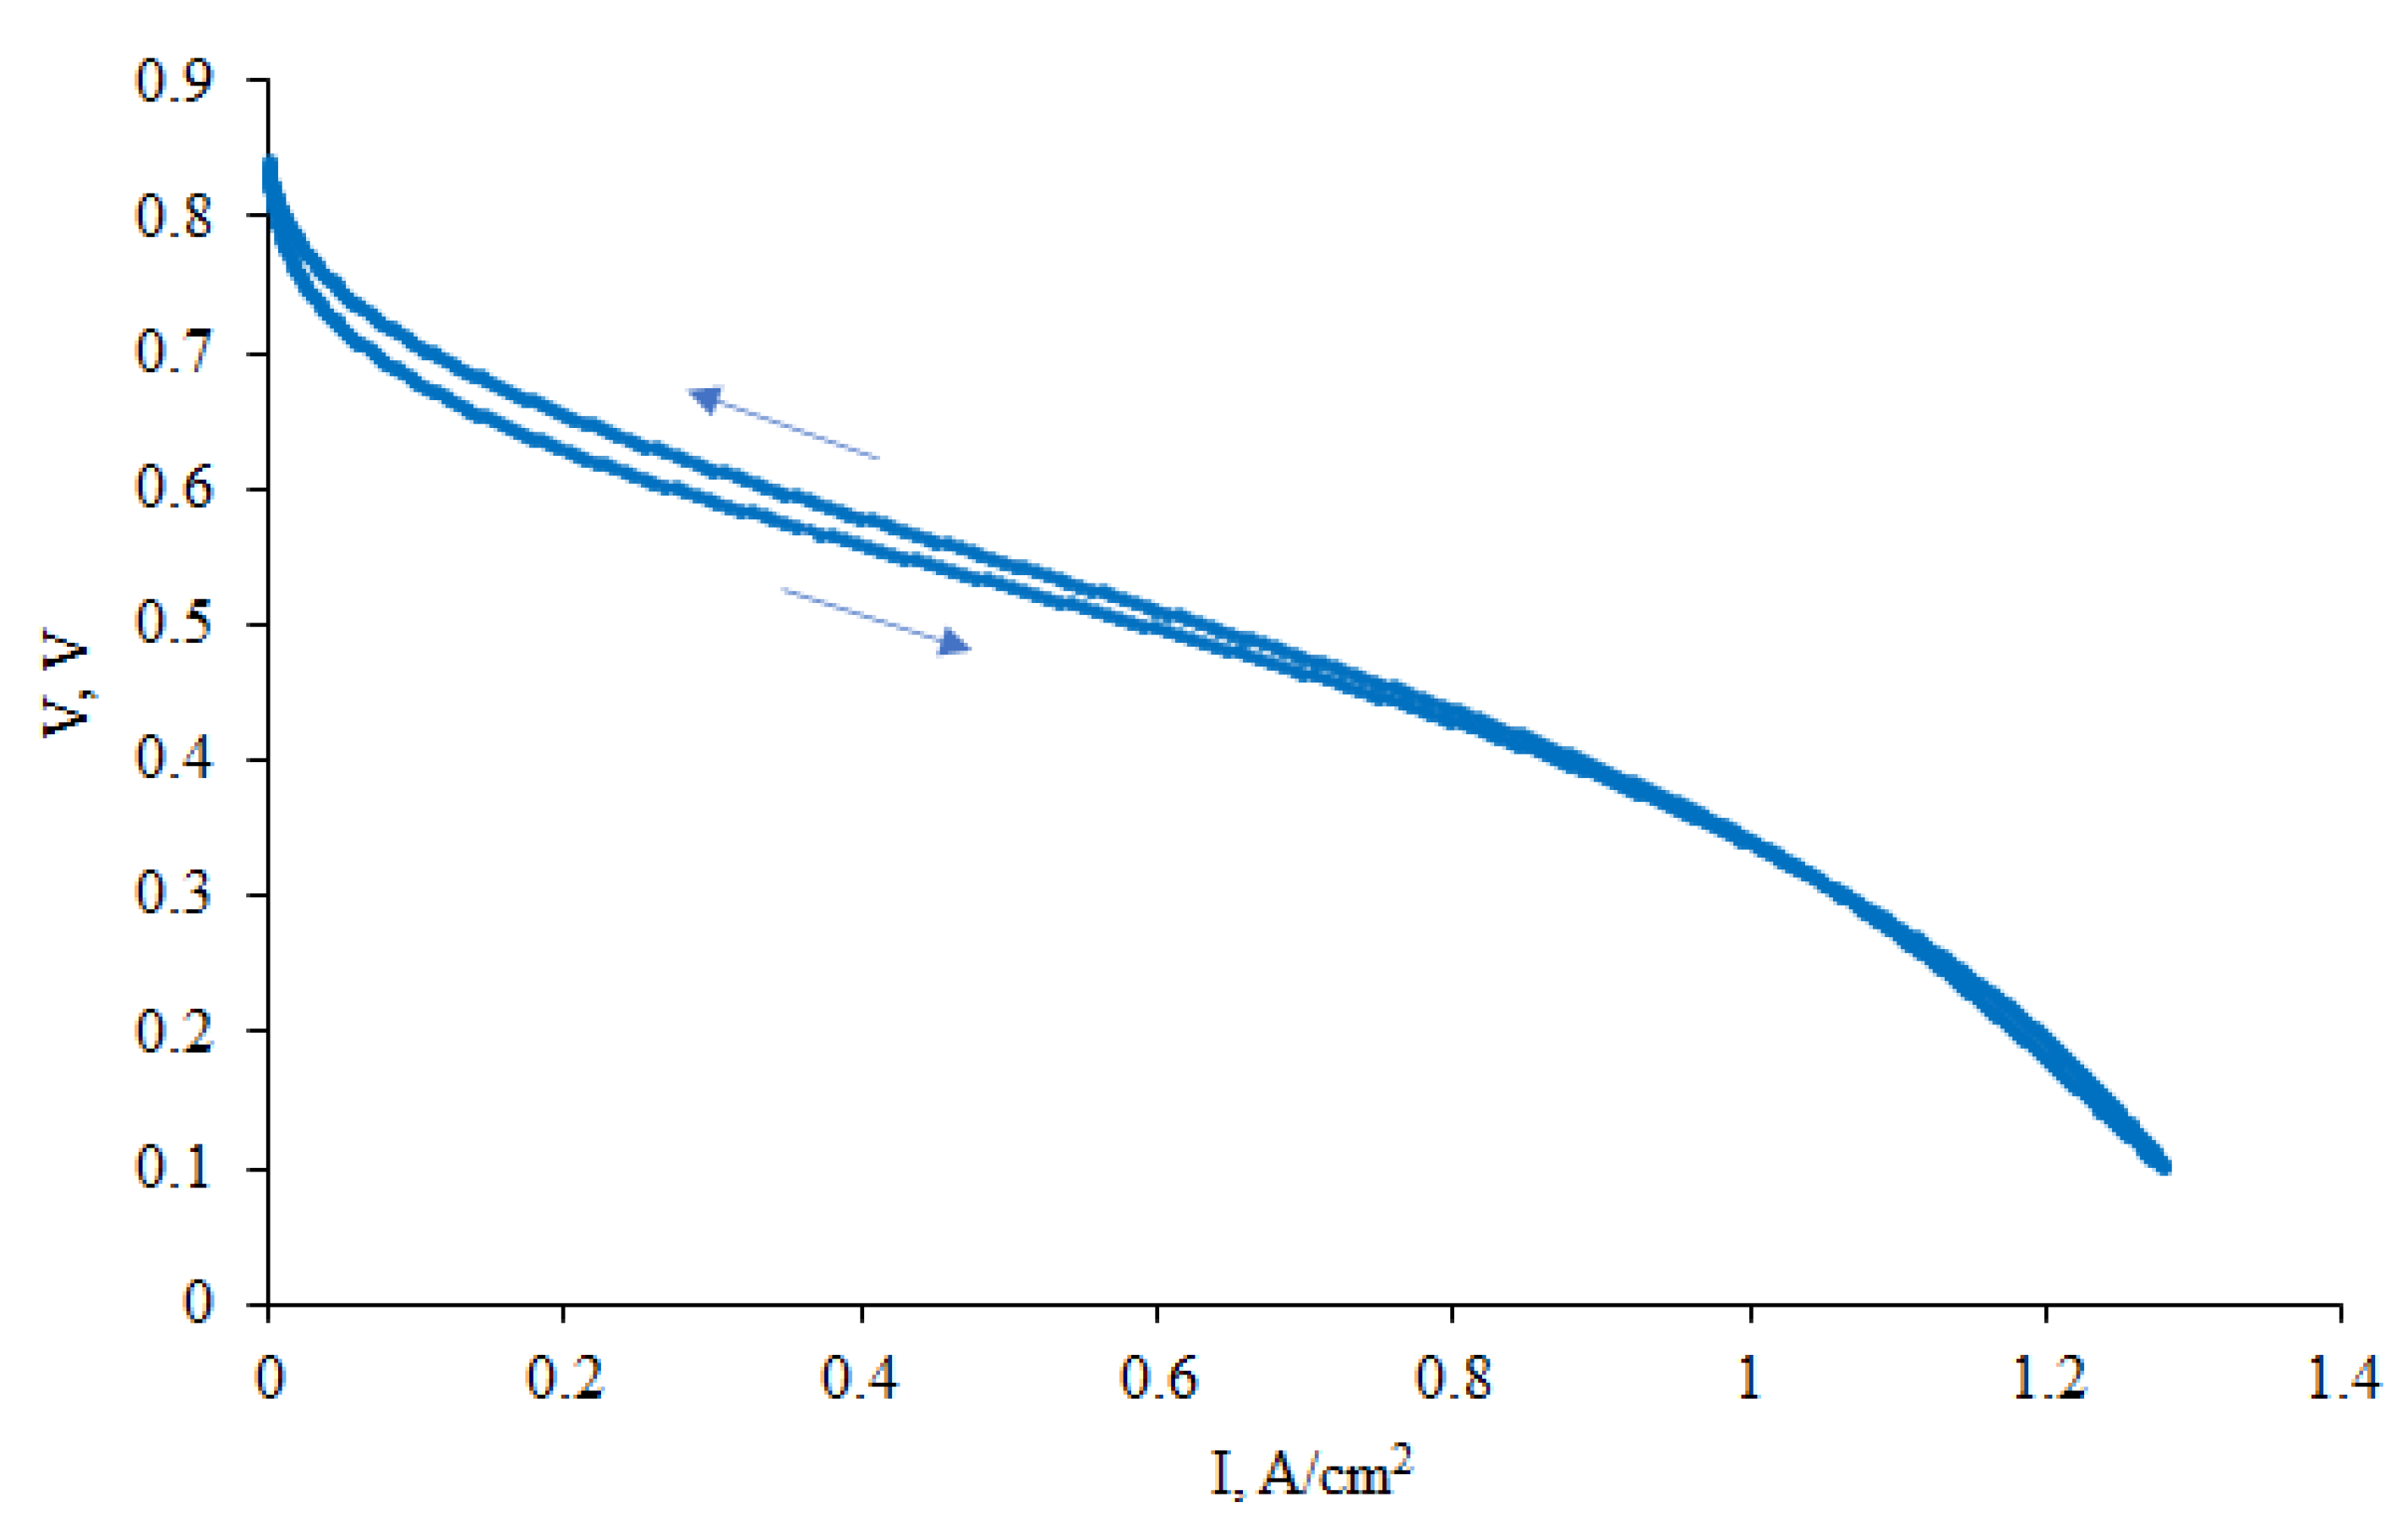
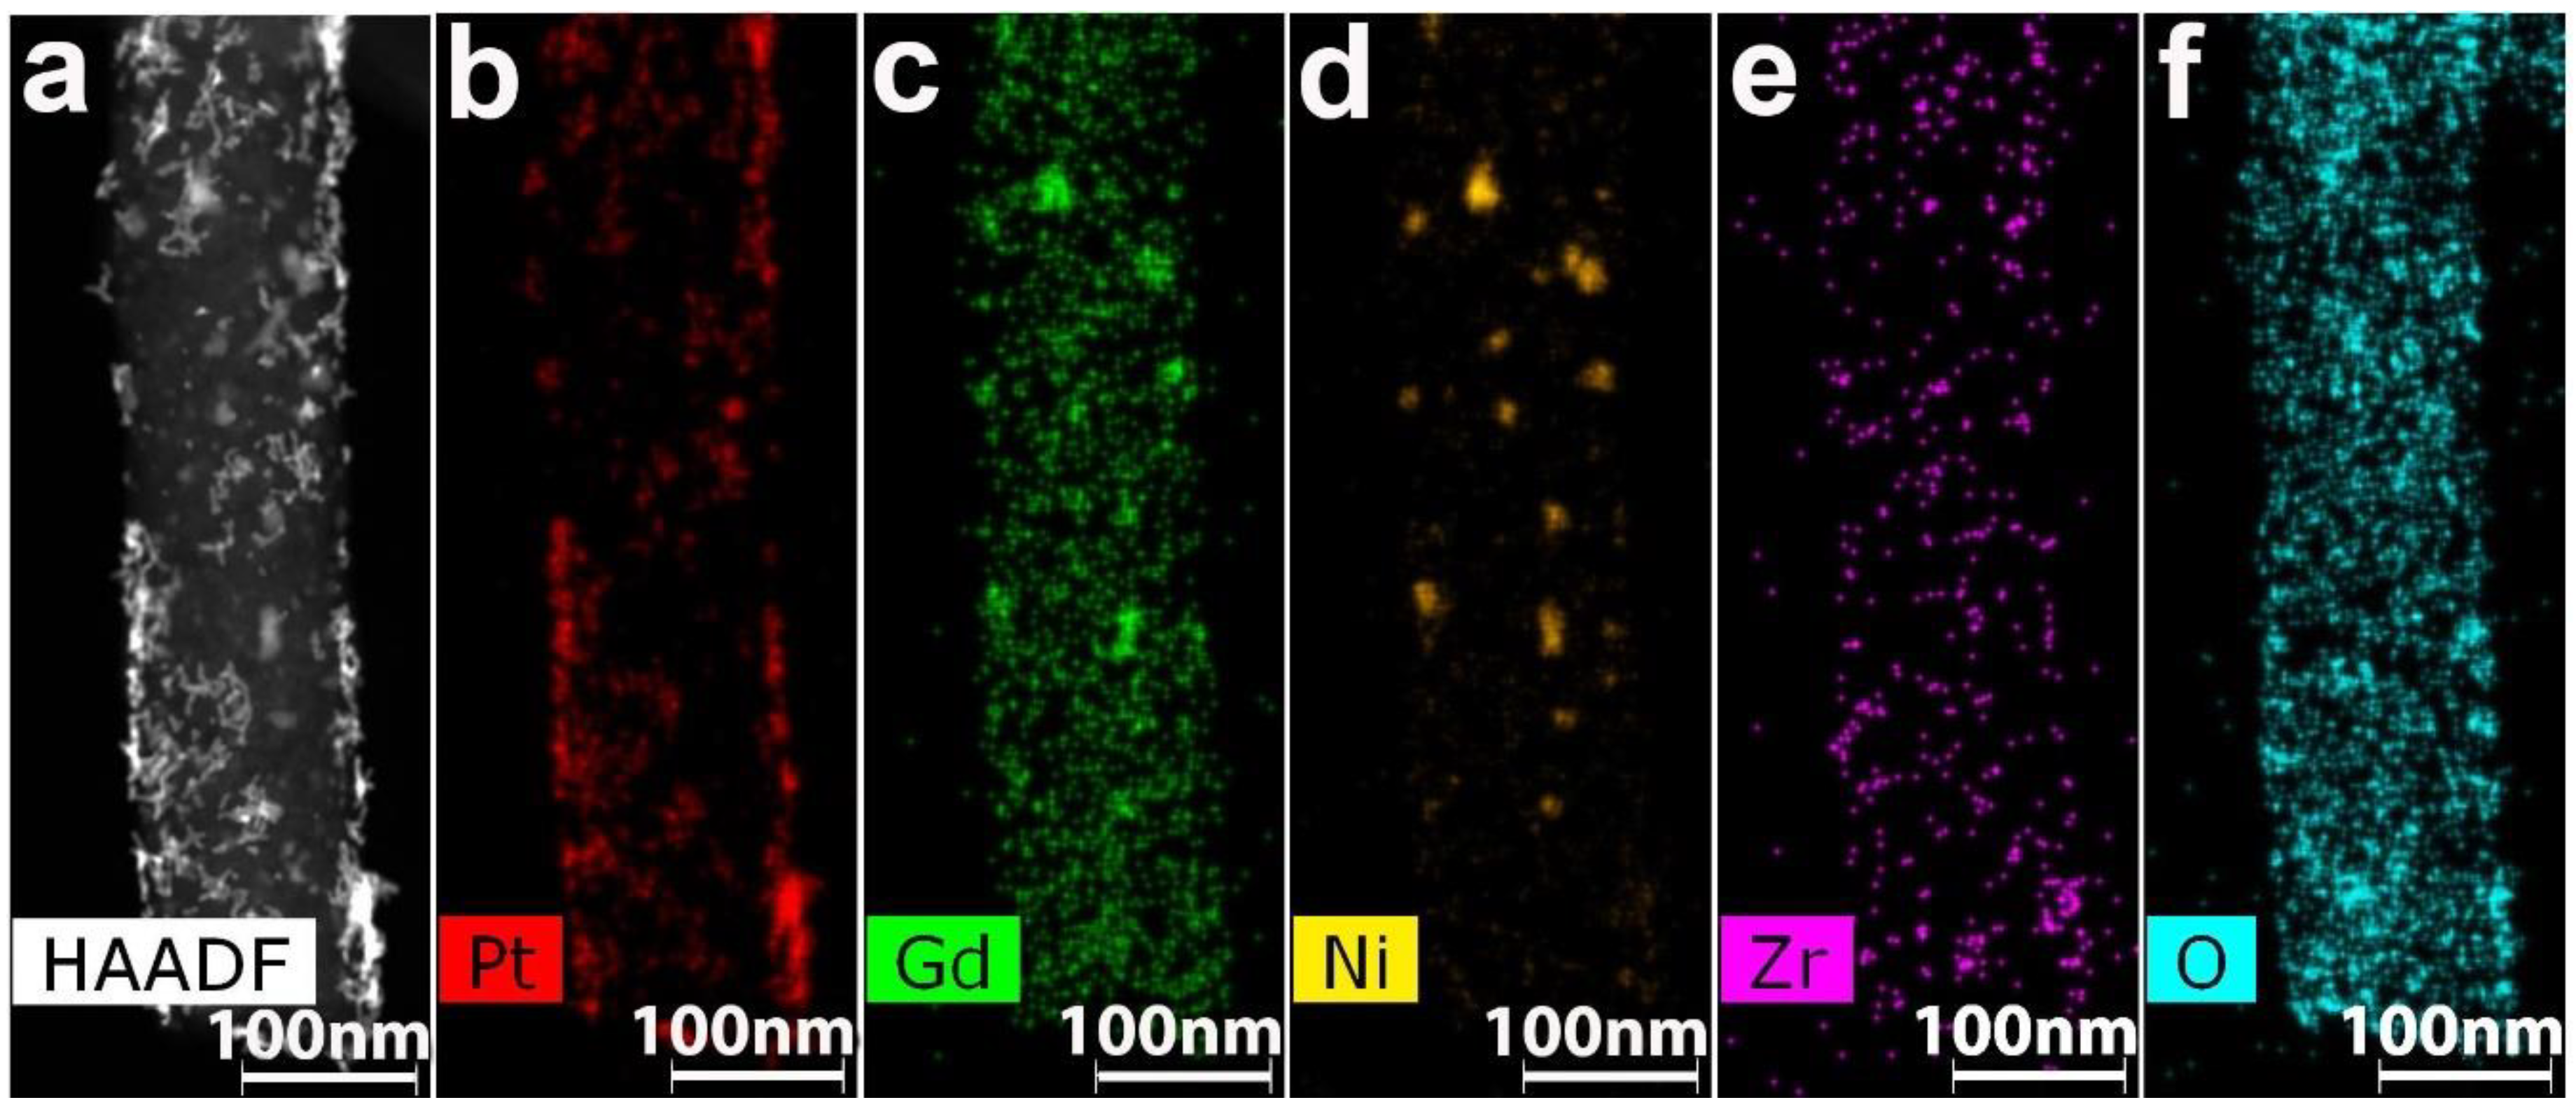
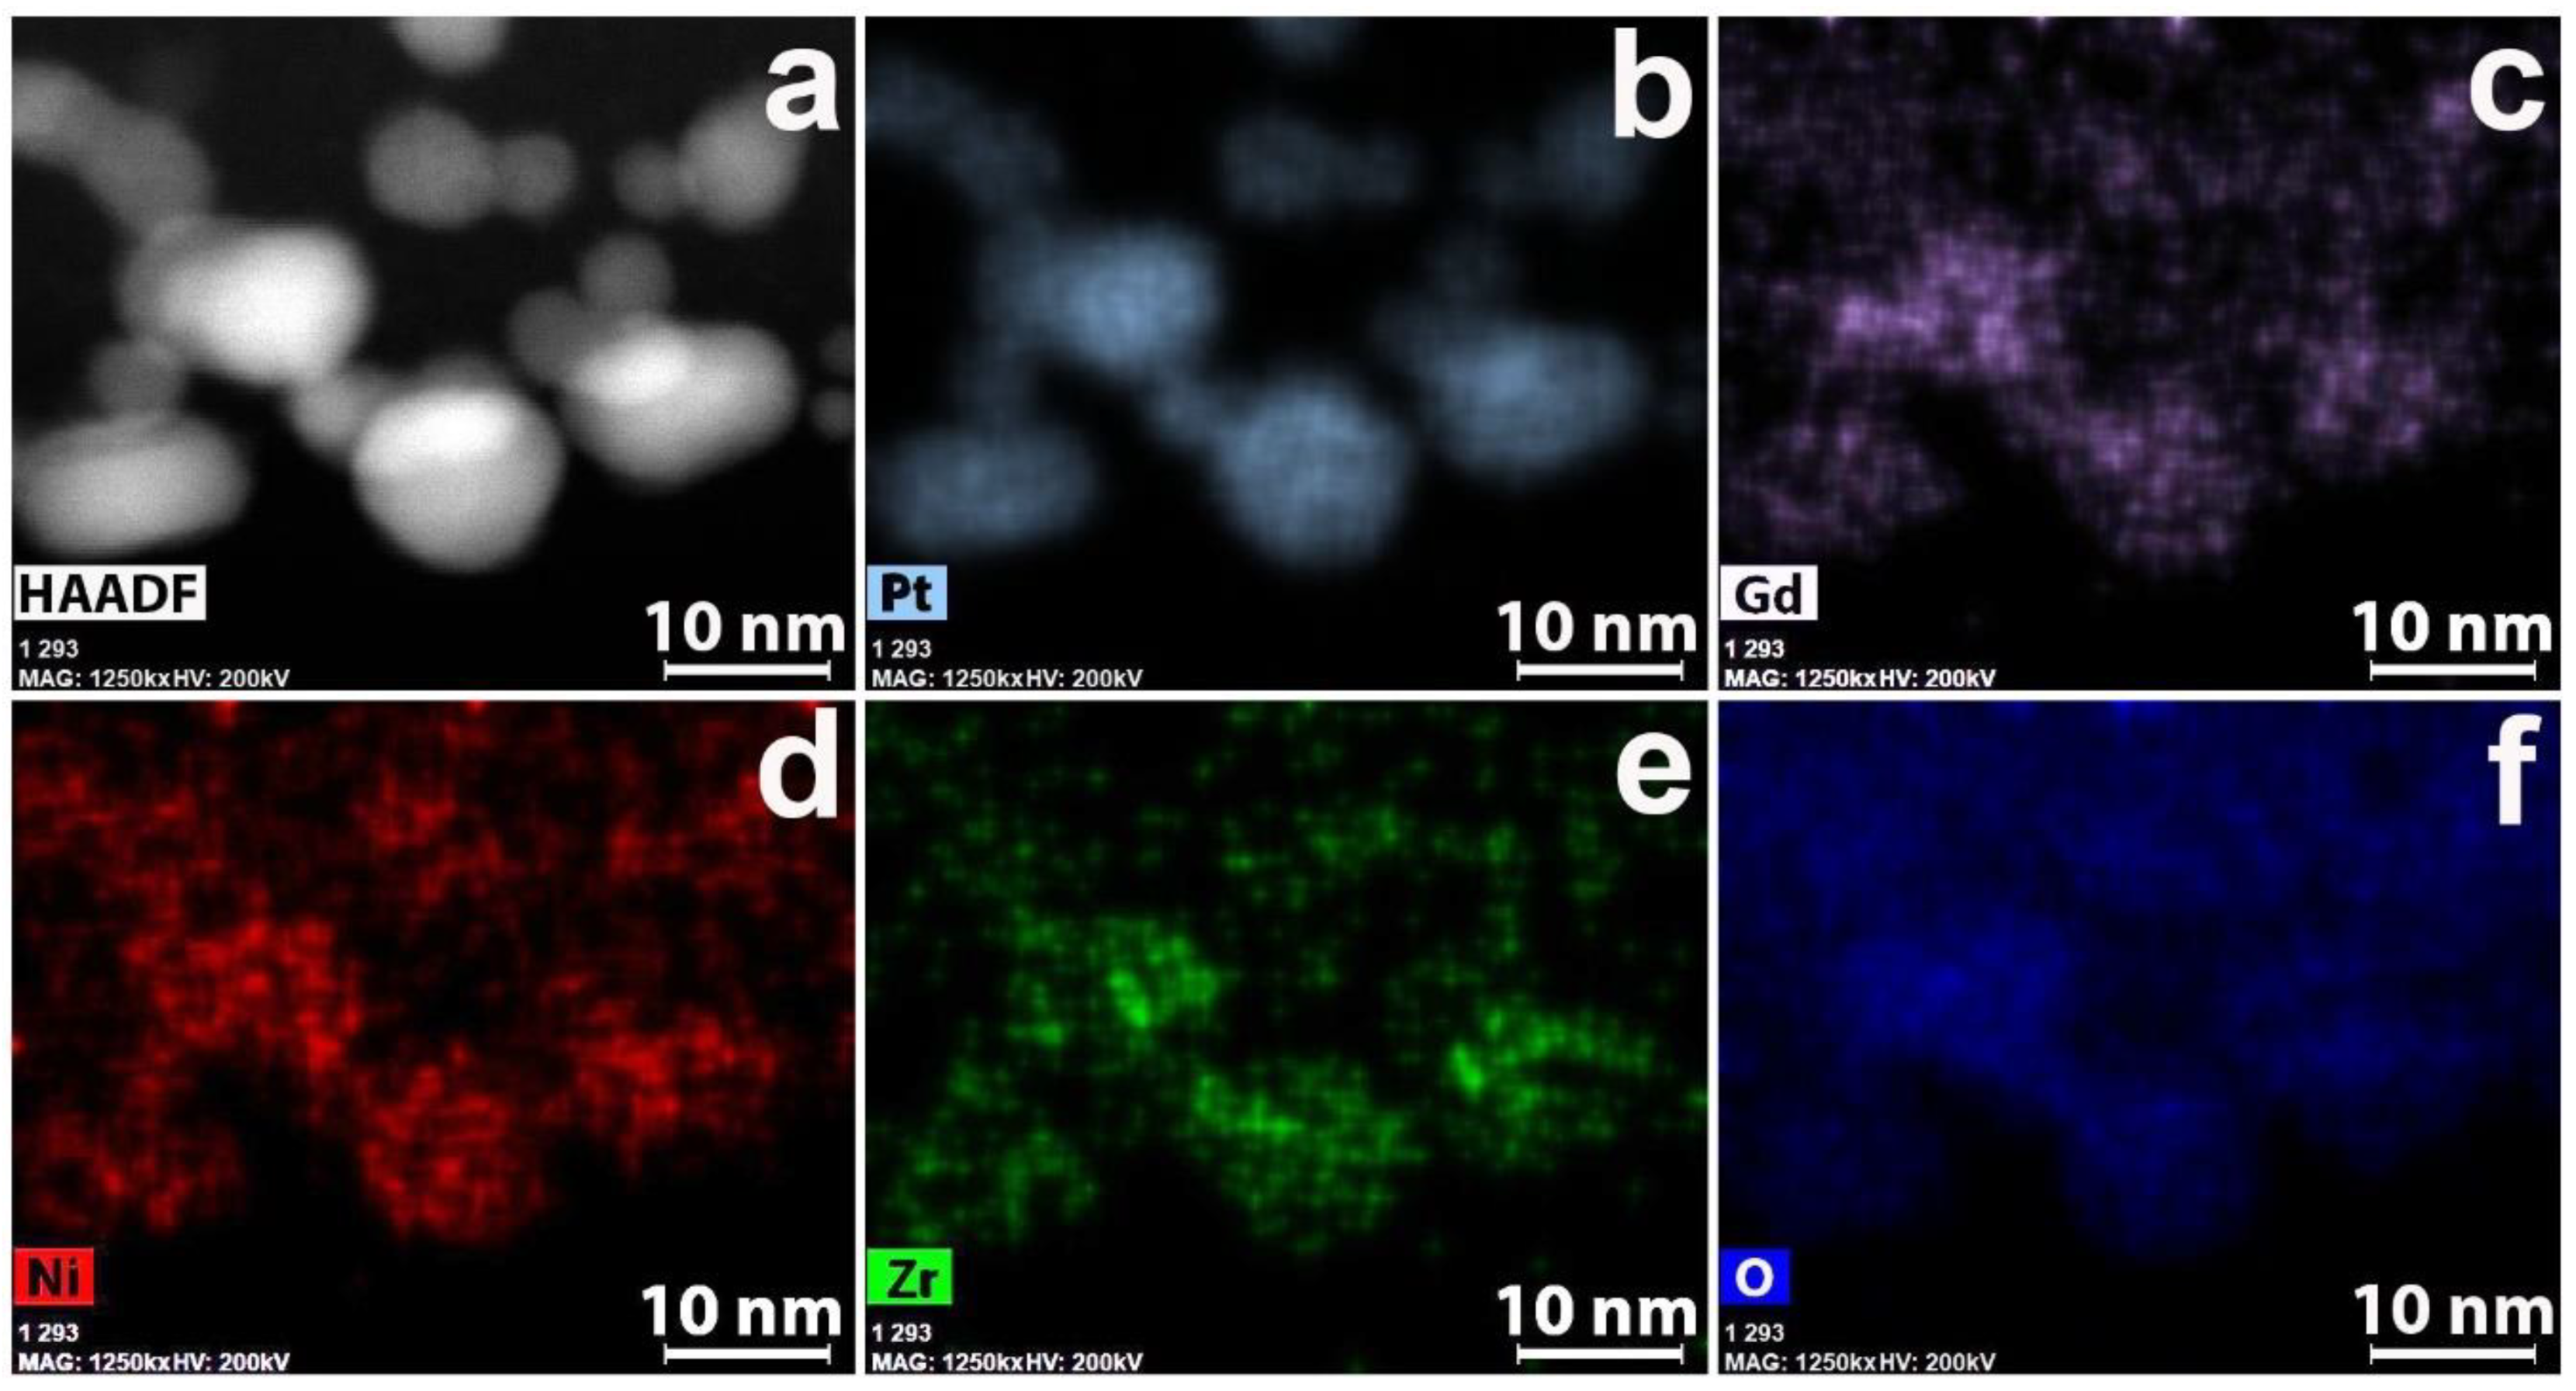
3.2. CNF/Zr/Ni/Gd
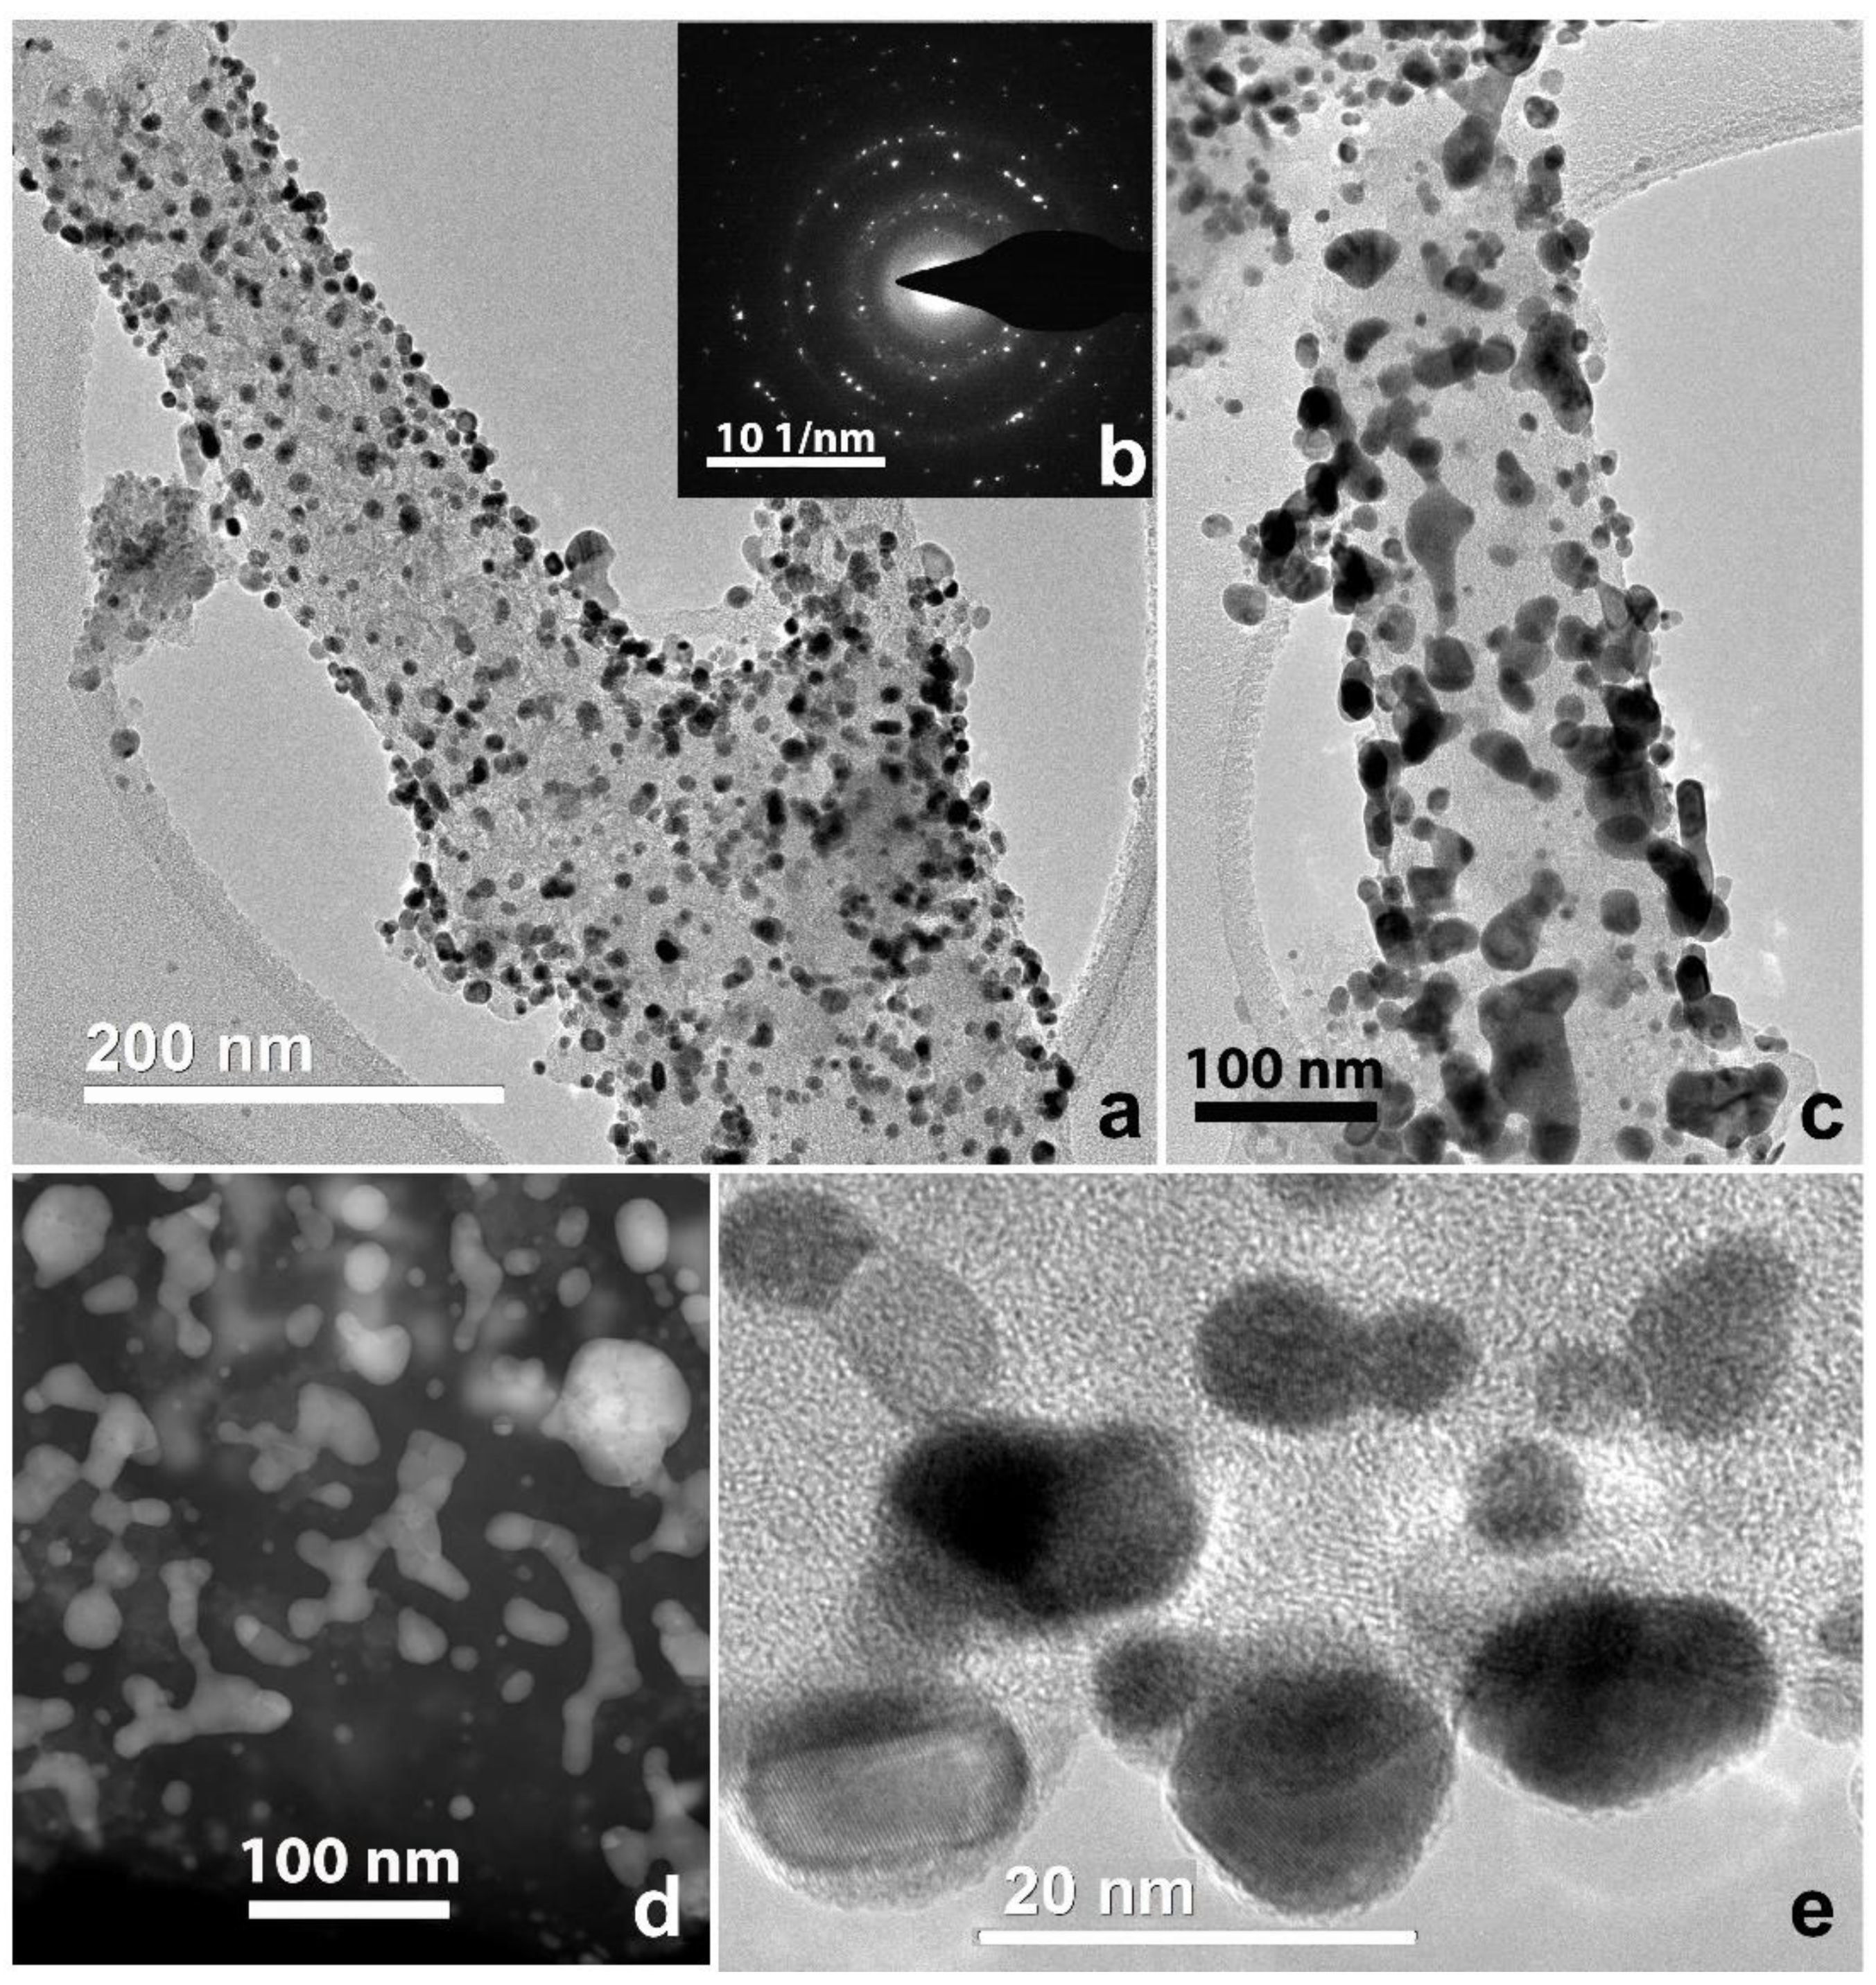
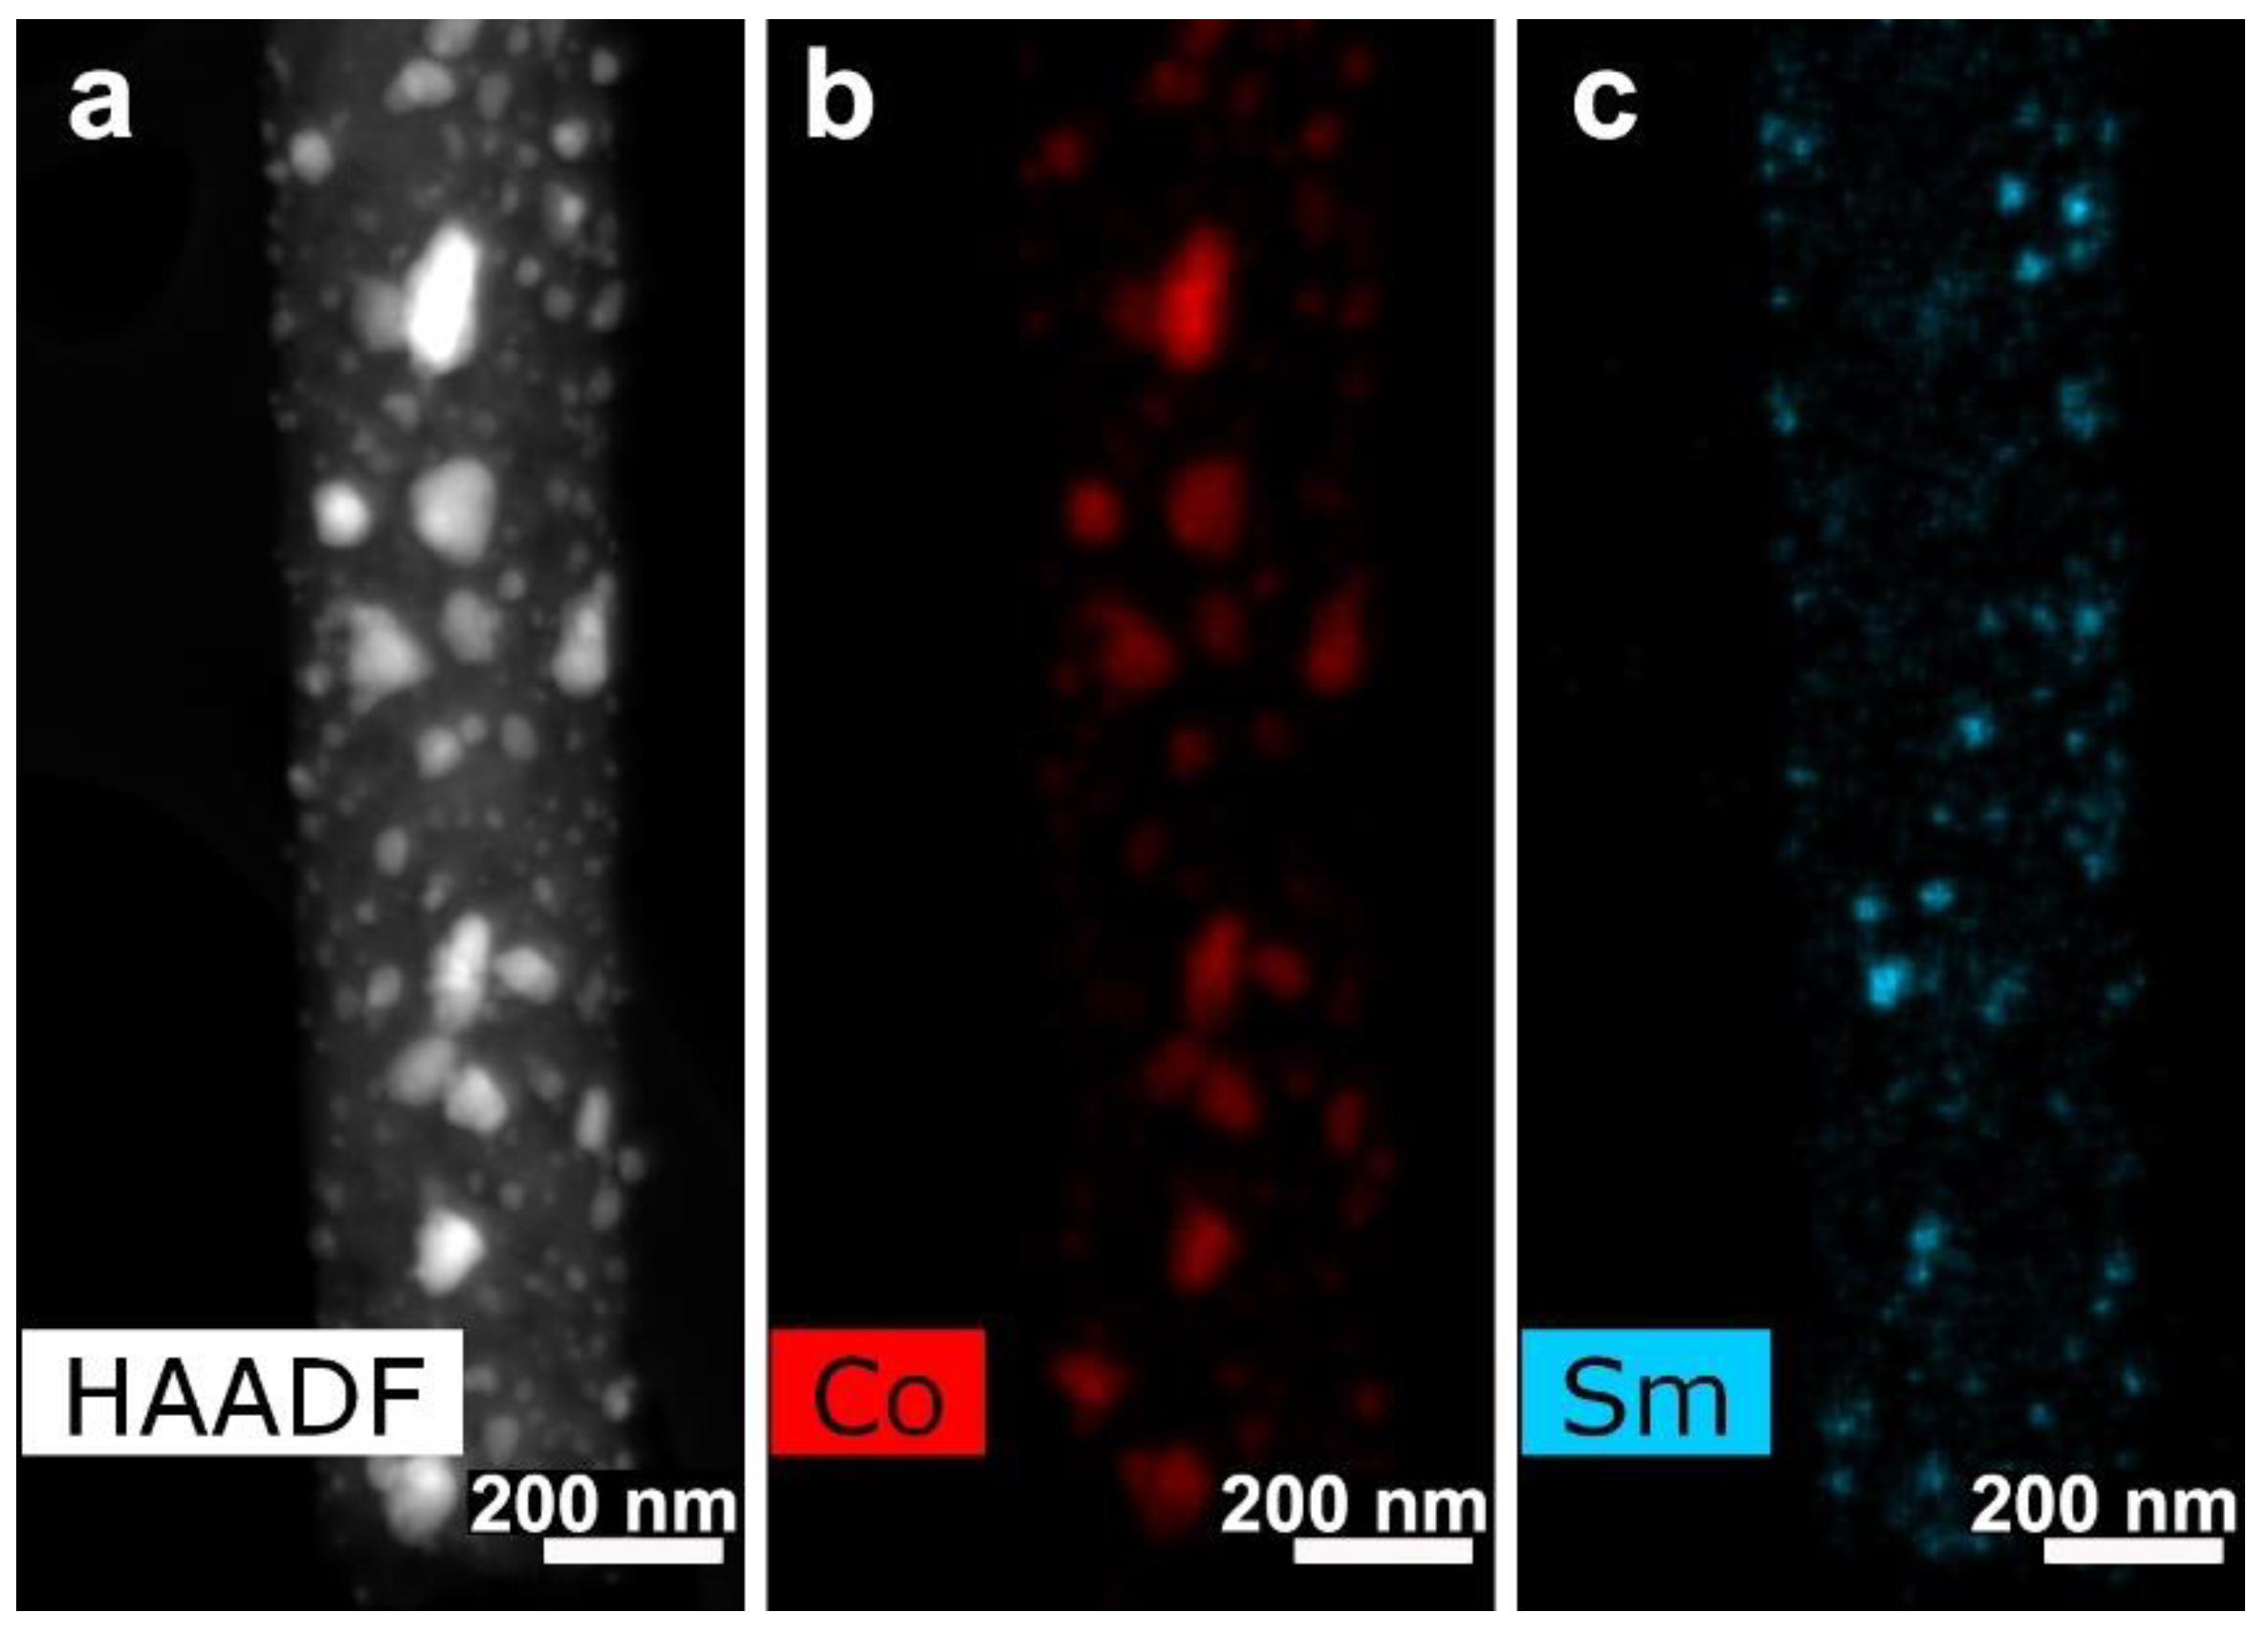
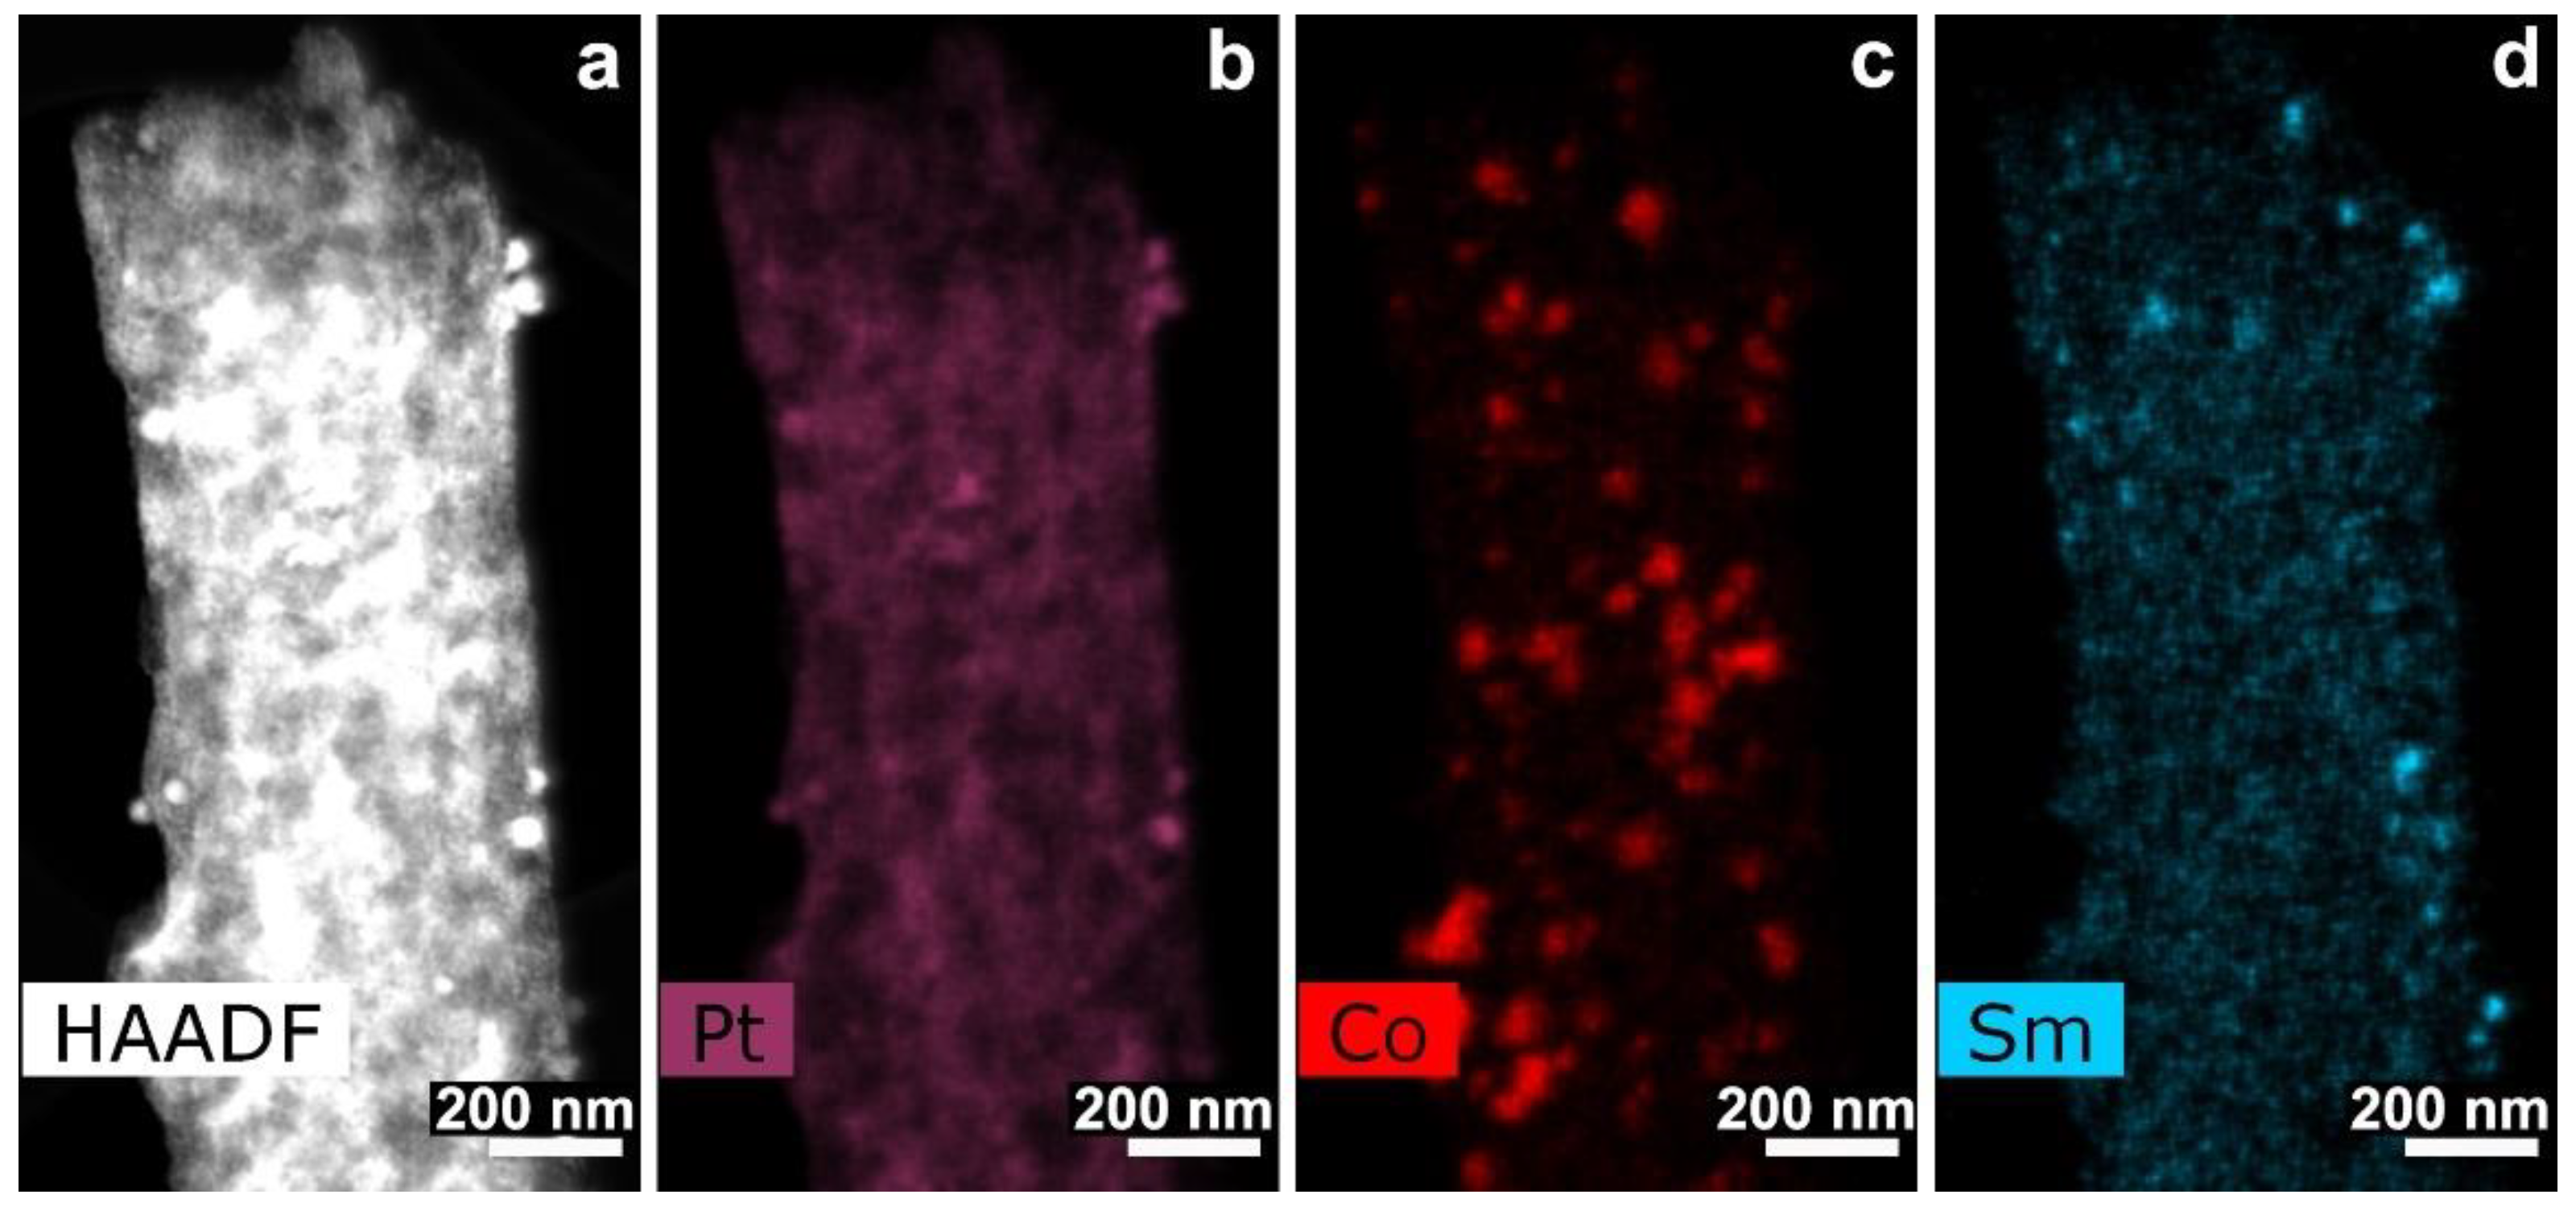
3.3. CNF/Co/Sm
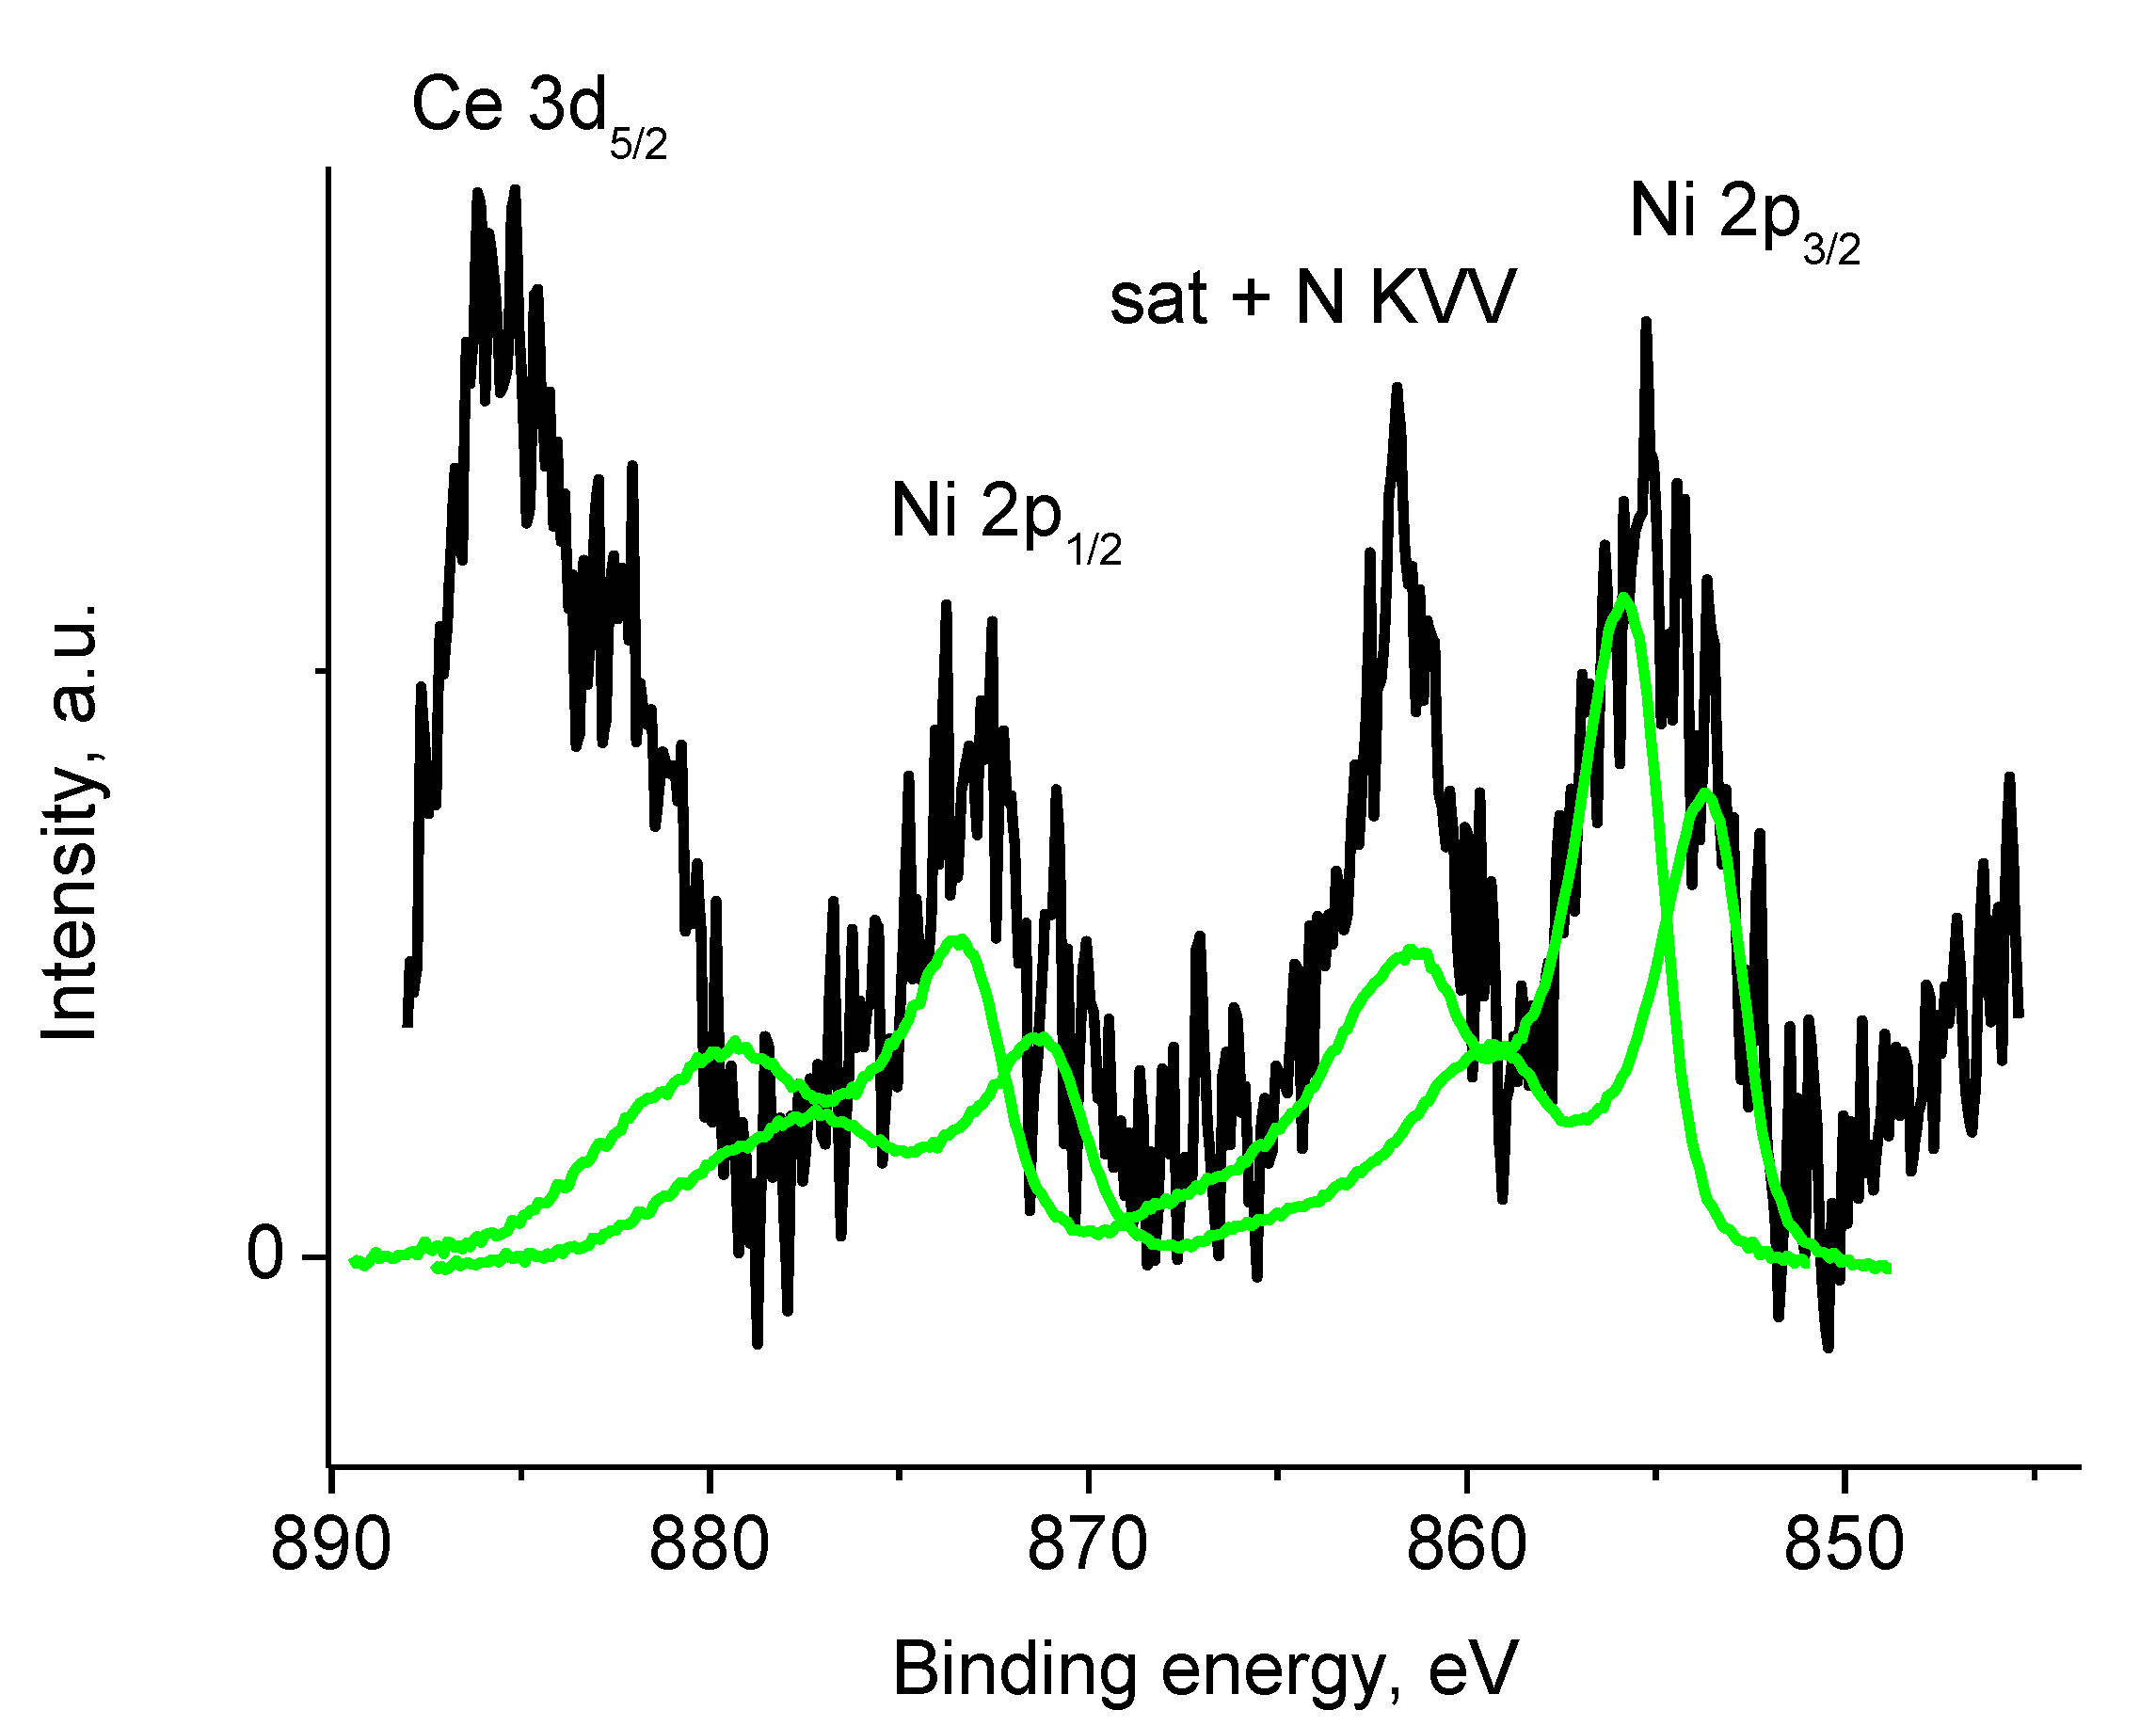
3.4. CNF/Zr/Ni/Ce
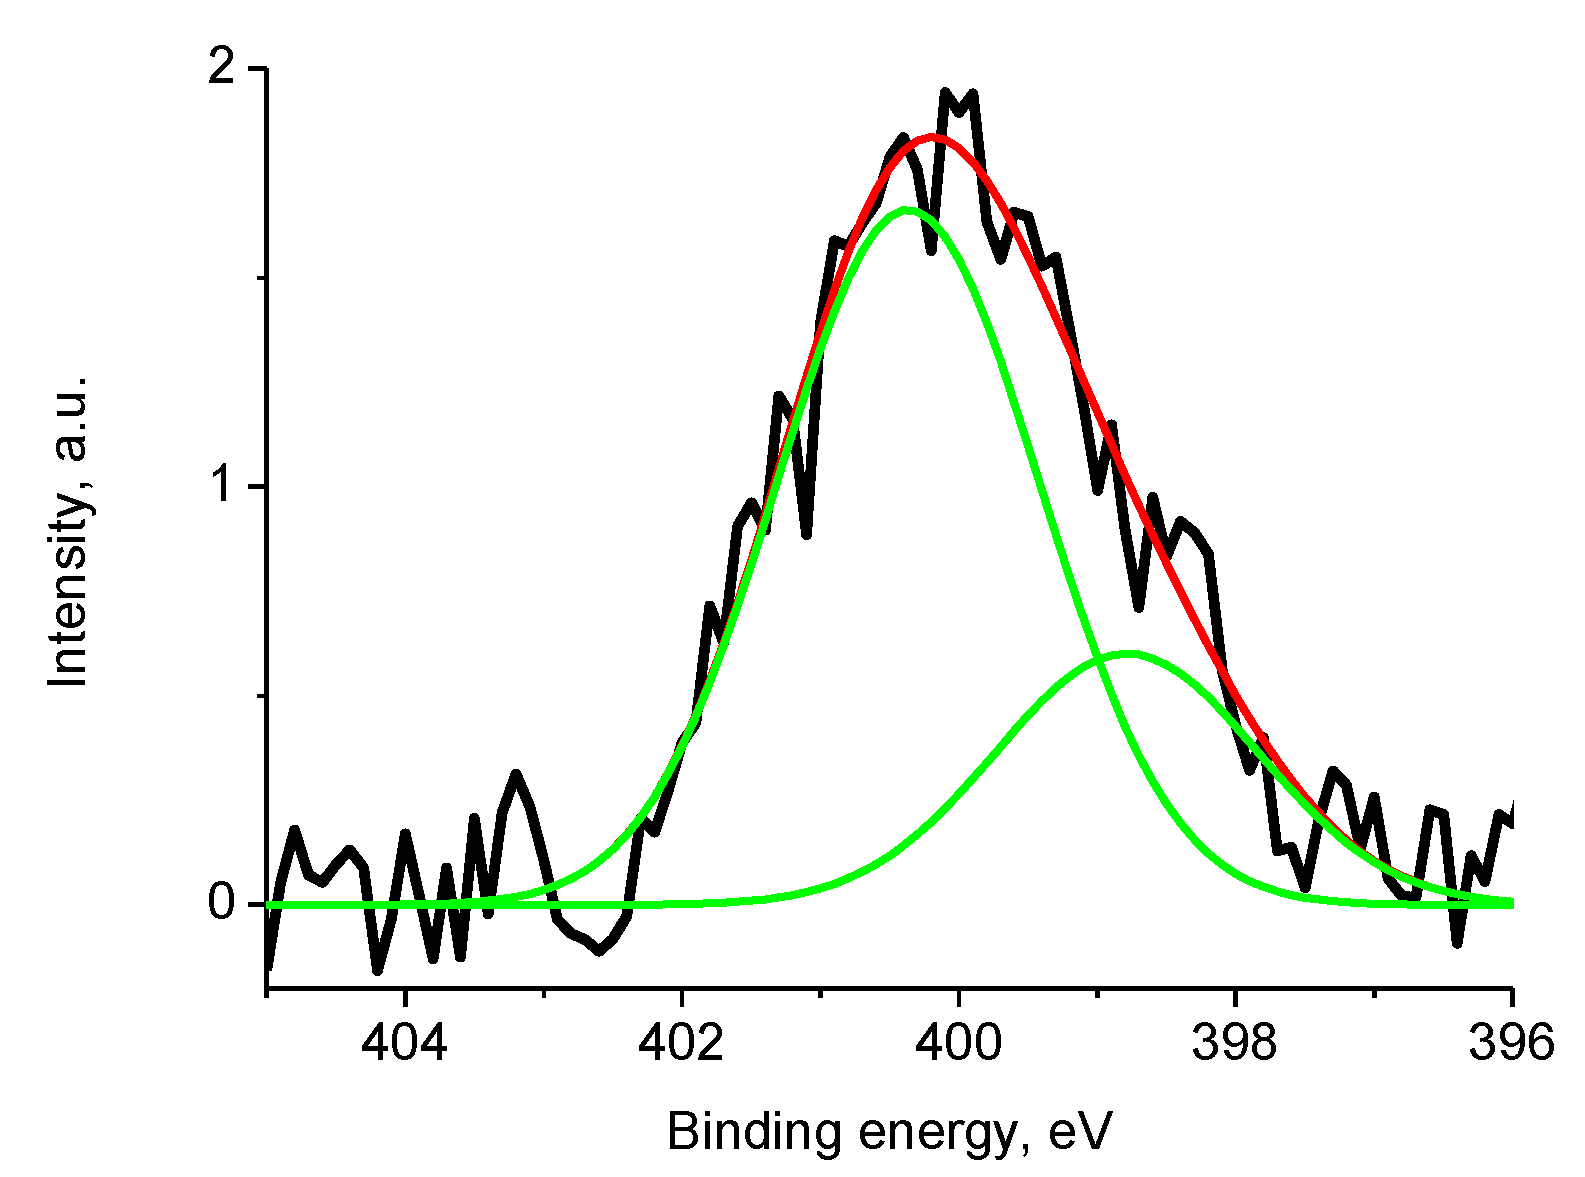
3.5. XPS Studies
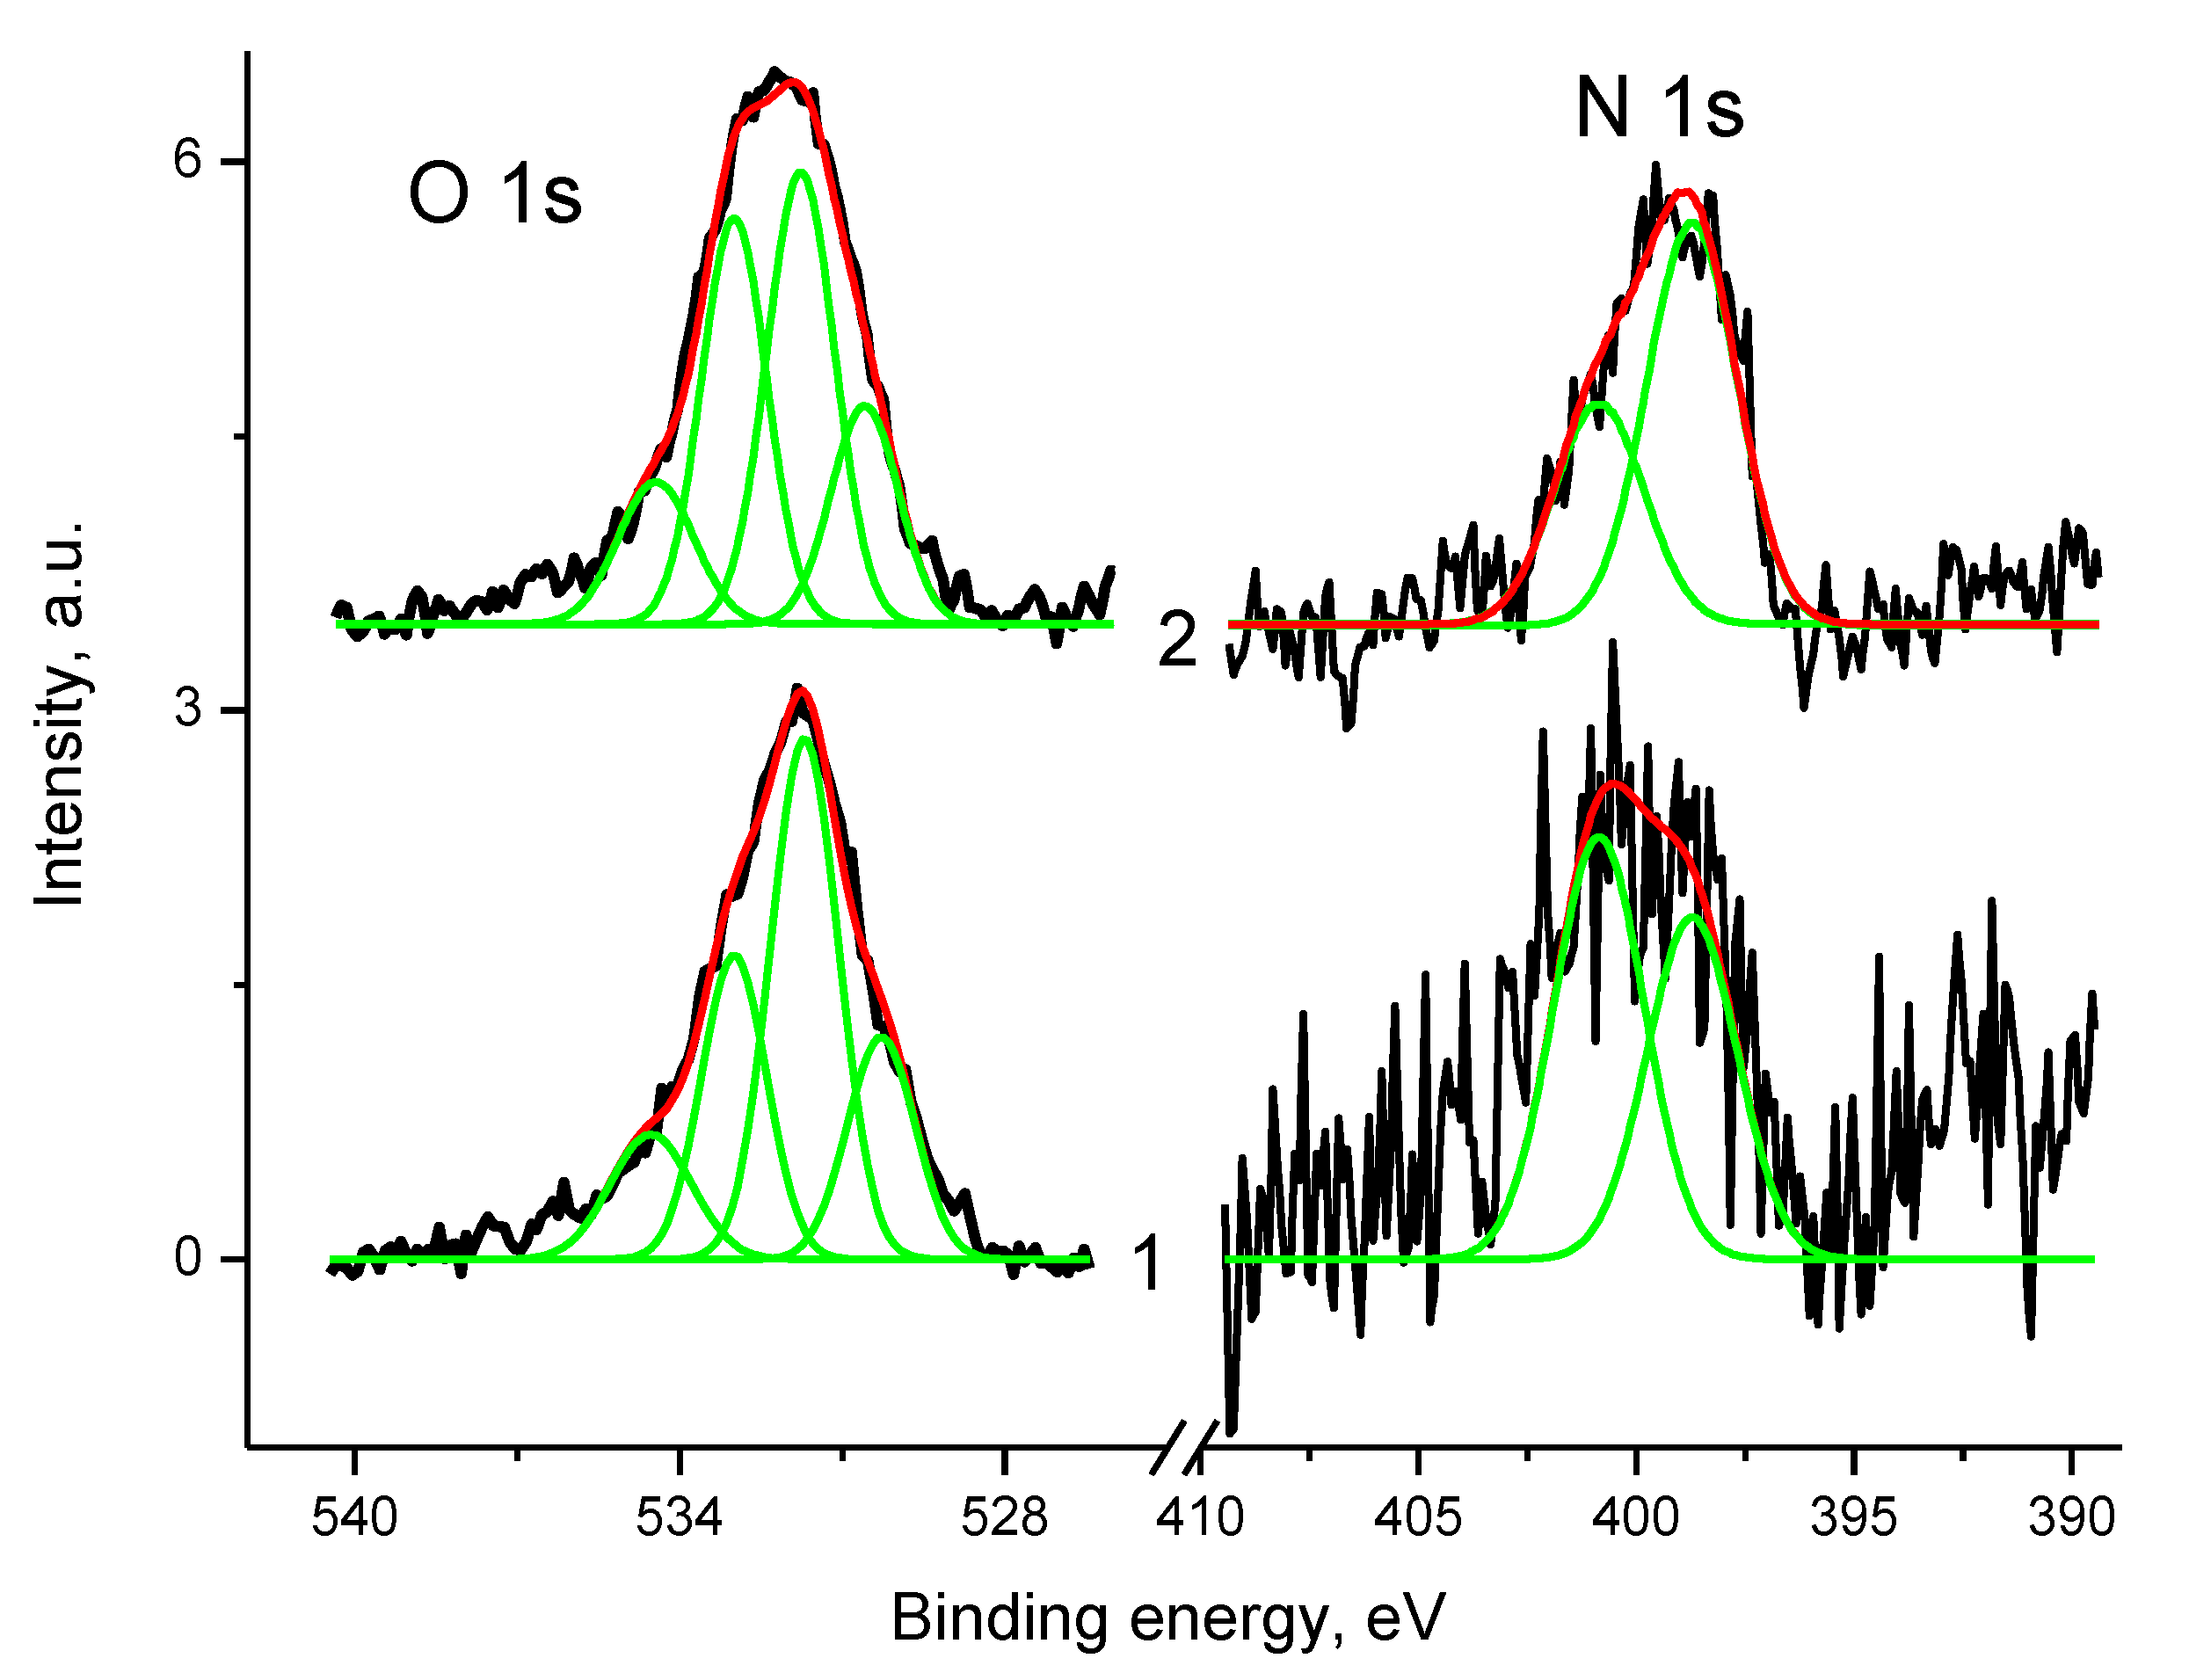
3.5.1. General
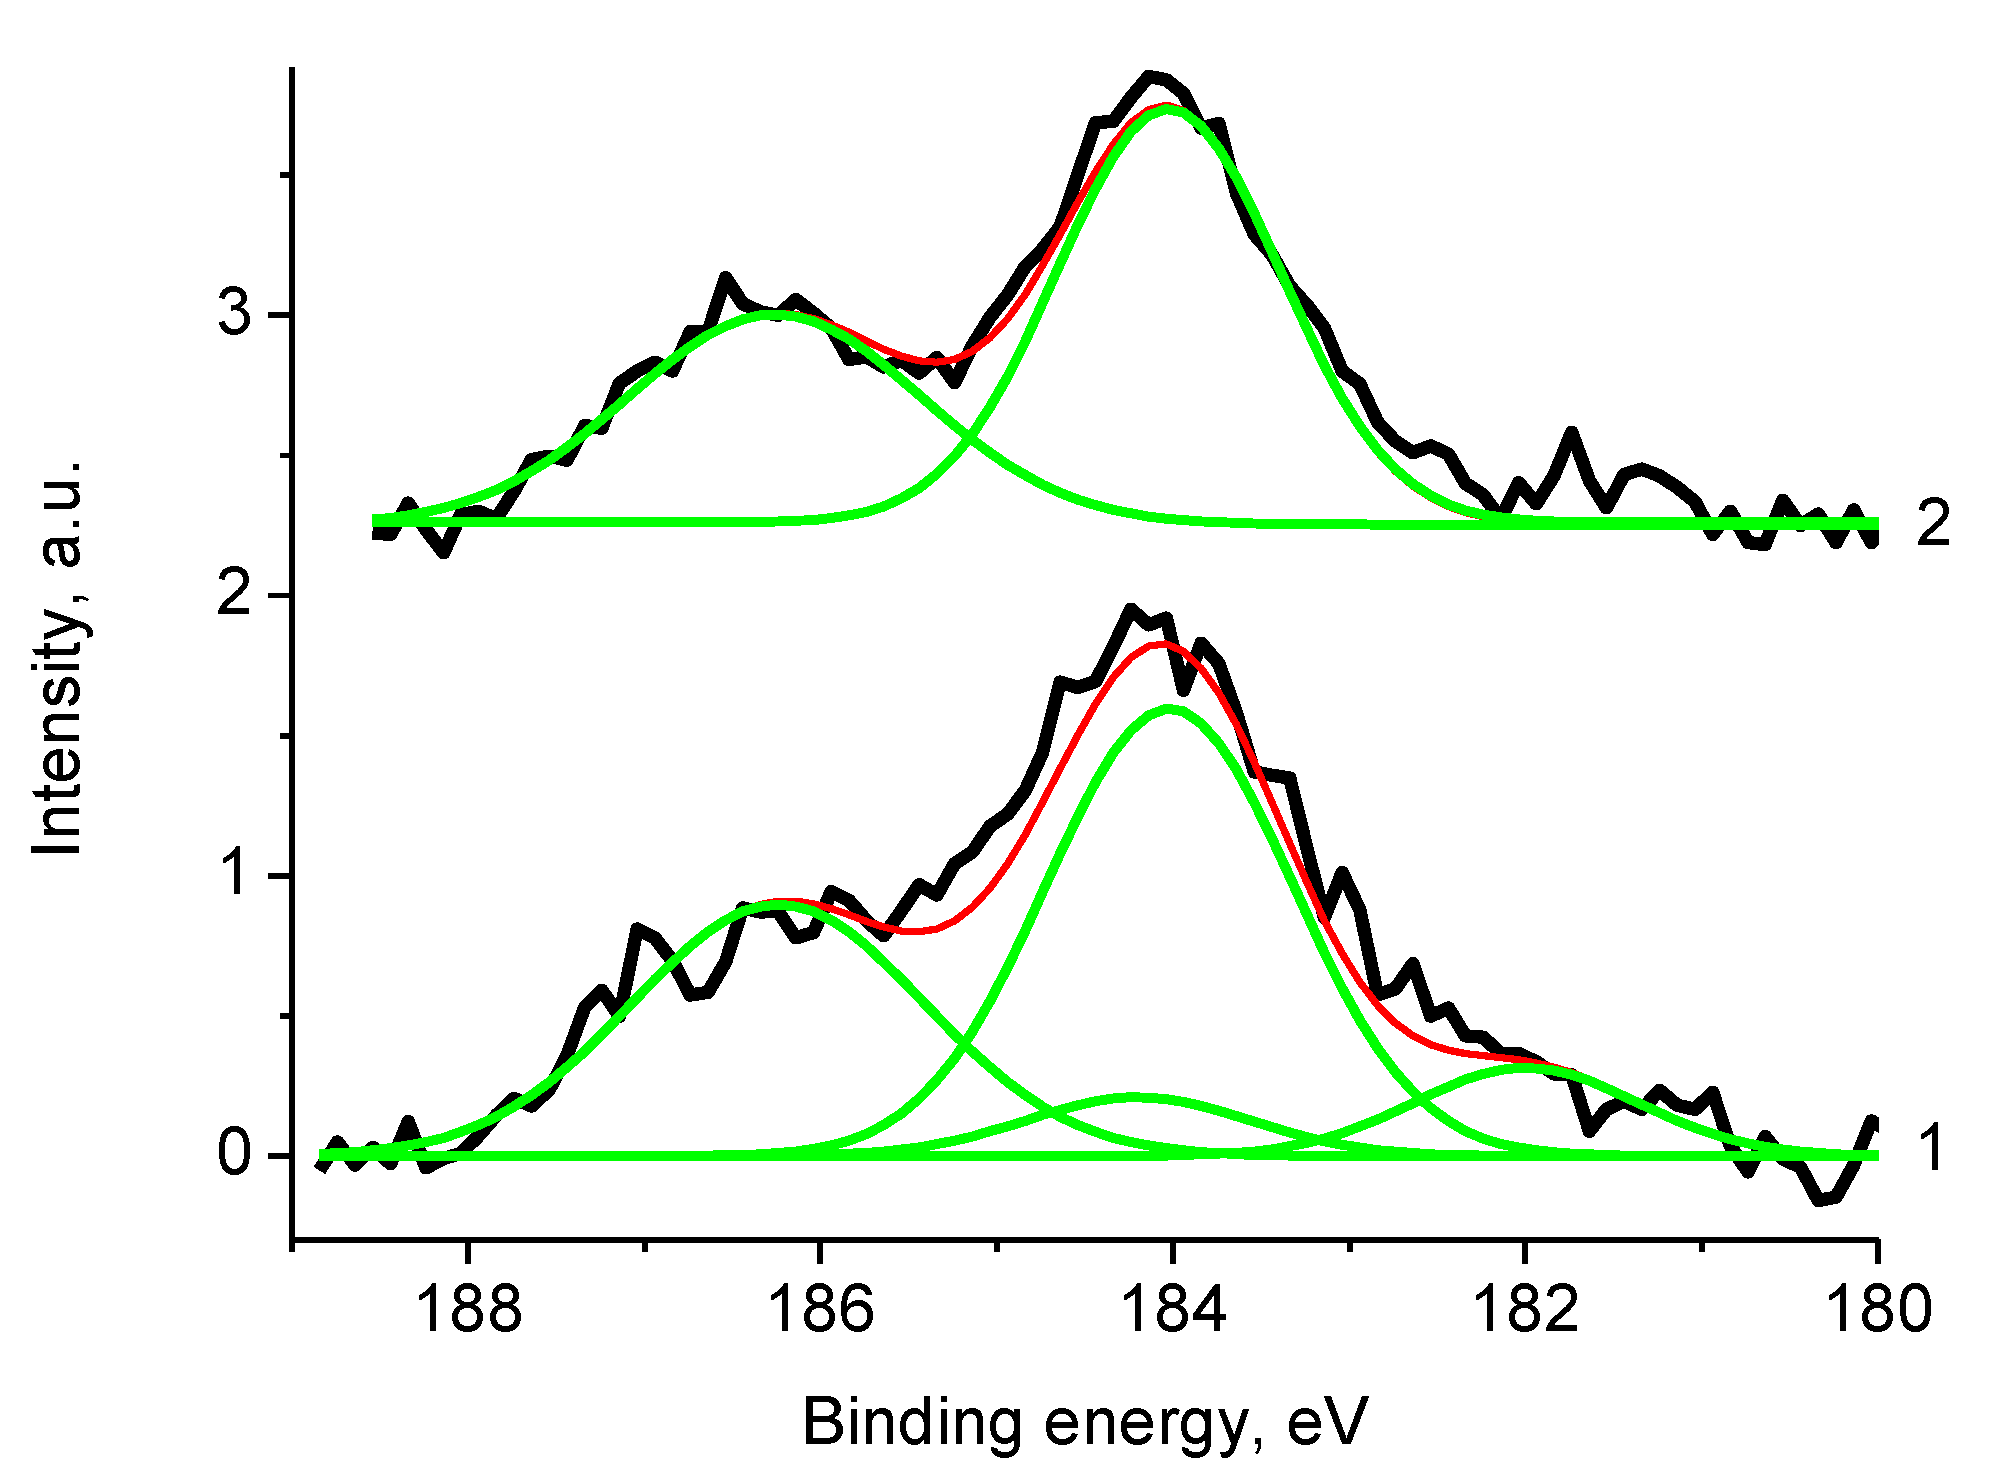
3.5.2. Samples 3 and Pt/3
3.5.3. Samples 4 and Pt/4
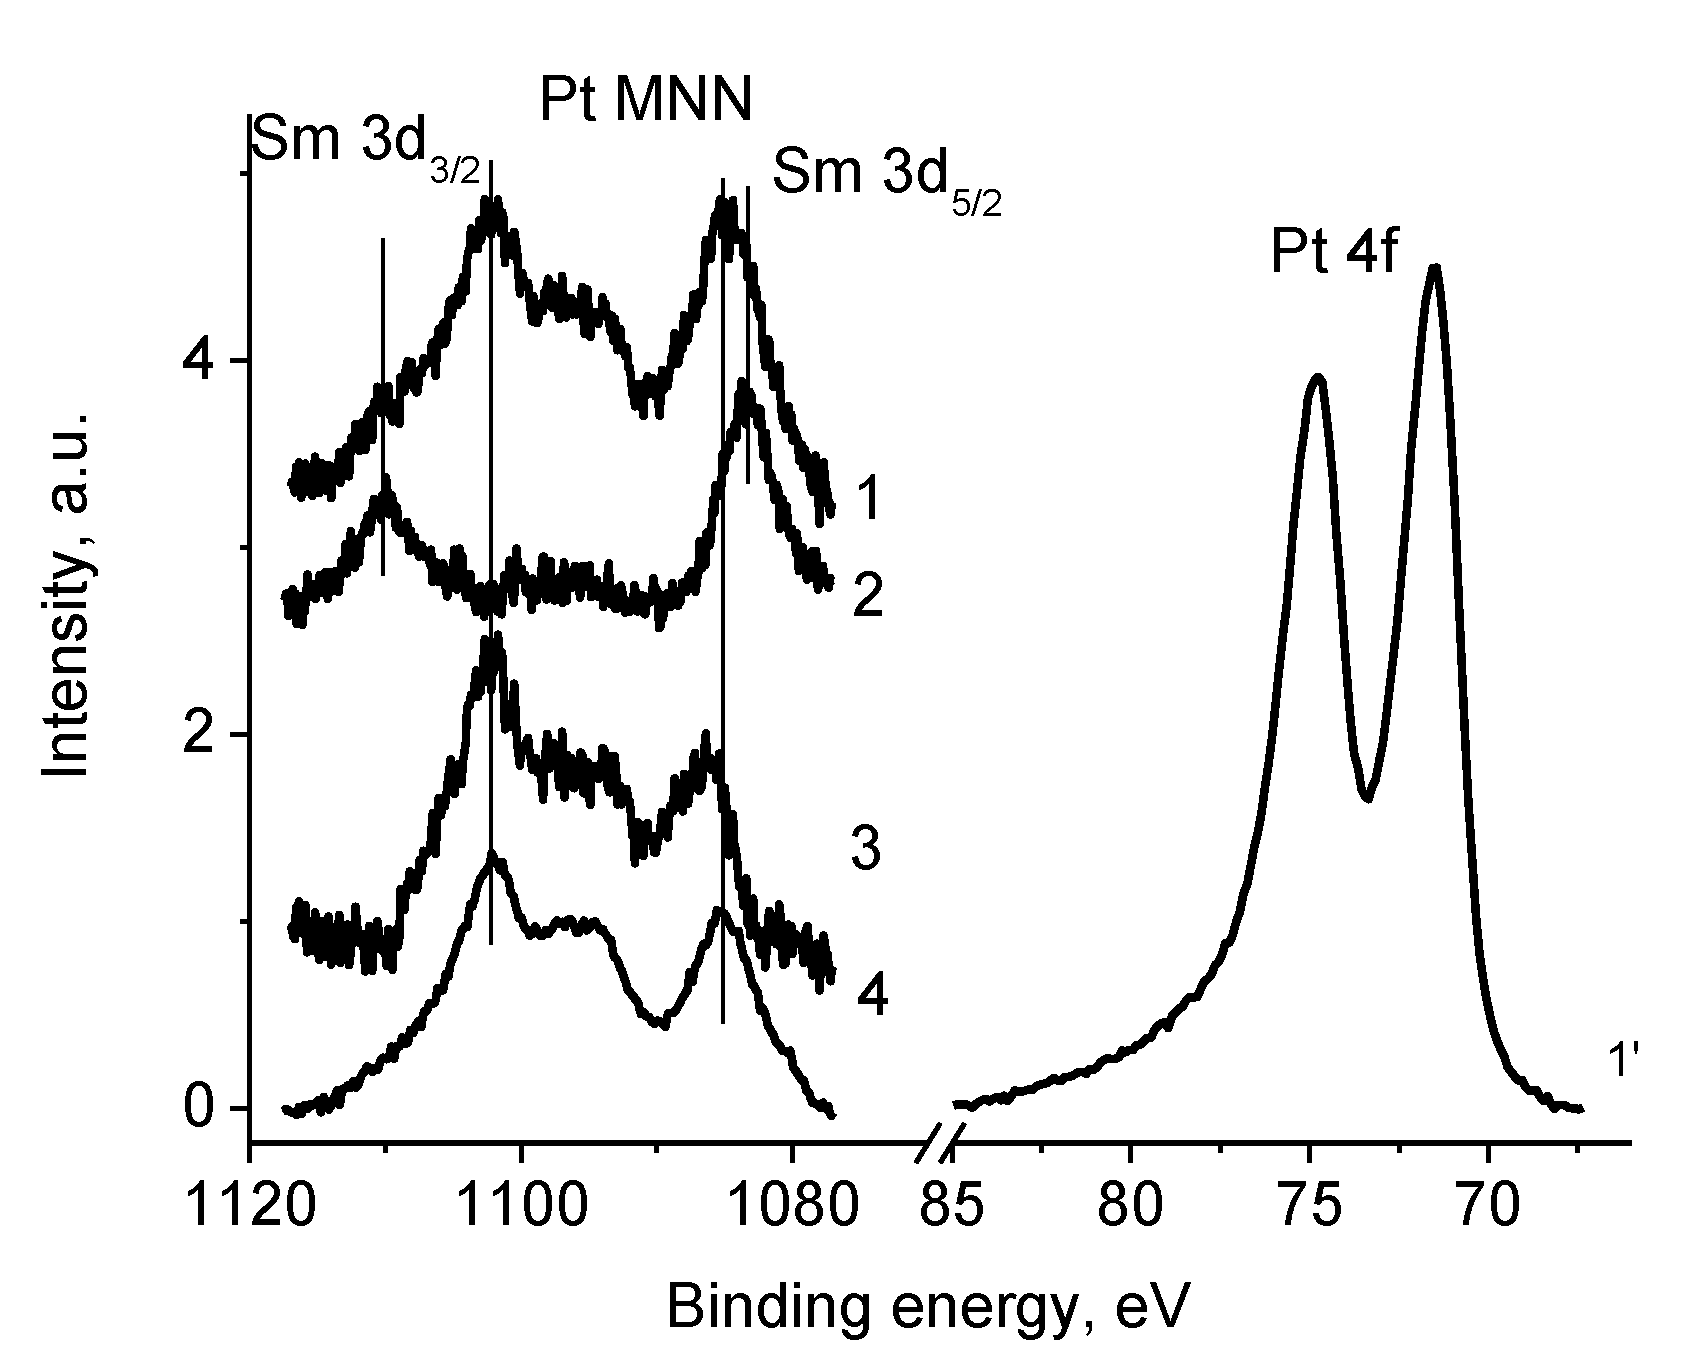
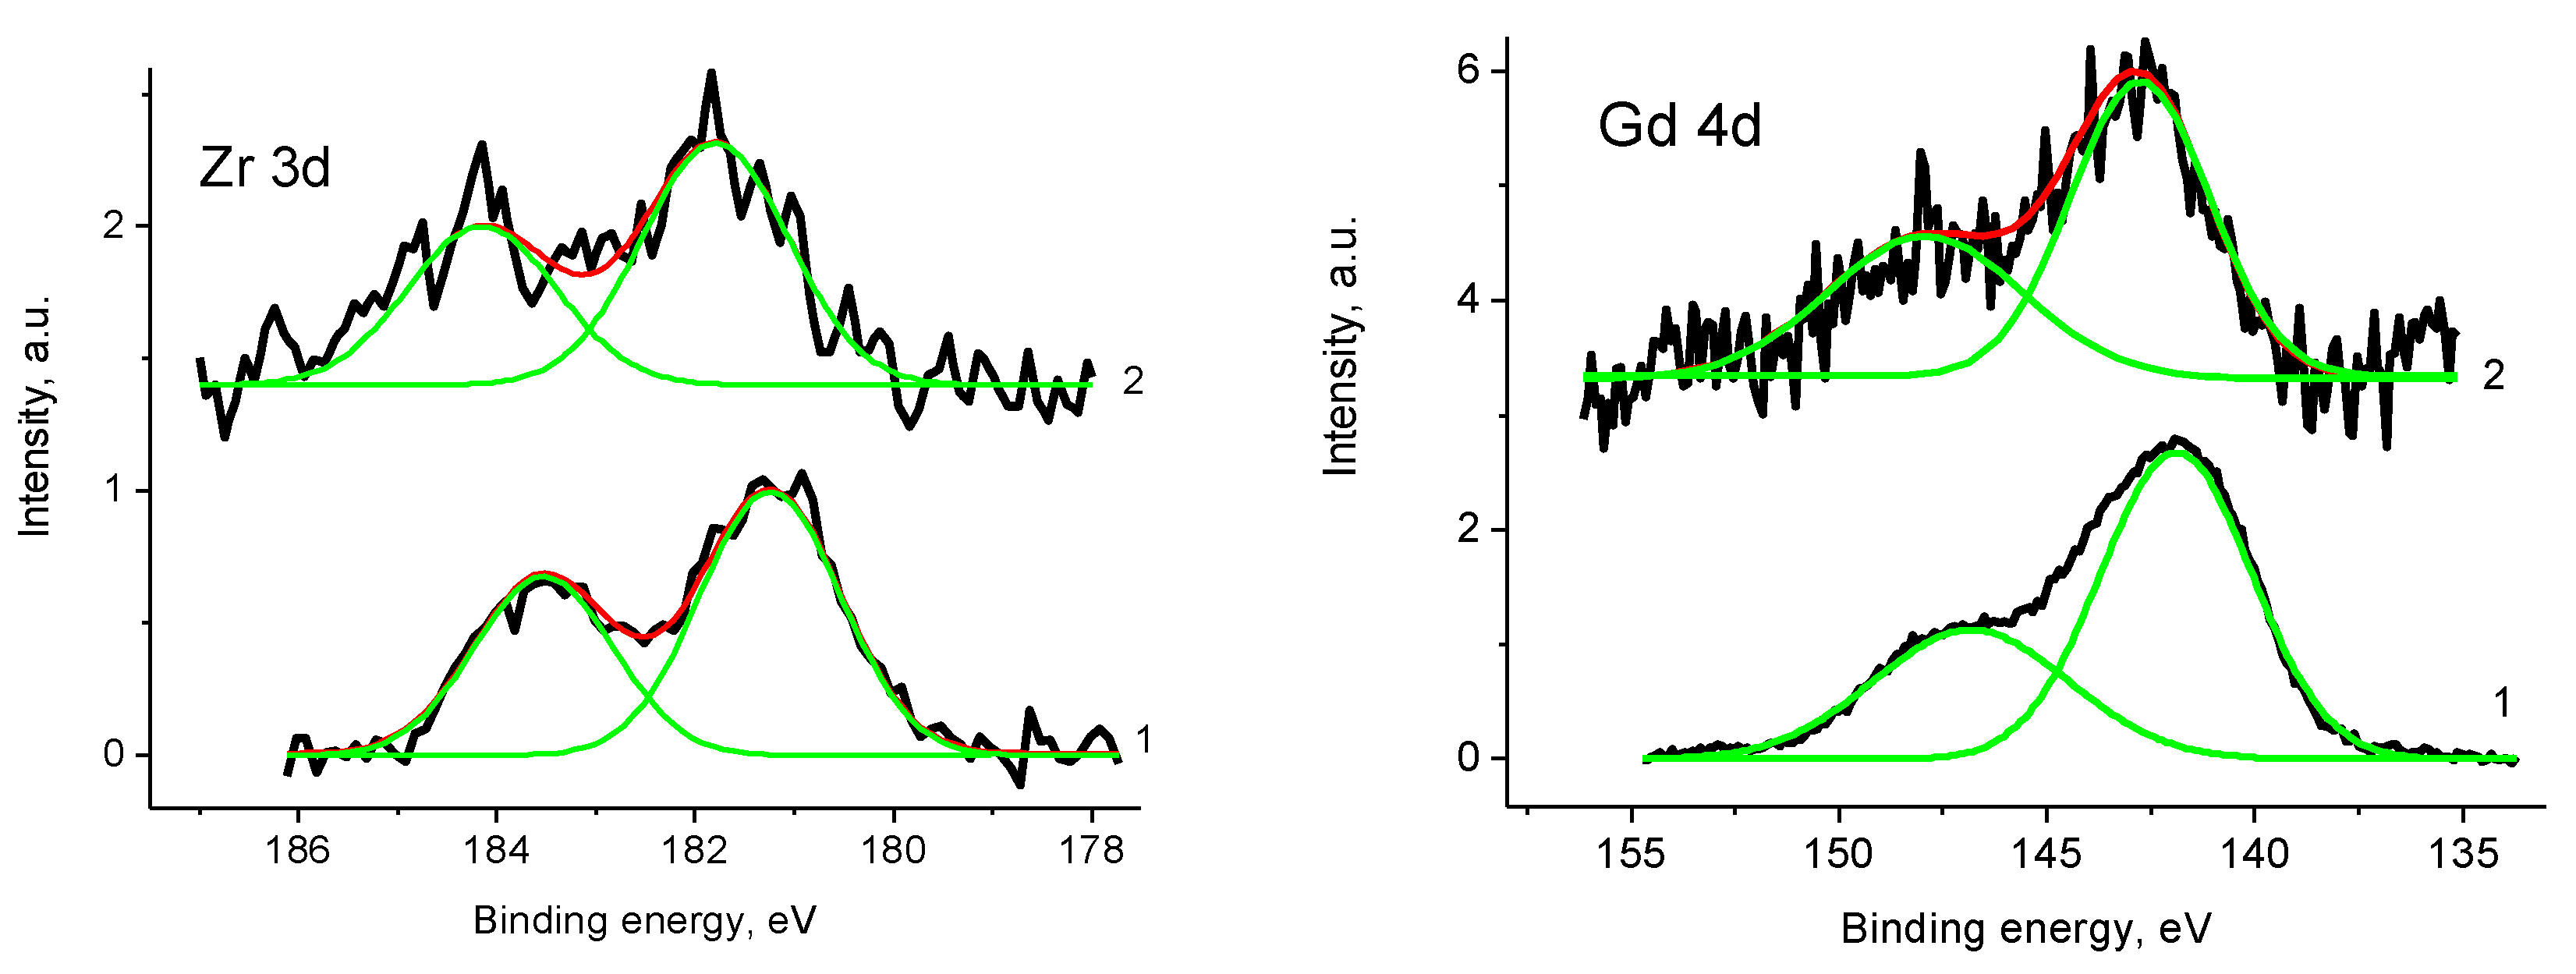
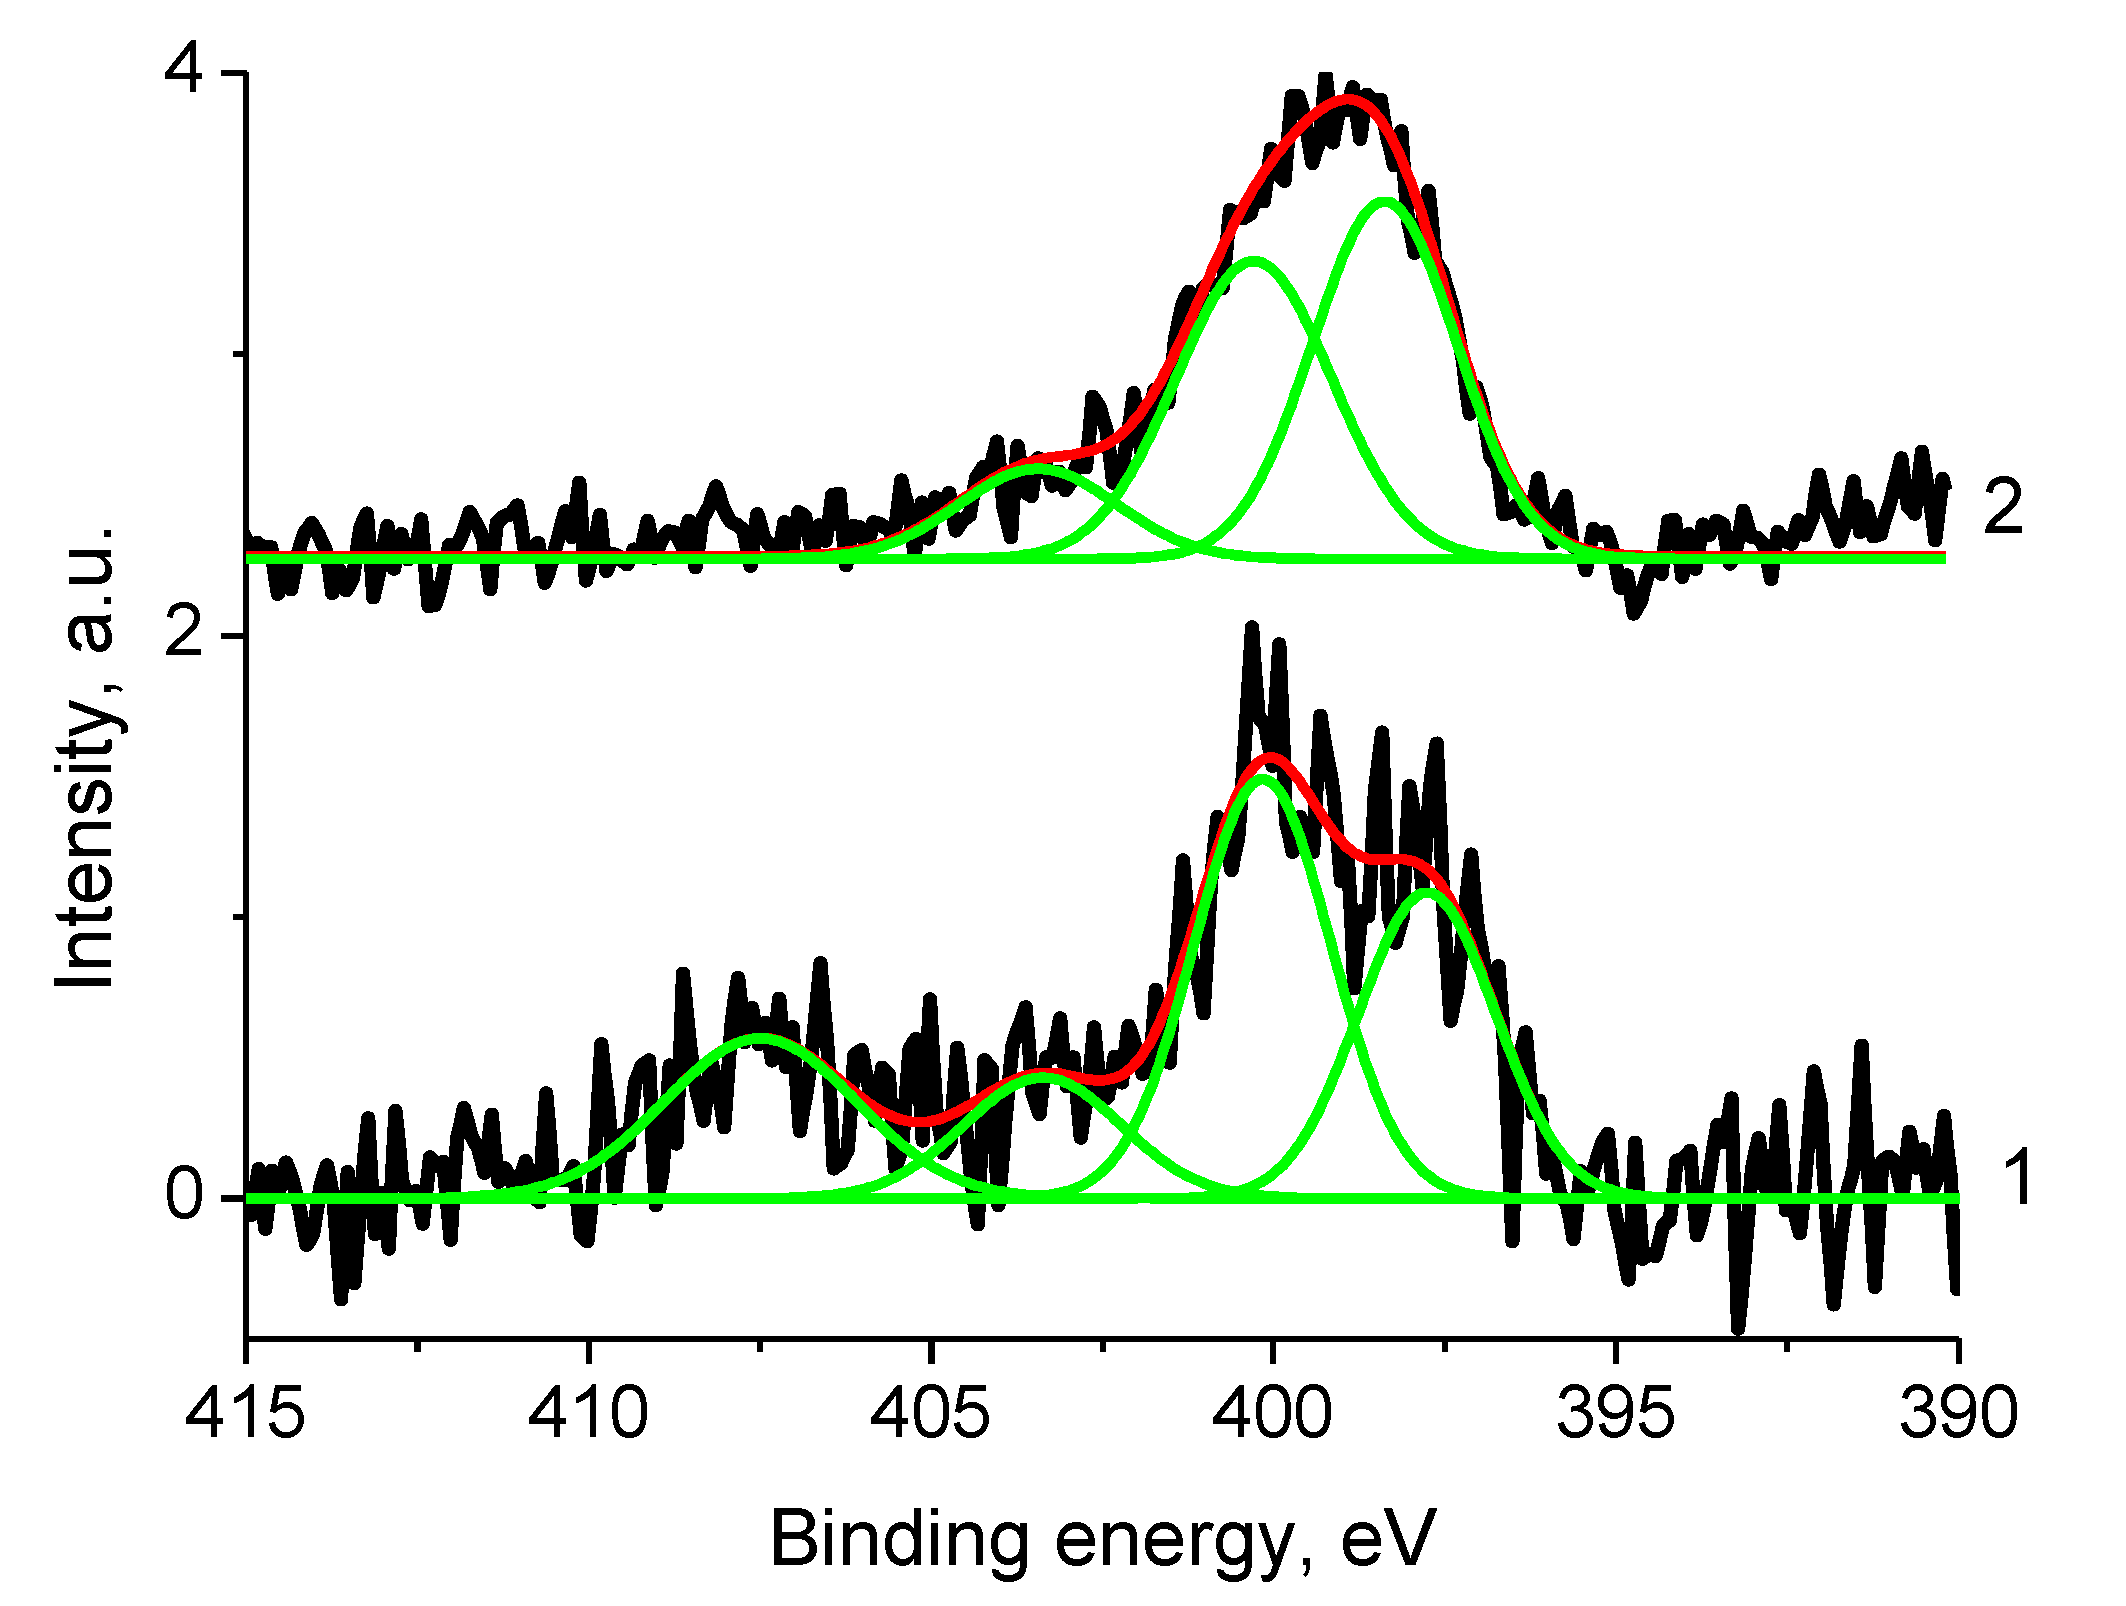
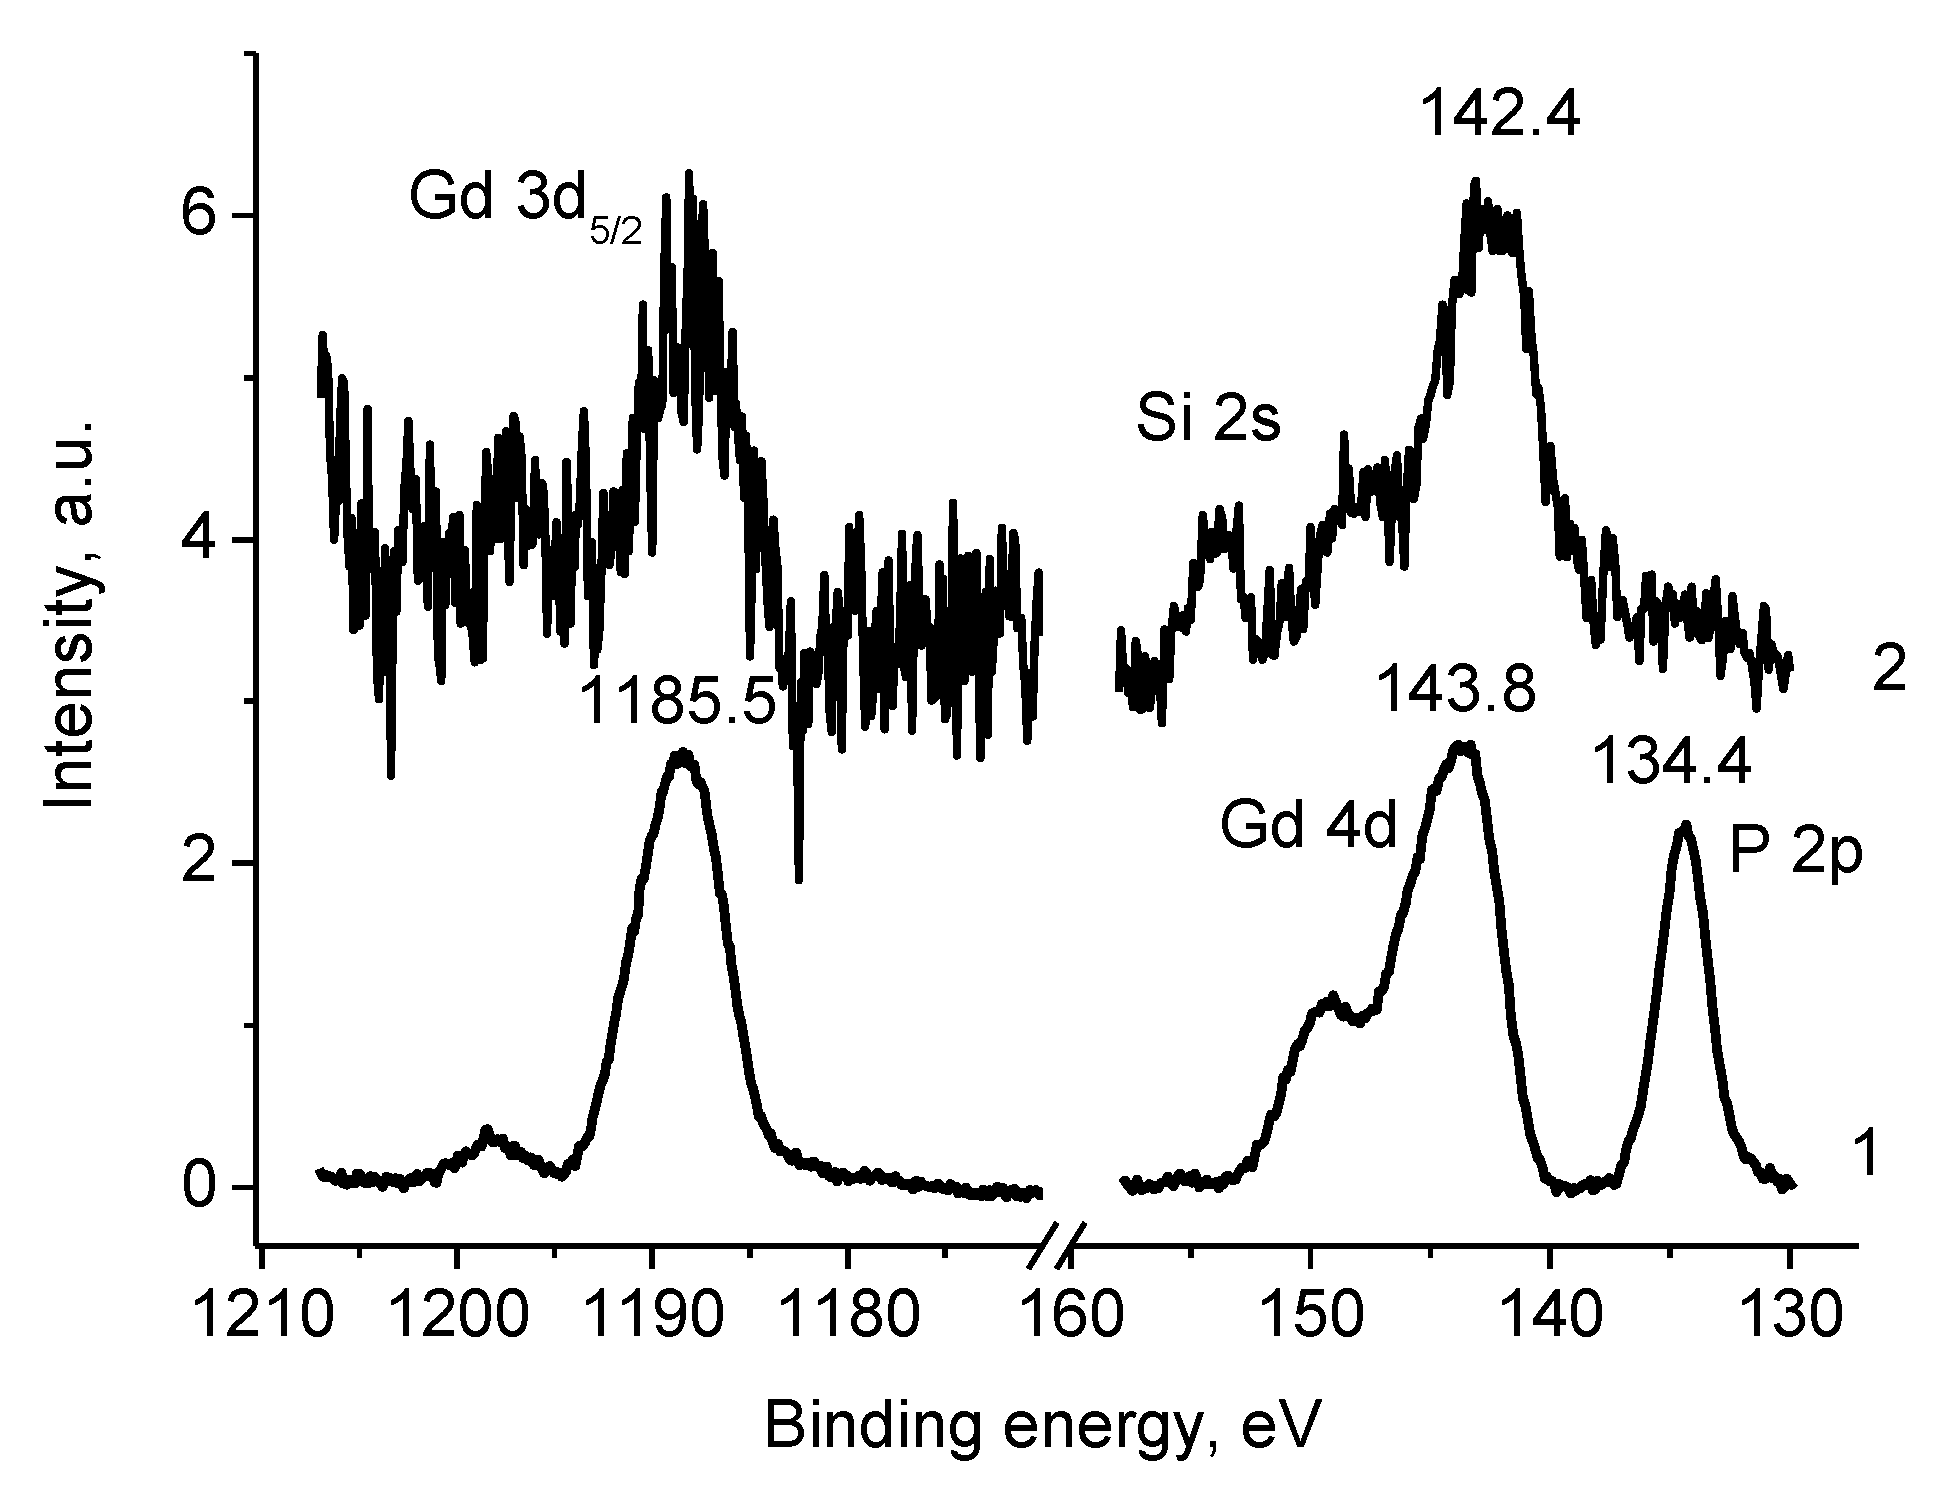
3.5.4. Samples 1 and Pt/1
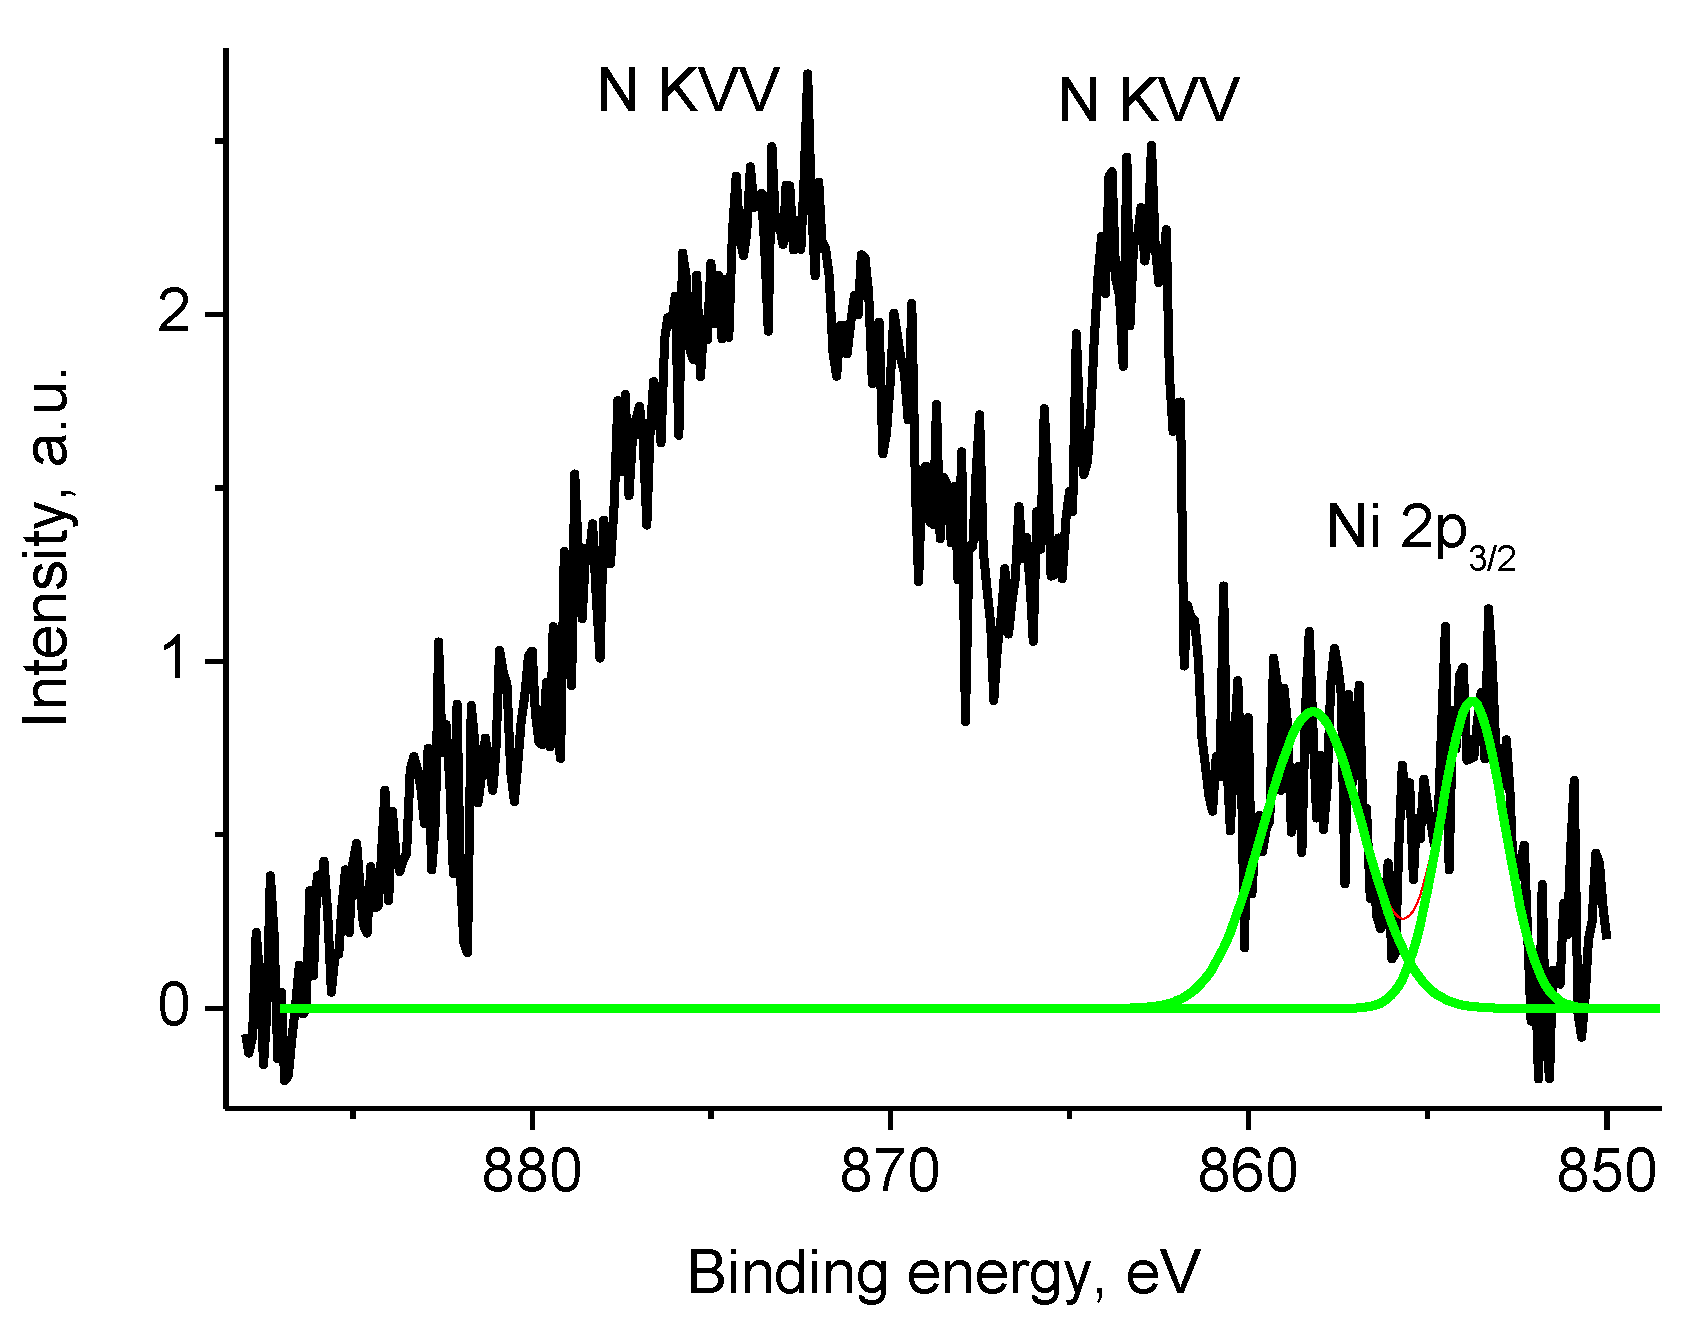
3.5.5. Sample Pt/1′
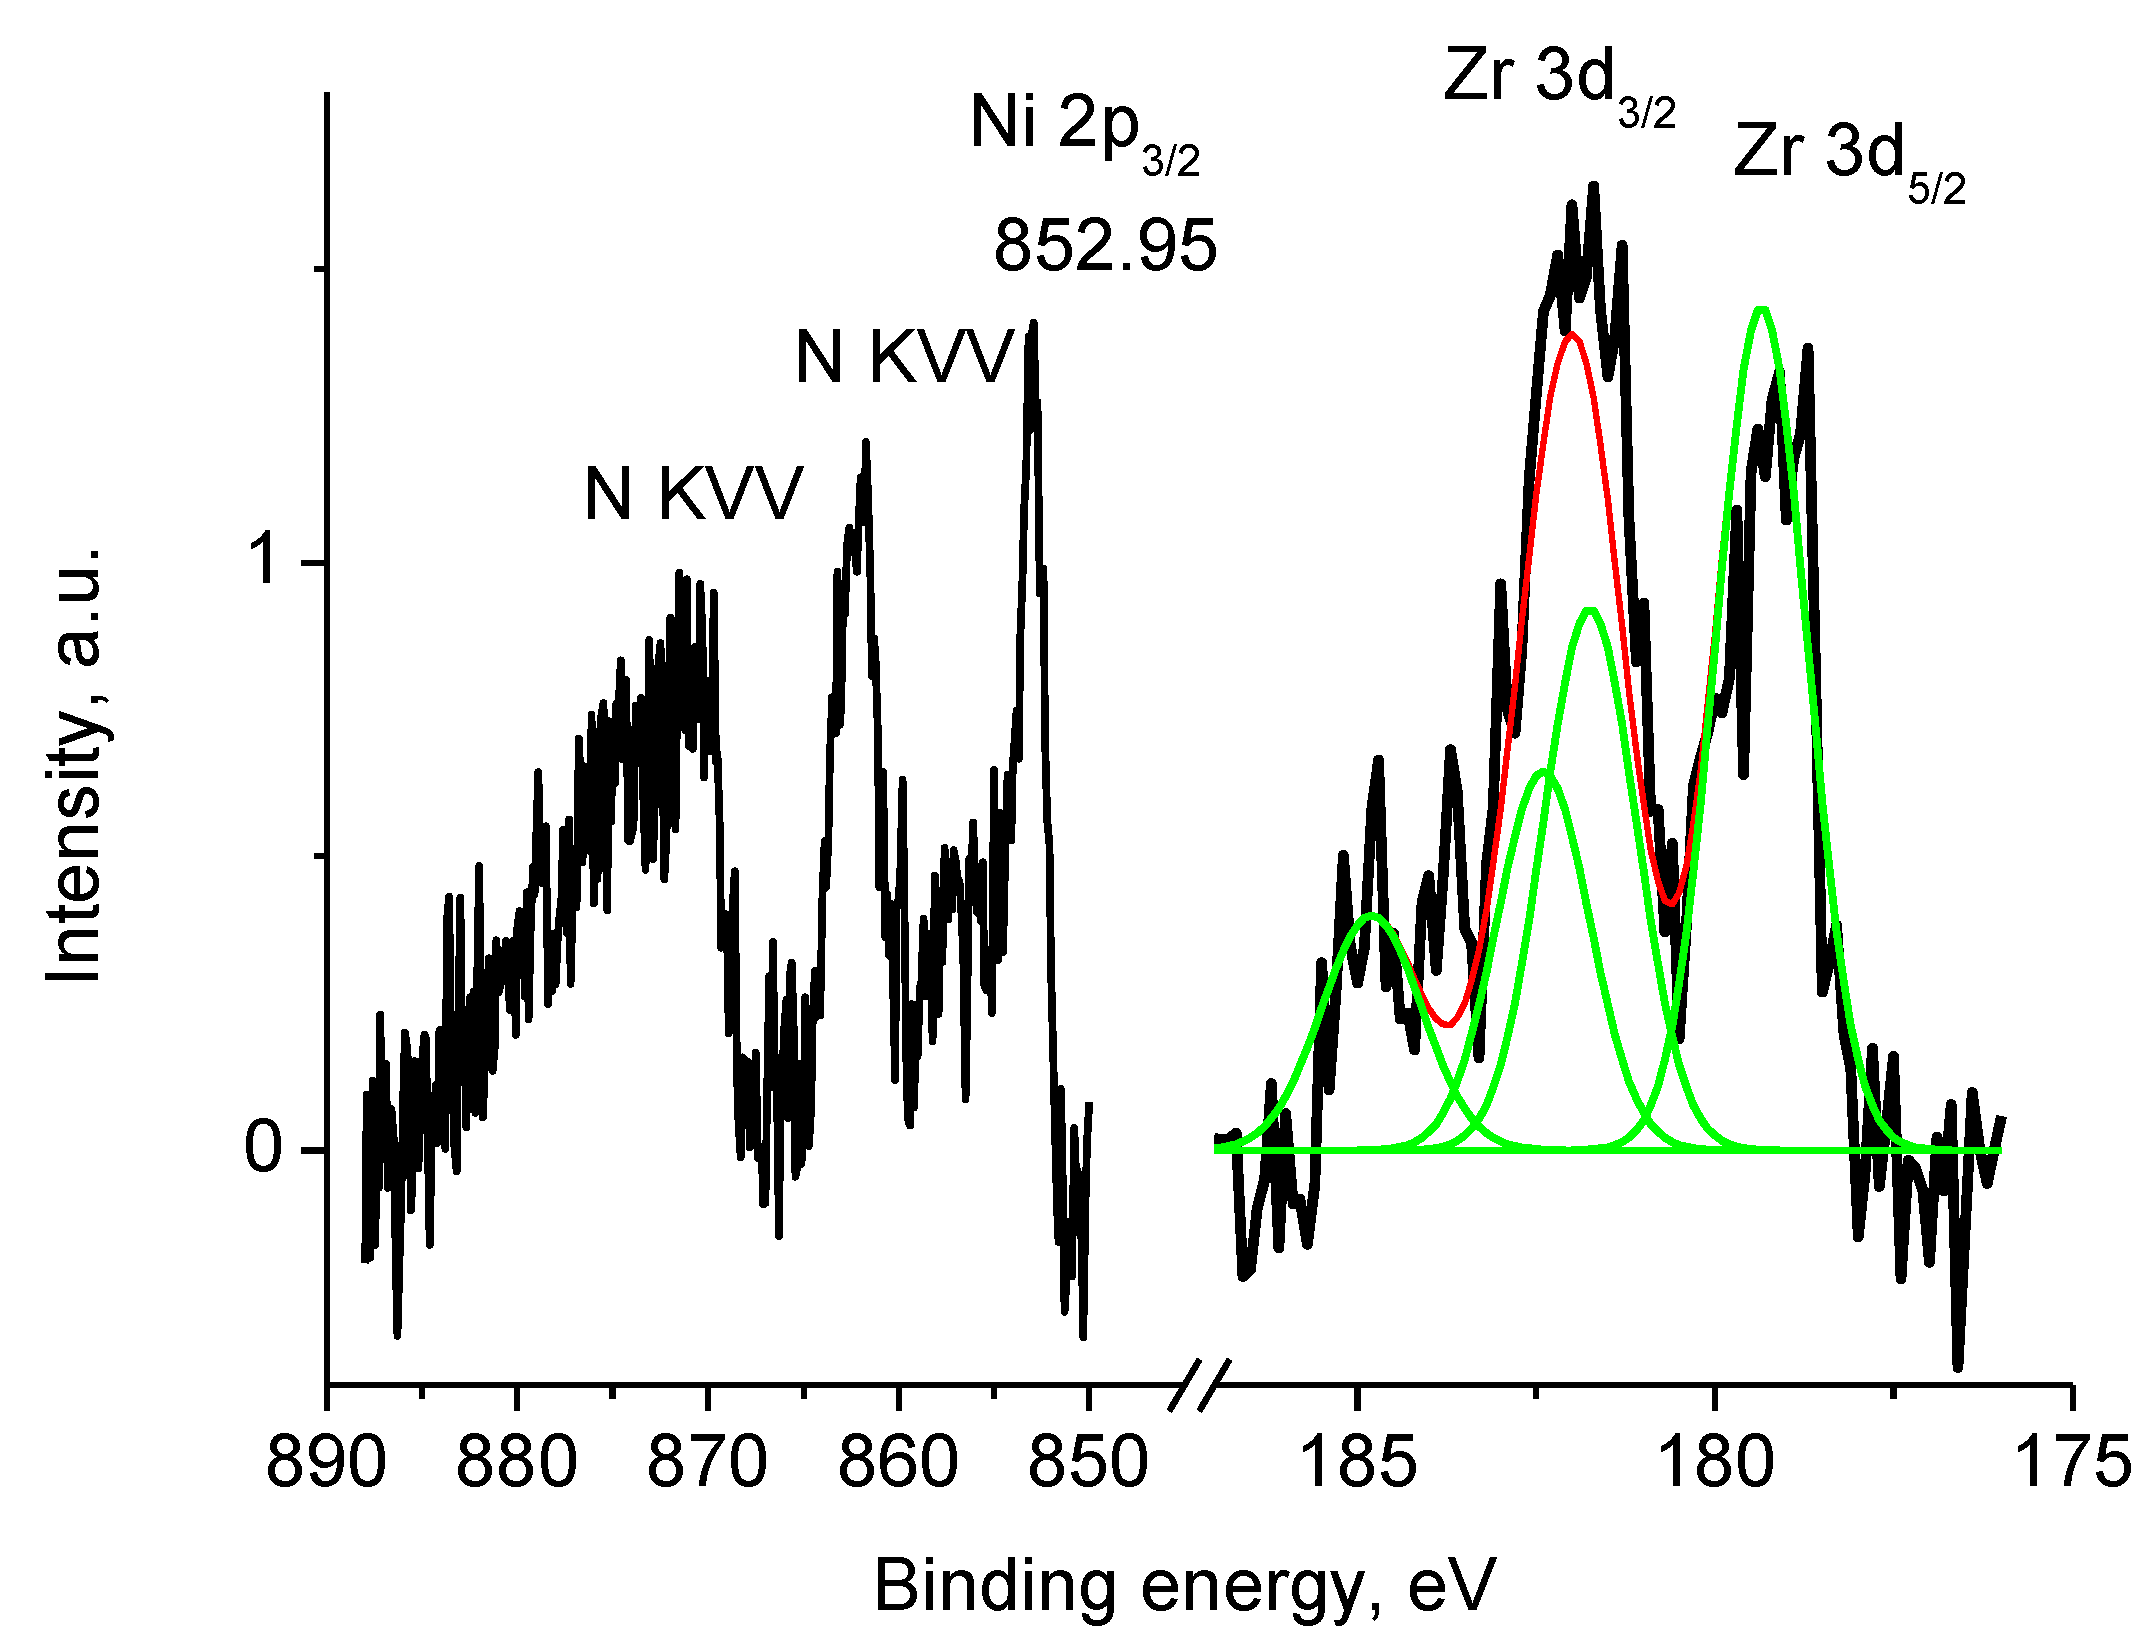
3.5.6. Sample 2
4. Conclusions
Supplementary Materials
Author Contributions
Funding
Acknowledgments
Conflicts of Interest
References
- Chaudhari, N.K.; Joo, J.; Kim, B.; Ruqia, B.; Choi, S.-I.; Lee, K. Recent advances in electrocatalysts toward the oxygen reduction reaction: The case of PtNi octahedra. Nanoscale 2018, 10, 20073–20088. [Google Scholar] [CrossRef]
- Stamenkovic, V.R.; Fowler, B.; Mun, B.S.; Wang, G.F.; Ross, P.N.; Lucas, C.A.; Markovic, N.M. Improved Oxygen Reduction Activity on Pt3Ni (111) via Increased Surface Site Availability. Science 2007, 315, 493–497. [Google Scholar] [CrossRef]
- Mukerjee, S.; Srinivasan, S.; Soriaga, M.P.; McBreen, J. Effect of Preparation Conditions of Pt Alloys on Their Electronic, Structural, and Electrocatalytic Activities for Oxygen Reduction—XRD, XAS, and Electrochemical Studies. J. Phys. Chem. 1995, 99, 4577–4589. [Google Scholar] [CrossRef]
- Stamenkovic, V.R.; Mun, B.S.; Arenz, M.; Mayrhofer, K.J.J.; Lucas, C.A.; Wang, G.; Ross, P.N.; Markovic, N.M. Trends in electrocatalysis on extended and nanoscale Pt-bimetallic alloy surfaces. Nat. Mater. 2007, 6, 241–247. [Google Scholar] [CrossRef] [PubMed]
- Yu, W.; Porosoff, M.D.; Chen, J.G. Review of Pt-Based Bimetallic Catalysis: From Model Surfaces to Supported Catalysts. Chem. Rev. 2012, 112, 5780–5817. [Google Scholar] [CrossRef] [PubMed]
- Chou, S.-W.; Lai, Y.-R.; Yang, Y.Y.; Tang, C.-Y.; Hayashi, M.; Chen, H.-C.; Chen, H.-L.; Chou, P.-T. Uniform size and composition tuning of PtNi octahedra for systematic studies of oxygen reduction reactions. J. Catal. 2014, 309, 343–350. [Google Scholar] [CrossRef]
- Wu, J.; Gross, A.; Yang, H. Shape and Composition-Controlled Platinum Alloy Nanocrystals Using Carbon Monoxide as Reducing Agent. Nano Lett. 2011, 11, 798–802. [Google Scholar] [CrossRef]
- Escribano, M.A.; Malacrid, P.; Hansen, M.H.; Vej-Hansen, U.G.; Palenzuela, A.P.; Tripkovic, V.; Schiøtz, J.; Rossmeisl, J.; Stephens, I.E.L.; Chorkendorff, I. Tuning the activity of Pt alloy electrocatalysts by means of the lanthanide contraction. Science 2016, 352, 73–76. [Google Scholar] [CrossRef] [PubMed]
- Escudero-Escribano, M.; Verdaguer-Casadevall, A.; Malacrida, P.; Gronbjerg, U.; Knudsen, B.P.; Jepsen, A.K.; Rossmeisl, J.; Stephens, I.E.L.; Chorkendorff, I. Pt5Gd as a Highly Active and Stable Catalyst for Oxygen Electroreduction. J. Am. Chem. Soc. 2012, 134, 16476–16479. [Google Scholar] [CrossRef]
- Mahata, A.; Nair, A.S.; Pathak, B. Recent advancements in Pt-nanostructure-based electrocatalysts for the oxygen reduction reaction. Catal. Sci. Technol. 2019, 9, 4835–4863. [Google Scholar] [CrossRef]
- Luo, Y.; Habrioux, A.; Calvillo, L.; Granozzi, G.; Alonso-Vante, N. Thermally Induced Strains on the Catalytic Activity and Stability of Pt–M2O3/C (M=Y or Gd) Catalysts towards Oxygen Reduction Reaction. ChemCatChem 2015, 7, 1573–1582. [Google Scholar] [CrossRef]
- Fugane, K.; Mori, T.; Ou, D.R.; Suzuki, A.; Yoshikawa, H.; Masuda, T.; Uosaki, K.; Yamashita, Y.; Ueda, S.; Kobayashi, K.; et al. Activity of oxygen reduction reaction on small amount of amorphous CeOx promoted Pt cathode for fuel cell application. Electrochim. Acta 2011, 56, 3874–3883. [Google Scholar] [CrossRef]
- Lim, D.-H.; Lee, W.-D.; Choi, D.-H.; Lee, H.-I. Effect of ceria nanoparticles into the Pt/C catalyst as cathode material on the electrocatalytic activity and durability for low temperature fuel cell. Appl. Catal. B Environ. 2010, 94, 85–96. [Google Scholar] [CrossRef]
- Luo, Y.; Habrioux, A.; Calvillo, L.; Granozzi, G.; Alonso-Vante, N. Yttrium Oxide/Gadolinium Oxide-Modified Platinum Nanoparticles as Cathodes for the Oxygen Reduction Reaction. ChemPhysChem 2014, 15, 2136–2144. [Google Scholar] [CrossRef] [PubMed]
- Antolini, E.; Perez, J. The use of rare earth-based materials in low-temperature fuel cells. Int. J. Hydrog. Energy 2011, 36, 15752–15765. [Google Scholar] [CrossRef]
- Liu, G.; Zhang, H.; Zhai, Y.; Zhang, Y.; Xu, D.; Shao, Z. Pt4ZrO2/C cathode catalyst for improved durability in high temperature PEMFC based on H3PO4 doped PBI. Electrochem. Commun. 2007, 9, 135–141. [Google Scholar] [CrossRef]
- Araya, S.S.; Zhou, F.; Liso, V.; Sahlin, S.L.; Vang, J.R.; Thomas, S.; Gao, X.; Jeppesen, C.; Kaer, S.K. A comprehensive review of PBI-based high temperature PEM fuel cells. Int. J. Hydrog. Energy 2016, 41, 21310–21344. [Google Scholar] [CrossRef]
- Rosli, R.E.; Sulong, A.B.; Daud, W.R.W.; Zulkifley, M.A.; Husaini, T.; Rosl, M.I.; Majlan, E.H.; Haque, M.A. A review of high-temperature proton exchange membrane fuel cell (HT-PEMFC) system. Int. J. Hydrog. Energy 2017, 42, 9293–9314. [Google Scholar] [CrossRef]
- Zhang, J. PEM Fuel Cell Electrocatalysts and Catalyst Layers, Fundamentals and Applications; Springer: London, UK, 2008. [Google Scholar] [CrossRef]
- Myles, T.; Bonville, L.; Maric, R. Catalyst, Membrane, Free Electrolyte Challenges, and Pathways to Resolutions in High Temperature Polymer Electrolyte Membrane Fuel Cells. Catalysts 2017, 7, 16. [Google Scholar] [CrossRef]
- Quartarone, E.; Angioni, S.; Mustarelli, P. Polymer and Composite Membranes for Proton-Conducting, High-Temperature Fuel Cells: A Critical Review. Materials 2017, 10, 687. [Google Scholar] [CrossRef]
- Chandan, A.; Hattenberger, M.; El-kharouf, A.; Du, S.; Dhir, A.; Self, V.; Pollet, B.G.; Ingram, A.; Bujalski, W. High temperature (HT) polymer electrolyte membrane fuel cells (PEMFC)—A review. J. Power Sources 2013, 231, 264–278. [Google Scholar] [CrossRef]
- Pingitore, A.T.; Molleo, M.; Schmidt, T.J.; Benicewicz, B.C. Polybenzimidazole Fuel Cell Technology: Theory, Performance, and Applications. In Fuel Cells and Hydrogen Production. Encyclopedia of Sustainability Science and Technology Series; Lipman, T., Weber, A., Eds.; Springer: New York, NY, USA, 2019; pp. 477–515. [Google Scholar] [CrossRef]
- Li, Q.; Aili, D.; Hjuler, H.A.; Jensen, J.O. High. Temperature Polymer Electrolyte Membrane Fuel Cells, Approaches, Status and Perspectives; Springer: London, UK, 2016. [Google Scholar] [CrossRef]
- Zeis, R. Materials and characterization techniques for high-temperature polymer electrolyte membrane fuel cells. Beilsteinj. Nanotechnol. 2015, 6, 68–83. [Google Scholar] [CrossRef] [PubMed]
- Authayanum, S.; Im-orb, K.; Arpornwichnop, A. A review of the development of high temperature proton exchange membrane fuel cells. Chin. J. Catal. 2015, 36, 473–483. [Google Scholar] [CrossRef]
- Borup, R.; Meyers, J.; Pivovar, B.; Kim, Y.S.; Mukundan, R.; Garland, N.; Myers, D.; Wilson, M.; Garzon, F.; Wood, D.; et al. Scientific Aspects of Polymer Electrolyte Fuel Cell Durability and Degradation. Chem. Rev. 2007, 107, 3904–3951. [Google Scholar] [CrossRef]
- Ponomarev, I.I.; Ponomarev, I.I.; Filatov, I.Y.; Filatov, Y.N.; Razorenov, D.Y.; Volkova, Y.A.; Zhigalina, O.M.; Zhigalina, V.G.; Grebenev, V.V.; Kiselev, N.A. Design of electrodes based on a carbon nanofiber nonwoven material for the membrane electrode assembly of a polybenzimidazole-membrane fuel cell. Dokl. Phys. Chem. 2013, 448, 23–27. [Google Scholar] [CrossRef]
- Zhigalina, V.G.; Zhigalina, O.M.; Ponomarev, I.I.; Skupov, K.M.; Razorenov, D.Y.; Ponomarev, I.I.; Kiselev, N.A.; Leitinger, G. Electron microscopy study of new composite materials based on electrospun carbon nanofibers. CrystEngComm 2017, 19, 3792–3800. [Google Scholar] [CrossRef]
- Ponomarev, I.I.; Skupov, K.M.; Naumkin, A.N.; Basu, V.G.; Zhigalina, O.M.; Razorenov, D.Y.; Ponomarev, I.I.; Volkova, Y.A. Probing of complex carbon nanofiber paper as gas-diffusion electrode for high temperature polymer electrolyte membrane fuel cell. RSC Adv. 2019, 9, 257–267. [Google Scholar] [CrossRef]
- Ponomarev, I.I.; Skupov, K.M.; Razorenov, D.Y.; Zhigalina, V.G.; Zhigalina, O.M.; Ponomarev, I.I.; Volkova, Y.A.; Kondratenko, M.S.; Bukalov, S.S.; Davydova, E.S. Electrospun nanofiber pyropolymer electrodes for fuel cell on polybenzimidazole membranes. Russ. J. Electrochem. 2016, 52, 735–739. [Google Scholar] [CrossRef]
- Ponomarev, I.I.; Zhigalina, O.M.; Skupov, K.M.; Modestov, A.D.; Basu, V.G.; Sufiyanova, A.E.; Ponomarev, I.I.; Razorenov, D.Y. Preparation and thermal treatment influence on Pt decorated electrospun carbon nanofiber electrocatalysts. RSC Adv. 2019, 9, 27406–27418. [Google Scholar] [CrossRef]
- Skupov, K.M.; Ponomarev, I.I.; Razorenov, D.Y.; Zhigalina, V.G.; Zhigalina, O.M.; Ponomarev, I.I.; Volkova, Y.A.; Volfkovich, Y.M.; Sosenkin, V.E. Carbon nanofiber paper cathode modification for higher performance of phosphoric acid fuel cells on polybenzimidazole membrane. Russ. J. Electrochem. 2017, 53, 728–733. [Google Scholar] [CrossRef]
- Skupov, K.M.; Ponomarev, I.I.; Razorenov, D.Y.; Zhigalina, V.G.; Zhigalina, O.M.; Ponomarev, I.I.; Volkova, Y.A.; Volfkovich, Y.M.; Sosenkin, V.E. Carbon nanofiber paper electrodes based on heterocyclic polymers for high temperature polymer electrolyte membrane fuel cell. Macromol. Symp. 2017, 375, 1600188. [Google Scholar] [CrossRef]
- Ponomarev, I.I.; Filatov, Y.N.; Ponomarev, I.I.; Filatov, I.Y.; Razorenov, D.Y.; Skupov, K.M.; Zhigalina, O.M.; Zhigalina, V.G. Electroforming on nitrogen-containing polymers and derived nonfabric nanofibre carbon materials. Fibre Chem. 2017, 49, 183–187. [Google Scholar] [CrossRef]
- Vol’fkovich, Y.M.; Ponomarev, I.I.; Sosenkin, V.E.; Ponomarev, I.I.; Skupov, K.M.; Razorenov, D.Y. A Porous Structure of Nanofiber Electrospun Polyacrylonitrile-Based Materials: A Standard Contact Porosimetry Study. Prot. Met. Phys. Chem. Surf. 2019, 55, 195–202. [Google Scholar] [CrossRef]
- Ponomarev, I.I.; Skupov, K.M.; Ponomarev, I.I.; Razorenov, D.Y.; Volkova, Y.A.; Basu, V.G.; Zhigalina, O.M.; Bukalov, S.S.; Volfkovich, Y.M.; Sosenkin, V.E. New Gas-Diffusion Electrode Based on Heterocyclic Microporous Polymer PIM-1 for High-Temperature Polymer Electrolyte Membrane Fuel Cell. Russ. J. Electrochem. 2019, 55, 552–557. [Google Scholar] [CrossRef]
- Dong, Z.; Kennedy, S.J.; Wu, Y. Electrospinning materials for energy-related applications and devices. J. Power Sources 2011, 196, 4886–4904. [Google Scholar] [CrossRef]
- Inagaki, M.; Yang, Y.; Kang, F. Carbon Nanofibers Prepared via Electrospinning. Adv. Mater. 2012, 24, 2547–2566. [Google Scholar] [CrossRef]
- Yusof, N.; Ismail, A.F. Post spinning and pyrolysis processes of polyacrylonitrile (PAN)-based carbon fiber and activated carbon fiber: A review. J. Anal. Appl. Pyrol. 2012, 93, 1–13. [Google Scholar] [CrossRef]
- Kondratenko, M.S.; Ponomarev, I.I.; Gallyamov, M.O.; Razorenov, D.Y.; Volkova, Y.A.; Kharitonova, E.P.; Khokhlov, A.R. Novel composite Zr/PBI-O-Pht membranes for HT-PEFC applications. Beilstein J. Nanotechnol. 2013, 4, 481–492. [Google Scholar] [CrossRef]
- Ponomarev, I.I.; Razorenov, D.Y.; Ponomarev, I.I.; Volkova, Y.A.; Skupov, K.M. Synthesis and studies of polybenzimidazoles for high-temperature fuel cell. Russ. J. Electrochem. 2014, 50, 694–699. [Google Scholar] [CrossRef]
- Delikaya, O.; Bevilacqua, N.; Eifert, L.; Kunz, U.; Zeis, R.; Roth, C. Porous electrospun carbon nanofibers network as an integrated electrode@gas diffusion layer for high temperature polymer electrolyte membrane fuel cells. Electrochim. Acta 2020, 345, 136192. [Google Scholar] [CrossRef]
- Schmidt, T.J.; Baurmeister, J. Properties of high temperature PEFC Celtec®-P 1000 MEAs in start/stop operation mode. J. Power Sources 2008, 176, 428–434. [Google Scholar] [CrossRef]
- Fomenkov, A.I.; Blagodatskikh, I.V.; Ponomarev, I.I.; Volkova, Y.A.; Ponomarev, I.I.; Khokhlov, A.R. Synthesis and molecular-mass characteristics of some cardo poly(benzimidazoles). Polym. Sci. Ser. B 2009, 51, 166–173. [Google Scholar] [CrossRef]
- Naumkin, A.V.; Kraut-Vass, A.; Gaarenstroom, S.W.; Powell, C.J. NIST X-Ray Photoelectron Spectroscopy Database; Version 4.1; National Institute of Standards and Technology: Gaithersburg, MD, USA, 2012. Available online: http://srdata.nist.gov/xps/ (accessed on 7 May 2020). [CrossRef]
- Gasteiger, H.A.; Kocha, S.S.; Sompalli, B.; Wagner, F.T. Activity benchmarks and requirements for Pt, Pt-alloy, and non-Pt oxygen reduction catalysts for PEMFCs. Appl. Catal. B Environ. 2005, 56, 9–35. [Google Scholar] [CrossRef]
- Kinoshita, K.; Stonehart, P. Preparation and Characterization of Highly Dispersed Electrocatalytic Materials. In Modern Aspects of Electrochemistry; Bockris, J.O., Conway, B.E., Eds.; Springer: Boston, MA, USA, 1977; pp. 183–266. [Google Scholar] [CrossRef]
- Shiota, I.; Watanabe, O. Compatibility studies between pyrolytic carbon and nickel. J. Mater. Sci. 1979, 14, 1121–1125. [Google Scholar] [CrossRef]
- Mayorova, N.A.; Zhigalina, O.M.; Zhigalina, V.G.; Khazova, O.A. Pt/Pd/C Catalysts with Ultra Low Platinum Content for Oxygen Reduction Reaction. Russ. J. Electrochem. 2014, 50, 223–230. [Google Scholar] [CrossRef]
- Zhigalina, V.G.; Chuvilin, A.L.; Zhigalina, O.M.; Tuseeva, E.K.; Khazova, O.A.; Nikulina, E.A.; Kiselev, N.A. Electron microscopy of single-wall carbon nanotubes-polymer-Pt (Ru) composite materials. J. Surf. Investig. 2015, 9, 355–363. [Google Scholar] [CrossRef]
- Zhigalina, V.G.; Zhigalina, O.M.; Mayorova, N.A.; Khazova, O.A.; Chuvilin, A.L.; Khmelenin, D.N. Electron microscopy study of a Pt-Pd bimetallic structure formation on soot for catalytic systems. Nanotechnol. Russ. 2014, 9, 485–491. [Google Scholar] [CrossRef]
- Lee, S.W.; Chen, S.; Suntivich, J.; Sasaki, K.; Adzic, R.R.; Shao-Horn, Y. Role of Surface Steps of Pt Nanoparticles on the Electrochemical Activity for Oxygen Reduction. J. Phys. Chem. Lett. 2010, 1, 1316–1320. [Google Scholar] [CrossRef]
- Monthioux, M. Carbon Meta-Nanotubes: Synthesis, Properties and Applications; John Wiley & Sons, Ltd.: Chichester, UK, 2012. [Google Scholar] [CrossRef]
- Harris, P.J.F. Carbon Nanotubes and Related Structures; Cambridge University Press: Cambridge, UK, 1999. [Google Scholar] [CrossRef]
- Kiselev, N.A.; Moravsky, A.P.; Ormont, A.B.; Zakharov, D.N. SEM and HREM study of the internal structure of nanotube rich carbon arc cathodic deposits. Carbon 1999, 37, 1093–1103. [Google Scholar] [CrossRef]
- Blank, V.D.; Gorlova, I.G.; Hutchison, J.L.; Kiselev, N.A.; Ormont, A.B.; Polyakov, E.V.; Sloan, J.; Zakharov, D.N.; Zybtsev, S.G. The structure of nanotubes fabricated by carbon evaporation at high gas pressure. Carbon 2000, 38, 1217–1240. [Google Scholar] [CrossRef]
- Kiselev, N.A.; Hutchison, J.L.; Ryabenko, A.G.; Rakova, E.V.; Chizhov, P.E.; Zhigalina, O.M.; Artemov, V.V.; Grigoriev, Y.V. Two structural types of carbon bi-filaments. Carbon 2005, 43, 1897–1908. [Google Scholar] [CrossRef]
- Beamson, G.; Briggs, D. High Resolution XPS of Organic Polymers; The Scienta ESCA300 Database; Wiley: Chichister, UK, 1992. [Google Scholar]
- Komarova, N.S.; Krivenko, A.G.; Ryabenko, A.G.; Naumkin, A.V. Active forms of oxygen as agents for electrochemical functionalization of SWCNTs. Carbon 2013, 53, 188–196. [Google Scholar] [CrossRef]
- Grüneis, A.; Kummer, K.; Vyalikh, D.V. Dynamics of graphene growth on a metal surface: A time-dependent photoemission study. New J. Phys. 2009, 11, 073050. [Google Scholar] [CrossRef]
- Moulder, J.F.; Stickle, W.F.; Sobol, P.E.; Bomben, K.D. Handbook of X-Ray Photoelectron Spectroscopy; Perkin Elmer Corporation: Eden Prairie, MN, USA, 1995. [Google Scholar]
- Eberhard, W.; Fayet, P.; Cox, D.M.; Fu, Z.; Kaldor, A.; Sherwood, R.; Sondericker, D. Photoemission from mass-selected monodispersed Pt clusters. Phys. Rev. Lett. 1990, 64, 780–783. [Google Scholar] [CrossRef]
- Mansour, A.N.; Melendres, C.A. Characterization of slightly hydrated Ni(OH)2 by XPS. Surf. Sci. Spectra 1994, 3, 247–254. [Google Scholar] [CrossRef]
- Mansour, A.N.; Melendres, C.A. Characterization of α-Ni(OH)2 by XPS. Surf. Sci. Spectra 1994, 3, 255–262. [Google Scholar] [CrossRef]
- Mansour, A.N. Characterization of β-Ni(OH)2 by XPS. Surf. Sci. Spectra 1994, 3, 239–246. [Google Scholar] [CrossRef]
- Mansour, A.N.; Melendres, C.A. Characterization of Ni2O3⋅6H2O by XPS. Surf. Sci. Spectra 1994, 3, 263–270. [Google Scholar] [CrossRef]


| Sample | %C | %N | %H | %Ni | %Zr | %Gd | %Co | %Sm | %Ce | S, S cm−1 |
|---|---|---|---|---|---|---|---|---|---|---|
| 1 | 84.73 | 1.75 | 0.91 | 2.1 | 0.8 | 7.3 | - | - | - | 13.1 |
| 2 | 88.25 | 0.55 | 0.27 | 1.4 | 0.7 | 5.3 | - | - | - | 23.4 |
| 3 | 86.27 | 0.61 | 0.23 | - | - | - | 6.1 | 3.2 | - | 19.2 |
| 4 | 87.08 | 1.91 | 0.4 | 5.1 | 0.9 | - | - | - | 0.85 | 12.3 |
© 2020 by the authors. Licensee MDPI, Basel, Switzerland. This article is an open access article distributed under the terms and conditions of the Creative Commons Attribution (CC BY) license (http://creativecommons.org/licenses/by/4.0/).
Share and Cite
Ponomarev, I.I.; Skupov, K.M.; Zhigalina, O.M.; Naumkin, A.V.; Modestov, A.D.; Basu, V.G.; Sufiyanova, A.E.; Razorenov, D.Y.; Ponomarev, I.I. New Carbon Nanofiber Composite Materials Containing Lanthanides and Transition Metals Based on Electrospun Polyacrylonitrile for High Temperature Polymer Electrolyte Membrane Fuel Cell Cathodes. Polymers 2020, 12, 1340. https://doi.org/10.3390/polym12061340
Ponomarev II, Skupov KM, Zhigalina OM, Naumkin AV, Modestov AD, Basu VG, Sufiyanova AE, Razorenov DY, Ponomarev II. New Carbon Nanofiber Composite Materials Containing Lanthanides and Transition Metals Based on Electrospun Polyacrylonitrile for High Temperature Polymer Electrolyte Membrane Fuel Cell Cathodes. Polymers. 2020; 12(6):1340. https://doi.org/10.3390/polym12061340
Chicago/Turabian StylePonomarev, Igor I., Kirill M. Skupov, Olga M. Zhigalina, Alexander V. Naumkin, Alexander D. Modestov, Victoria G. Basu, Alena E. Sufiyanova, Dmitry Y. Razorenov, and Ivan I. Ponomarev. 2020. "New Carbon Nanofiber Composite Materials Containing Lanthanides and Transition Metals Based on Electrospun Polyacrylonitrile for High Temperature Polymer Electrolyte Membrane Fuel Cell Cathodes" Polymers 12, no. 6: 1340. https://doi.org/10.3390/polym12061340
APA StylePonomarev, I. I., Skupov, K. M., Zhigalina, O. M., Naumkin, A. V., Modestov, A. D., Basu, V. G., Sufiyanova, A. E., Razorenov, D. Y., & Ponomarev, I. I. (2020). New Carbon Nanofiber Composite Materials Containing Lanthanides and Transition Metals Based on Electrospun Polyacrylonitrile for High Temperature Polymer Electrolyte Membrane Fuel Cell Cathodes. Polymers, 12(6), 1340. https://doi.org/10.3390/polym12061340