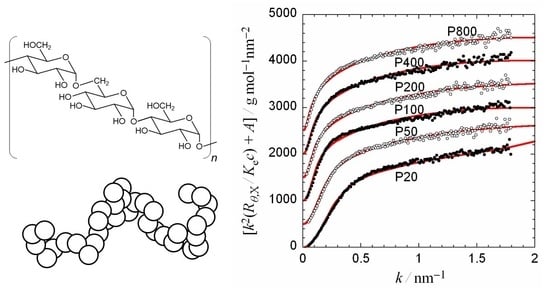
Conformation of Pullulan in Aqueous Solution Studied by Small-Angle X-ray Scattering


Abstract
1. Introduction
2. Materials and Methods
2.1. Sample and Solutions
2.2. SAXS Measurements
2.3. Analysis of the SAXS Scattering Function [19]
3. Results
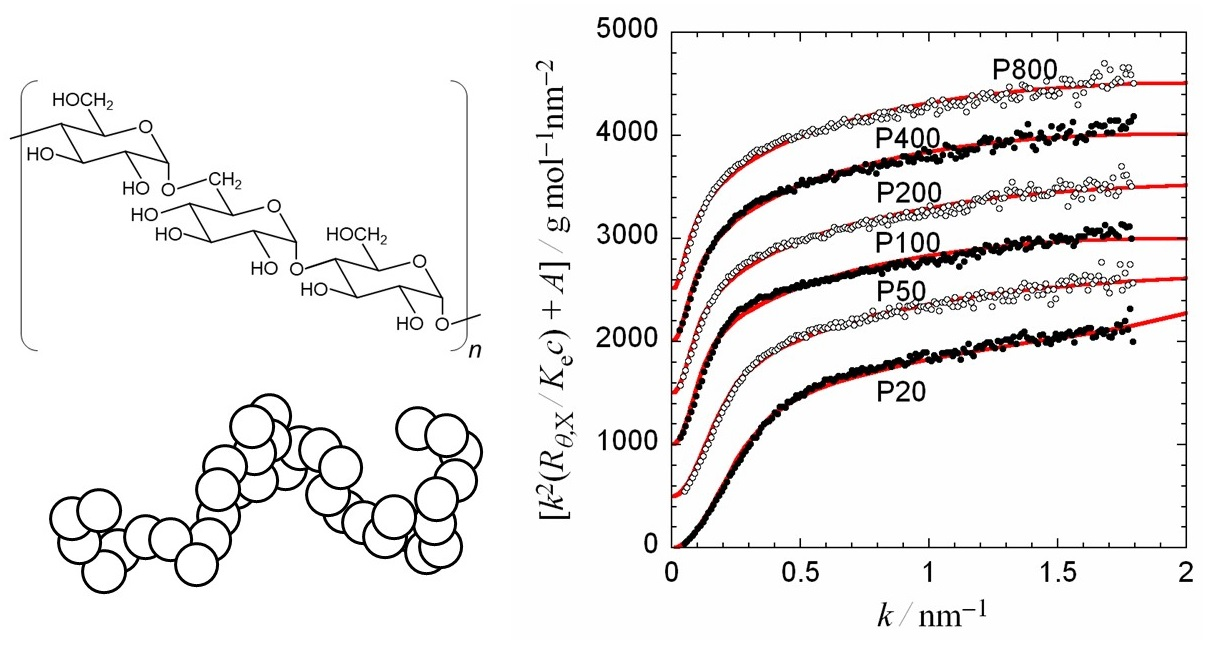
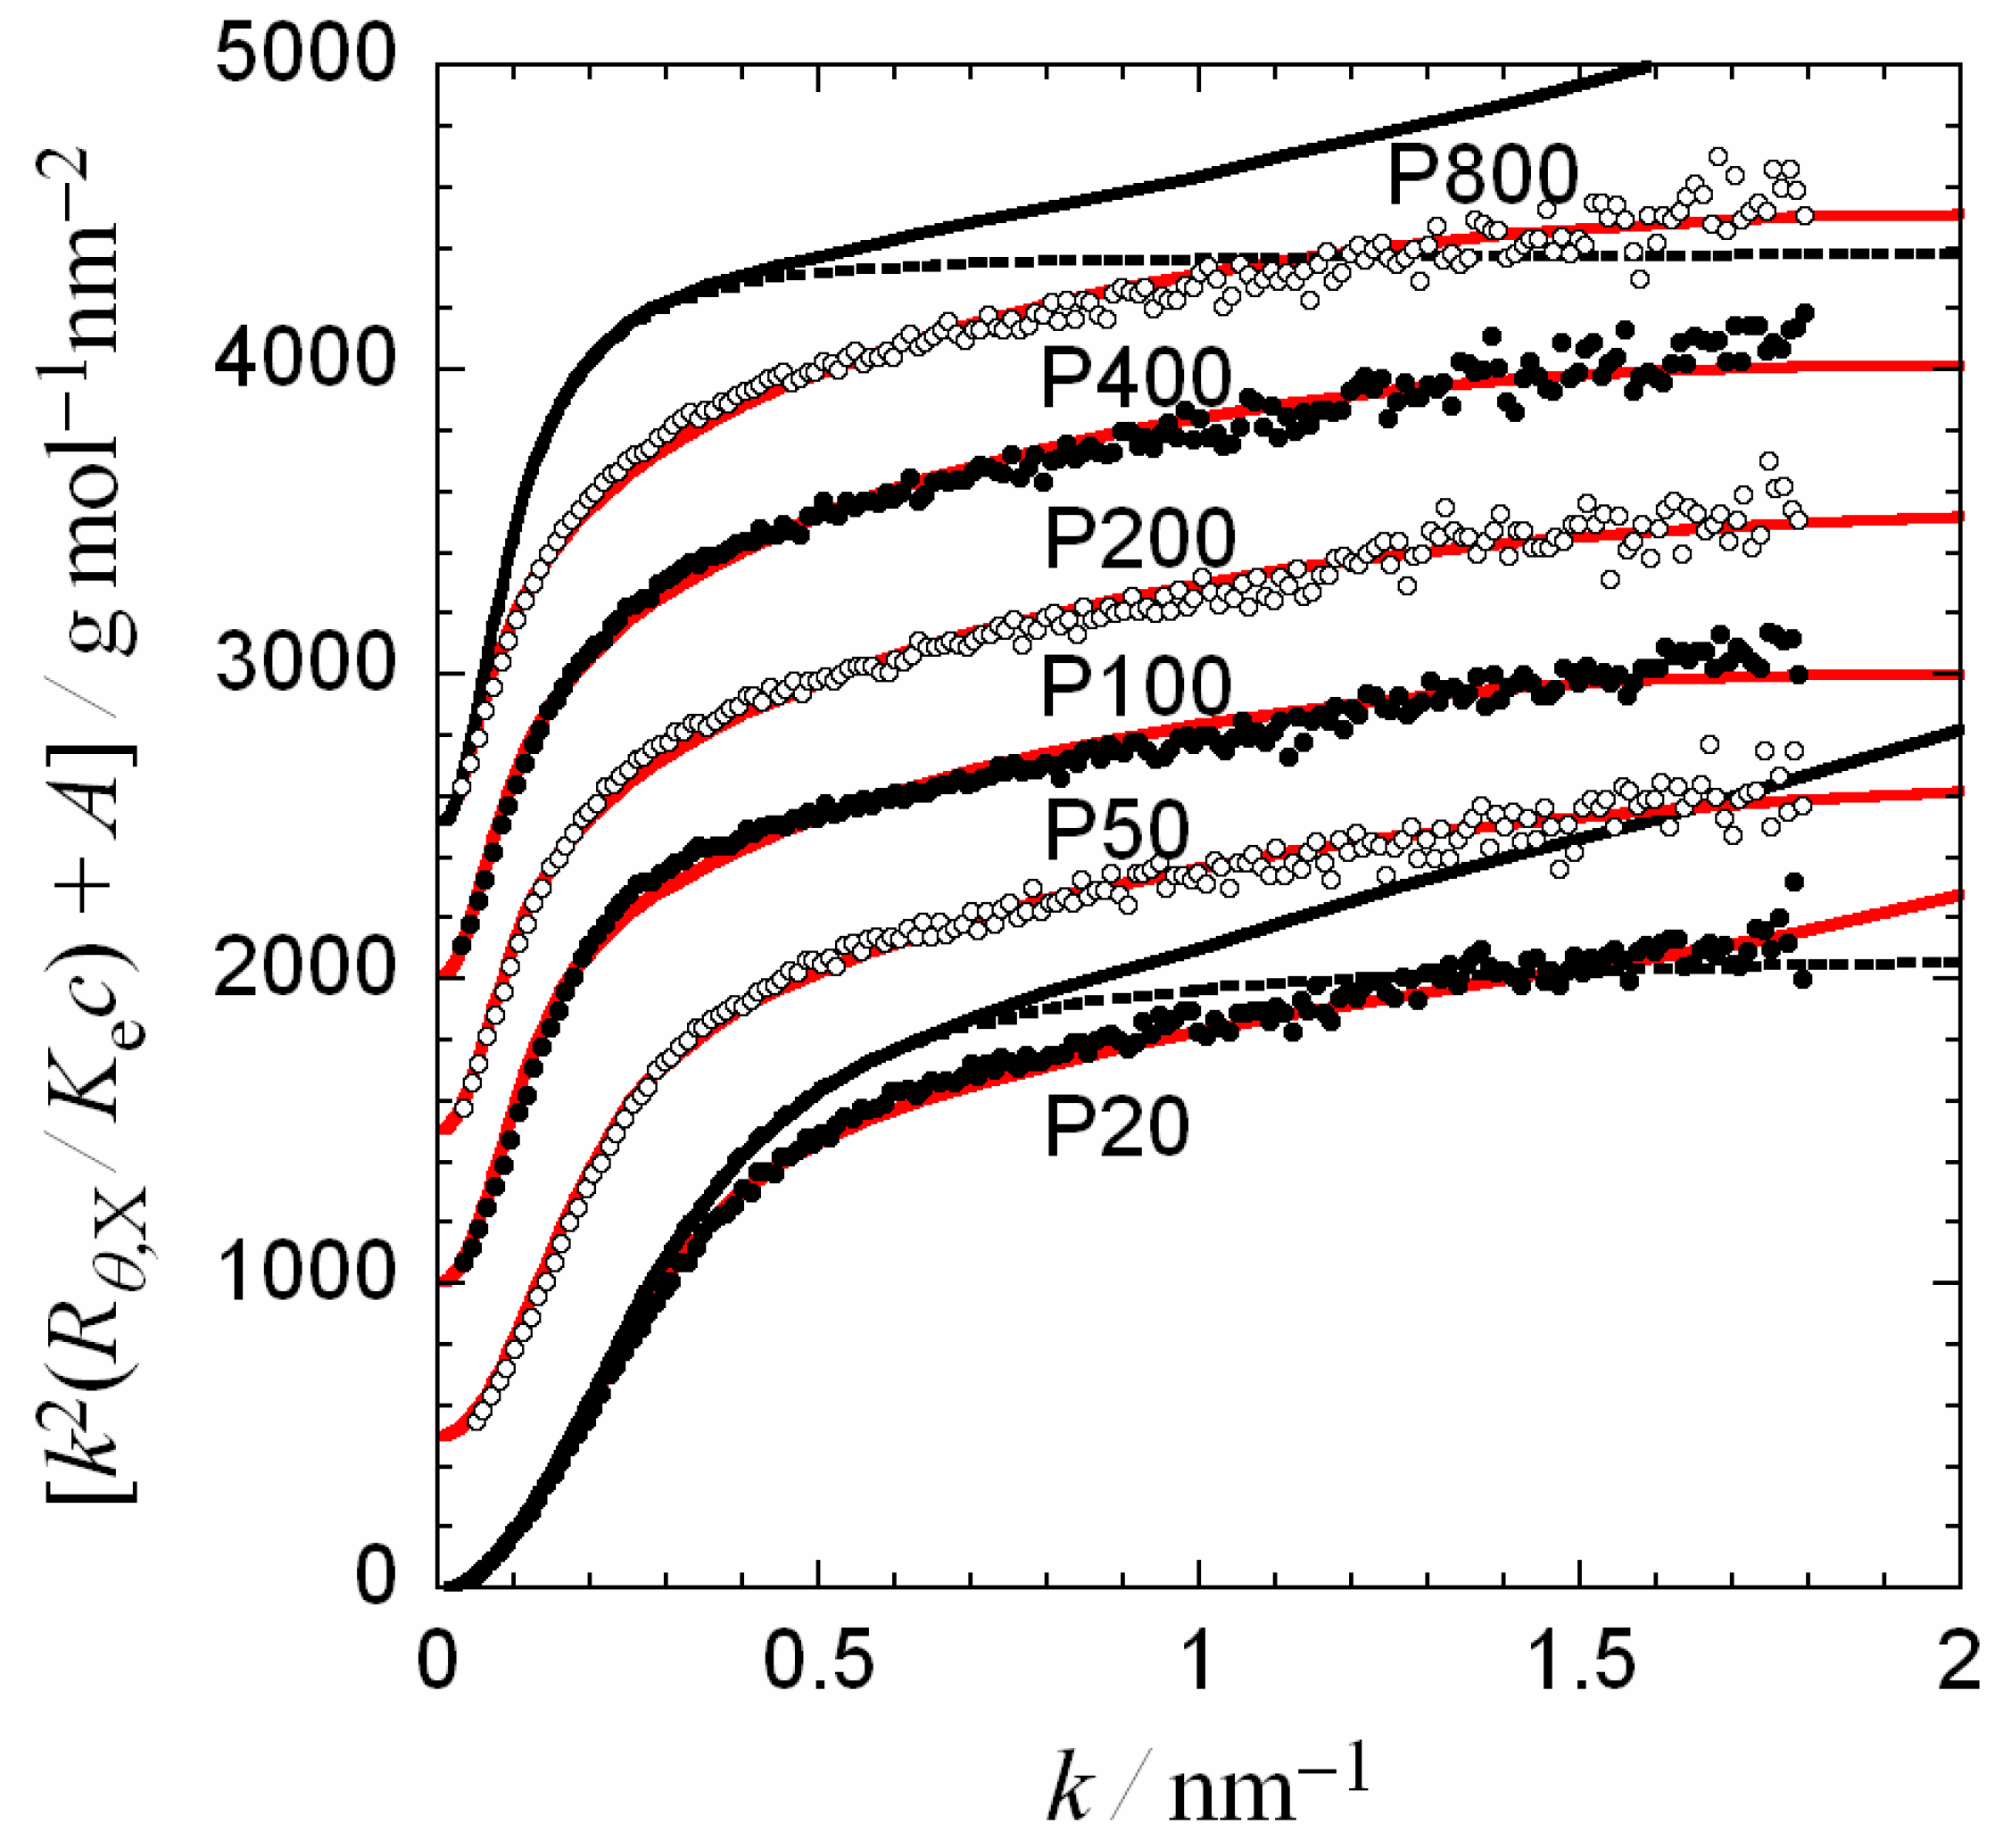
3.1. Kratky Plot
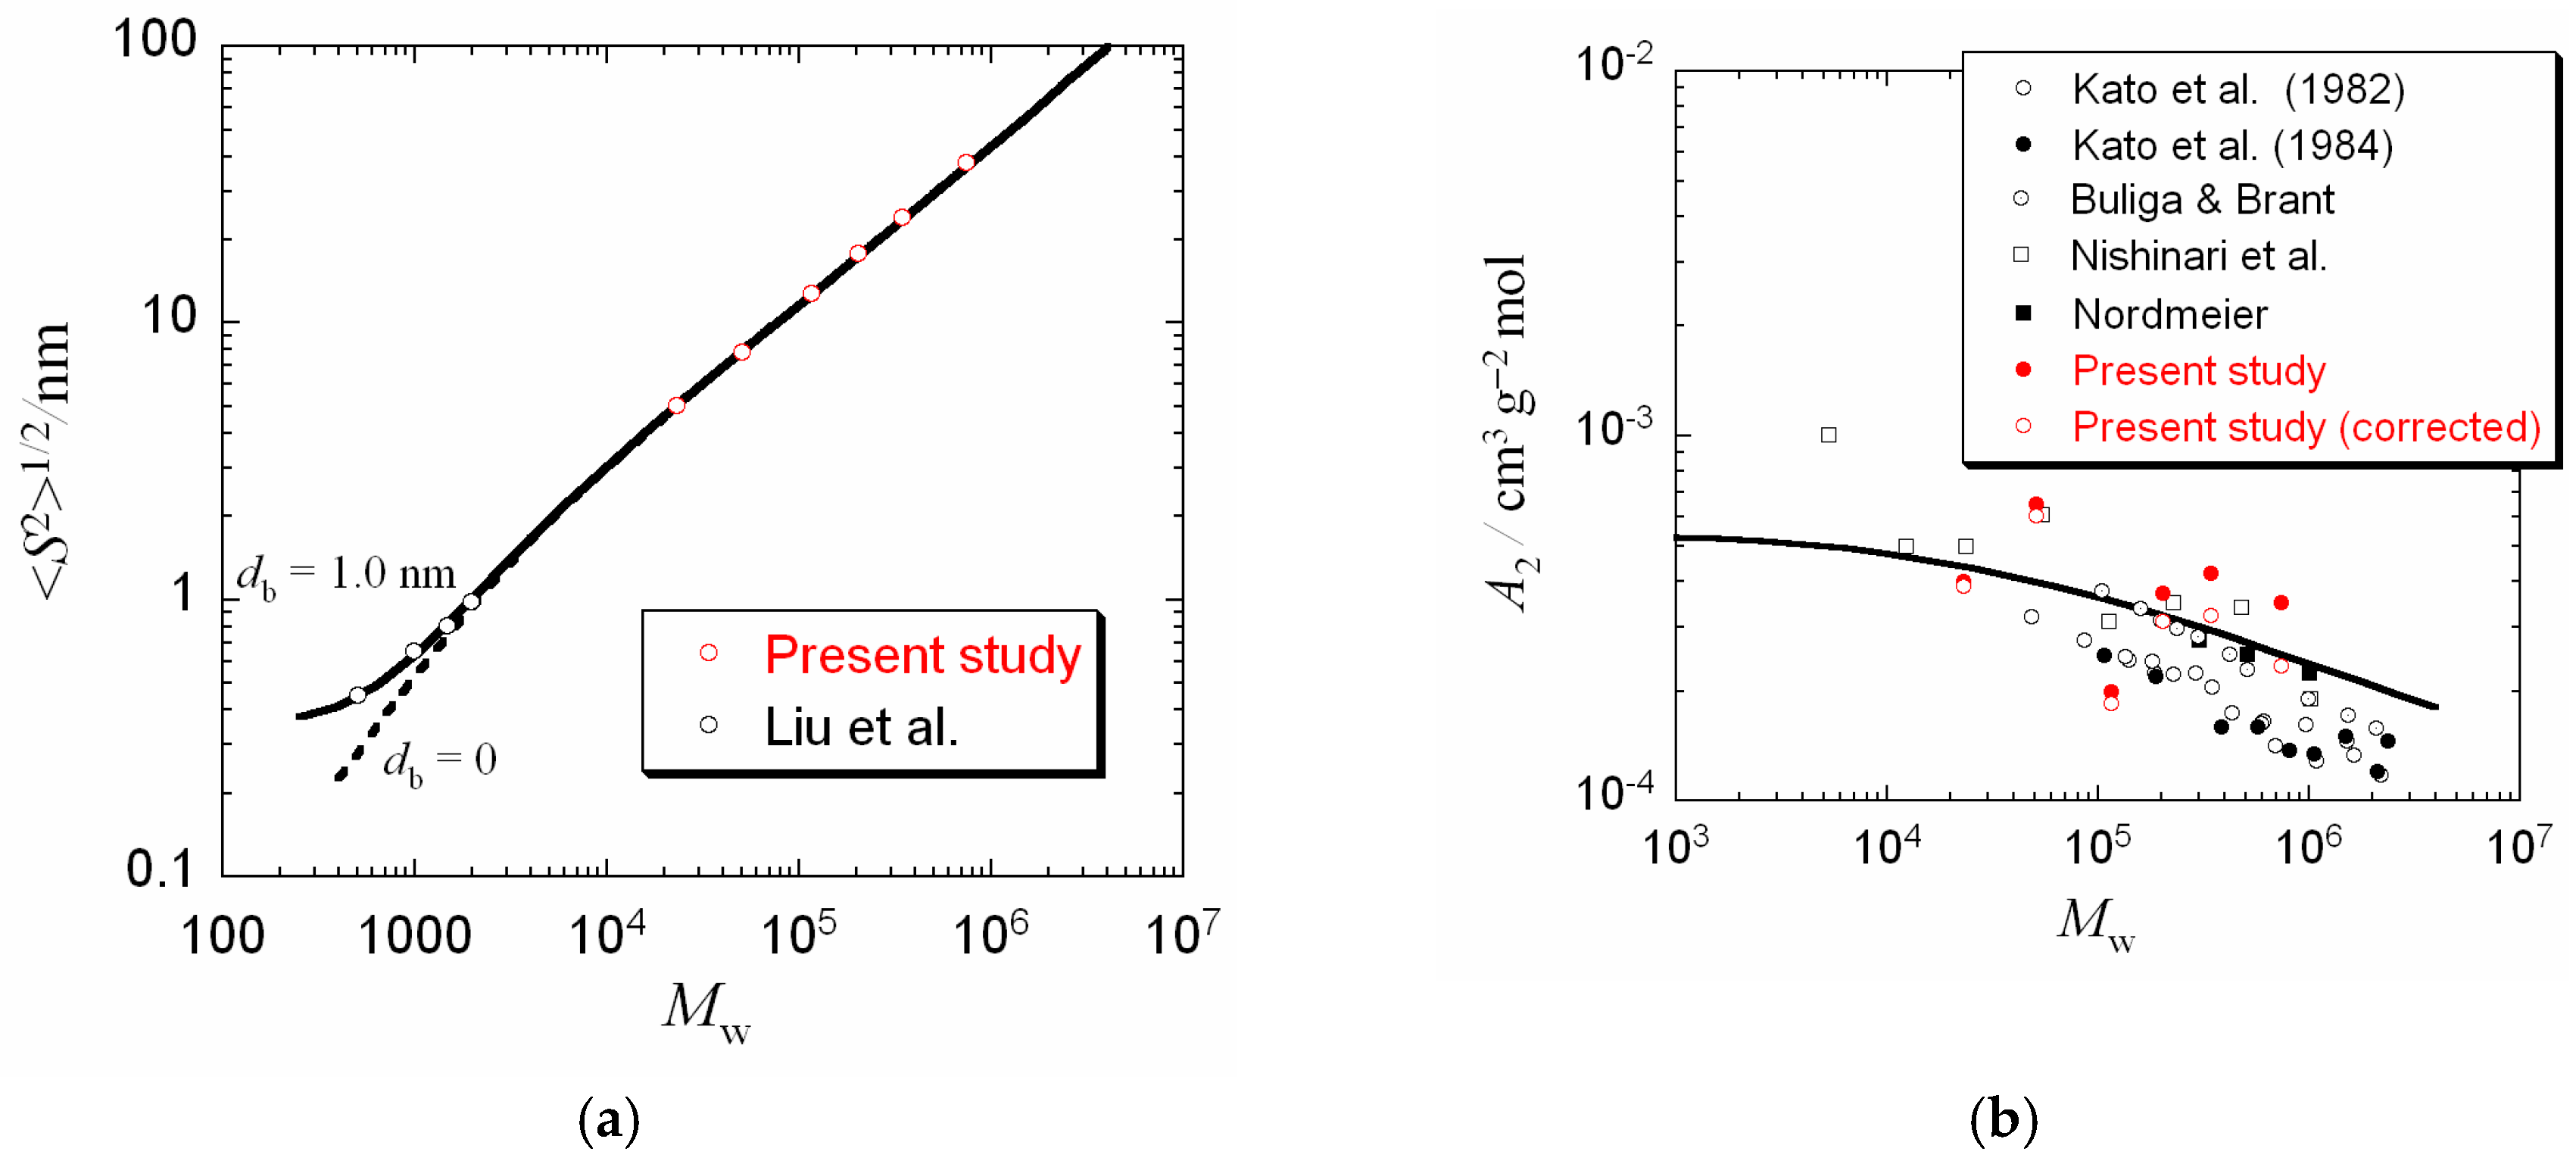
3.2. Radius of Gyration and Second Virial Coefficient
3.3. Wormlike Chain Parameters Determined by Other Methods
4. Discussion
5. Conclusions
Author Contributions
Funding
Acknowledgments
Conflicts of Interest
Appendix A
References
- Prajapati, V.D.; Jani, G.K.; Khanda, S.M. Pullulan: An exopolysaccharide and its various applications. Carbohydr. Polym. 2013, 95, 540–549. [Google Scholar] [CrossRef] [PubMed]
- Singh, R.S.; Kaur, N.; Rana, V.; Kennedy, J.F. Pullulan: A novel molecule for biomedical applications. Carbohydr. Polym. 2017, 171, 102–121. [Google Scholar] [CrossRef]
- Ghimici, L.; Constantin, M. A review of the use of pullulan derivatives in wastewater purification. React. Funct. Polym. 2020, 149, 104510. [Google Scholar] [CrossRef]
- Akiyoshi, K.; Sasaki, Y.; Sunamoto, J. Molecular chaperone-like activity of hydrogel nanoparticles of hydrophobized pullulan: Thermal stabilization with refolding of carbonic anhydrase B. Bioconjug. Chem. 1999, 10, 321–324. [Google Scholar] [CrossRef] [PubMed]
- Nomura, Y.; Ikeda, M.; Yamaguchi, N.; Aoyama, Y.; Akiyoshi, K. Protein refolding assisted by self-assembled nanogels as novel arti¢cial molecular chaperone. FEBS Lett. 2003, 553, 271–276. [Google Scholar] [CrossRef]
- Morimoto, N.; Endo, T.; Iwasaki, Y.; Akiyoshi, K. Design of hybrid hydrogels with self-assembled nanogels as cross-linkers: Interaction with proteins and chaperone-like activity. Biomacromolecules 2005, 6, 1829–1834. [Google Scholar] [CrossRef] [PubMed]
- Sasaki, Y.; Akiyoshi, K. Nanogel engineering for new nanobiomaterials: From chaperoning engineering to biomedical applications. Chem. Rec. 2010, 10, 366–376. [Google Scholar] [CrossRef] [PubMed]
- Morimoto, N.; Hirano, S.; Takahashi, H.; Loethen, S.; David, H.; Thompson, D.H.; Akiyoshi, K. Self-assembled pH-sensitive cholesteryl pullulan nanogel as a protein delivery vehicle. Biomacromolecules 2012, 14, 56–63. [Google Scholar] [CrossRef]
- Goebel, C.V.; Dimpfl, W.L.; Brant, D.A. The conformational energy of maltose and amylose. Macromolecules 1970, 3, 644–654. [Google Scholar] [CrossRef]
- Jordan, R.; Brant, D.A.; Cesàro, A. A Monte Carlo study of the amylosic chain conformation. Biopolymers 1978, 17, 2617–2632. [Google Scholar] [CrossRef]
- Fujii, M.; Nagasaka, K.; Shimada, J.; Yamakawa, H. The model parameters of helical wormlike chains. Macromolecules 1983, 16, 1613–1623. [Google Scholar] [CrossRef]
- Kitamura, S.; Okamoto, T.; Nakata, Y.; Hayashi, T.; Kuge, T. A Monte Carlo study of the excluded-volume effect on the amylosic chain conformation. Biopolymers 1987, 26, 537–548. [Google Scholar] [CrossRef]
- Nakanishi, Y.; Norisuye, T.; Teramoto, A.; Kitamura, S. Conformation of amylose in dimethyl sulfoxide. Macromolecules 1993, 26, 4220–4225. [Google Scholar] [CrossRef]
- Norisuye, T. Conformation and properties of amylose in dilute solution. Food Hydrocoll. 1996, 10, 109–115. [Google Scholar] [CrossRef]
- Buliga, G.S.; Brant, D.A. Theoretical interpretation of the unperturbed aqueous solution configuration of pullulan. Int. J. Biol. Macromol. 1987, 9, 77–86. [Google Scholar] [CrossRef]
- Liu, J.H.-Y.; Brant, D.A.; Kitamura, S.; Kajiwara, K.; Mimura, M. Equilibrium Spatial Distribution of Aqueous Pullulan: Small-Angle X-ray Scattering and Realistic Computer Modeling. Macromolecules 1999, 32, 8611–8620. [Google Scholar] [CrossRef]
- Jaud, S.; Tobias, D.J.; Brant, D.A. Molecular Dynamics Simulations of Aqueous Pullulan Oligomers. Biomacromolecules 2005, 6, 1239–1251. [Google Scholar] [CrossRef]
- Muroga, Y.; Yamada, Y.; Noda, I.; Nagasawa, M. Local conformation of polysaccharides in solution investigated by small-angle x-ray scattering. Macromolecules 1987, 20, 3003–3006. [Google Scholar] [CrossRef]
- Nakamura, Y.; Norisuye, T. Brush-Like Polymers. In Soft-Matter Characterization; Borsali, R., Pecora, R., Eds.; Springer: Berlin, Germany, 2008; pp. 236–286. [Google Scholar] [CrossRef]
- Yoshizaki, T.; Yamakawa, H. Scattering Functions of Wormlike and Helical Wormlike Chains. Macromolecules 1980, 13, 1518–1525. [Google Scholar] [CrossRef]
- Yamakawa, H.; Yoshizaki, T. Helical Wormlike Chains in Polymer Solutions, 2nd ed.; Springer: Berlin/Heidelberg, Germany, 2016; ISBN 978-3-662-48714-3. [Google Scholar] [CrossRef]
- Nagasaka, K.; Yoshizaki, T.; Jiro Shimada, J.; Yamakawa, H. More on the Scattering Function of Helical Wormlike Chains. Macromolecules 1991, 24, 924–931. [Google Scholar] [CrossRef]
- Pedersen, J.S.; Schurtenberger, P. Scattering Functions of Semiflexible Polymers with and without Excluded Volume Effects. Macromolecules 1996, 29, 7602–7612. [Google Scholar] [CrossRef]
- Shimada, J.; Yamakawa, H. Statistical mechanics of helical worm-like chains. XV. Excluded-volume effects. J. Chem. Phys. 1986, 85, 591–600. [Google Scholar] [CrossRef]
- Sato, T.; Jinbo, Y.; Teramoto, A. Light scattering study of semiflexible polymer solutions II. Application of an integral equation theory. Polym. J. 1995, 27, 384–394. [Google Scholar] [CrossRef][Green Version]
- Sato, T.; Norisuye, T.; Fujita, H. Second and third virial coefficients for binary polystyrene mixtures in benzene. J. Polym. Sci. Part B Polym. Phys. 1987, 25, 1–17. [Google Scholar] [CrossRef]
- Kato, T.; Okamoto, T.; Tokuya, T.; Takahashi, A. Solution properties and chain flexibility of pullulan in aqueous solution. Biopolymers 1982, 21, 1623–1633. [Google Scholar] [CrossRef]
- Kato, T.; Katsuki, T.; Takahashi, A. Static and dynamic solution properties of pullulan in a dilute solution. Macromolecules 1984, 17, 1726–1730. [Google Scholar] [CrossRef]
- Buliga, G.S.; Brant, D.A. Temperature and molecular weight dependence of the unperturbed dimensions of aqueous pullulan. Int. J. Biol. Macromol. 1987, 9, 71–76. [Google Scholar] [CrossRef]
- Nishinari, K.; Kohyama, K.; Williams, P.A.; Phillips, G.O.; Burchard, W.; Ogino, K. Solution properties of pullulan. Macromolecules 1991, 24, 5590–5593. [Google Scholar] [CrossRef]
- Nordmeier, E. Static and dynamic light-scattering solution behavior of pullulan and dextran in comparison. J. Phys. Chem. 1993, 97, 5770–5785. [Google Scholar] [CrossRef]
- Yamakawa, H. On the theory of the second virial coefficient for polymer chains. Macromolecules 1992, 25, 1912–1916. [Google Scholar] [CrossRef]
- Flory, P.J. Statistical Mechanics of Chain Molecules; John Wiley and Sons: New York, NY, USA, 1969. [Google Scholar]
- Banks, W.; Greenwood, C.T. Hydrodynamic properties and dimensions of linear potato amylose molecules in dilute aqueous salt solution. Makromol. Chem. 1963, 67, 49–63. [Google Scholar] [CrossRef]
- Banks, W.; Greenwood, C.T. The conformation of amylose in neutral, aqueous salt solution. Carbohydr. Res. 1968, 7, 349–356. [Google Scholar] [CrossRef]
- Ring, S.G.; L’Anson, K.J.; Morris, V.J. Static and dynamic light scattering studies of amylose solutions. Macromolecules 1985, 18, 182–188. [Google Scholar] [CrossRef]
- Rao, V.S.R.; Yathindra, N.; Sundararajan, P.R. Configurational statistics of polysaccharide chains. Part I. Amylase. Biopolymers 1969, 8, 325–333. [Google Scholar] [CrossRef]
- Takahashi, R.; Sato, T.; Terao, K.; Yusa, S. Intermolecular interactions and self-assembly in aqueous solution of a mixture of anionic−neutral and cationic−neutral block copolymers. Macromolecules 2015, 48, 7222–7229. [Google Scholar] [CrossRef]


| Sample | P20 | P50 | P100 | P200 | P400 | P800 |
|---|---|---|---|---|---|---|
| Mw/104 | 2.30 | 5.06 | 11.6 | 20.2 | 34.3 | 73.6 |
| Mw/Mn | 1.08 | 1.09 | 1.11 | 1.31 | 1.30 | 1.23 |
| c/10−3 g cm−3 | 6.84 | 5.11 | 7.61 | 6.16 | 5.48 | 5.79 |
| Sample | P20 | P50 | P100 | P200 | P400 | P800 |
|---|---|---|---|---|---|---|
| ML/nm−1 | 470 a | 470 a | 470 a | 470 a | 470 a | 470 a |
| q/nm | 1.5 | 1.5 | 1.6 | 1.65 | 1.65 | 1.5 |
| B/nm | 0.35 | 0.30 | 0.30 | 0.38 | 0.35 | 0.52 |
| d/nm | 0.77 | 0.77 | 0.89 | 0.77 | 0.89 | 0.84 |
| A2,app (A2 c) b | 4.0 (3.9) | 6.5 (6.0) | 2.0 (1.85) | 3.7 (3.1) | 4.2 (3.2) | 3.5 (2.3) |
| <S2>1/2 (<S2>01/2)/nm d | 4.9 (4.7) | 7.65 (7.1) | 12.5 (11) | 18 (15) | 24 (20) | 37 (28) |
| Method | SAXS a (Present Study) | 〈S2〉1/2 b | [η] b | RHb | A2b |
|---|---|---|---|---|---|
| ML/nm−1 | 470 c | 480 | 470 | 450 | 460 |
| q/nm | 1.6 | 1.6 | 1.8 | 2.0 | 1.8 |
| B/nm | 0.37 | 0.45 | 0.25 | 0.5 | 0.4 |
| db/nm | 0.83 | 1.0 d | 0.45 | 0.50 | - |
© 2020 by the authors. Licensee MDPI, Basel, Switzerland. This article is an open access article distributed under the terms and conditions of the Creative Commons Attribution (CC BY) license (http://creativecommons.org/licenses/by/4.0/).
Share and Cite
Yang, J.; Sato, T. Conformation of Pullulan in Aqueous Solution Studied by Small-Angle X-ray Scattering. Polymers 2020, 12, 1266. https://doi.org/10.3390/polym12061266
Yang J, Sato T. Conformation of Pullulan in Aqueous Solution Studied by Small-Angle X-ray Scattering. Polymers. 2020; 12(6):1266. https://doi.org/10.3390/polym12061266
Chicago/Turabian StyleYang, Jia, and Takahiro Sato. 2020. "Conformation of Pullulan in Aqueous Solution Studied by Small-Angle X-ray Scattering" Polymers 12, no. 6: 1266. https://doi.org/10.3390/polym12061266
APA StyleYang, J., & Sato, T. (2020). Conformation of Pullulan in Aqueous Solution Studied by Small-Angle X-ray Scattering. Polymers, 12(6), 1266. https://doi.org/10.3390/polym12061266