Polyaspartate-Ionene/Na+-Montmorillonite Nanocomposites as Novel Adsorbent for Anionic Dye; Effect of Ionene Structure


 and
and
Abstract
:
1. Introduction
2. Materials and Methods
2.1. Materials
2.2. Instrumentation
2.3. Synthesis of Ionene Compounds
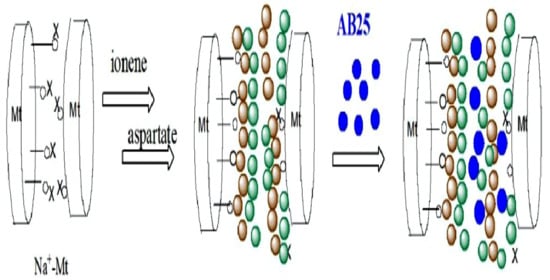
2.4. Chemical Modification of Na+-Mt with Ionene
2.5. Preparation of Nanocomposites ICP-1-3
2.6. Adsorption Studies
3. Results
3.1. Mt-Composites
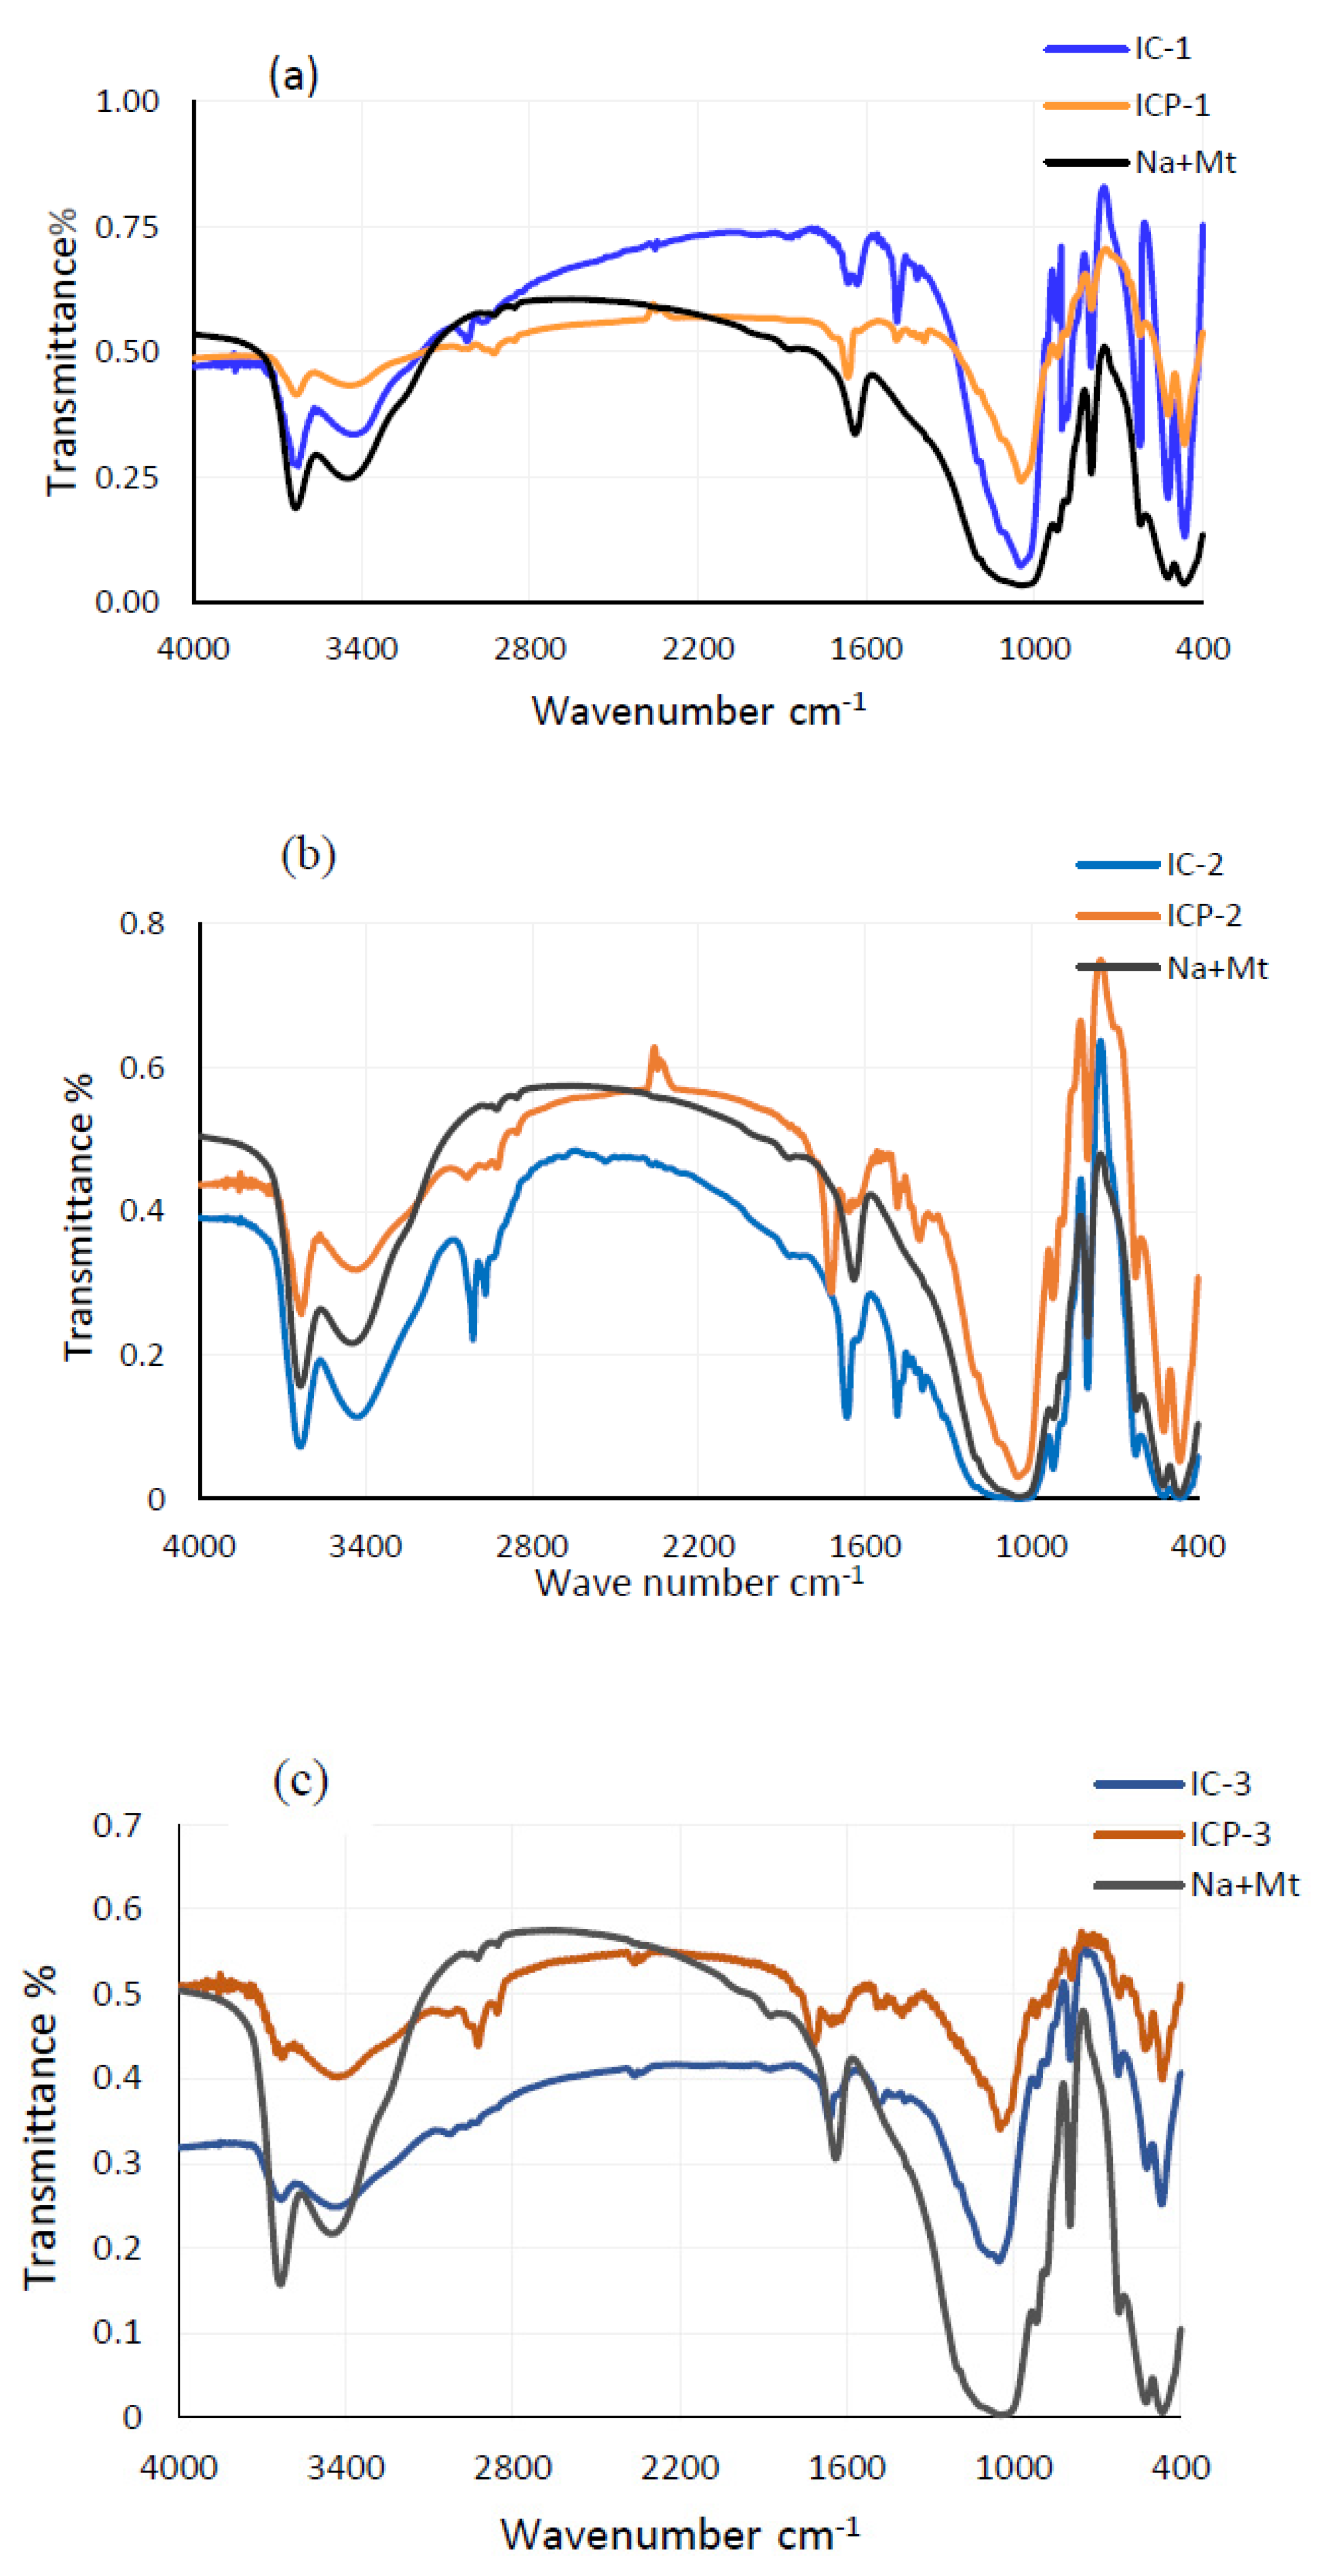
3.2. FTIR Spectra
3.3. PXRD Analysis
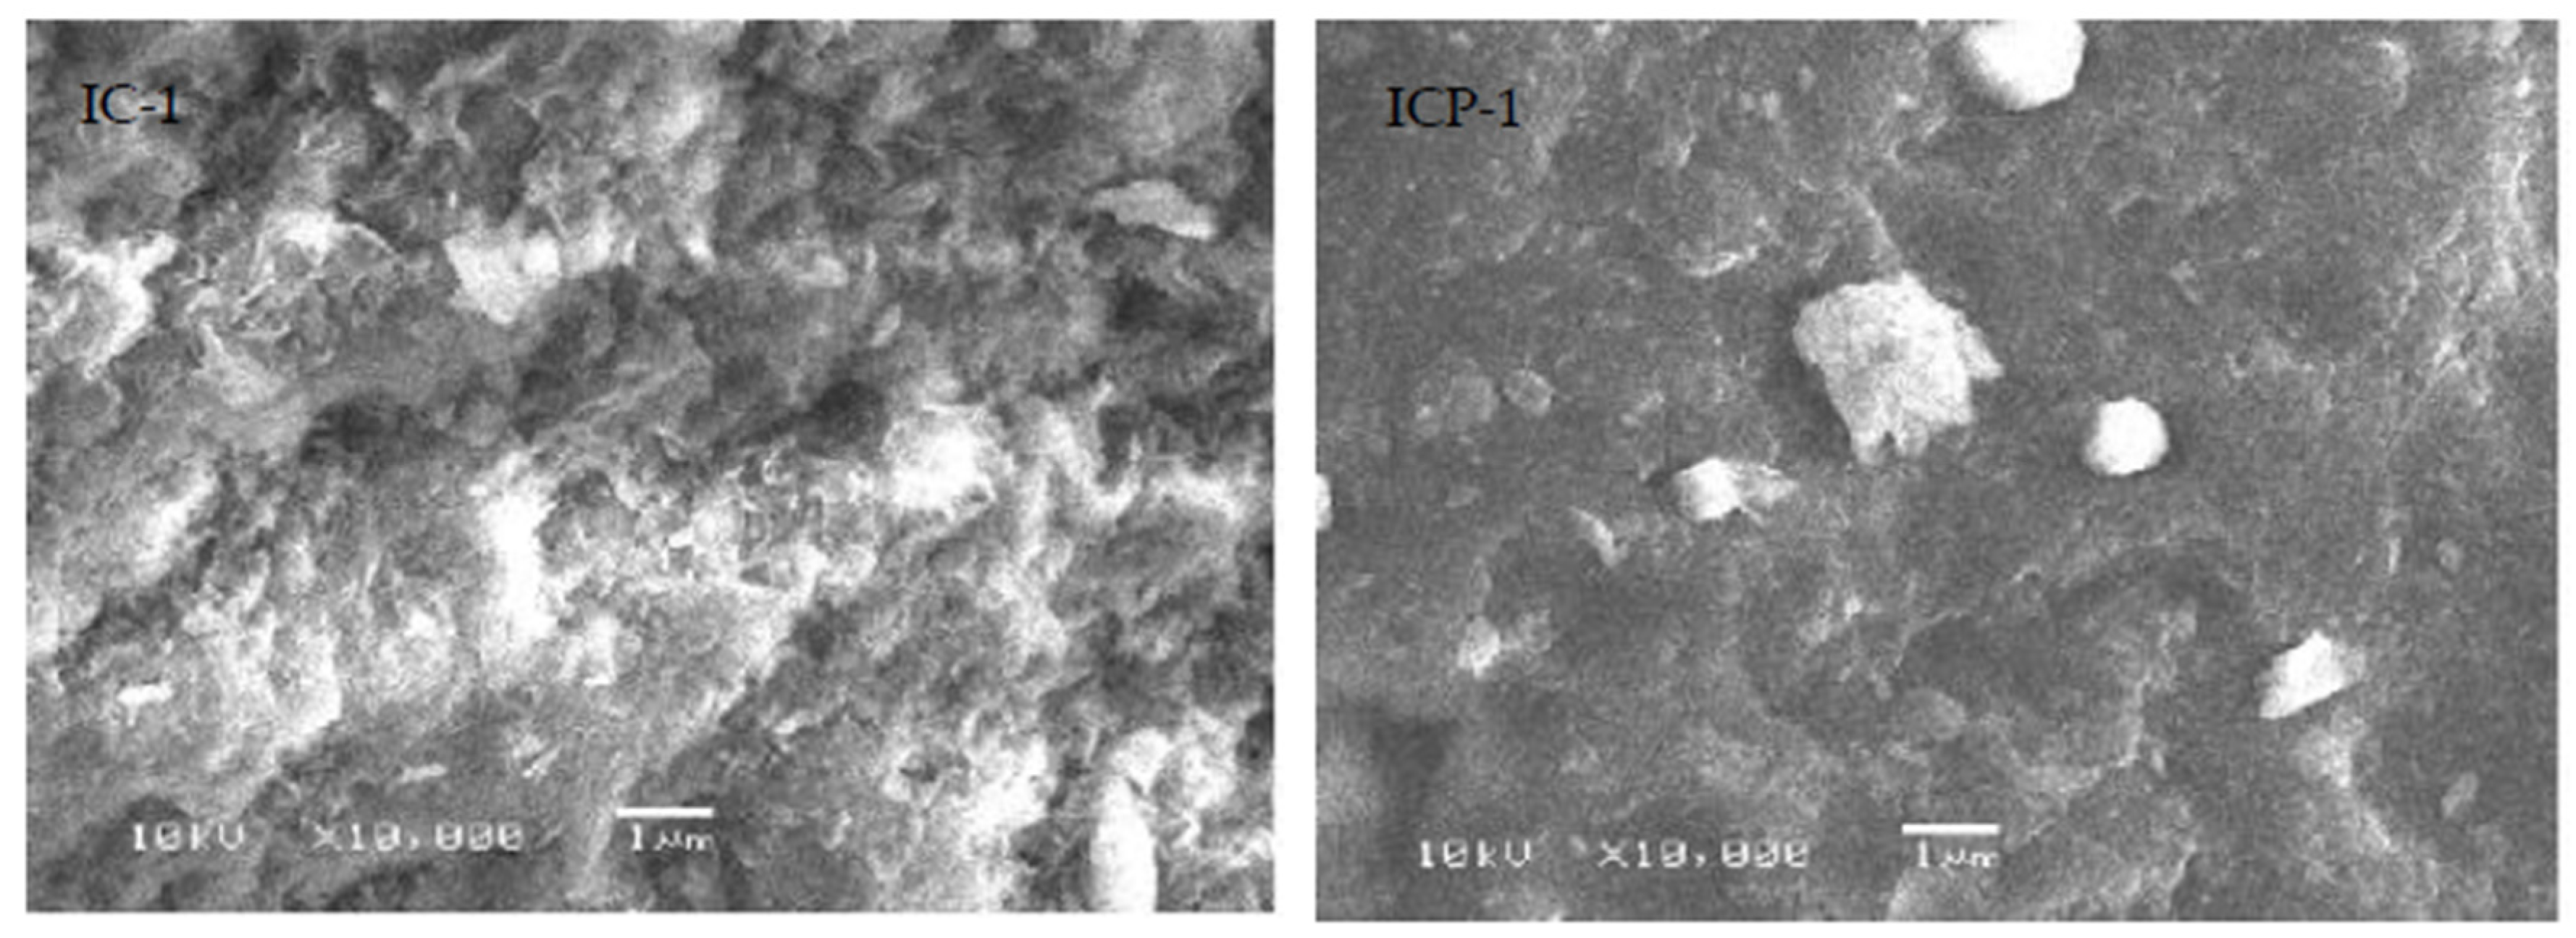
3.4. SEM of ICP Samples
3.5. TEM of ICP Samples
3.6. TGA of Ionene Na+-Mt and Its Modified Derivatives
3.7. BET Surface Area of ICP Nanocomposites
3.8. Adsorption Studies
3.8.1. Effect of Ionene Structure on the Adsorption Efficiency
3.8.2. Adsorption Kinetics
3.8.3. pH Effect
3.8.4. Adsorption Isotherms
3.8.5. Thermodynamic Parameters
3.8.6. Mechanism of Adsorption
3.8.7. Comparison with Other Adsorbents
4. Conclusions
Supplementary Materials
Author Contributions
Funding
Acknowledgments
Conflicts of Interest
References
- Ai, L.; Zhang, C.; Liao, F.; Wang, Y.; Li, M.; Meng, L.; Jiang, J. Removal of methylene blue from aqueous solution with magnetite loaded multi-wall carbon nanotube: Kinetic, isotherm and mechanism analysis. J. Hazard. Mater. 2011, 198, 282–290. [Google Scholar] [CrossRef]
- Wu, T.; Cai, X.; Tan, S.; Li, H.; Liu, J.; Yang, W. Adsorption characteristics of acrylonitrile, p-toluenesulfonic acid, 1-naphthalenesulfonic acid and methyl blue on graphene in aqueous solutions. Chem. Eng. J. 2011, 173, 144–149. [Google Scholar] [CrossRef]
- Almeida, C.A.P.; Debacher, N.A.; Downs, A.J.; Cottet, L.; Mello, C.A.D. Removal of methylene blue from colored effluents by adsorption on montmorillonite clay. J. Colloid Interface Sci. 2009, 332, 46–53. [Google Scholar] [CrossRef]
- Yang, S.T.; Chen, S.; Chang, Y.; Cao, A.; Liu, Y.; Wang, H. Removal of methylene blue from aqueous solution by graphene oxide. J. Colloid Interface Sci. 2011, 359, 24–29. [Google Scholar] [CrossRef]
- Lellis, B.; Fávaro-Polonio, C.Z.; Pamphile, J.A.; Polonio, J.C. Effects of textile dyes on health and the environment and bioremediation potential of living organisms. Biotechnol. Res. Innov. 2019, 3, 275–290. [Google Scholar] [CrossRef]
- Lee, J.W.; Choi, S.P.; Thiruvenkatachari, R.; Shim, W.G.; Moon, H. Submerged microfiltration membrane coupled with alum coagulation/powdered activated carbon adsorption for complete decolorization of reactive dyes. Water Res. 2006, 40, 435–444. [Google Scholar] [CrossRef]
- Porter, S.K.; Scheckel, K.G.; Impellitteri, C.A.; Ryan, J.A. Toxic metals in the environment: Thermodynamic considerations for possible immobilization strategies for Pb, Cd, As, and Hg. Crit. Rev. Environ. Sci. Technol. 2004, 34, 495–604. [Google Scholar] [CrossRef]
- Fan, H.; Zhou, L.; Jiang, X.; Huang, Q.; Lang, W. Adsorption of Cu2+ and methylene blue on dodecyl sulfobetaine surfactant-modified montmorillonite. Appl. Clay Sci. 2014, 95, 150–158. [Google Scholar] [CrossRef]
- Wu, G.; Wang, J.; Thomas, D.F.; Chen, A. Synthesis of F-doped flower-like TiO2 nanostructures with high photoelectrochemical activity. Langmuir 2008, 24, 3503–3509. [Google Scholar] [CrossRef]
- Kousha, M.; Daneshvar, E.; Esmaeli, A.R.; Jokar, M.; Khataee, A.R. Optimization of Acid Blue 25 removal from aqueous solutions by raw, esterified and protonated Jania adhaerens biomass. Int. Biodeterior. Biodegrad. 2012, 69, 97–105. [Google Scholar] [CrossRef]
- Sharma, P.; Borah, D.J.; Das, P.; Das, M.R. Cationic and anionic dye removal from aqueous solution using montmorillonite clay: Evaluation of adsorption parameters and mechanism. Desalin. Water Treat. 2016, 57, 8372–8388. [Google Scholar] [CrossRef]
- Crini, G. Non-conventional low-cost adsorbents for dye removal: A review. Bioresour. Technol. 2006, 97, 1061–1085. [Google Scholar] [CrossRef]
- Kausar, A.; Iqbal, M.; Javed, A.; Aftab, K.; Nazli, Z.i.H.; Bhatti, H.N.; Nouren, S. Dyes adsorption using clay and modified clay: A review. J. Mol. Liq. 2018, 256, 395–407. [Google Scholar] [CrossRef]
- Yagub, M.T.; Sen, T.K.; Afroze, S.; Ang, H.M. Dye and its removal from aqueous solution by adsorption: A review. Adv. Colloid Interface Sci. 2014, 209, 172–184. [Google Scholar] [CrossRef]
- Zhou, C.H.; Keeling, J. Fundamental and applied research on clay minerals: From climate and environment to nanotechnology. Appl. Clay Sci. 2013, 74, 3–9. [Google Scholar] [CrossRef]
- Bailey, G.; Brindely, S.W.; Brown, G.W. Crystal Structures of Clay Minerals and Their X-Ray Identification; Mineralogical Society of Great Britain and Ireland: Twickenham, UK, 1980. [Google Scholar]
- Bergaya, F.; Lagaly, G. Handbook of Clay Science, 2nd ed.; Elsevier: Amsterdam, The Netherlands, 2013. [Google Scholar]
- Chang, J.; Ma, J.; Ma, Q.; Zhang, D.; Qiao, N.; Hu, M.; Ma, H. Adsorption of methylene blue onto Fe3O4/activated montmorillonite nanocomposite. Appl. Clay Sci. 2016, 119, 132–140. [Google Scholar] [CrossRef]
- De Paiva, L.B.; Morales, A.R.; Valenzuela Díaz, F.R. Organoclays: Properties, preparation and applications. Appl. Clay Sci. 2008, 42, 8–24. [Google Scholar] [CrossRef]
- Ollier, R.; Rodriguez, E.; Alvarez, V. Unsaturated polyester/bentonite nanocomposites: Influence of clay modification on final performance. Compos. Part A Appl. Sci. Manuf. 2013, 48, 137–143. [Google Scholar] [CrossRef]
- Carli, L.N.; Daitx, T.S.; Guégan, R.; Giovanela, M.; Crespo, J.S.; Mauler, R.S. Biopolymer nanocomposites based on poly(hydroxybutyrate-co-hydroxyvalerate) reinforced by a non-ionic organoclay. Polym. Int. 2015, 64, 235–241. [Google Scholar] [CrossRef] [Green Version]
- Bertuoli, P.T.; Piazza, D.; Scienza, L.C.; Zattera, A.J. Preparation and characterization of montmorillonite modified with 3-aminopropyltriethoxysilane. Appl. Clay Sci. 2014, 87, 46–51. [Google Scholar] [CrossRef]
- Tsutsui, T. Ionene Polymers: Preparation, properties and applications. In Developments in Ionic Polymers—2; Springer: Dordrecht, The Netherlands, 1986; pp. 163–189. [Google Scholar]
- Guo, C.; Zhou, L.; Lv, J. Effects of expandable graphite and modified ammonium polyphosphate on the flame-retardant and mechanical properties of wood flour-polypropylene composites. Polym. Polym. Compos. 2013, 21, 449–456. [Google Scholar] [CrossRef]
- Rembaum, A.; Baumgartner, W.; Eisenberg, A. Aliphatic ionenes. J. Polym. Sci. Part B Polym. Lett. 1968, 6, 159–171. [Google Scholar] [CrossRef]
- Katchalski, E.; Sela, M. Synthesis and chemical properties of poly-α-amino acids. Adv. Protein Chem. 1958, 13, 243–492. [Google Scholar] [CrossRef]
- Sharma, S.; Dua, A.; Malik, A. Polyaspartic acid based superabsorbent polymers. Eur. Polym. J. 2014, 59, 363–376. [Google Scholar] [CrossRef]
- Zhao, Y.; Su, H.; Fang, L.; Tan, T. Superabsorbent hydrogels from poly (aspartic acid) with salt-, temperature- and pH-responsiveness properties. Polymer 2005, 46, 5368–5376. [Google Scholar] [CrossRef]
- Tiu, B.D.B.; Advincula, R.C. Polymeric corrosion inhibitors for the oil and gas industry: Design principles and mechanism. React. Funct. Polym. 2015, 95, 25–45. [Google Scholar] [CrossRef]
- Weiner, S. Biomineralization: A structural perspective. J. Struct. Biol. 2008, 163, 229–234. [Google Scholar] [CrossRef]
- Mokhtarzadeh, A.; Alibakhshi, A.; Hejazi, M.; Omidi, Y.; Dolatabadi, J.E.N. Bacterial-derived biopolymers: Advanced natural nanomaterials for drug delivery and tissue engineering. TrAC Trends Anal. Chem. 2016, 82, 367–384. [Google Scholar] [CrossRef]
- Liu, S.; Ono, R.J.; Wu, H.; Teo, J.Y.; Liang, Z.C.; Xu, K.; Zhang, M.; Zhong, G.; Tan, J.P.K.; Ng, M.; et al. Highly potent antimicrobial polyionenes with rapid killing kinetics, skin biocompatibility and in vivo bactericidal activity. Biomaterials 2017, 127, 36–48. [Google Scholar] [CrossRef]
- Klein, T.; Moritz, R.-J.; Graupner, R. Polyaspartates and polysuccinimide. In Ullmann’s Encyclopedia of Industrial Chemistry; Wiley-VCH Verlag GmbH & Co. KGaA: Weinheim, Germany, 2008. [Google Scholar]
- Cui, J.; Zhang, Z.; Han, F. Effects of pH on the gel properties of montmorillonite, palygorskite and montmorillonite-palygorskite composite clay. Appl. Clay Sci. 2020, 190, 105543. [Google Scholar] [CrossRef]
- Elsherbiny, A.S.; El-Hefnawy, M.E.; Gemeay, A.H. Linker impact on the adsorption capacity of polyaspartate/montmorillonite composites towards methyl blue removal. Chem. Eng. J. 2017, 315, 142–151. [Google Scholar] [CrossRef]
- Elsherbiny, A.S.; Salem, M.A.; Ismail, A.A. Influence of the alkyl chain length of cyanine dyes on their adsorption by Na+-montmorillonite from aqueous solutions. Chem. Eng. J. 2012, 200–202, 283–290. [Google Scholar] [CrossRef]
- Rembaum, A.; Noguchi, H. Reactions of N,N,N′,N′-Tetramethyl-α, ω-diaminoalkanes with α, ω-Dihaloalkanes. II. x-y Reactions1,2. Macromolecules 1972, 5, 261–269. [Google Scholar] [CrossRef]
- Jeffery, G.H.; Bassett, J.; Mendham, J.; Denney, R.C. Vogel’s Text. Book of Quantitative Chemical Analysis, 5th ed.; John Wiley & Sons, Inc.: Hoboken, NJ, USA, 1989; ISBN 0470215178. [Google Scholar]
- Doll, K.M.; Shogren, R.L.; Holser, R.A.; Willett, J.L.; Swift, G. Polymerization of L-aspartic acid to polysuccinimide and copoly (succinimide-aspartate) in supercritical carbon dioxide. Lett. Org. Chem. 2005, 2, 687–689. [Google Scholar] [CrossRef]
- Pawar, R.R.; Gupta, P.; Sawant, S.Y.; Shahmoradi, B.; Lee, S.M.; Lalhmunsiama. Porous synthetic hectorite clay-alginate composite beads for effective adsorption of methylene blue dye from aqueous solution. Int. J. Biol. Macromol. 2018, 114, 1315–1324. [Google Scholar] [CrossRef]
- Li, Y.; Du, Q.; Liu, T.; Peng, X.; Wang, J.; Sun, J.; Wang, Y.; Wu, S.; Wang, Z.; Xia, Y.; et al. Comparative study of methylene blue dye adsorption onto activated carbon, graphene oxide, and carbon nanotubes. Chem. Eng. Res. Des. 2013, 91, 361–368. [Google Scholar] [CrossRef]
- Liu, H.; Ren, X.; Chen, L. Synthesis and characterization of magnetic metal-organic framework for the adsorptive removal of Rhodamine B from aqueous solution. J. Ind. Eng. Chem. 2016, 34, 278–285. [Google Scholar] [CrossRef]
- Lima, E.C.; Royer, B.; Vaghetti, J.C.P.; Simon, N.M.; da Cunha, B.M.; Pavan, F.A.; Benvenutti, E.V.; Cataluña-Veses, R.; Airoldi, C. Application of Brazilian pine-fruit shell as a biosorbent to removal of reactive red 194 textile dye from aqueous solution. Kinetics and equilibrium study. J. Hazard. Mater. 2008, 155, 536–550. [Google Scholar] [CrossRef]
- Robati, D.; Mirza, B.; Rajabi, M.; Moradi, O.; Tyagi, I.; Agarwal, S.; Gupta, V.K. Removal of hazardous dyes-BR 12 and methyl orange using graphene oxide as an adsorbent from aqueous phase. Chem. Eng. J. 2016, 284, 687–697. [Google Scholar] [CrossRef]
- Lee, H.; Kim, D.; Kim, J.; Ji, M.K.; Han, Y.S.; Park, Y.T.; Yun, H.S.; Choi, J. As(III) and As(V) removal from the aqueous phase via adsorption onto acid mine drainage sludge (AMDS) alginate beads and goethite alginate beads. J. Hazard. Mater. 2015, 292, 146–154. [Google Scholar] [CrossRef]
- Wu, Z.; Zhong, H.; Yuan, X.; Wang, H.; Wang, L.; Chen, X.; Zeng, G.; Wu, Y. Adsorptive removal of methylene blue by rhamnolipid-functionalized graphene oxide from wastewater. Water Res. 2014, 67, 330–344. [Google Scholar] [CrossRef]
- Konicki, W.; Aleksandrzak, M.; Mijowska, E. Equilibrium, kinetic and thermodynamic studies on adsorption of cationic dyes from aqueous solutions using graphene oxide. Chem. Eng. Res. Des. 2017, 123, 35–49. [Google Scholar] [CrossRef]
- Yang, M.; Liu, X.; Qi, Y.; Sun, W.; Men, Y. Preparation of κ-carrageenan/graphene oxide gel beads and their efficient adsorption for methylene blue. J. Colloid Interface Sci. 2017, 506, 669–677. [Google Scholar] [CrossRef]
- Auta, M.; Hameed, B.H. Preparation of waste tea activated carbon using potassium acetate as an activating agent for adsorption of Acid Blue 25 dye. Chem. Eng. J. 2011, 171, 502–509. [Google Scholar] [CrossRef]
- Khalid, K.; Ngah, W.S.W.; Hanafiah, M.A.K.M.; Malek, N.S.A.; Khazaai, S.N.M. Acid Blue 25 Adsorption onto Phosphoric Acid Treated Rubber Leaf Powder. Am. J. Environ. Eng. 2015, 5, 19–25. [Google Scholar] [CrossRef]
- Hanafiah, M.A.K.M.; Ngah, W.S.W.; Zolkafly, S.H.; Teong, L.C.; Majid, Z.A.A. Acid Blue 25 adsorption on base treated Shorea dasyphylla sawdust: Kinetic, isotherm, thermodynamic and spectroscopic analysis. J. Environ. Sci. 2012, 24, 261–268. [Google Scholar] [CrossRef]
- Han, Z.-X.; Zhu, Z.; Wu, D.-D.; Wu, J.; Liu, Y.-R. Adsorption kinetics and thermodynamics of acid blue 25 and methylene blue dye solutions on natural sepiolite. Synth. React. Inorganic Met. Nano-Metal. Chem. 2014, 44, 140–147. [Google Scholar] [CrossRef]
- Krishna, L.S.; Soontarapa, K.; Asmel, N.K.; Kabir, M.A.; Yuzir, A.; Wan Zuhairi, W.Y.; Sarala, Y. Adsorption of acid blue 25 from aqueous solution using zeolite and surfactant modified zeolite. Desalin. Water Treat 2019, 150, 348–360. [Google Scholar] [CrossRef]


| Dye | Chemical Structure | Molar Mass (g/mol) | Dye Purity | Molecular Formula | (nm) | CI |
|---|---|---|---|---|---|---|
| Acid Blue 25 |  | 416.38 | Pure | C20H13N2NaO5S | 600 | 62055 |
| Material | Specific Surface Area (m2 g−1) | Aver. Pore Diam., r (nm) | Total Pore Volume, VT (mL g−1) |
|---|---|---|---|
| Na+-Mt | 725.00 | 1.8 | |
| ICP-1 | 150.50 | 1.32 | 0.065 |
| ICP-2 | 120.19 | 1.32 | 0.522 |
| ICP-3 | 100.20 | 1.15 | 0.652 |
| Surface | C0/10−4 (mol L−1) | qe/10−2 (mol g−1) |
|---|---|---|
| ICP-1 | 0.70 | 2.47 |
| 1.00 | 3.71 | |
| 1.75 | 4.33 | |
| 2.00 | 5.32 | |
| 2.50 | 6.17 | |
| ICP-2 | 0.70 | 1.09 |
| 1.00 | 1.64 | |
| 1.75 | 3.12 | |
| 2.00 | 4.33 | |
| 2.50 | 4.41 | |
| ICP-3 | 0.70 | 1.45 |
| 1.00 | 1.95 | |
| 1.75 | 3.65 | |
| 2.00 | 3.92 | |
| 2.50 | 5.10 |
| Adsorbents | Pseudo-First Order | Pseudo-Second Order | Intra-Particle Diffusion | ||||||||
|---|---|---|---|---|---|---|---|---|---|---|---|
| qe (10−4 mol g−1) | k1 (min−1) | R2 | qe,exp (mol g−1) | qe,cal (mol g−1) | k2 (103 mol g−1 min−1) | R2 | kp1 (mol g−1 min−0.5) | R2 | kp2 (mol g−1 min−0.5) | R2 | |
| Linear form | |||||||||||
| ICP-1 | 8.97 | 0.102 | 0.871 | 0.053 | 0.050 | 0.126 | 1.00 | 0.040 | 0.959 | 3.42 | 0.745 |
| ICP-2 | 94.6 | 0.051 | 0.938 | 0.039 | 0.039 | 13.900 | 0.999 | 0.016 | 0.876 | 29.60 | 0.941 |
| ICP-3 | 218 | 0.445 | 0.445 | 0.043 | 0.044 | 35.400 | 0.999 | 0.008 | 0.953 | 61.60 | 0.795 |
| Non-linear form | |||||||||||
| ICP-1 | 373 | 2.300 | 0.983 | 0.053 | 0.038 | 0.162 | 0.992 | - | - | - | - |
| ICP-2 | 375 | 2.500 | 0.981 | 0.039 | 0.038 | 0.153 | 0.991 | - | - | - | - |
| ICP-3 | 389 | 0.363 | 0.828 | 0.043 | 0.410 | 0.015 | 0.921 | - | - | - | - |
| Model | Parameters | Temperature (K) | ||||||||
|---|---|---|---|---|---|---|---|---|---|---|
| 298 | 308 | 318 | ||||||||
| ICP-1 | ICP-2 | ICP-3 | ICP-1 | ICP-2 | ICP-3 | ICP-1 | ICP-2 | ICP-3 | ||
| Langmuir | qmax (mol/g) | 0.129 | 0.043 | - | 0.189 | 0.051 | 0.182 | 0.045 | - | |
| KL × 104 (L/mol) | 27.90 | 0.787 | - | 19.3 | 0.708 | 22.00 | 0.595 | - | ||
| R2 | 0.895 | 0.948 | - | 0.782 | 0.697 | 0.887 | 0.833 | - | ||
| Freundlich | 1/n | 1.630 | 1.420 | 0.921 | 1.42 | 1.470 | 0.954 | 1.350 | 1.530 | 0.998 |
| KF (mol/g (L/mol)1/n) | 0.595 | 423.00 | 1.860 | 2.30 | 152.0 | 10.670 | 3.620 | 111 | 22.700 | |
| R2 | 0.930 | 0.995 | 0.956 | 0.95 | 0.960 | 0.967 | 0.984 | 0.976 | 0.970 | |
| D-R | qm (mol/g) | 2.790 | 48.500 | 211.00 | 8.870 | 28.190 | - | 6.600 | 22.700 | - |
| KD-R (mol2·J−2) | −0.004 | −0.013 | −124.00 | −0.010 | −0.011 | - | −0.004 | −0.011 | - | |
| E (kJ·mol−1) | 11.130 | 6.230 | 0.064 | 10.530 | 6.700 | - | 10.980 | 2.160 | - | |
| R2 | 0.931 | 0.995 | 0.955 | 0.952 | 0.952 | - | 0.976 | 0.974 | - | |
| Adsorbent | Temp (K) | Kd × 103 (g·L−1) | ΔH (kJ·moL—1) | ΔG (kJ·moL−1) | ΔS (J·moL−1·K−1) |
|---|---|---|---|---|---|
| ICP-1 | 298 | 25.060 | 8.181 | −25.15 | 111.8 |
| 308 | 29.750 | −26.27 | |||
| 318 | 30.810 | −27.38 | |||
| ICP-2 | 298 | 0.582 | −11.5 | −15.88 | 14.69 |
| 308 | 0.569 | −16.02 | |||
| 318 | 0.434 | −16.17 | |||
| ICP-3 | 298 | 0.250 | 127.2 | −14.6 | 475.9 |
| 308 | 4.119 | −19.36 | |||
| 318 | 6.163 | −24.12 |
| Adsorbents | qmax (mg/g) | Conditions | Reference |
|---|---|---|---|
| Waste tea activated carbon | 203.3 | 300 K, m = 0.2 g, V = 0.25 L | [49] |
| Phosphoric acid treated rubber leaf powder | 28.09 | 320 K, pH 2, m = 0.1 g | [50] |
| Treated Shorea dasyphylla Sawdust | 24.39 | 300 K, pH 2, m = 0.1 g, v = 0.05 L | [51] |
| Natural Sepiolite | 53.78 | 293 K, pH 3, V = 0.25 L | [52] |
| Zeolite | 64.2 | 300 K | [53] |
| Zeolite-CTAB | 112.4 | 333 K | [53] |
| ICP-1 | 53.7 | 298 K, pH 7, m = 0.04 g, V = 0.006 L | This study |
| ICP-2 | 17.9 | 298 K, pH 7, m = 0.04 g, V = 0.006 L | This study |
Publisher’s Note: MDPI stays neutral with regard to jurisdictional claims in published maps and institutional affiliations. |
© 2020 by the authors. Licensee MDPI, Basel, Switzerland. This article is an open access article distributed under the terms and conditions of the Creative Commons Attribution (CC BY) license (http://creativecommons.org/licenses/by/4.0/).
Share and Cite
El-Hamshary, H.; Elsherbiny, A.S.; El-Newehy, M.H.; EL-Hefnawy, M.E. Polyaspartate-Ionene/Na+-Montmorillonite Nanocomposites as Novel Adsorbent for Anionic Dye; Effect of Ionene Structure. Polymers 2020, 12, 2843. https://doi.org/10.3390/polym12122843
El-Hamshary H, Elsherbiny AS, El-Newehy MH, EL-Hefnawy ME. Polyaspartate-Ionene/Na+-Montmorillonite Nanocomposites as Novel Adsorbent for Anionic Dye; Effect of Ionene Structure. Polymers. 2020; 12(12):2843. https://doi.org/10.3390/polym12122843
Chicago/Turabian StyleEl-Hamshary, Hany, Abeer S. Elsherbiny, Mohamed H. El-Newehy, and Mohamed E. EL-Hefnawy. 2020. "Polyaspartate-Ionene/Na+-Montmorillonite Nanocomposites as Novel Adsorbent for Anionic Dye; Effect of Ionene Structure" Polymers 12, no. 12: 2843. https://doi.org/10.3390/polym12122843
APA StyleEl-Hamshary, H., Elsherbiny, A. S., El-Newehy, M. H., & EL-Hefnawy, M. E. (2020). Polyaspartate-Ionene/Na+-Montmorillonite Nanocomposites as Novel Adsorbent for Anionic Dye; Effect of Ionene Structure. Polymers, 12(12), 2843. https://doi.org/10.3390/polym12122843