One-Step Bark-Like Imitated Polypropylene (PP)/Polycarbonate (PC) Nanofibrous Meltblown Membrane for Efficient Particulate Matter Removal

 ,
,  and
and 
Abstract

1. Introduction
2. Experimental Section
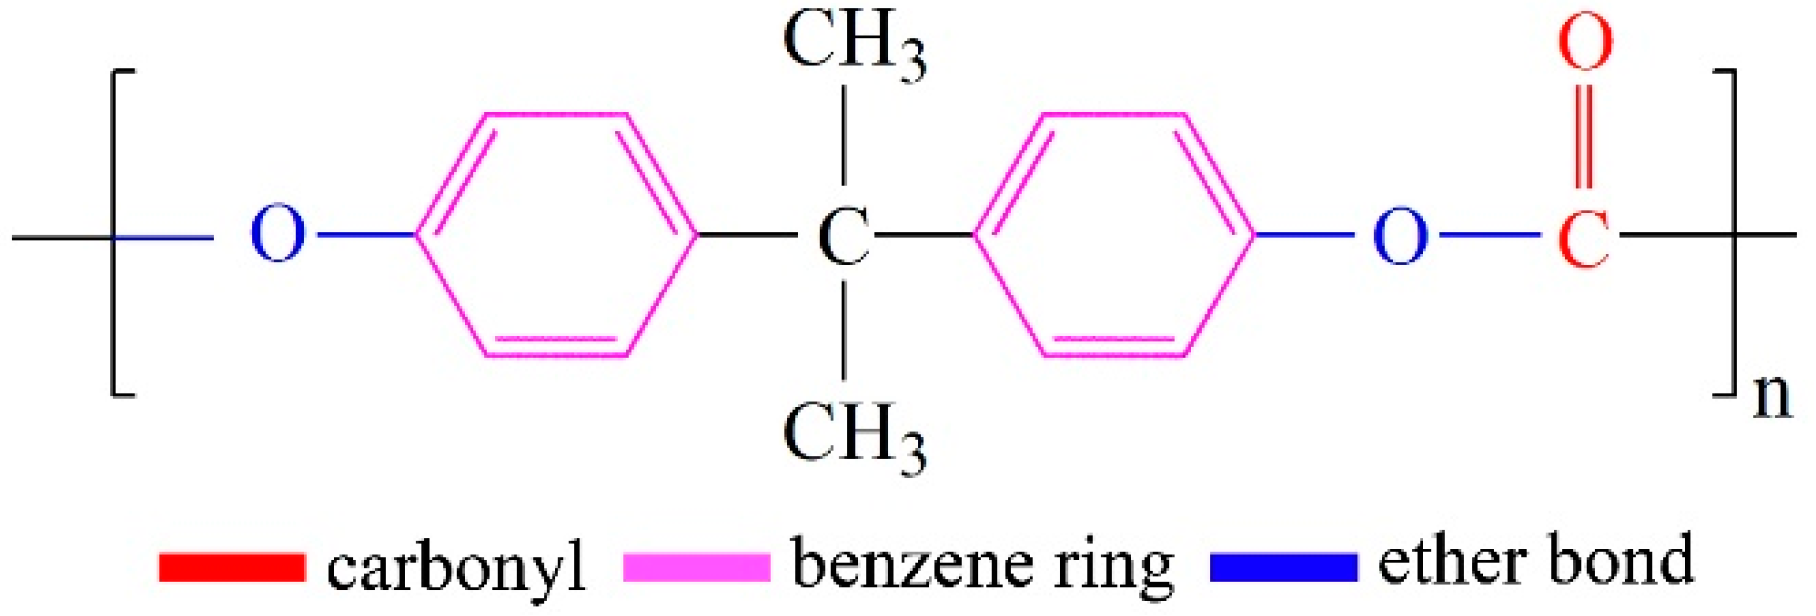
2.1. Materials
2.2. Preparation of the PP/PC Masterbatches
2.3. Preparation of the PP/PC Membranes
2.4. Characterization
2.5. Fiber Diameter Measurements
2.6. Fiber Surface Roughness Measurements
2.7. Surface Potential Measurements
2.8. Filtration Efficiency Measurements
2.9. Water Contact Angle and Water Vapor Transmission Measurements
3. Results and Discussions
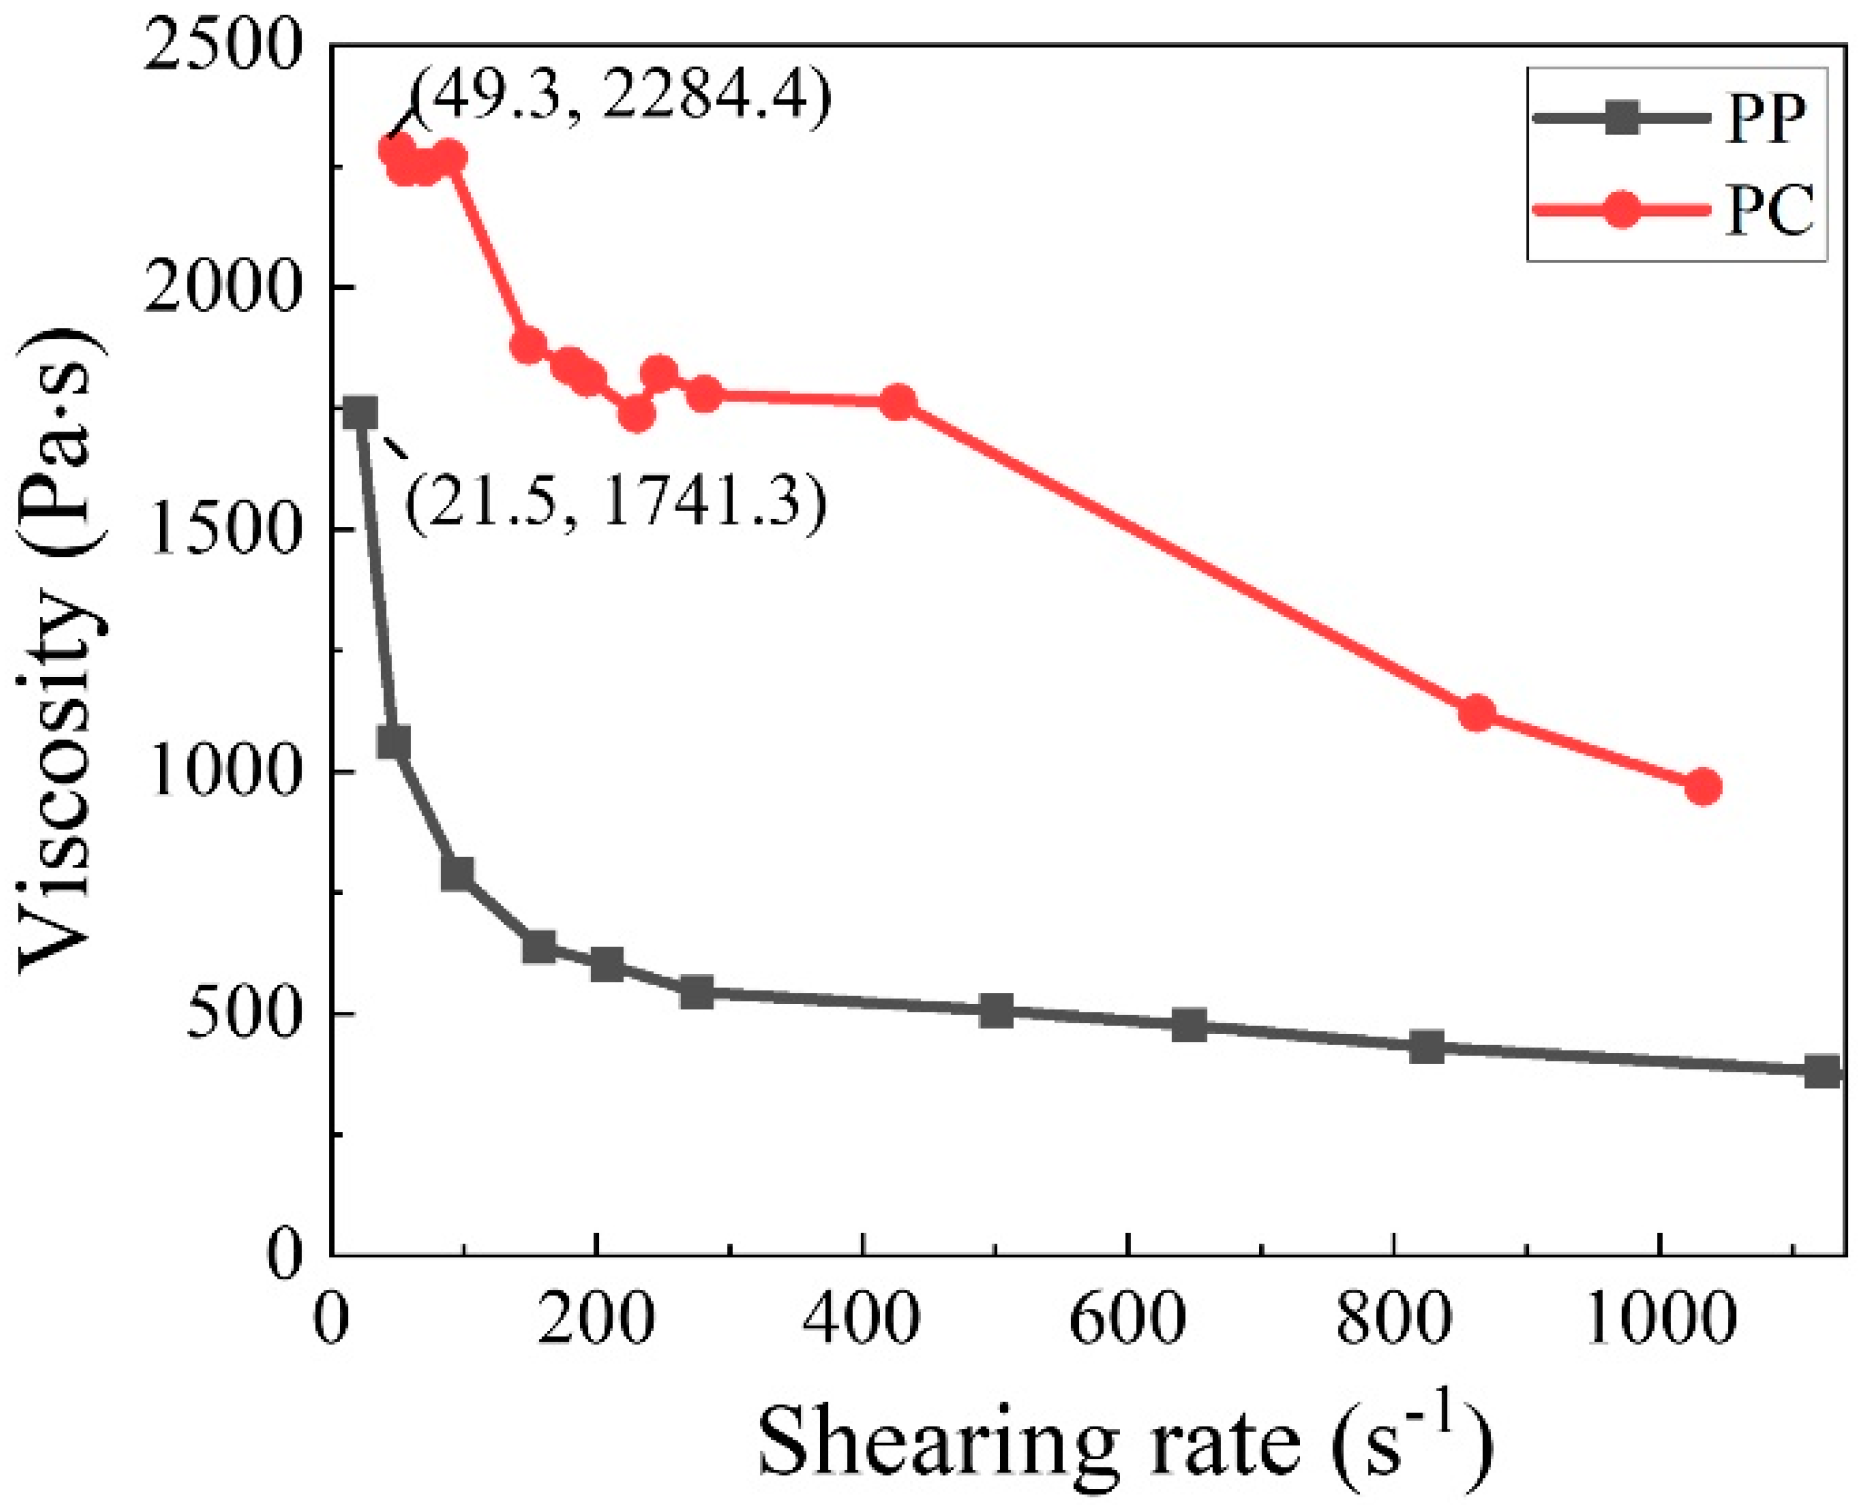
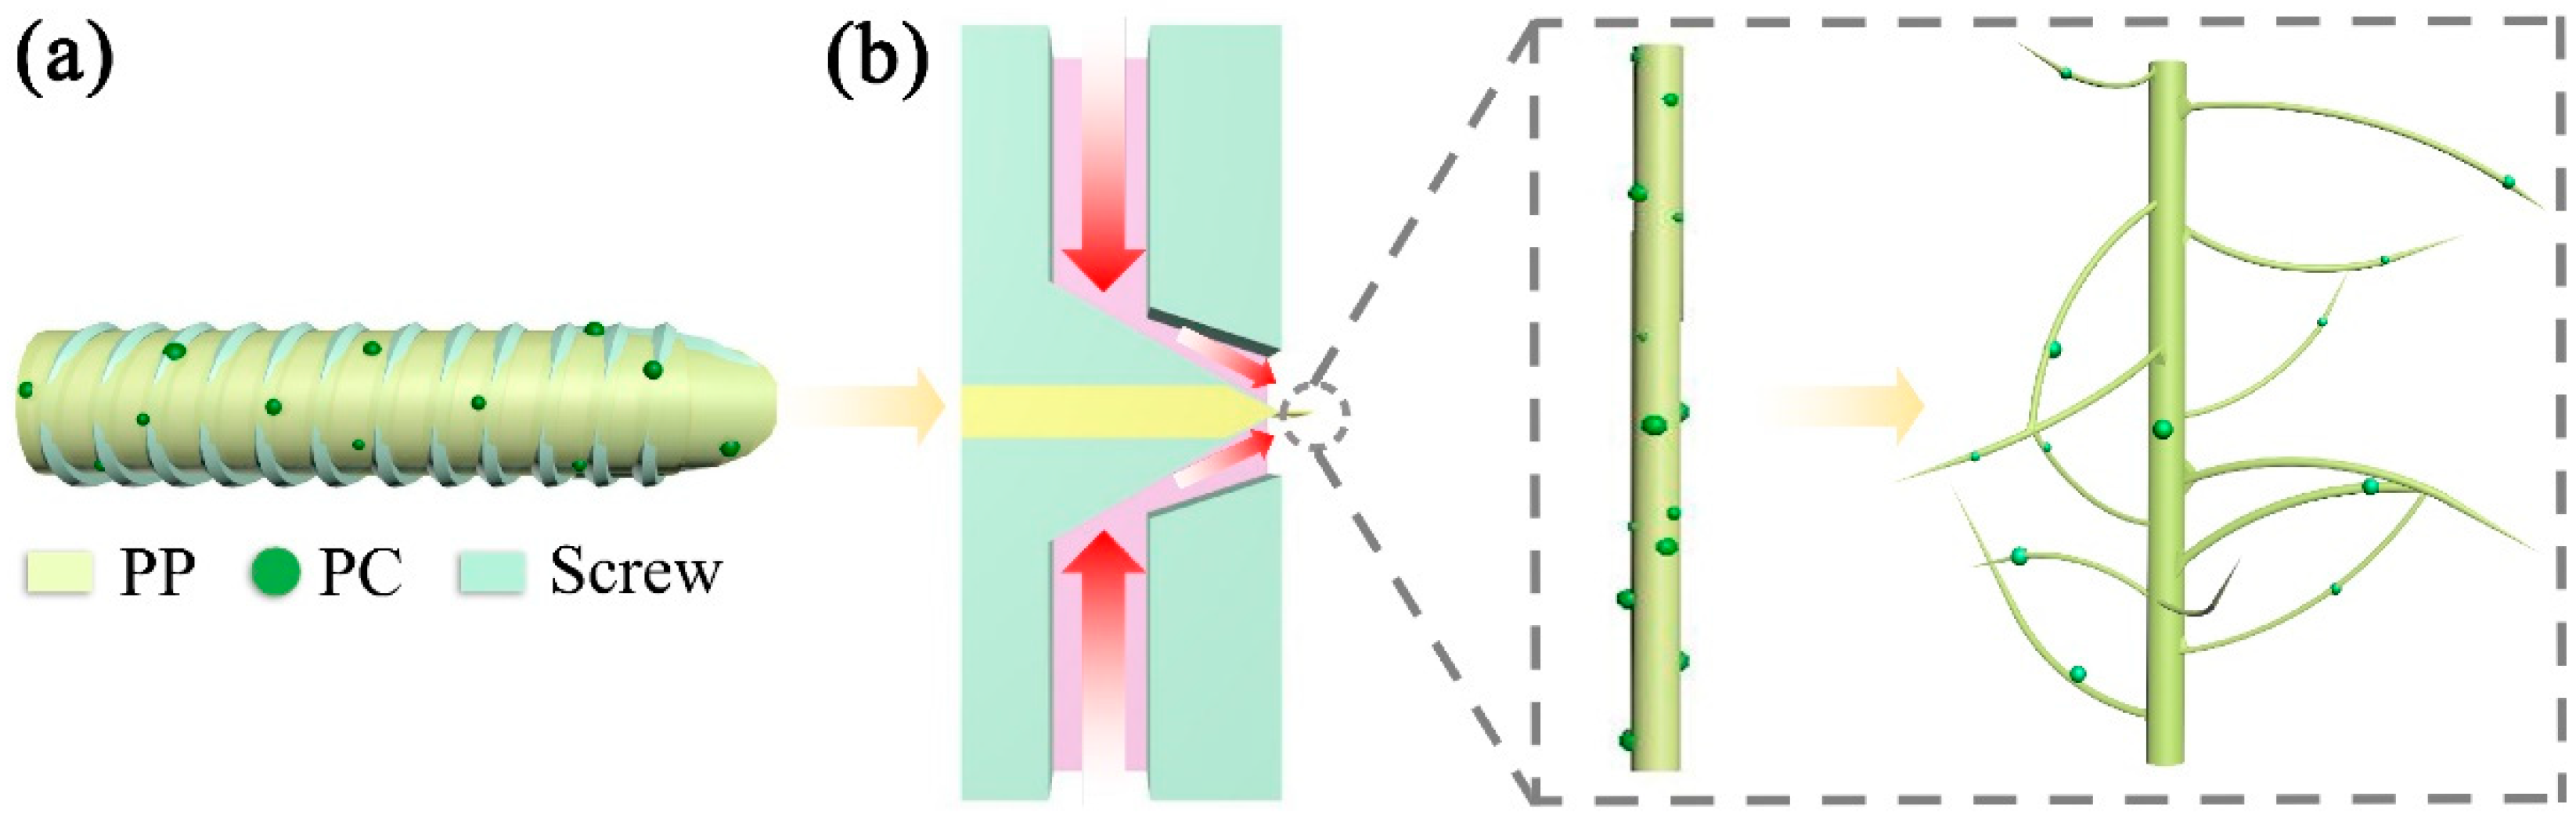
3.1. Microscopic Characteristics of Meltblown Membranes
3.2. Fiber Diameter
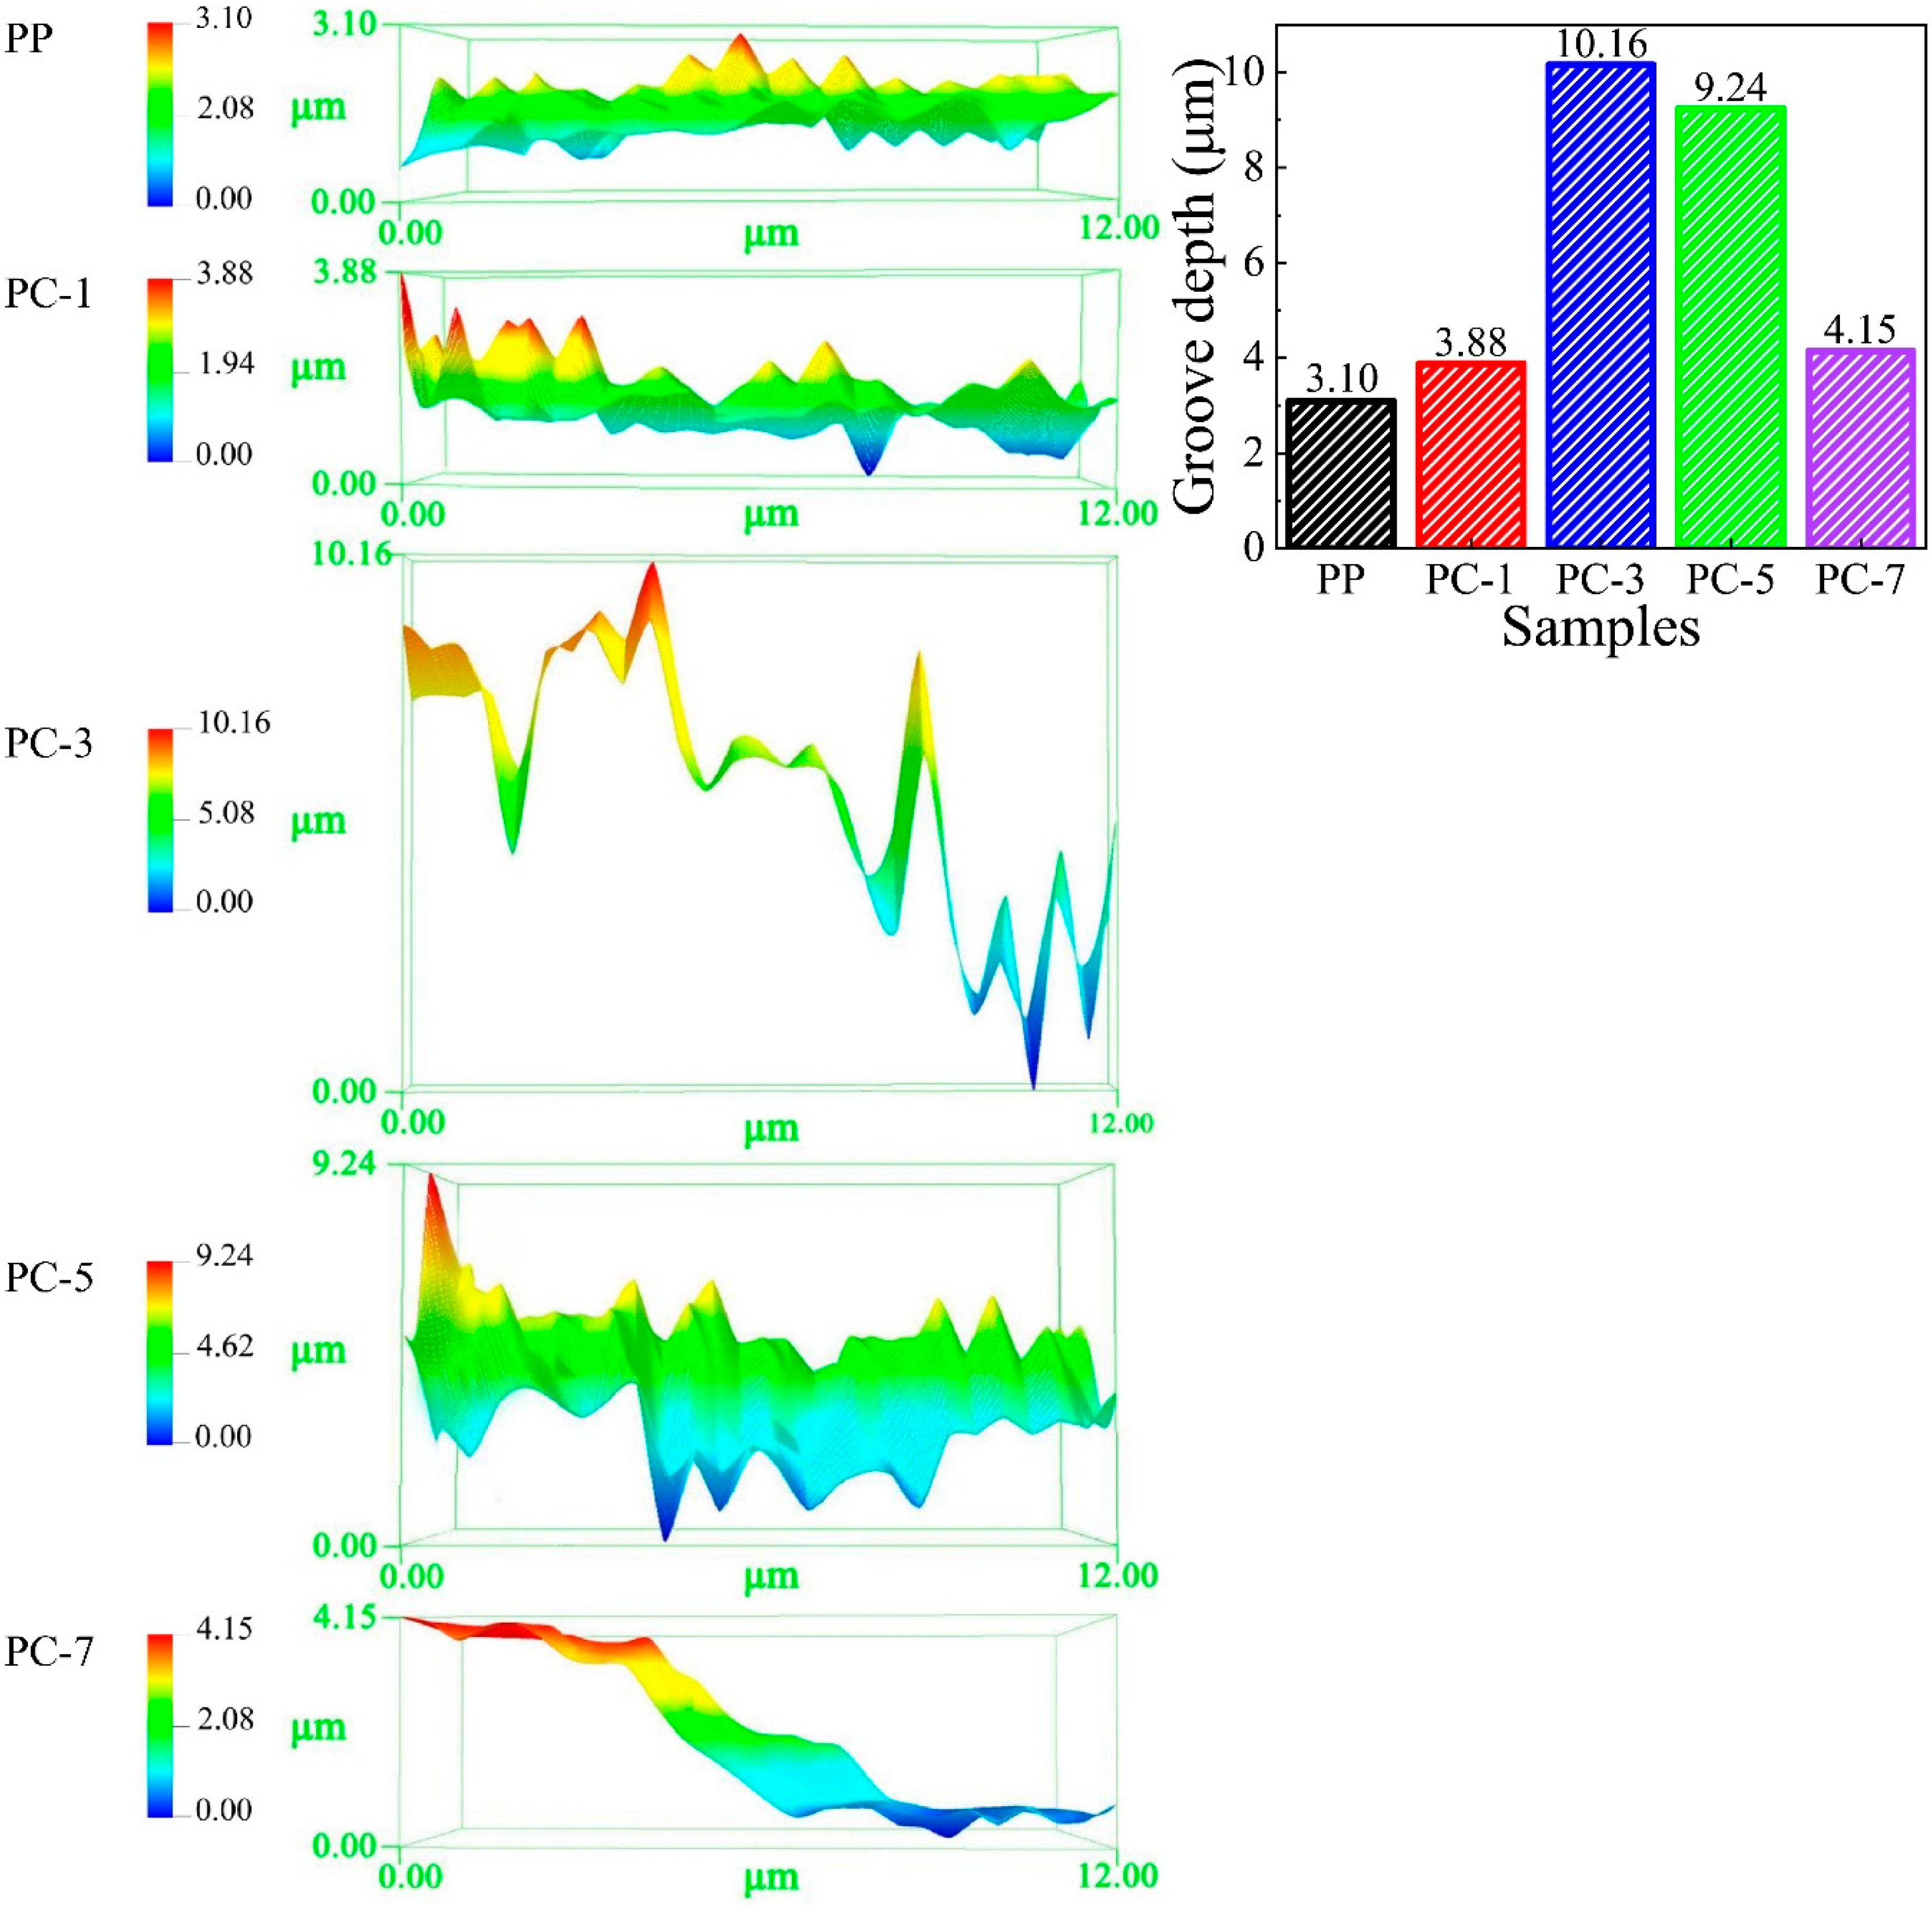
3.3. Fiber Surface Morphology
3.4. Surface Potential of Membranes
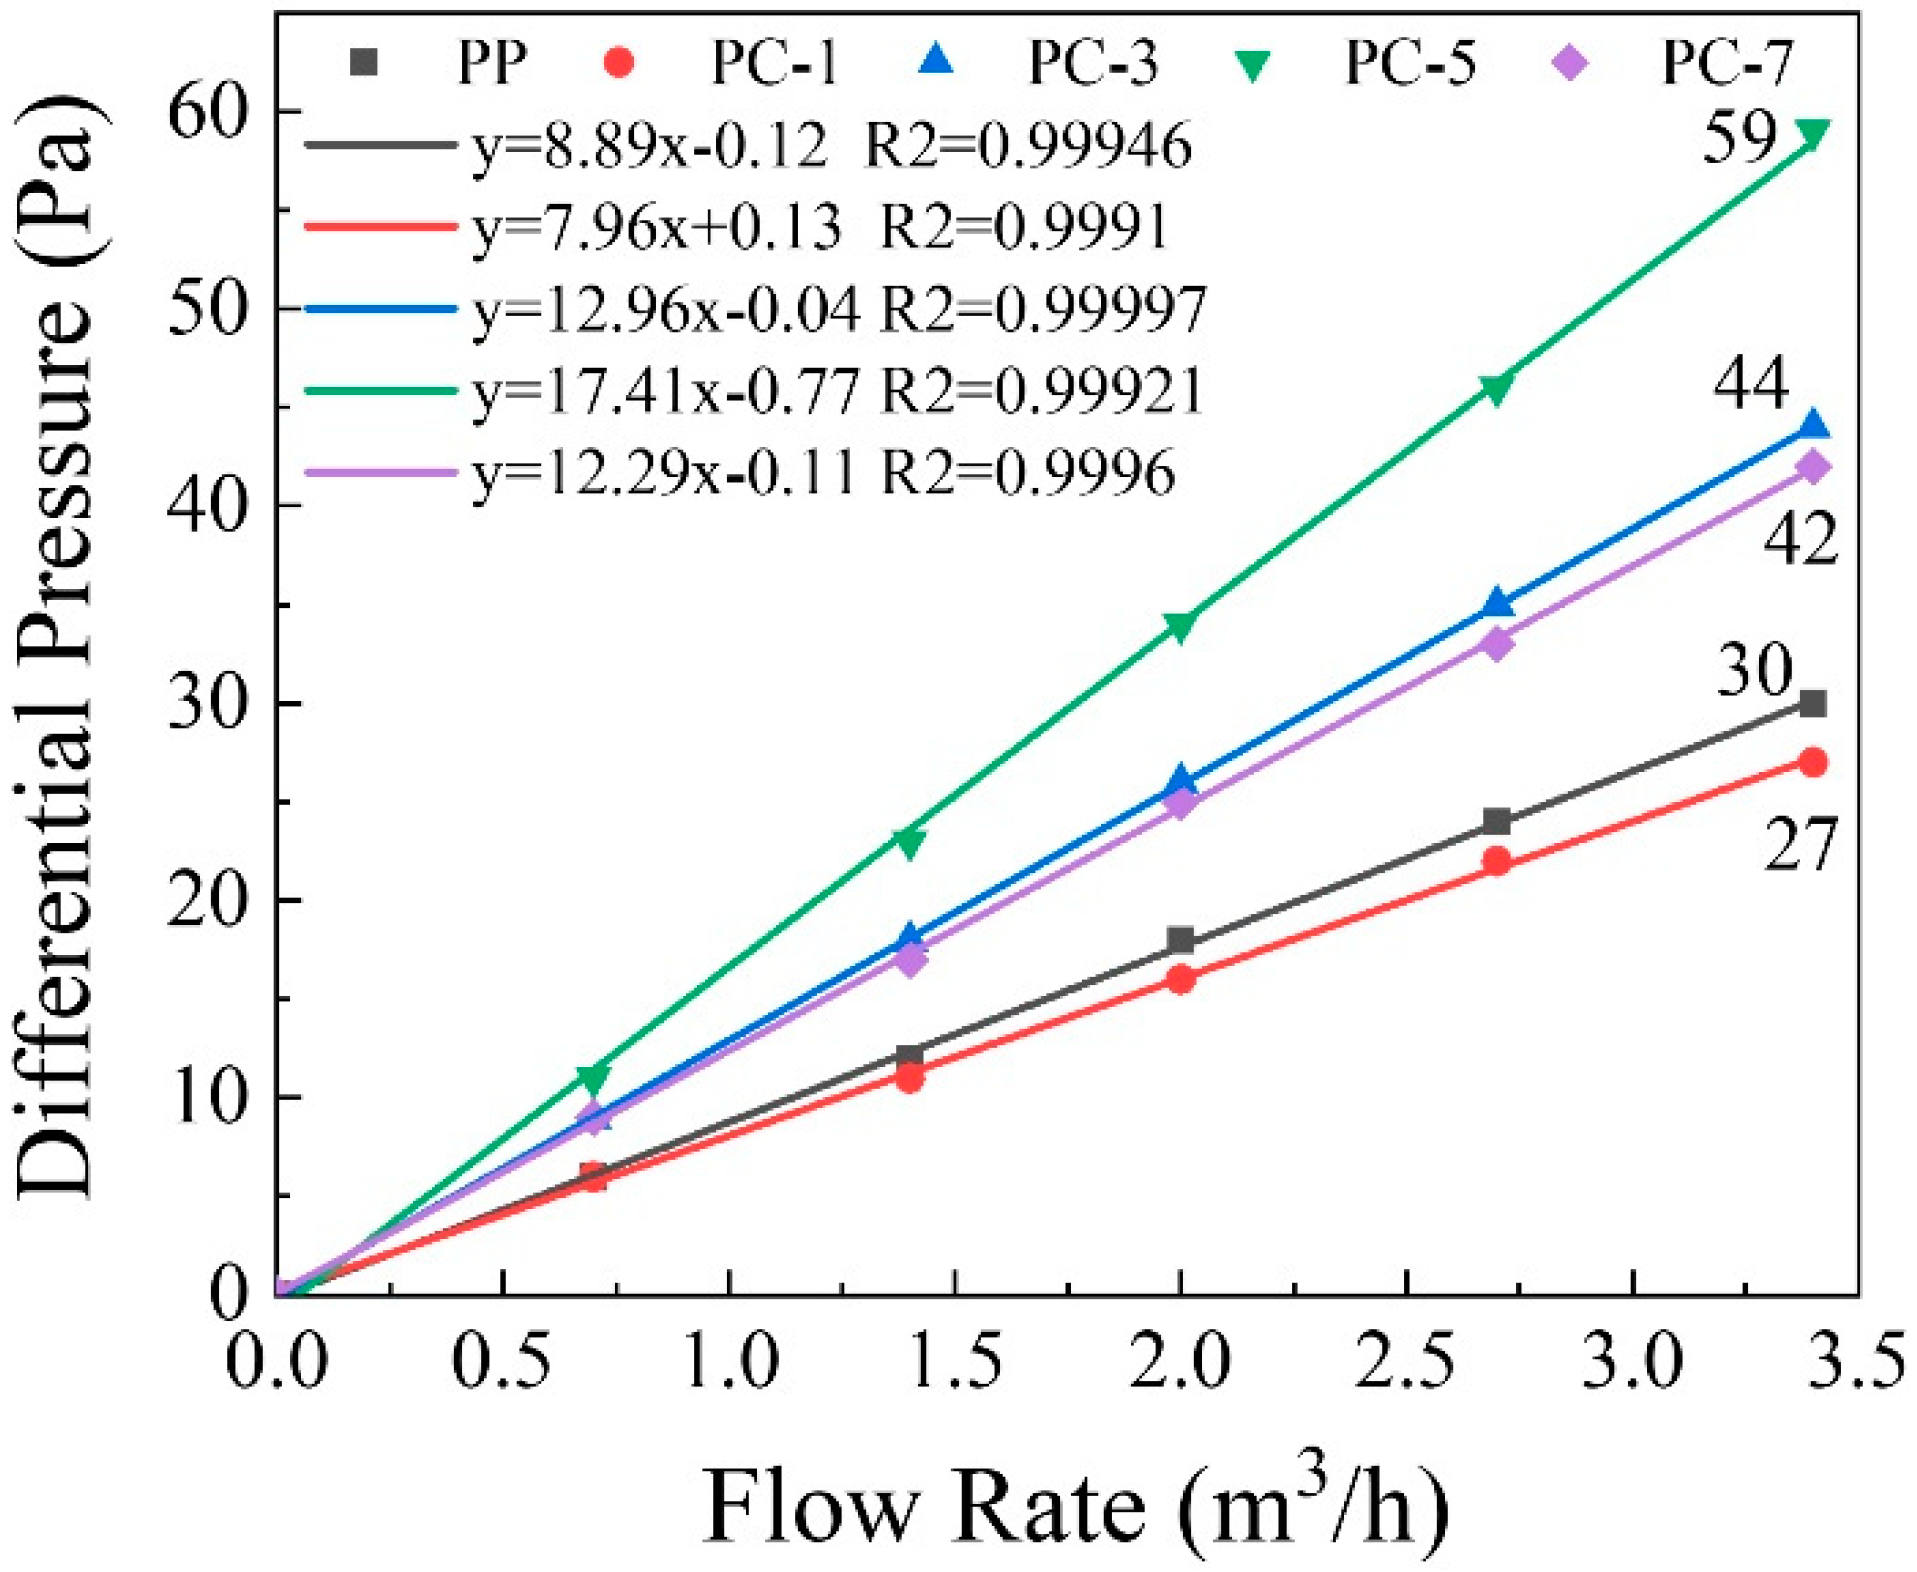
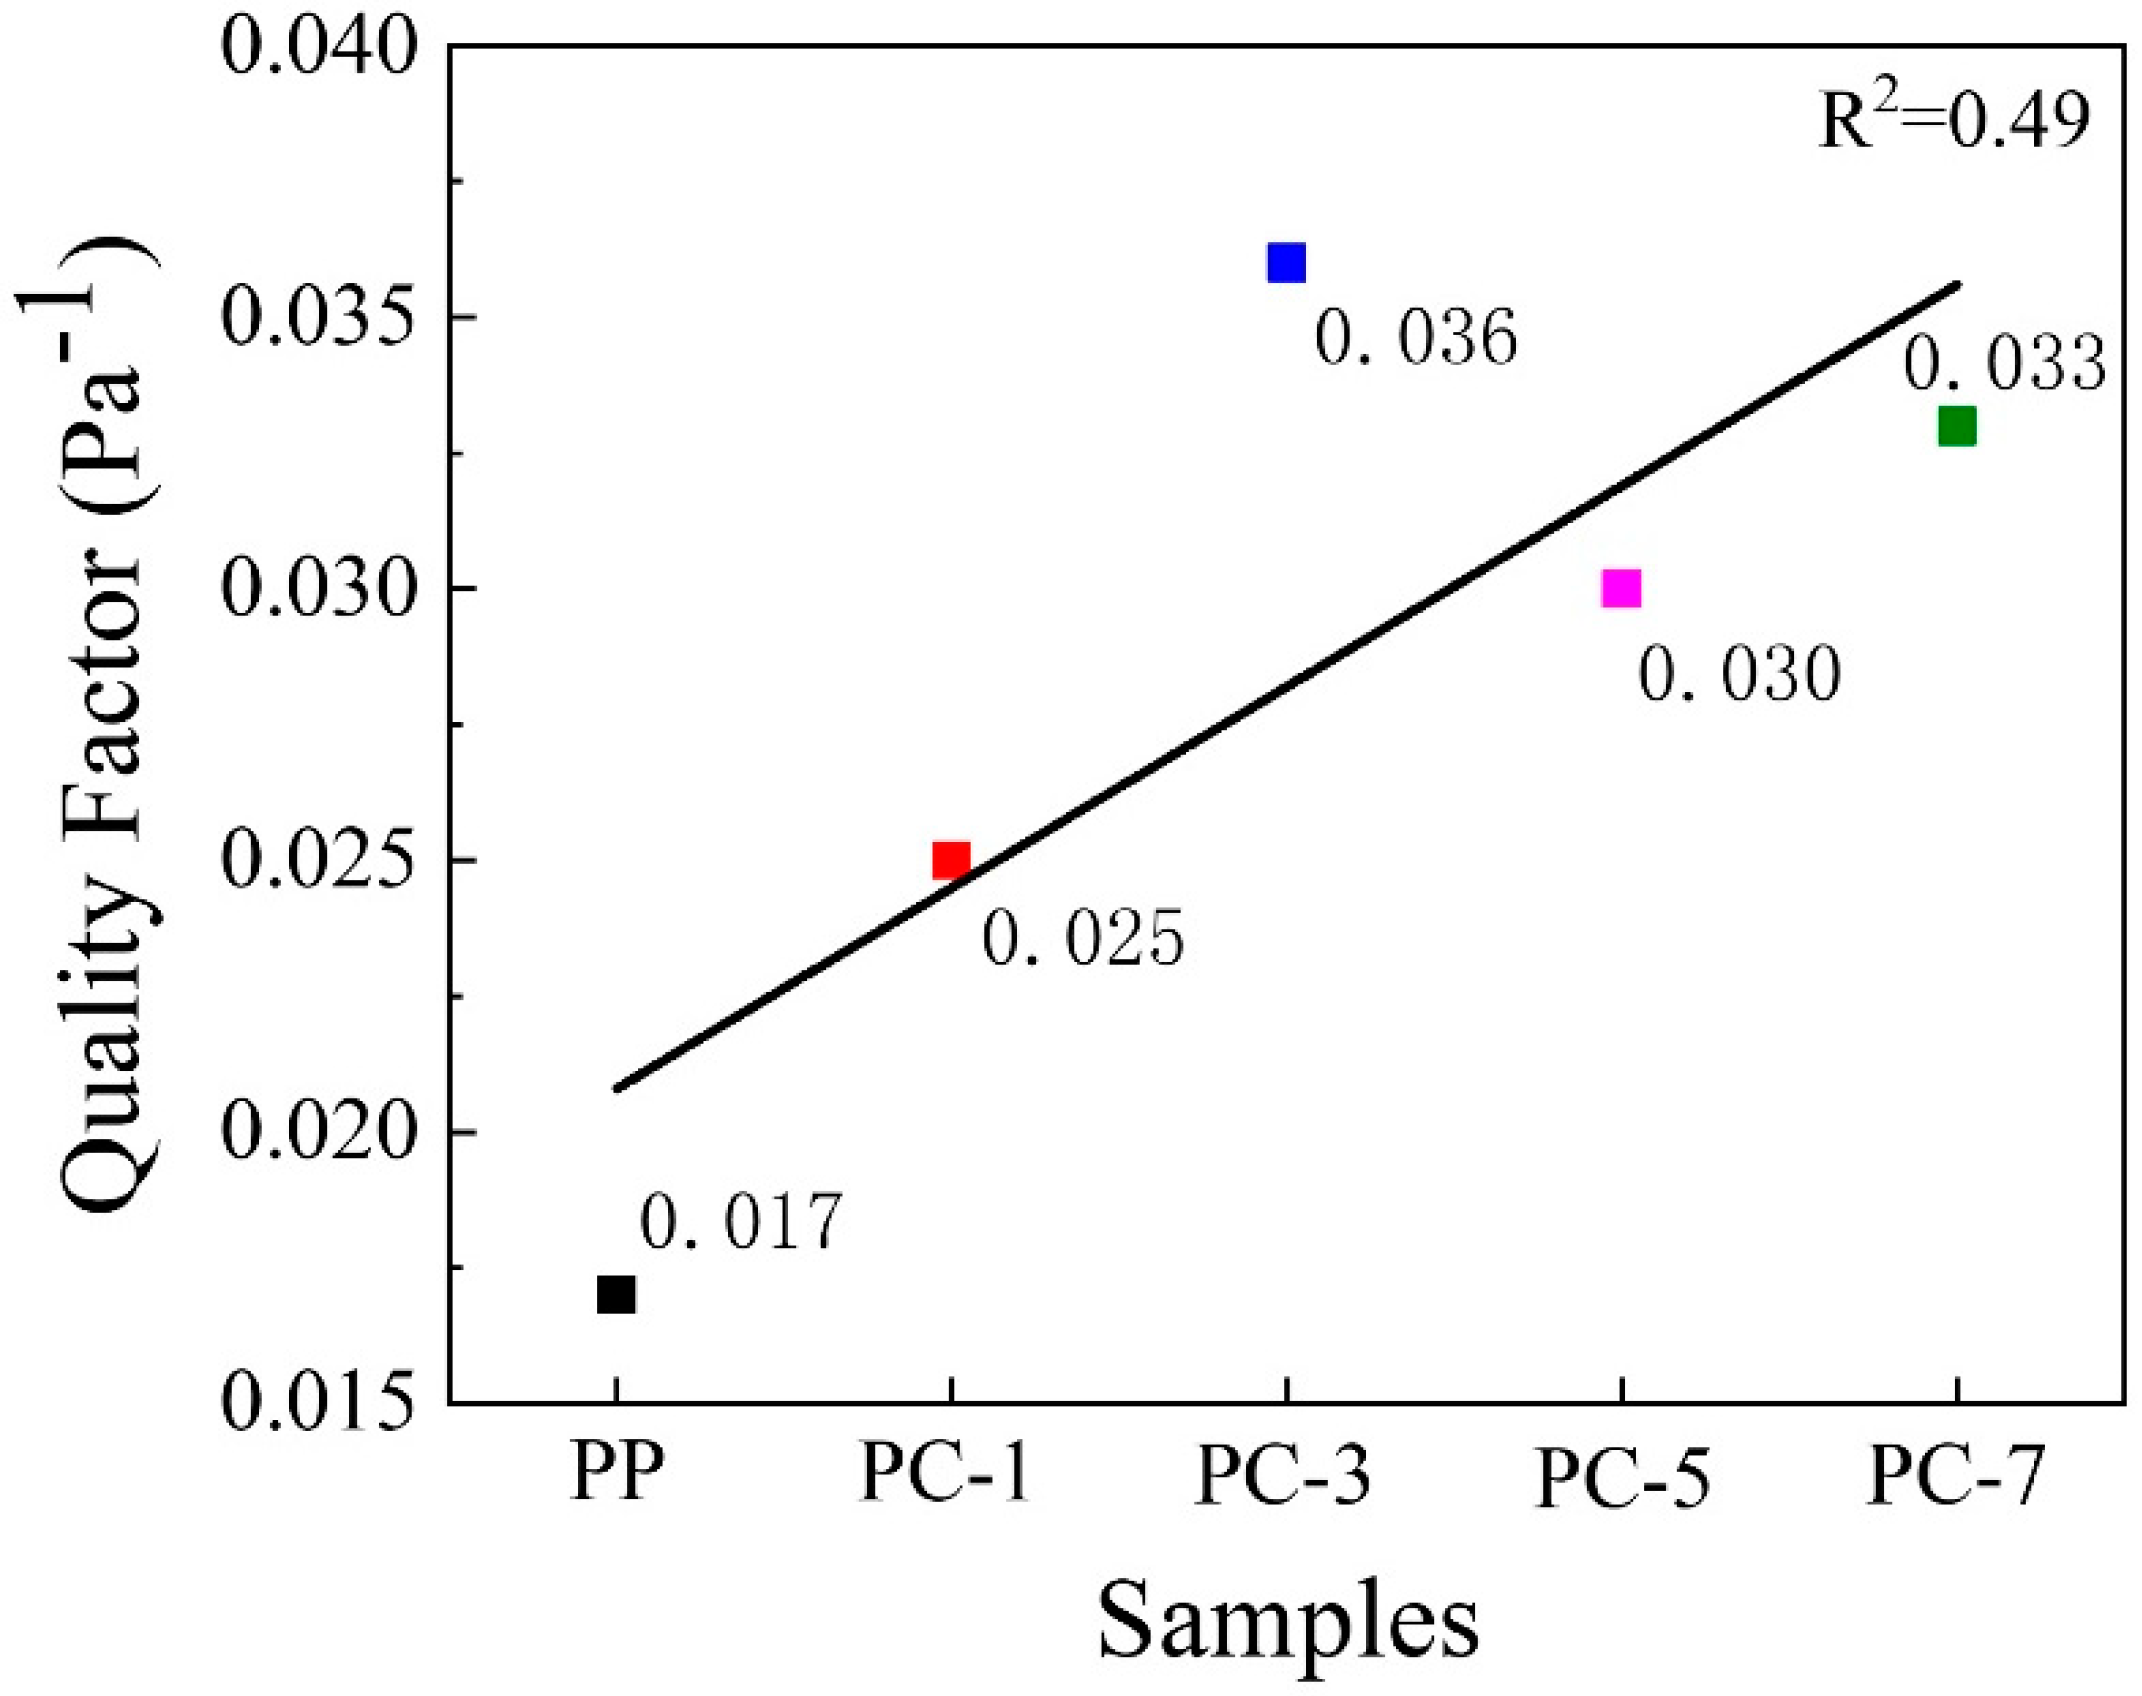
3.5. Filtration Efficiency of Membranes
3.6. Water Contact Angle and Water Vapor Transmission of Membranes
4. Conclusions
Supplementary Materials
Author Contributions
Funding
Conflicts of Interest
References
- Zhang, Y.; Jia, Y.; Hou, L.a. Synthesis of zeolitic imidazolate framework-8 on polyester fiber for PM2.5 removal. RSC Adv. 2018, 8, 31471–31477. [Google Scholar] [CrossRef]
- Chen, Y.; Zhang, S.; Cao, S.; Li, S.; Chen, F.; Yuan, S.; Xu, C.; Zhou, J.; Feng, X.; Ma, X.; et al. Roll-to-Roll Production of Metal-Organic Framework Coatings for Particulate Matter Removal. Adv. Mater. 2017, 29, 1606221. [Google Scholar] [CrossRef] [PubMed]
- Zhang, S.; Tang, N.; Cao, L.; Yin, X.; Yu, J.; Ding, B. Highly Integrated Polysulfone/Polyacrylonitrile/Polyamide-6 Air Filter for Multilevel Physical Sieving Airborne Particles. ACS Appl. Mater. Interfaces 2016, 8, 29062–29072. [Google Scholar] [CrossRef] [PubMed]
- Khalid, B.; Bai, X.; Wei, H.; Huang, Y.; Wu, H.; Cui, Y. Direct Blow-Spinning of Nanofibers on a Window Screen for Highly Efficient PM2.5 Removal. Nano Letters 2017, 17, 1140–1148. [Google Scholar] [CrossRef] [PubMed]
- Tang, M.; Chen, S.-C.; Chang, D.-Q.; Xie, X.; Sun, J.; Pui, D.Y.H. Filtration efficiency and loading characteristics of PM 2.5 through composite filter media consisting of commercial HVAC electret media and nanofiber layer. Sep. Pur. Technol. 2018, 198, 137–145. [Google Scholar] [CrossRef]
- Zhang, Y.; Yuan, S.; Feng, X.; Li, H.; Zhou, J.; Wang, B. Preparation of Nanofibrous Metal–Organic Framework Filters for Efficient Air Pollution Control. J. Am. Chem. Soc. 2016, 138, 5785–5788. [Google Scholar] [CrossRef] [PubMed]
- Lelieveld, J.; Evans, J.S.; Fnais, M.; Giannadaki, D.; Pozzer, A. The contribution of outdoor air pollution sources to premature mortality on a global scale. Nature 2015, 525, 367–371. [Google Scholar] [CrossRef]
- Niu, Z.; Wang, S.; Chen, J.; Zhang, F.; Chen, X.; He, C.; Lin, L.; Yin, L.; Xu, L. Source contributions to carbonaceous species in PM2.5 and their uncertainty analysis at typical urban, peri-urban and background sites in southeast China. Environ. Pollut. 2013, 181, 107–114. [Google Scholar] [CrossRef]
- Xie, Y.; Zhao, L.; Xue, J.; Gao, H.O.; Li, H.; Jiang, R.; Qiu, X.; Zhang, S. Methods for defining the scopes and priorities for joint prevention and control of air pollution regions based on data-mining technologies. J. Clean. Prod. 2018, 185, 912–921. [Google Scholar] [CrossRef]
- Xie, S.; Han, W.; Jiang, G.; Chen, C. Turbulent air flow field in slot-die melt blowing for manufacturing microfibrous nonwoven materials. J. Mater. Sci. 2018, 53, 6991–7003. [Google Scholar] [CrossRef]
- Deng, N.; He, H.; Yan, J.; Zhao, Y.; Ben Ticha, E.; Liu, Y.; Kang, W.; Cheng, B. One-step melt-blowing of multi-scale micro/nano fabric membrane for advanced air-filtration. Polymer 2019, 165, 174–179. [Google Scholar] [CrossRef]
- Zhang, H.; Zhen, Q.; Liu, Y.; Liu, R.; Zhang, Y. One-step melt blowing process for PP/PEG micro-nanofiber filters with branch networks. Results Phys. 2019, 12, 1421–1428. [Google Scholar] [CrossRef]
- Soltani, I.; Macosko, C.W. Influence of rheology and surface properties on morphology of nanofibers derived from islands-in-the-sea meltblown nonwovens. Polymer 2018, 145, 21–30. [Google Scholar] [CrossRef]
- Uppal, R.; Bhat, G.; Eash, C.; Akato, K. Meltblown nanofiber media for enhanced quality factor. Fibers Polym. 2013, 14, 660–668. [Google Scholar] [CrossRef]
- Hassan, M.A.; Yeom, B.Y.; Wilkie, A.; Pourdeyhimi, B.; Khan, S.A. Fabrication of nanofiber meltblown membranes and their filtration properties. J. Membr. Sci. 2013, 427, 336–344. [Google Scholar] [CrossRef]
- Lalagiri, M.; Bhat, G.; Singh, V.; Parameswaran, S.; Kendall, R.J.; Ramkumar, S. Filtration Efficiency of Submicrometer Filters. Ind. Eng. Chem. Res. 2013, 52, 16513–16518. [Google Scholar] [CrossRef]
- Ellison, C.J.; Phatak, A.; Giles, D.W.; Macosko, C.W.; Bates, F.S. Melt blown nanofibers: Fiber diameter distributions and onset of fiber breakup. Polymer 2007, 48, 3306–3316. [Google Scholar] [CrossRef]
- Zhang, D.; Sun, C.; Song, H. An investigation of fiber splitting of bicomponent meltblown/microfiber nonwovens by water treatment. J. Appl. Polym. Sci. 2004, 94, 1218–1226. [Google Scholar] [CrossRef]
- Nayak, R.; Kyratzis, I.L.; Truong, Y.B.; Padhye, R.; Arnold, L. Structural and mechanical properties of polypropylene nanofibres fabricated by meltblowing. J. Text Inst 2014, 106, 629–640. [Google Scholar] [CrossRef]
- Tang, J.K.Y.; Lee-Sullivan, P. Observations of physical aging in a polycarbonate and acrylonitrile-butadiene-styrene blend. J. Appl. Polym.Sci. 2008, 110, 97–108. [Google Scholar] [CrossRef]
- Brochocka, A. Efficiency of Electret Polycarbonate Nonwovens in Respiratory Protection Against Nanoparticles. Autex Res. J. 2017, 17, 188–198. [Google Scholar] [CrossRef][Green Version]
- Ebadi-Dehaghani, H.; Barikani, M.; Borhani, S.; Bolvardi, B.; Khonakdar, H.A.; Jafari, S.H.; Aarabi, A. Biodegradation and hydrolysis studies on polypropylene/polylactide/organo-clay nanocomposites. Polym. Bull. 2016, 73, 3287–3304. [Google Scholar] [CrossRef]
- Hegde, R.R.; Bhat, G.S. Nanoparticle effects on structure and properties of polypropylene meltblown webs. J. Appl. Polym. Sci. 2010, 115, 1062–1072. [Google Scholar] [CrossRef]
- Keene, B.; Bourham, M.; Viswanath, V.; Avci, H.; Kotek, R. Characterization of degradation of polypropylene nonwovens irradiated by γ-ray. J. Appl. Polym. Sci. 2014, 131, 39917. [Google Scholar] [CrossRef]
- Li, C.X.; Kuang, S.Y.; Chen, Y.H.; Wang, Z.L.; Li, C.; Zhu, G. In Situ Active Poling of Nanofiber Networks for Gigantically Enhanced Particulate Filtration. ACS Appl. Mater. Interfaces 2018, 10, 24332–24338. [Google Scholar] [CrossRef] [PubMed]
- Gérard, E.; Bessy, E.; Salvagnini, C.; Rerat, V.; Momtaz, M.; Hénard, G.; Marmey, P.; Verpoort, T.; Marchand-Brynaert, J. Surface modifications of polypropylene membranes used for blood filtration. Polymer 2011, 52, 1223–1233. [Google Scholar] [CrossRef]
- As’habi, L.; Jafari, S.H.; Khonakdar, H.A.; Häussler, L.; Wagenknecht, U.; Heinrich, G. Non-isothermal crystallization behavior of PLA/LLDPE/nanoclay hybrid: Synergistic role of LLDPE and clay. Thermochimica Acta 2013, 565, 102–113. [Google Scholar] [CrossRef]
- Zhang, H.; Liu, J.; Zhang, X.; Huang, C.; Jin, X. Design of electret polypropylene melt blown air filtration material containing nucleating agent for effective PM2.5 capture. RSC Adv. 2018, 8, 7932–7941. [Google Scholar] [CrossRef]
- Favis, B.D.; Chalifoux, J.P. The effect of viscosity ratio on the morphology of polypropylene and polycarbonate blends during processing.pdf. Polym. Eng. Sci. 1987, 27, 1591–1600. [Google Scholar] [CrossRef]
- Mathiowitz, E.; Jacob, J.S.; Jong, Y.S.; Hekal, T.M.; Spano, W.; Guemonprez, R.; Klibanov, A.M.; Langer, R. Novel desiccants based on designed polymeric blends. J. Appl. Polym. Sci. 2001, 80, 317–327. [Google Scholar] [CrossRef]
- Ayad, E.; Cayla, A.; Rault, F.; Gonthier, A.; Campagne, C.; Devaux, E. Effect of Viscosity Ratio of Two Immiscible Polymers on Morphology in Bicomponent Melt Spinning Fibers. Adv Polym.Technol 2018, 37, 1134–1141. [Google Scholar] [CrossRef]
- Podgórski, A.; Bałazy, A.; Gradoń, L. Application of nanofibers to improve the filtration efficiency of the most penetrating aerosol particles in fibrous filters. Chem. Eng. Sci. 2006, 61, 6804–6815. [Google Scholar] [CrossRef]
- Wang, N.; Cai, M.; Yang, X.; Yang, Y. Electret nanofibrous membrane with enhanced filtration performance and wearing comfortability for face mask. J. Colloid Interf. Sci. 2018, 530, 695–703. [Google Scholar] [CrossRef] [PubMed]
- Cotrut, C.M.; Vladescu, A.; Dinu, M.; Vranceanu, D.M. Influence of deposition temperature on the properties of hydroxyapatite obtained by electrochemical assisted deposition. Ceram Int. 2018, 44, 669–677. [Google Scholar] [CrossRef]
- Cheng, Y.; Wang, C.; Zhong, J.; Lin, S.; Xiao, Y.; Zhong, Q.; Jiang, H.; Wu, N.; Li, W.; Chen, S.; et al. Electrospun polyetherimide electret nonwoven for bi-functional smart face mask. Nano Energ. 2017, 34, 562–569. [Google Scholar] [CrossRef]
- Gu, G.Q.; Han, C.B.; Lu, C.X.; He, C.; Jiang, T.; Gao, Z.L.; Li, C.J.; Wang, Z.L. Triboelectric Nanogenerator Enhanced Nanofiber Air Filters for Efficient Particulate Matter Removal. ACS Nano. 2017, 11, 6211–6217. [Google Scholar] [CrossRef] [PubMed]
- Chang, D.-Q.; Tien, C.-Y.; Peng, C.-Y.; Tang, M.; Chen, S.-C. Development of composite filters with high efficiency, low pressure drop, and high holding capacity PM2.5 filtration. Sep. Purif. Technol. 2019, 212, 699–708. [Google Scholar] [CrossRef]
- Kilic, A.; Shim, E.; Pourdeyhimi, B. Electrostatic Capture Efficiency Enhancement of Polypropylene Electret Filters with Barium Titanate. Aerosol. Sci. Technol. 2015, 49, 666–673. [Google Scholar] [CrossRef]
- Cai, R.-R.; Zhang, L.-Z.; Bao, A.-B. PM collection performance of electret filters electrospun with different dielectric materials-a numerical modeling and experimental study. Build. Environ 2018, 131, 210–219. [Google Scholar] [CrossRef]
- Zhang, H.; Liu, J.; Zhang, X.; Huang, C.; Jin, X. Online prediction of the filtration performance of polypropylene melt blown nonwovens by blue-colored glow. J. Appl. Polym. Sci. 2018, 135, 45948. [Google Scholar] [CrossRef]


| Parameter | Screw 1 | Screw 2 | Screw 3 | Nozzle | Screw Speed/r·min−1 | Pelletizin Speed/r·min−1 |
|---|---|---|---|---|---|---|
| Temperature/°C | 240 | 260 | 275 | 200 | 21 | 32 |
| Screw 1/°C | Screw 2/°C | Screw 3/°C | Pipeline/°C | Metering Pump/°C | Die/°C |
| 220 | 275 | 290 | 270 | 260 | 252 |
| Air/°C | Metering Pump Flow /mL·min−1 | Air Pressure /MPa | Collector Speed /cm·min−1 | Winding Sticks Speed /cm·min−1 | Distance /cm |
| PP: 200 PC-1, PC-3, PC-5, PC-7: 158 | 50 | 0.035 | 44 | 22 | 20 |
| Samples | First Heating | Cooling | Second Heating | ||||
|---|---|---|---|---|---|---|---|
| Tm1 /°C | ΔHm1 /J·g−1 | Tc /°C | ΔHc /J·g−1 | Tm2 /°C | ΔHm2 /J·g−1 | Xc /% | |
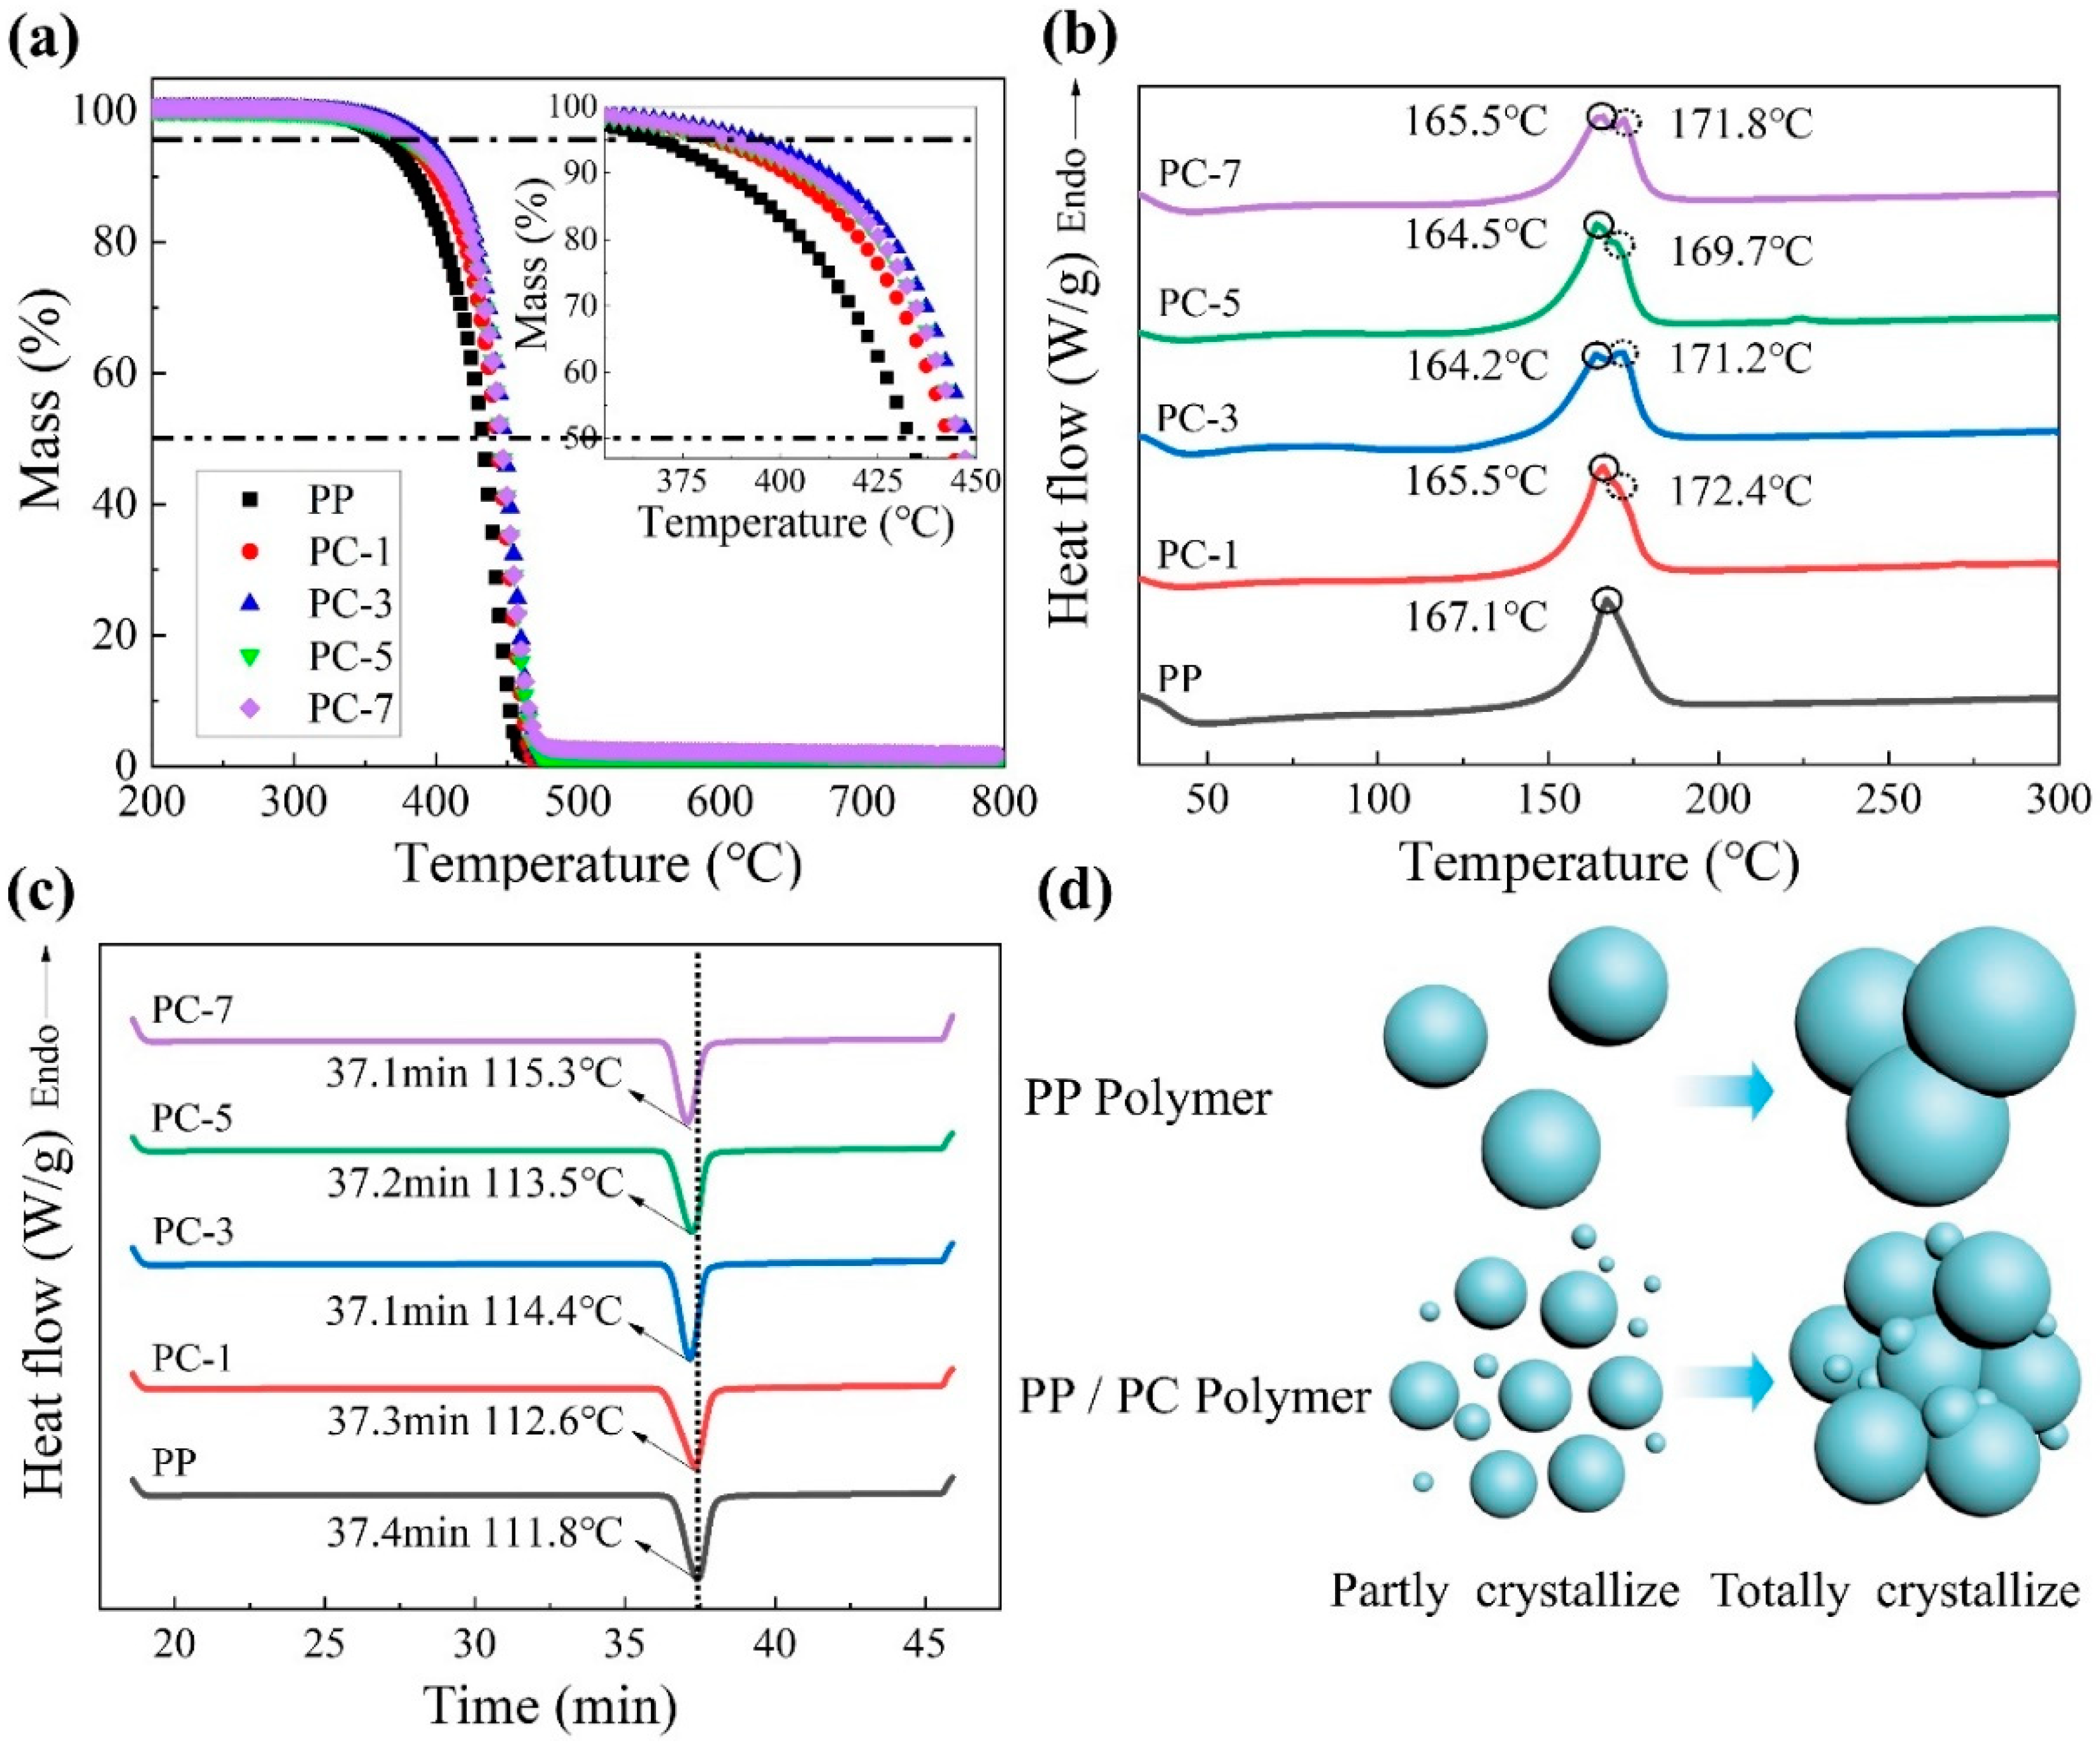
| PP | 167.11 | 87.56 | 111.8 | 101.9 | 161.0 | 91.27 | 43.67 |
| PC-1 | 165.51, 172.42 | 89.38 | 112.6 | 105.4 | 166.6 | 96.53 | 46.65 |
| PC-3 | 164.21, 171.22 | 95.55 | 114.4 | 107.1 | 159.2 | 98.85 | 48.76 |
| PC-5 | 164.51, 169.72 | 89.24 | 113.5 | 97.94 | 158.2 | 93.2 | 46.94 |
| PC-7 | 165.51, 171.82 | 84.76 | 115.3 | 92.51 | 160 | 92 | 47.33 |
| Samples | Ra/μm ± SD | Rq/μm ± SD |
|---|---|---|
| PP | 0.20 ± 0.08 | 0.22 ± 0.08 |
| PC-1 | 0.30 ± 0.06 | 0.34± 0.07 |
| PC-3 | 1.03 ± 0.14 | 1.25 ± 0.15 |
| PC-5 | 0.46 ± 0.36 | 0.53 ± 0.44 |
| PC-7 | 0.31 ± 0.02 | 0.35 ± 0.02 |
| Particle Size/μm | PP | PC-1 | PC-3 | PC-5 | PC-7 |
|---|---|---|---|---|---|
| 0.208 | 0.5 | 3.3 | 20.8 | 25.5 | 8.2 |
| 0.248 | 15.1 | 22.7 | 63.1 | 68.8 | 51.7 |
| 0.3 | 18.0 | 26.3 | 66.1 | 71.9 | 55.7 |
| 0.372 | 26.0 | 35.2 | 75.0 | 80.1 | 67.6 |
| 0.612 | 28.1 | 39.3 | 84.0 | 90.7 | 80.9 |
| 0.909 | 37.6 | 52.8 | 92.9 | 95.9 | 90.5 |
| 1.858 | 62.2 | 75.0 | 99.3 | 100.0 | 99.0 |
| 2.478 | 77.7 | 90.0 | 100.0 | 100.0 | 99.7 |
| 2.856 | 85.5 | 88.8 | 100.0 | 100.0 | 100.0 |
| 4.303 | 90.8 | 100.0 | 100.0 | 100.0 | 100.0 |
| 4.595 | 99.4 | 100.0 | 100.0 | 100.0 | 100.0 |
| Samples | PP | PC-1 | PC-3 | PC-5 | PC-7 |
|---|---|---|---|---|---|
| SBET/m2·g−1 | 4.151 ± 0.08 | 5.404 ± 0.05 | 9.218 ± 0.07 | 7.801 ± 0.08 | 6.312 ± 0.10 |
© 2019 by the authors. Licensee MDPI, Basel, Switzerland. This article is an open access article distributed under the terms and conditions of the Creative Commons Attribution (CC BY) license (http://creativecommons.org/licenses/by/4.0/).
Share and Cite
Li, T.-T.; Cen, X.; Ren, H.-T.; Sun, F.; Lin, Q.; Lou, C.-W.; Lin, J.-H. One-Step Bark-Like Imitated Polypropylene (PP)/Polycarbonate (PC) Nanofibrous Meltblown Membrane for Efficient Particulate Matter Removal. Polymers 2019, 11, 1307. https://doi.org/10.3390/polym11081307
Li T-T, Cen X, Ren H-T, Sun F, Lin Q, Lou C-W, Lin J-H. One-Step Bark-Like Imitated Polypropylene (PP)/Polycarbonate (PC) Nanofibrous Meltblown Membrane for Efficient Particulate Matter Removal. Polymers. 2019; 11(8):1307. https://doi.org/10.3390/polym11081307
Chicago/Turabian StyleLi, Ting-Ting, Xixi Cen, Hai-Tao Ren, Fei Sun, Qi Lin, Ching-Wen Lou, and Jia-Horng Lin. 2019. "One-Step Bark-Like Imitated Polypropylene (PP)/Polycarbonate (PC) Nanofibrous Meltblown Membrane for Efficient Particulate Matter Removal" Polymers 11, no. 8: 1307. https://doi.org/10.3390/polym11081307
APA StyleLi, T.-T., Cen, X., Ren, H.-T., Sun, F., Lin, Q., Lou, C.-W., & Lin, J.-H. (2019). One-Step Bark-Like Imitated Polypropylene (PP)/Polycarbonate (PC) Nanofibrous Meltblown Membrane for Efficient Particulate Matter Removal. Polymers, 11(8), 1307. https://doi.org/10.3390/polym11081307