Piezoelectric Response in Hybrid Micropillar Arrays of Poly(Vinylidene Fluoride) and Reduced Graphene Oxide


 ,
,  ,
, 


Abstract
1. Introduction
2. Experimental
2.1. Reduced Graphene Oxide (rGO)
2.2. Micropillar Preparation
3. Results and Discussion
4. Conclusions
Author Contributions
Funding
Conflicts of Interest
References
- Cha, S.; Kim, S.M.; Kim, H.; Ku, J.; Sohn, J.I.; Park, Y.J.; Song, B.G.; Jung, M.H.; Lee, E.K.; Choi, B.L.; et al. Porous PVDF As Effective Sonic Wave Driven Nanogenerators. Nano Lett. 2011, 11, 5142–5147. [Google Scholar] [CrossRef] [PubMed]
- Wang, A.C.; Wu, C.; Pisignano, D.; Wang, Z.L.; Persano, L. Polymer nanogenerators: Opportunities and challenges for large-scale applications. J. Appl. Polym. Sci. 2017, 135, 45674. [Google Scholar] [CrossRef]
- Naik, M.R.; Kempaiah, U.N. Directional Optimization of MEMS Piezoelectric Hydrophone for Underwater Application. Mater. Today Proc. 2018, 5, 823–829. [Google Scholar] [CrossRef]
- Xin, Y.; Sun, H.; Tian, H.; Guo, C.; Li, X.; Wang, S.; Wang, C. The use of polyvinylidene fluoride (PVDF) films as sensors for vibration measurement: A brief review. Ferroelectrics 2016, 502, 28–42. [Google Scholar] [CrossRef]
- Almohimeed, I.; Agarwal, M.; Ono, Y. Wearable Ultrasonic Sensor Using Double-Layer PVDF Films for Monitoring Tissue Motion. In Proceedings of the 2018 IEEE Canadian Conference on Electrical & Computer Engineering (CCECE), Quebec City, QC, Canada, 13–16 May 2018; pp. 1–4. [Google Scholar]
- Shirinov, A.V.; Schomburg, W.K. Pressure sensor from a PVDF film. Sens. Actuators A Phys. 2008, 142, 48–55. [Google Scholar] [CrossRef]
- Jo, S.-E.; Kim, M.-S.; Kim, Y.-J. A resonant frequency switching scheme of a cantilever based on polyvinylidene fluoride for vibration energy harvesting. Smart Mater. Struct. 2011, 21, 15007. [Google Scholar] [CrossRef]
- Sencadas, V.; Jr, R.G. Lanceros-Méndez, S. α to β Phase Transformation and Microestructural Changes of PVDF Films Induced by Uniaxial Stretch. J. Macromol. Sci. Part B 2009, 48, 514–525. [Google Scholar] [CrossRef]
- Li, L.; Zhang, M.; Rong, M.; Ruan, W. Studies on the transformation process of PVDF from α to β phase by stretching. RSC Adv. 2014, 4, 3938–3943. [Google Scholar] [CrossRef]
- Yang, L.; Ho, J.; Allahyarov, E.; Mu, R.; Zhu, L. Semicrystalline Structure-Dielectric Property Relationship and Electrical Conduction in a Biaxially Oriented Poly(vinylidene fluoride) Film under High Electric Fields and High Temperatures. ACS Appl. Mater. Interfaces 2015, 7, 19894–19905. [Google Scholar] [CrossRef]
- Sharma, M.; Madras, G.; Bose, S. Process induced electroactive β-polymorph in PVDF: Effect on dielectric and ferroelectric properties. Phys. Chem. Chem. Phys. 2014, 16, 14792–14799. [Google Scholar] [CrossRef]
- Biswas, S.; Dutta, B.; Bhattacharya, D.S. Correlation between nucleation, phase transition and dynamic melt-crystallization kinetics in PAni/PVDF blends. RSC Adv. 2015, 5, 74486–74498. [Google Scholar] [CrossRef]
- Ren, J.-Y.; Zhang, G.; Li, Y.; Lei, J.; Zhu, L.; Zhong, G.-J.; Li, Z.-M. Effect of ion-dipole interaction on the formation of polar extended-chain crystals in high pressure-crystallized poly (vinylidene fluoride). Polymer 2018, 158, 204–212. [Google Scholar] [CrossRef]
- Du, C.-H.; Zhu, B.-K.; Xu, Y.-Y. The effects of quenching on the phase structure of vinylidene fluoride segments in PVDF-HFP copolymer and PVDF-HFP/PMMA blends. J. Mater. Sci. 2006, 41, 417–421. [Google Scholar] [CrossRef]
- Martins, P.; Lopes, A.C. Lanceros-Mendez, S. Electroactive phases of poly (vinylidene fluoride): Determination, processing and applications. Prog. Polym. Sci. 2014, 39, 683–706. [Google Scholar] [CrossRef]
- Soin, N.; Boyer, D.; Prashanthi, K.; Sharma, S.; Narasimulu, A.A.; Luo, J.; Shah, T.H.; Siores, E.; Thundat, T. Exclusive self-aligned β-phase PVDF films with abnormal piezoelectric coefficient prepared via phase inversion. Chem. Commun. 2015, 51, 8257–8260. [Google Scholar] [CrossRef]
- Cardoso, V.F.; Minas, G.; Costa, C.M.; Tavares, C.J.; Lanceros-Mendez, S. Micro and nanofilms of poly(vinylidene fluoride) with controlled thickness, morphology and electroactive crystalline phase for sensor and actuator applications. Smart Mater. Struct. 2011, 20, 87002. [Google Scholar] [CrossRef]
- Ferris, J.H.; Li, D.B.; Kalinin, S.; Bonnell, D.A. Nanoscale domain patterning of lead zirconate titanate materials using electron beams. Appl. Phys. Lett. 2004, 84, 774. [Google Scholar] [CrossRef]
- Li, X.; Terabe, K.; Hatano, H.; Zeng, H.; Kitamura, K. Domain patterning thin crystalline ferroelectric film with focused ion beam for nonlinear photonic integrated circuits. J. Appl. Phys. 2006, 100, 106103. [Google Scholar] [CrossRef]
- Li, J.; Luo, Y.; Bai, M.; Ducharme, S. Nanomesa and nanowell formation in Langmuir–Blodgett polyvinylidene fluoride trifluoroethylene copolymer films. Appl. Phys. Lett. 2005, 87, 213116. [Google Scholar] [CrossRef]
- Hu, Z.; Tian, M.; Nysten, B.; Jonas, A.M. Regular arrays of highly ordered ferroelectric polymer nanostructures for non-volatile low-voltage memories. Nat. Mater. 2009, 8, 62. [Google Scholar] [CrossRef]
- Yang, H.; Deschatelets, P.; Brittain, S.T.; Whitesides, G.M. Fabrication of high performance ceramic microstructures from a polymeric precursor using soft lithography. Adv. Mater. 2001, 13, 54–58. [Google Scholar] [CrossRef]
- Cauda, V.; Stassi, S.; Bejtka, K.; Canavese, G. Nanoconfinement: An Effective Way to Enhance PVDF Piezoelectric Properties. ACS Appl. Mater. Interfaces 2013, 5, 6430–6437. [Google Scholar] [CrossRef] [PubMed]
- Park, Y.J.; Kang, Y.S.; Park, C. Micropatterning of semicrystalline poly(vinylidene fluoride) (PVDF) solutions. Eur. Polym. J. 2005, 41, 1002–1012. [Google Scholar] [CrossRef]
- Bergenti, I.; Ruani, G.; Liscio, F.; Milita, S.; Dinelli, F.; Xu, X.; Wang, E.; Cavallini, M. Highly Ordered Organic Ferroelectric DIPAB-Patterned Thin Films. Langmuir 2017, 33, 12859–12864. [Google Scholar] [CrossRef] [PubMed]
- Canavese, G.; Stassi, S.; Cauda, V.; Verna, A.; Motto, P.; Chiodoni, A.; Marasso, S.L.; Demarchi, D. Different Scale Confinements of PVDF-TrFE as Functional Material of Piezoelectric Devices. IEEE Sens. J. 2013, 13, 2237–2244. [Google Scholar] [CrossRef]
- Ong, W.; Ke, C.; Lim, P.; Kumar, A.; Zeng, K.; Ho, G.W. Direct stamping and capillary flow patterning of solution processable piezoelectric polyvinylidene fluoride films. Polymer 2013, 54, 5330–5337. [Google Scholar] [CrossRef]
- Choi, Y.-Y.; Yun, T.G.; Qaiser, N.; Paik, H.; Roh, H.S.; Hong, J.; Hong, S.; Han, S.M.; No, K. Vertically aligned P(VDF-TrFE) core-shell structures on flexible pillar arrays. Sci. Rep. 2015, 5, 10728. [Google Scholar] [CrossRef]
- Md Habibur, R.; Yaqoob, U.; Muhammad, S.; Uddin, A.S.M.I.; Kim, H.C. The effect of RGO on dielectric and energy harvesting properties of P(VDF-TrFE) matrix by optimizing electroactive b phase without traditional polling process. Mater. Chem. Phys. 2018, 215, 46–55. [Google Scholar] [CrossRef]
- Karan, S.K.; Mandal, D.; Khatua, B.B. Self-powered flexible Fe-doped RGO/PVDF nanocomposite: An excellent material for a piezoelectric energy harvester. Nanoscale 2015, 7, 10655–10666. [Google Scholar] [CrossRef]
- Kumar Karan, S.; Bera, R.; Paria, S.; Kumar Das, A.; Maiti, S.; Maitra, A.; Bhusan Khatua, B. An Approach to Design Highly Durable Piezoelectric Nanogenerator Based on Self-Poled PVDF/AlO-rGO Flexible Nanocomposite with High Power Density and Energy Conversion Efficiency. Adv. Energy Mater. 2016, 6, 1601016. [Google Scholar] [CrossRef]
- Marcano, D.C.; Kosynkin, D.V.; Berlin, J.M.; Sinitskii, A.; Sun, Z.; Slesarev, A.; Alemany, L.B.; Lu, W.; Tour, J.M. Improved Synthesis of Graphene Oxide. ACS Nano 2010, 4, 4806–4814. [Google Scholar] [CrossRef]
- Loryuenyong, V.; Totepvimarn, K.; Eimburanapravat, P.; Boonchompoo, W.; Buasri, A. Preparation and characterization of reduced graphene oxide sheets via water-based exfoliation and reduction methods. Adv. Mater. Sci. Eng. 2013, 2013, 923403. [Google Scholar] [CrossRef]
- Huang, L.; Lu, C.; Wang, F.; Wang, L. Preparation of PVDF/graphene ferroelectric composite films by in situ reduction with hydrobromic acids and their properties. RSC Adv. 2014, 4, 45220–45229. [Google Scholar] [CrossRef]
- Liu, F.; Huo, R.; Huang, X.; Jiang, P. Effect of processing method on the dielectric behavior of graphene oxide/PVDF nanocomposites. In Proceedings of the 2013 IEEE International Conference on Solid Dielectrics (ICSD), Bologna, Italy, 30 June–4 July 2013; pp. 919–922. [Google Scholar] [CrossRef]
- Wu, L.; Alamusi; Xue, J.; Itoi, T.; Hu, N.; Li, Y.; Yan, C.; Qiu, J.; Ning, H.; Yuan, W.; et al. Improved energy harvesting capability of poly(vinylidene fluoride) films modified by reduced graphene oxide. J. Intell. Mater. Syst. Struct. 2014, 25, 1813–1824. [Google Scholar] [CrossRef]
- El Achaby, M.; Arrakhiz, F.Z.; Vaudreuil, S.; Essassi, E.M.; Qaiss, A.; Bousmina, M. Preparation and characterization of melt-blended graphene nanosheets-poly (vinylidene fluoride) nanocomposites with enhanced properties. J. Appl. Polym. Sci. 2013, 127, 4697–4707. [Google Scholar] [CrossRef]
- Gallego-Perez, D.; Ferrell, N.J.; Higuita-Castro, N.; Hansford, D.J. Versatile methods for the fabrication of polyvinylidene fluoride microstructures. Biomed. Microdevices 2010, 12, 1009–1017. [Google Scholar] [CrossRef]
- Nakagawa, K.; Ishida, Y. Annealing effects in poly(vinylidene fluoride) as revealed by specific volume measurements, differential scanning calorimetry, and electron microscopy. J. Polym. Sci. Polym. Phys. Ed. 1973, 11, 2153–2171. [Google Scholar] [CrossRef]
- Cai, X.; Lei, T.; Sun, D.; Lin, L. A critical analysis of the α, β and γ phases in poly(vinylidene fluoride) using FTIR. RSC Adv. 2017, 7, 15382–15389. [Google Scholar] [CrossRef]
- Sastri, V.R. Commodity Thermoplastics. In Plastics in Medical Devices; Elsevier: Amsterdam, The Netherlands, 2010; pp. 73–119. Available online: https://linkinghub.elsevier.com/retrieve/pii/B9780815520276100066 (accessed on 21 February 2019).
- Lanceros-Mendez, S.; Mano, J.F.; Costa, A.M.; Schmidt, V.H. Ftir and dsc studies of mechanically deformed β-pvdf films. J. Macromol. Sci. Part B 2001, 40, 517–527. [Google Scholar] [CrossRef]
- García-Gutiérrez, M.-C.; Linares, A.; Hernández, J.J.; Rueda, D.R.; Ezquerra, T.A.; Poza, P.; Davies, R.J.; Rueda, J.J.H. Confinement-Induced One-Dimensional Ferroelectric Polymer Arrays. Nano Lett. 2010, 10, 1472–1476. [Google Scholar]
- Gomes, J.; Nunes, J.S.; Sencadas, V.; Lanceros-Mendez, S. Influence of the β-phase content and degree of crystallinity on the piezo- and ferroelectric properties of poly(vinylidene fluoride). Smart Mater. Struct. 2010, 19, 65010. [Google Scholar] [CrossRef]
- Kabir, E.; Khatun, M.; Nasrin, L.; Raihan, M.; Rahman, M. Pure β-phase formation in polyvinylidene fluoride (PVDF)-carbon nanotube composites. J. Phys. D Appl. Phys. 2017, 50, 163002. [Google Scholar] [CrossRef]
- Zhao, M.-H.; Wang, Z.-L.; Mao, S.X. Piezoelectric Characterization of Individual Zinc Oxide Nanobelt Probed by Piezoresponse Force Microscope. Nano Lett. 2004, 4, 587–590. [Google Scholar] [CrossRef]
- Denning, D.; Guyonnet, J.; Rodriguez, B.J. Applications of piezoresponse force microscopy in materials research: From inorganic ferroelectrics to biopiezoelectrics and beyond. Int. Mater. Rev. 2016, 61, 46–70. [Google Scholar] [CrossRef]
- Fortunato, M.; Bidsorkhi, H.; De Bellis, G.; Sarto, F.; Sarto, M. Piezoelectric response of graphene-filled PVDF nanocomposites through Piezoresponse Force Microscopy (PFM). In Proceedings of the 2017 IEEE 17th International Conference on Nanotechnology (IEEE-NANO), Pittsburgh, PA, USA, 25–28 July 2017; pp. 125–129. [Google Scholar] [CrossRef]
- Henrichs, L.F.; Bennett, J.; Bell, A. Choice of tip, signal stability, and practical aspects of piezoresponse-force-microscopy. Rev. Sci. Instrum. 2015, 86, 083707. [Google Scholar] [CrossRef] [PubMed]
- Ting, Y.; Gunawan, H.; Sugondo, A.; Chiu, C.-W. A New Approach of Polyvinylidene Fluoride (PVDF) Poling Method for Higher Electric Response. Ferroelectrics 2013, 446, 28–38. [Google Scholar] [CrossRef]
- Jiang, Y.; Ye, Y.; Yu, J.; Wu, Z.; Li, W.; Xu, J.; Xie, G. Study of thermally poled and corona charged poly(vinylidene fluoride) films. Polym. Eng. Sci. 2007, 47, 1344–1350. [Google Scholar] [CrossRef]
- Kanik, M.; Aktas, O.; Sen, H.S.; Durgun, E.; Bayindir, M. Spontaneous High Piezoelectricity in Poly(vinylidene fluoride) Nanoribbons Produced by Iterative Thermal Size Reduction Technique. ACS Nano 2014, 8, 9311–9323. [Google Scholar] [CrossRef] [PubMed]
- Silibin, M.; Bystrov, V.; Karpinsky, D.; Nasani, N.; Gonçalves, G.; Gavrilin, I.; Solnyshkin, A.; Marques, P.; Singh, B.K.; Bdikin, I.; et al. Local mechanical and electromechanical properties of the P(VDF-TrFE)-graphene oxide thin films. Appl. Surf. Sci. 2017, 421, 42–51. [Google Scholar] [CrossRef]
- Martín, J.; Mijangos, C.; Sanz, A.; Ezquerra, T.A.; Nogales, A. Segmental Dynamics of Semicrystalline Poly(vinylidene fluoride) Nanorods. Macromolecules 2009, 42, 5395–5401. [Google Scholar]
- Steinhart, M.; Senz, S.; Wehrspohn, R.B.; Gösele, U.; Wendorff, J.H. Curvature-Directed Crystallization of Poly(vinylidene difluoride) in Nanotube Walls. Macromolecules 2003, 36, 3646–3651. [Google Scholar] [CrossRef]
- Surmenev, R.A.; Orlova, T.N.; Chernozem, R.V.; Ivanova, A.A.; Bartasyte, A.; Mathur, S.; Surmeneva, M.A. Hybrid lead-free polymer-based scaffolds with improved piezoelectric response for biomedical energy-harvesting applications: A review. Nano Energy 2019, 62, 475–506. [Google Scholar] [CrossRef]


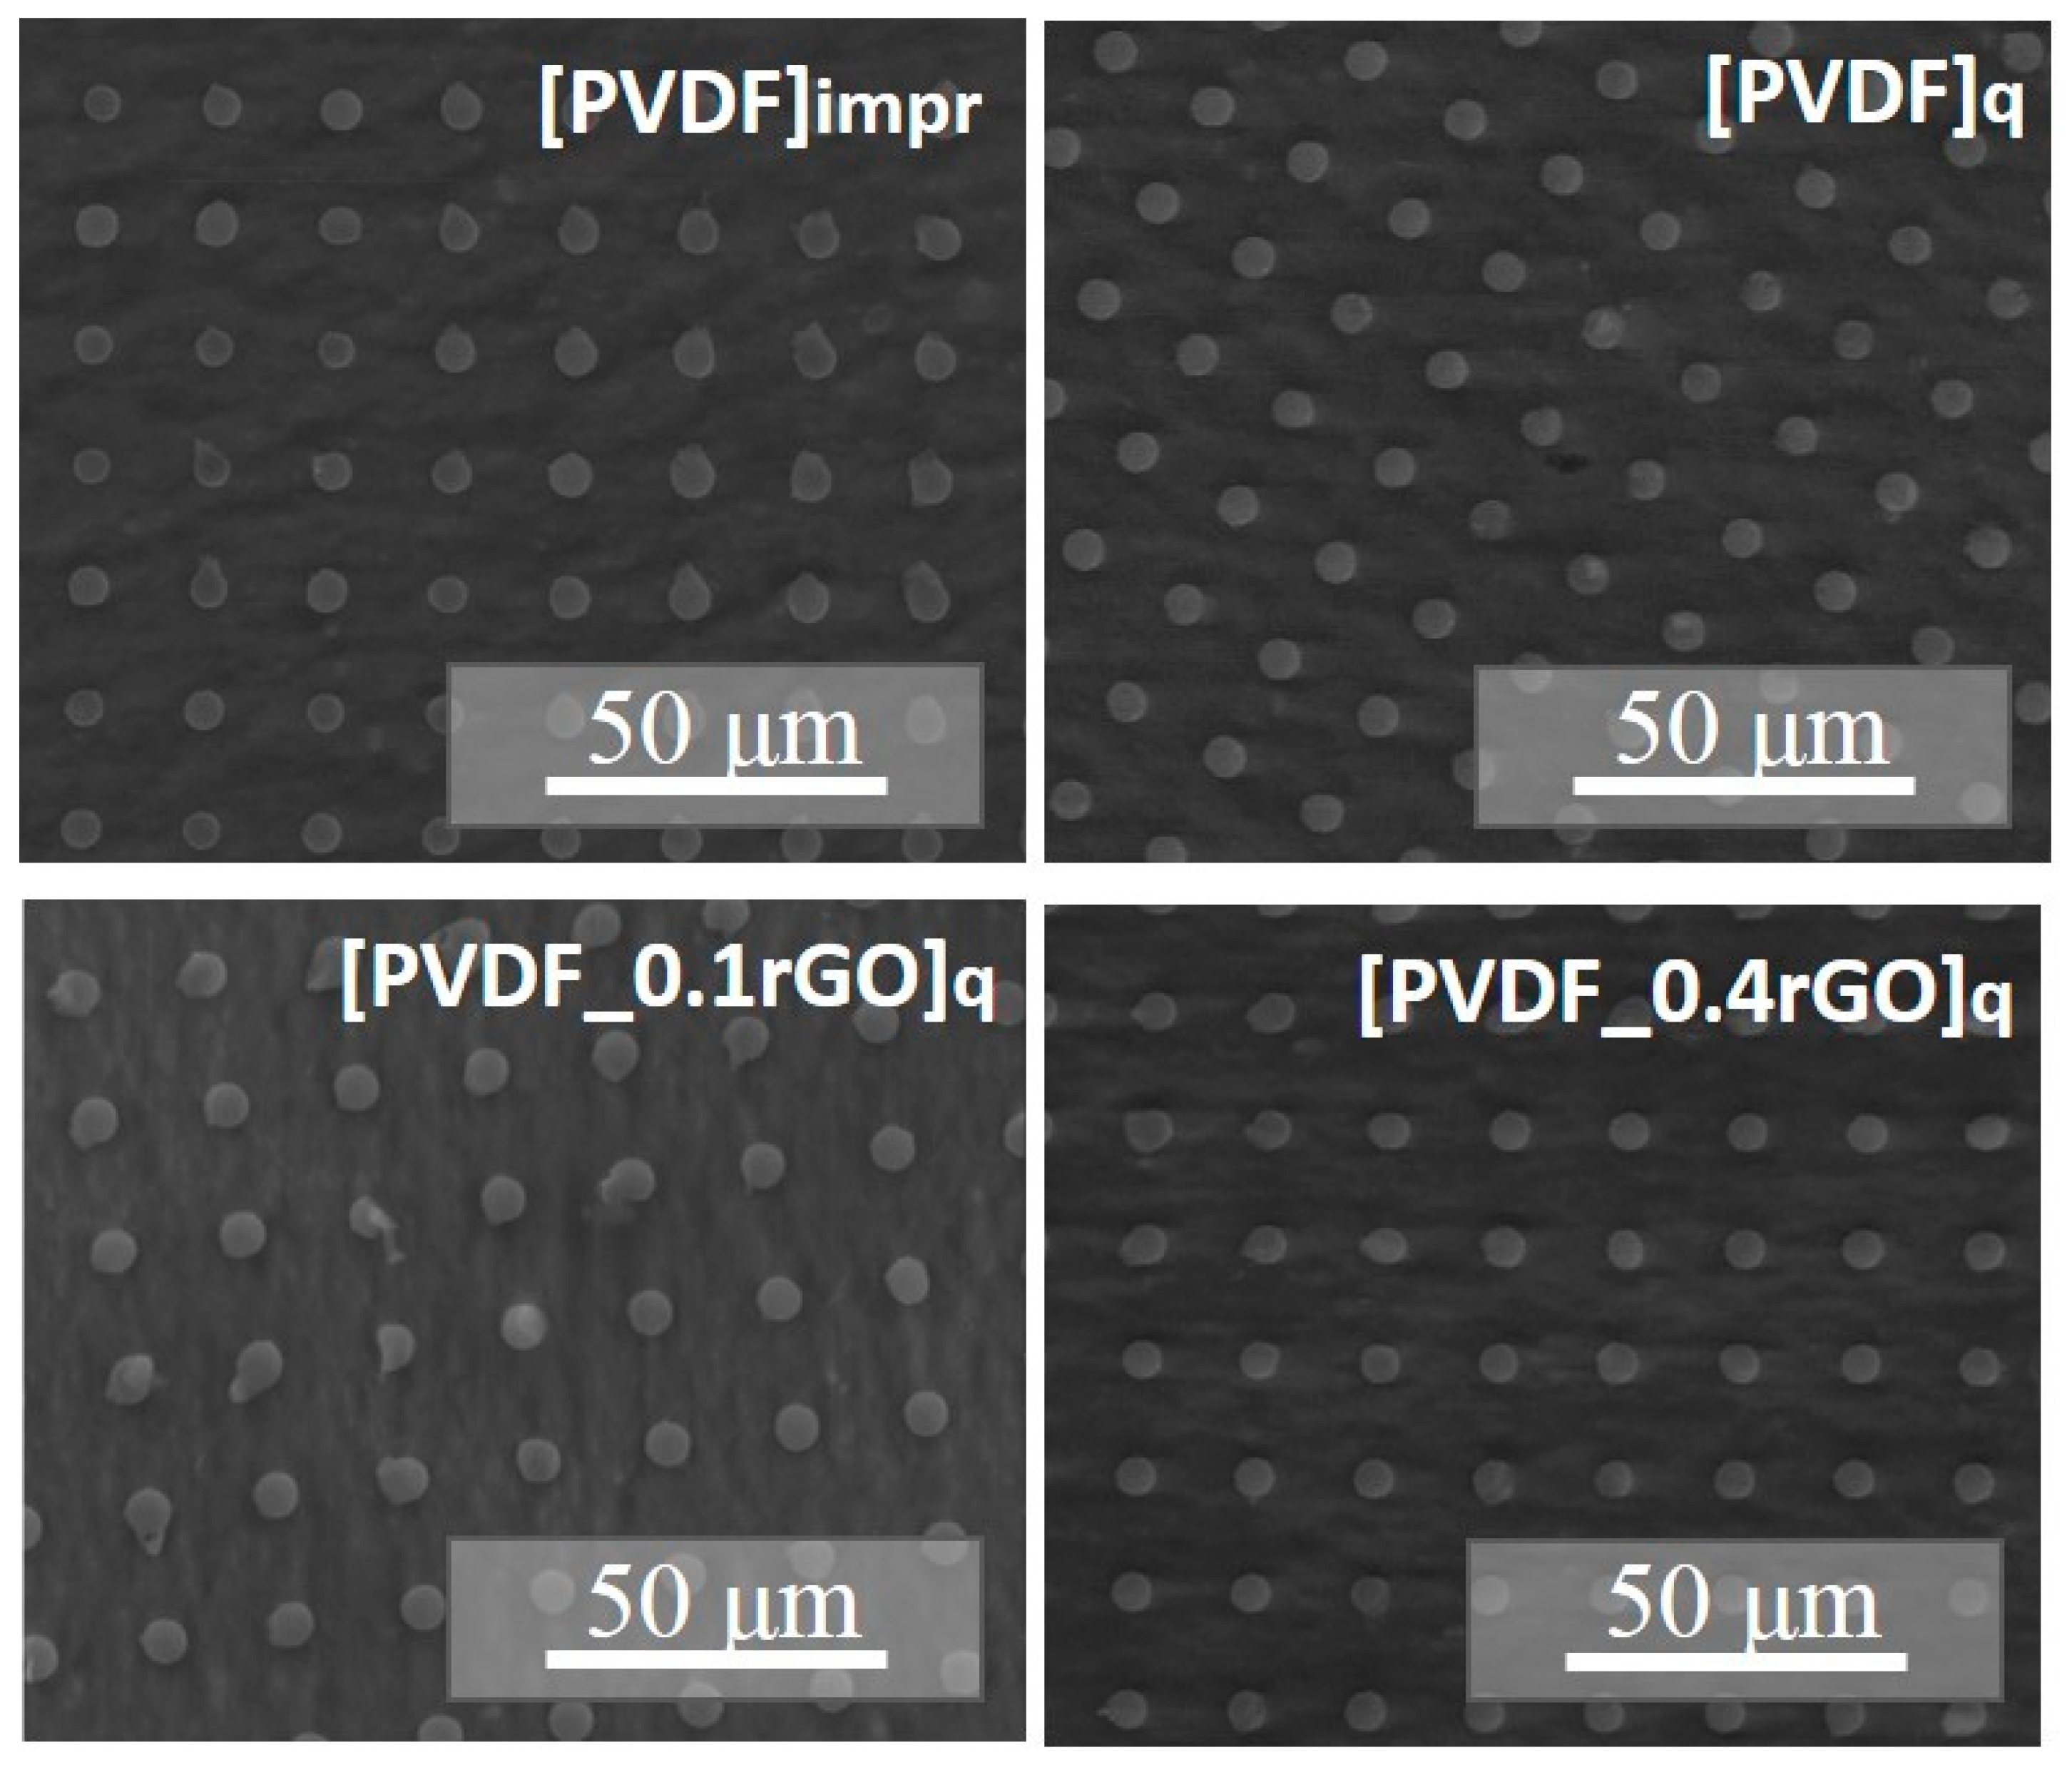
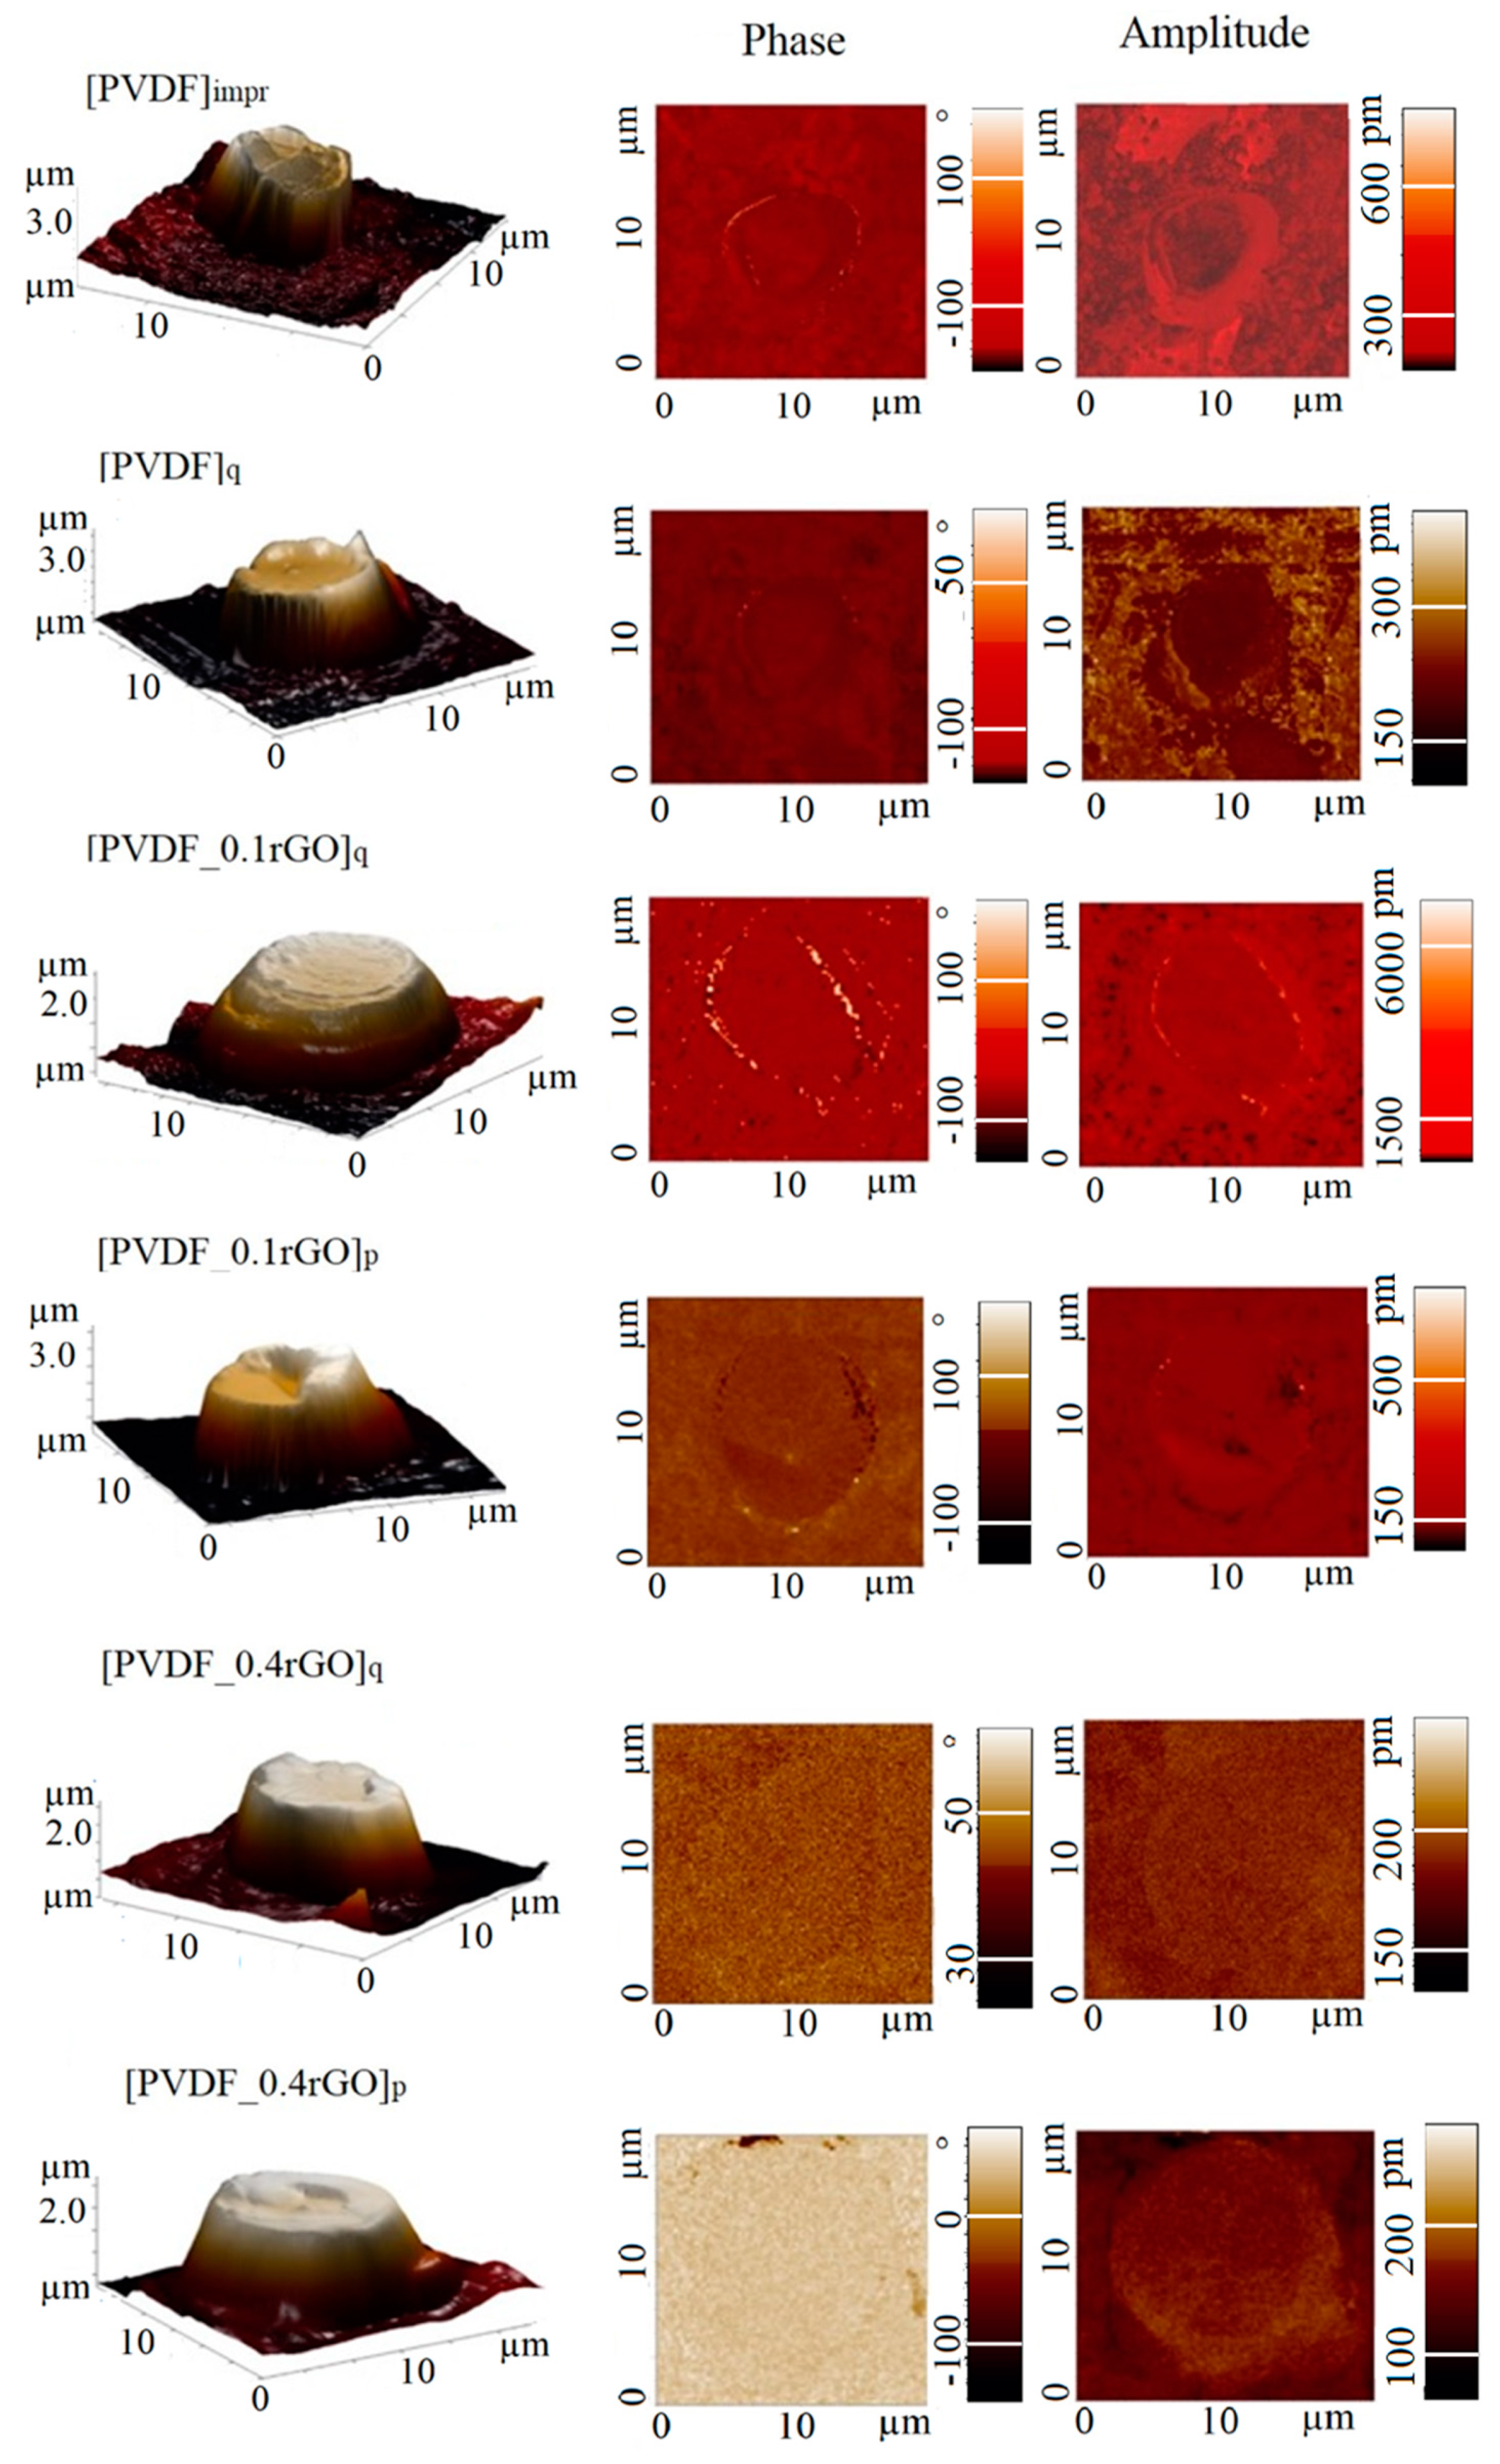
| No. | Group Label | Description |
|---|---|---|
| 1 | [PVDF]impr | Imprinted pristine PVDF micropillar array |
| 2 | [PVDF]q | Quenched pristine PVDF micropillar array |
| 3 | [PVDF_0.1rGO]q | Quenched composite PVDF/0.1 wt % rGO micropillar array |
| 4 | [PVDF_0.1rGO]p | Poled composite PVDF/0.1 wt % rGO micropillar array |
| 5 | [PVDF_0.4rGO]q | Quenched composite PVDF/0.4 wt % rGO micropillar array |
| 6 | [PVDF_0.4rGO]p | Poled composite PVDF/0.4 wt % rGO micropillar array |
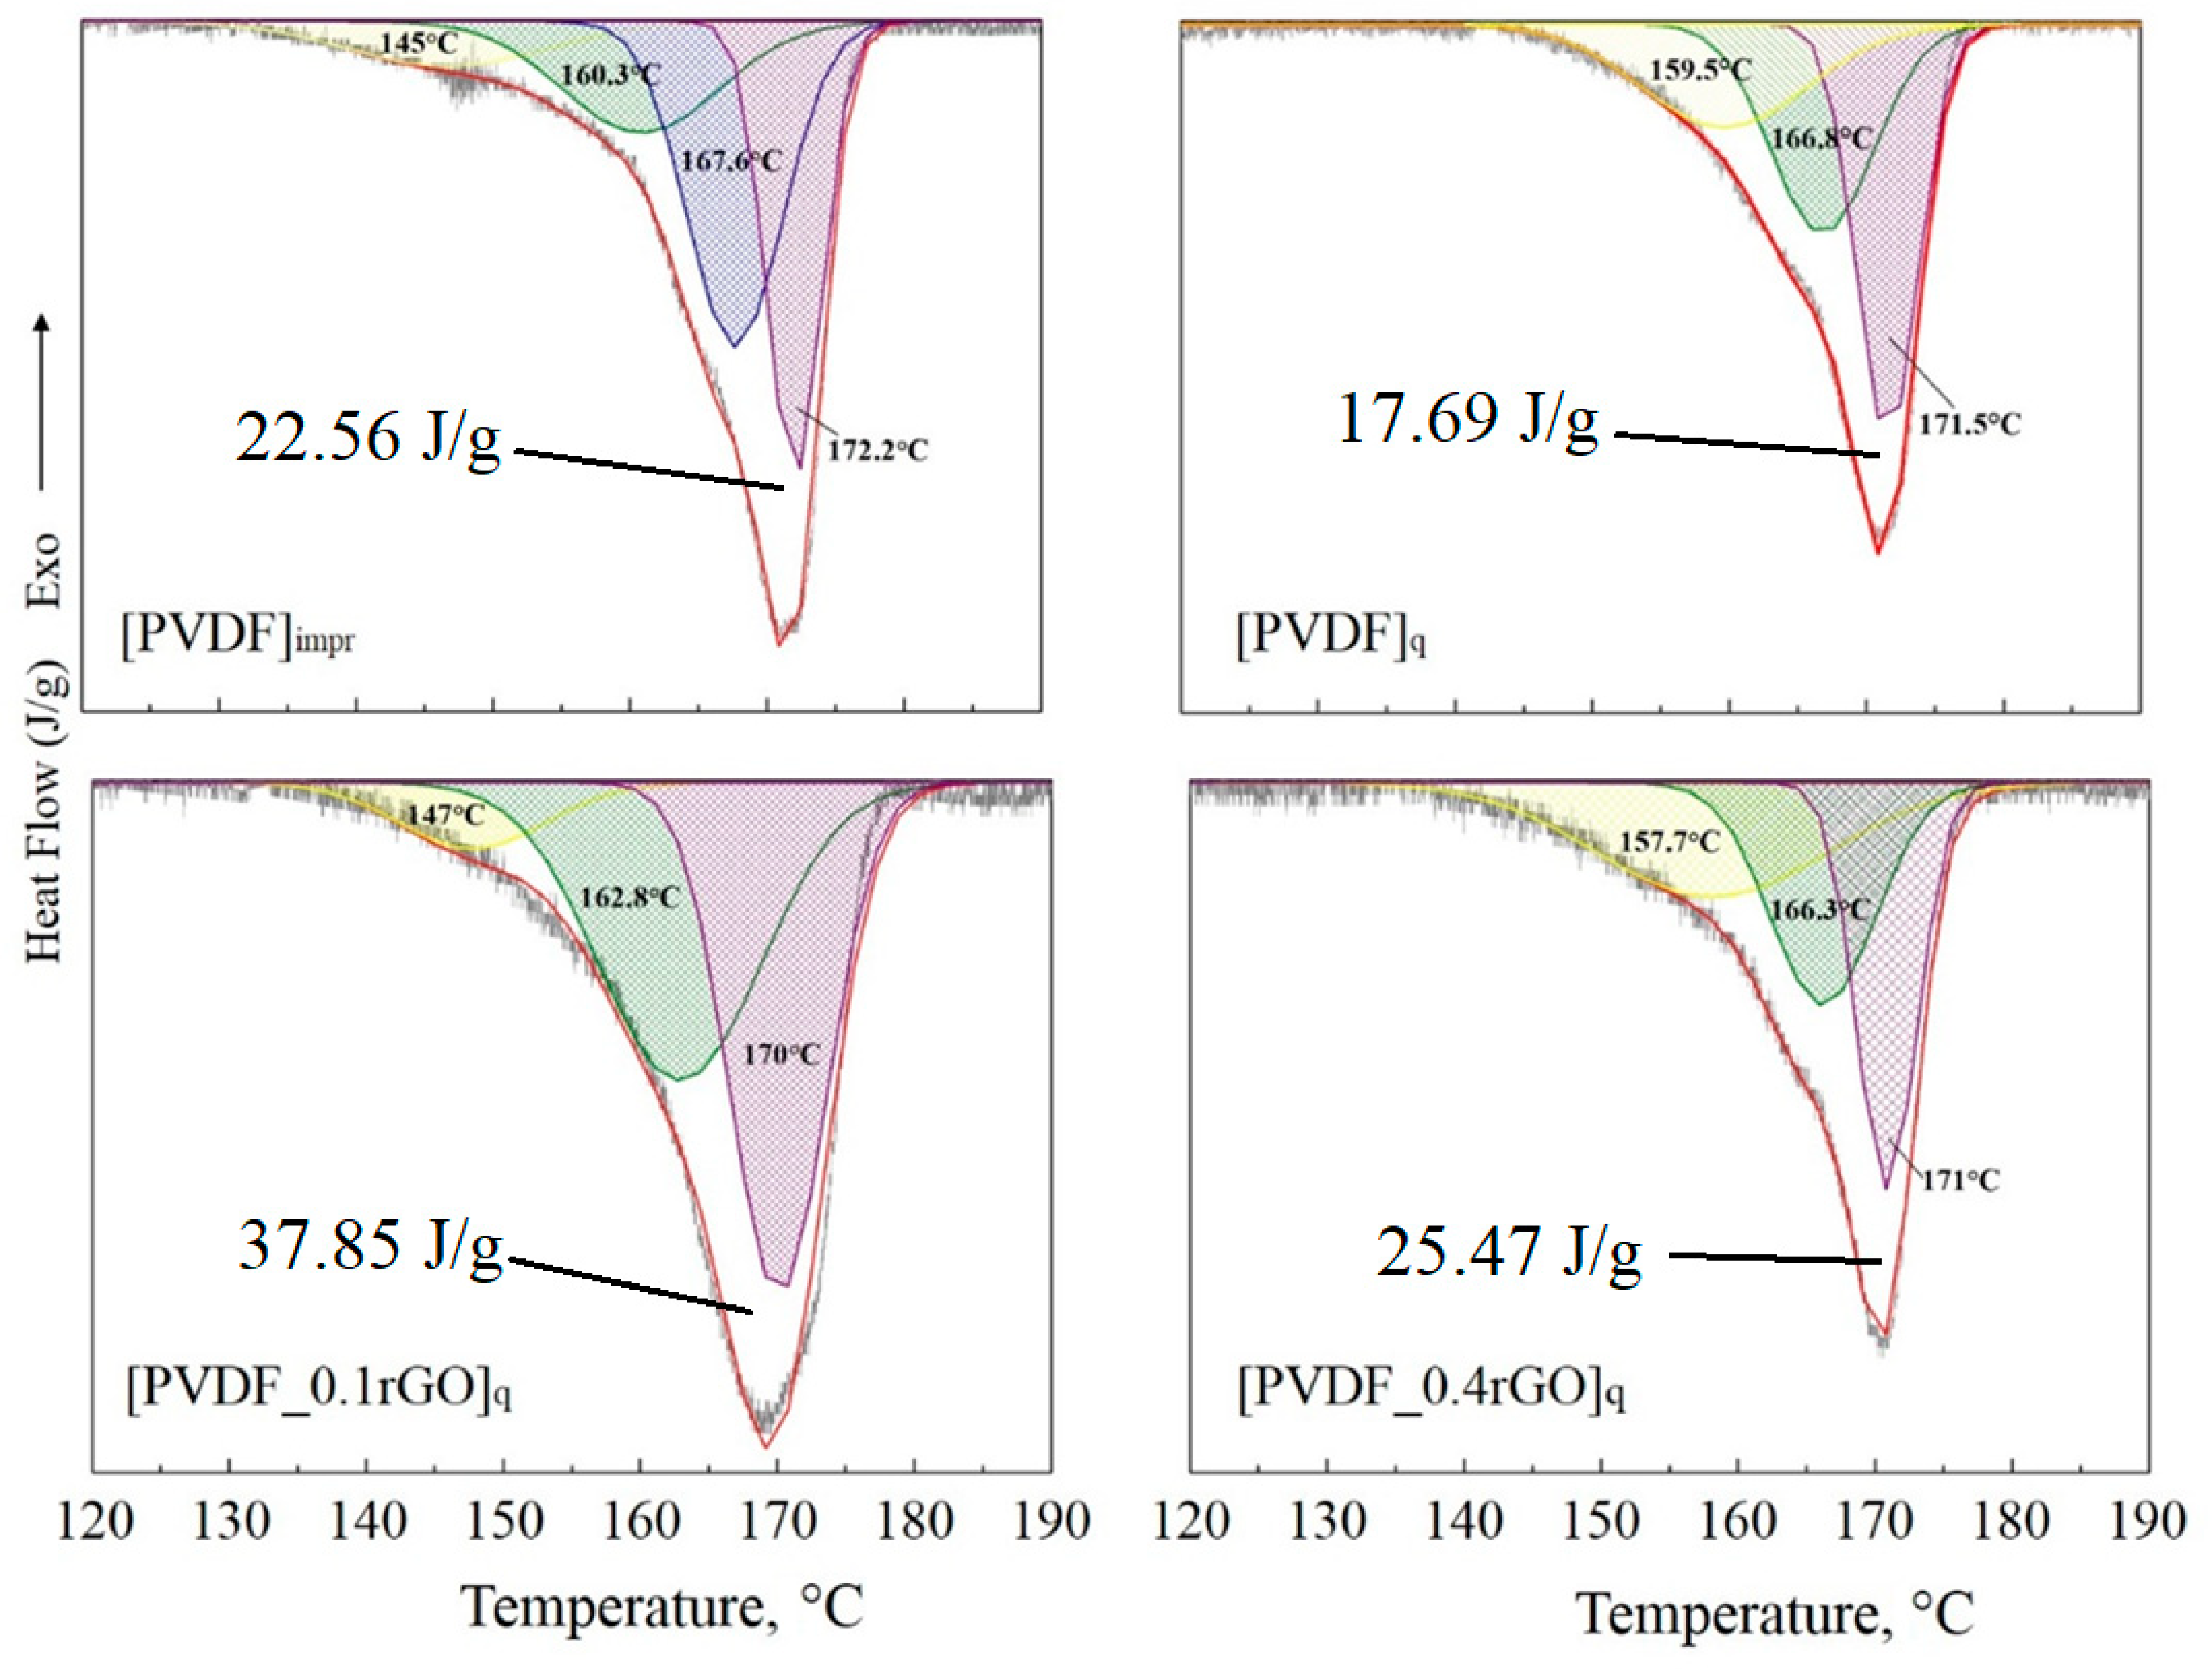
| Sample | Crystallinity, % |
|---|---|
| [PVDF]impr | 21 |
| [PVDF]q | 16 |
| [PVDF_0.1rGO]q | 36 |
| [PVDF_0.4rGO]q | 24 |
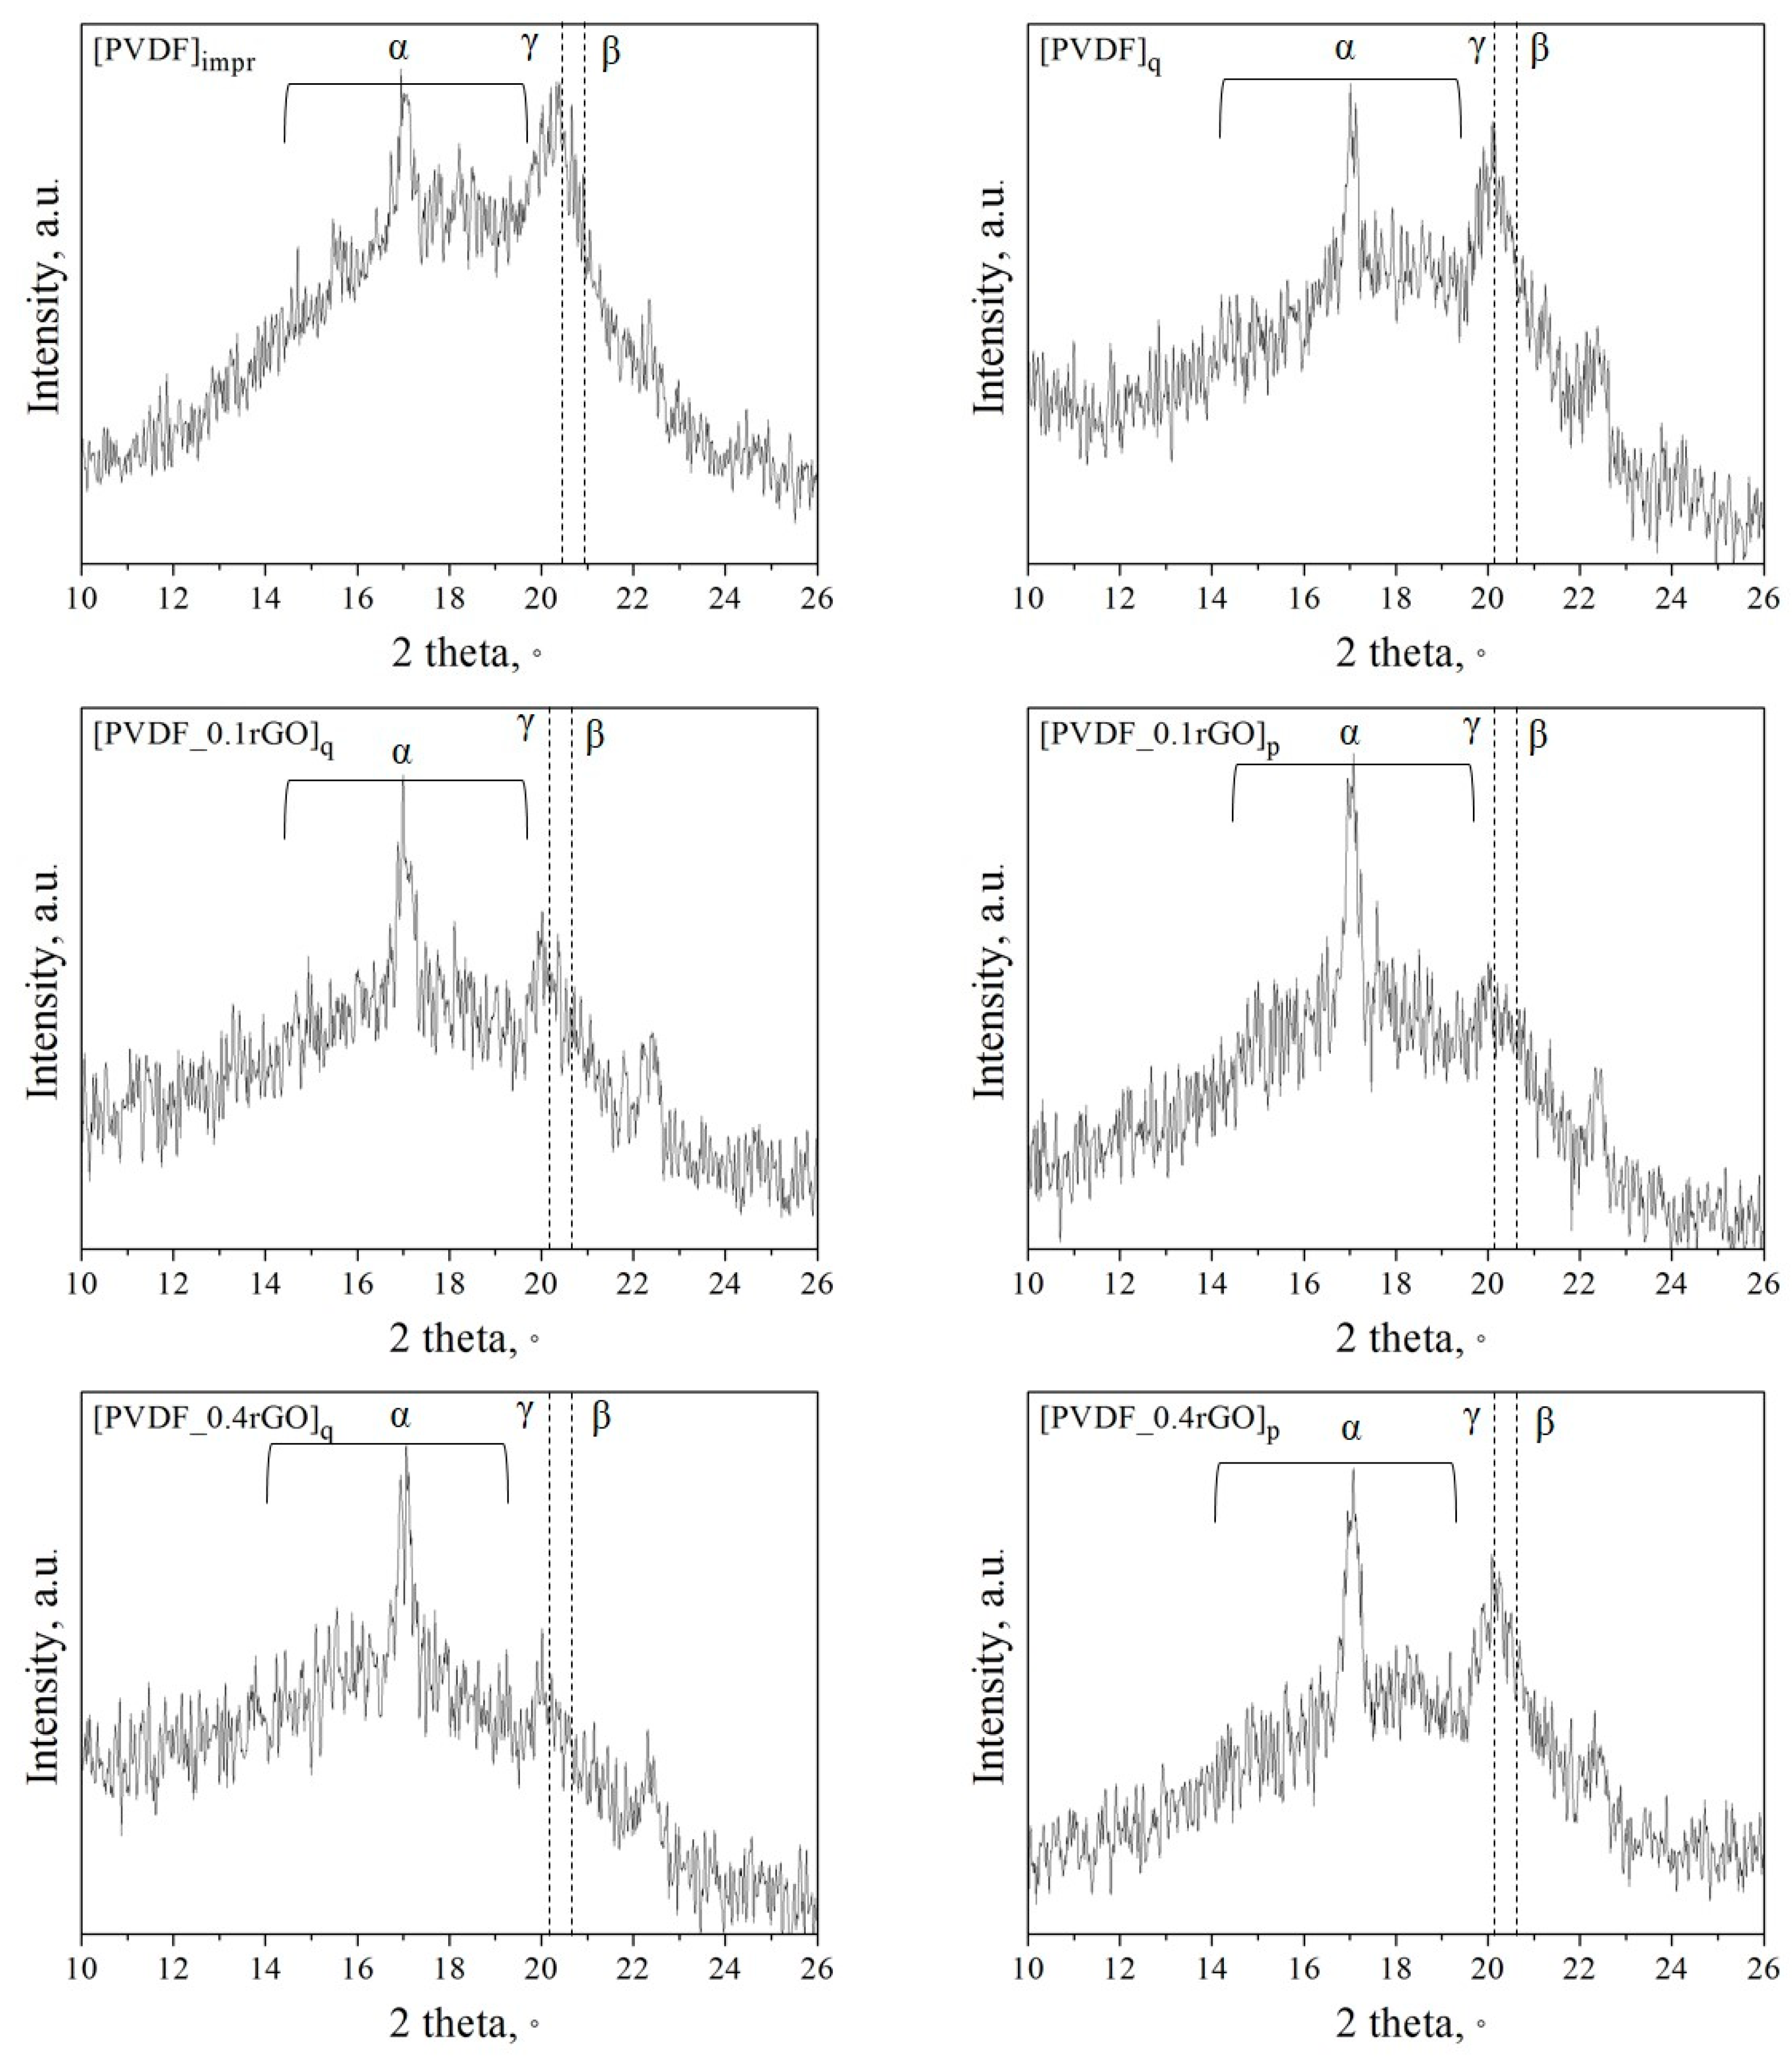
| Sample | α, % | β, % | γ, % |
|---|---|---|---|
| [PVDF]impr | 30(2) | 16(7) | 54(9) |
| [PVDF]q | 30(4) | 22(9) | 48(10) |
| [PVDF_0.1rGO]q | 22(3) | 27(10) | 51(16) |
| [PVDF_0.1rGO]p | 26(1) | 20(10) | 54(3) |
| [PVDF_0.4rGO]q | 32(9) | 21(10) | 47(18) |
| [PVDF_0.4rGO]p | 32(10) | 23(6) | 45(4) |
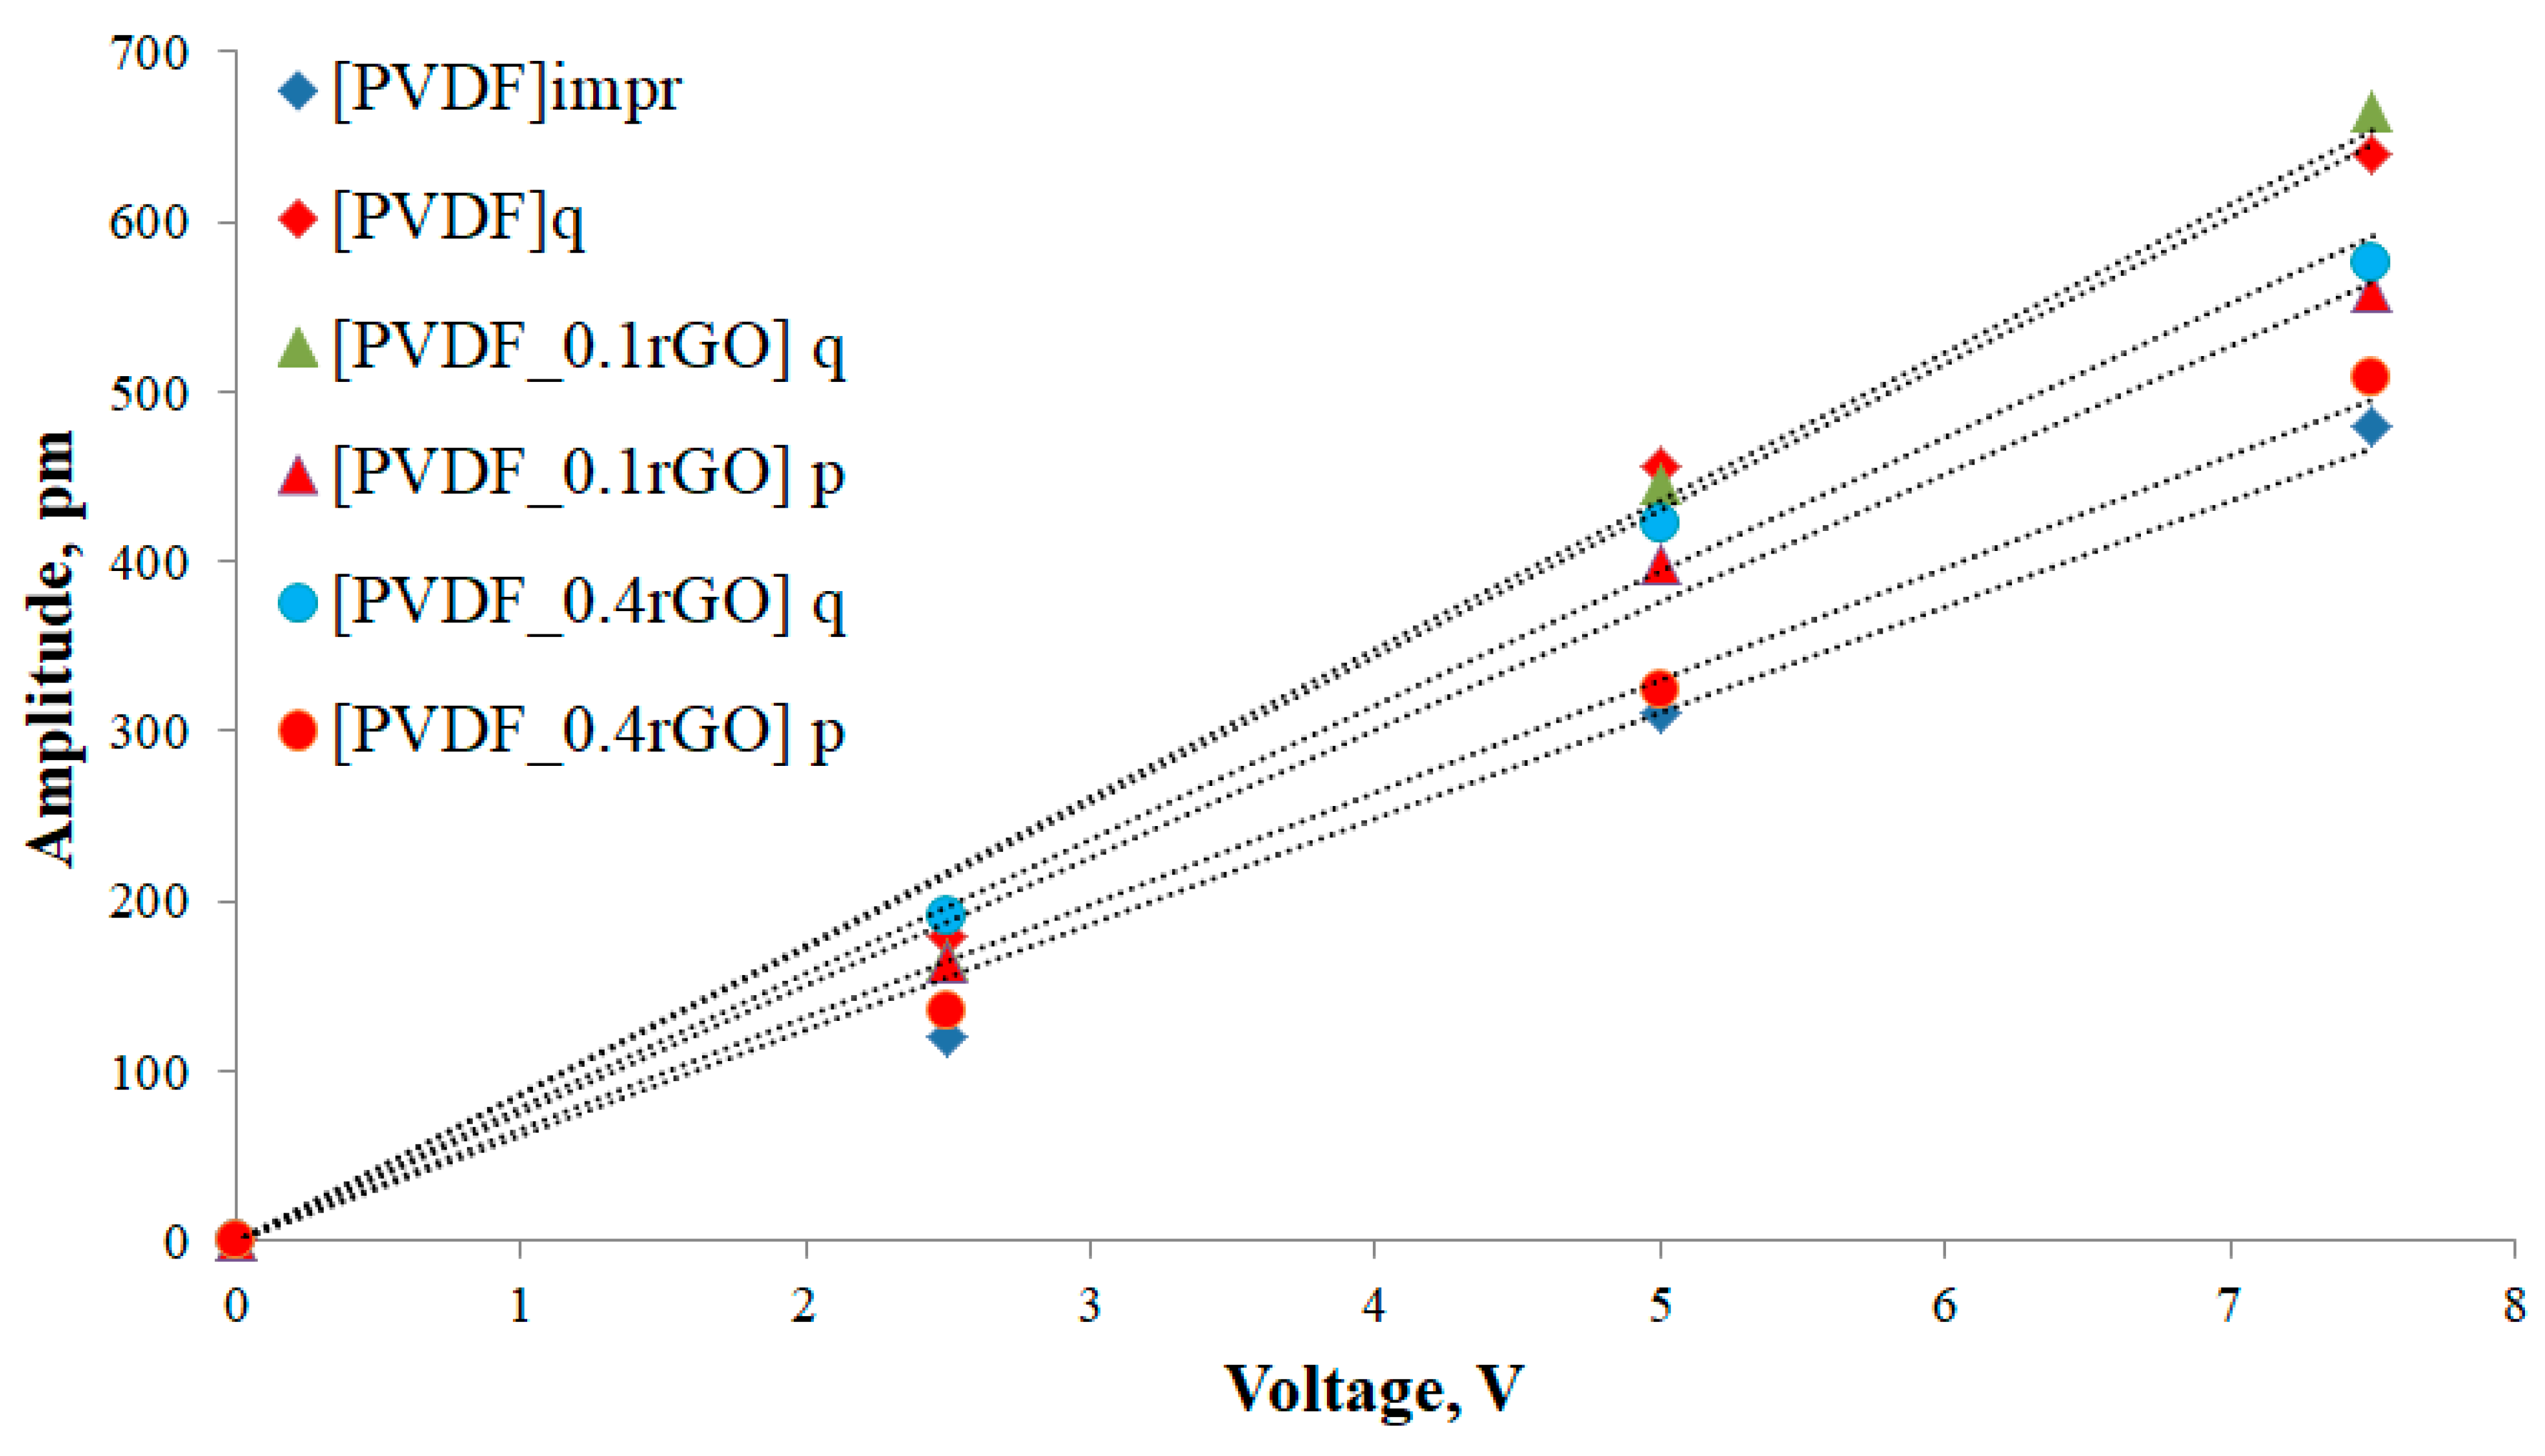
| Current Study | Literature Overview | ||
|---|---|---|---|
| Sample | |d33eff|, pm/V | Sample | |d33eff|, pm/V (pC/N) |
| [PVDF]impr | 64 | Corona poled β-phase PVDF film [51] | 28 |
| [PVDF]q | 86 | Drawn PVDF film (stretching ratio = 5) [44] | 34 |
| [PVDF_0.1rGO]q | 87 | Poled PVDF film (E = 400 kV/cm) [50] | 17.5 |
| [PVDF_0.1rGO]p | 75 | Quenched at −20 °C PVDF film [16] | 49.6 |
| [PVDF_0.4rGO]q | 79 | γ-phase PVDF single nanoribbon [52] | 58.5 |
| [PVDF_0.4rGO]p | 66 | Simulated data for P(VDF-TrFE)/GO composite [53] | 29.8 |
© 2019 by the authors. Licensee MDPI, Basel, Switzerland. This article is an open access article distributed under the terms and conditions of the Creative Commons Attribution (CC BY) license (http://creativecommons.org/licenses/by/4.0/).
Share and Cite
Pariy, I.O.; Ivanova, A.A.; Shvartsman, V.V.; Lupascu, D.C.; Sukhorukov, G.B.; Ludwig, T.; Bartasyte, A.; Mathur, S.; Surmeneva, M.A.; Surmenev, R.A. Piezoelectric Response in Hybrid Micropillar Arrays of Poly(Vinylidene Fluoride) and Reduced Graphene Oxide. Polymers 2019, 11, 1065. https://doi.org/10.3390/polym11061065
Pariy IO, Ivanova AA, Shvartsman VV, Lupascu DC, Sukhorukov GB, Ludwig T, Bartasyte A, Mathur S, Surmeneva MA, Surmenev RA. Piezoelectric Response in Hybrid Micropillar Arrays of Poly(Vinylidene Fluoride) and Reduced Graphene Oxide. Polymers. 2019; 11(6):1065. https://doi.org/10.3390/polym11061065
Chicago/Turabian StylePariy, Igor O., Anna A. Ivanova, Vladimir V. Shvartsman, Doru C. Lupascu, Gleb B. Sukhorukov, Tim Ludwig, Ausrine Bartasyte, Sanjay Mathur, Maria A. Surmeneva, and Roman A. Surmenev. 2019. "Piezoelectric Response in Hybrid Micropillar Arrays of Poly(Vinylidene Fluoride) and Reduced Graphene Oxide" Polymers 11, no. 6: 1065. https://doi.org/10.3390/polym11061065
APA StylePariy, I. O., Ivanova, A. A., Shvartsman, V. V., Lupascu, D. C., Sukhorukov, G. B., Ludwig, T., Bartasyte, A., Mathur, S., Surmeneva, M. A., & Surmenev, R. A. (2019). Piezoelectric Response in Hybrid Micropillar Arrays of Poly(Vinylidene Fluoride) and Reduced Graphene Oxide. Polymers, 11(6), 1065. https://doi.org/10.3390/polym11061065