Modelling the Temperature Dependent Biaxial Response of Poly(ether-ether-ketone) Above and Below the Glass Transition for Thermoforming Applications


Abstract
:
1. Introduction
2. Constitutive Modelling
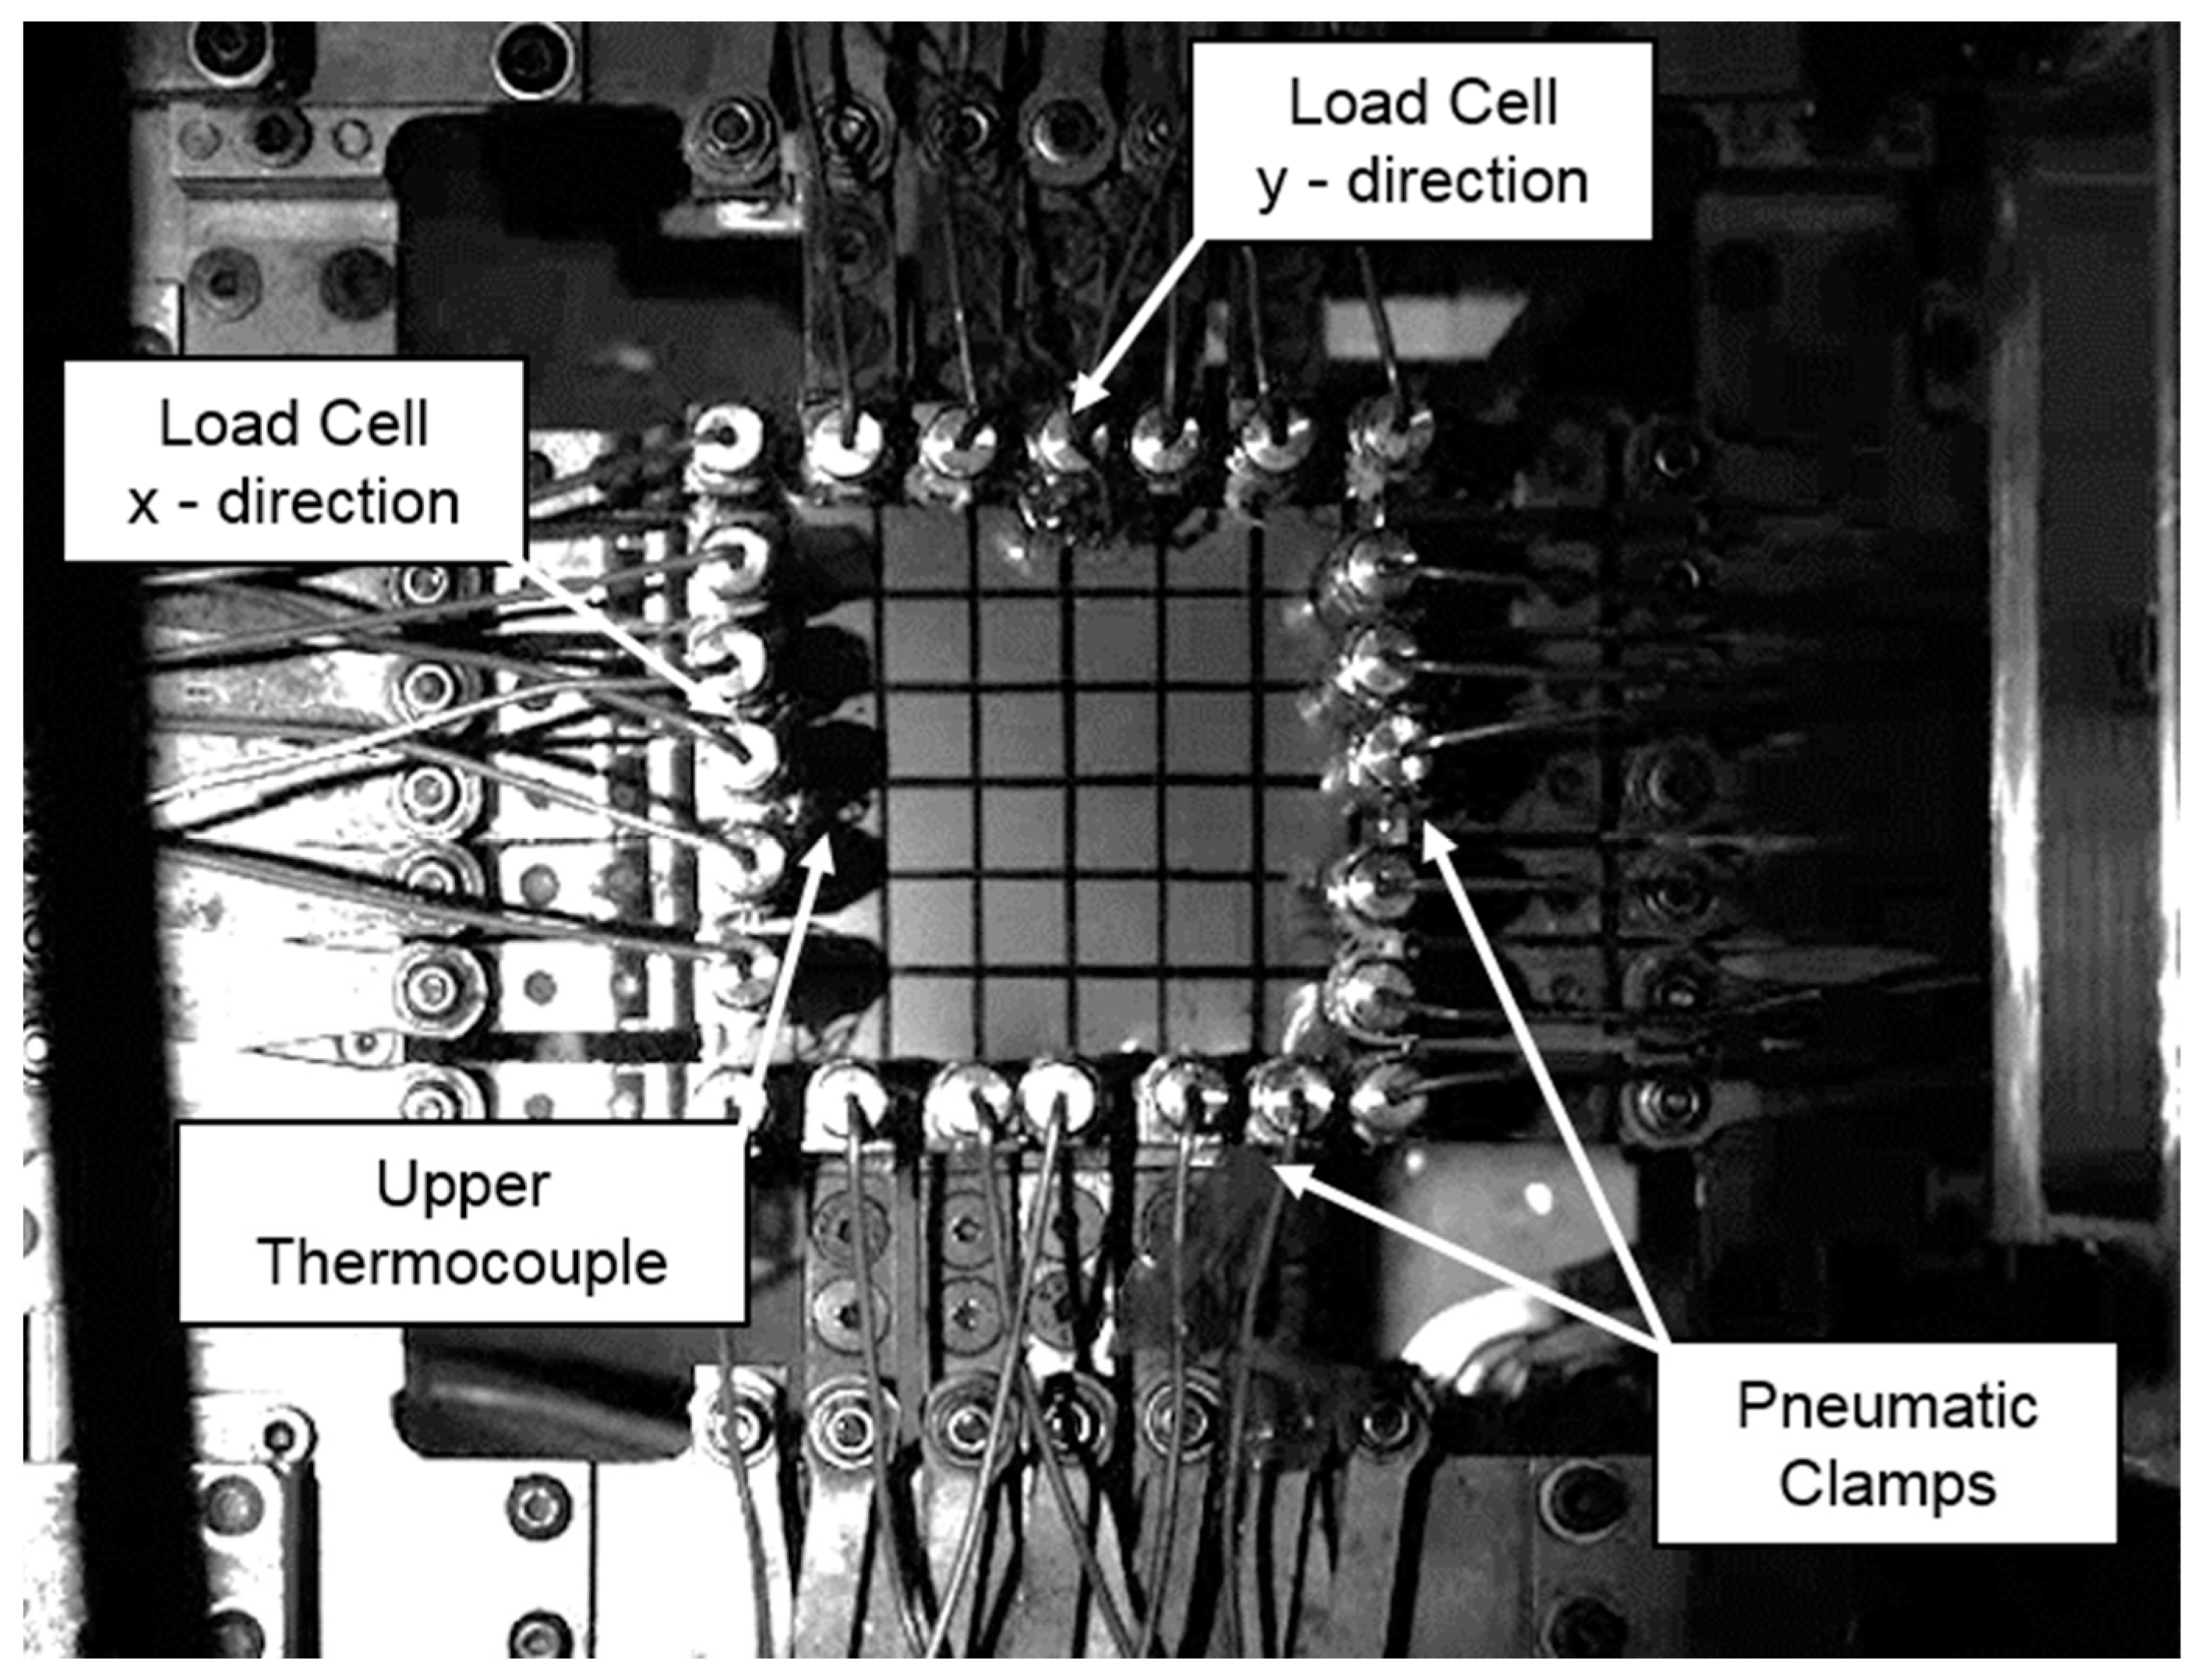
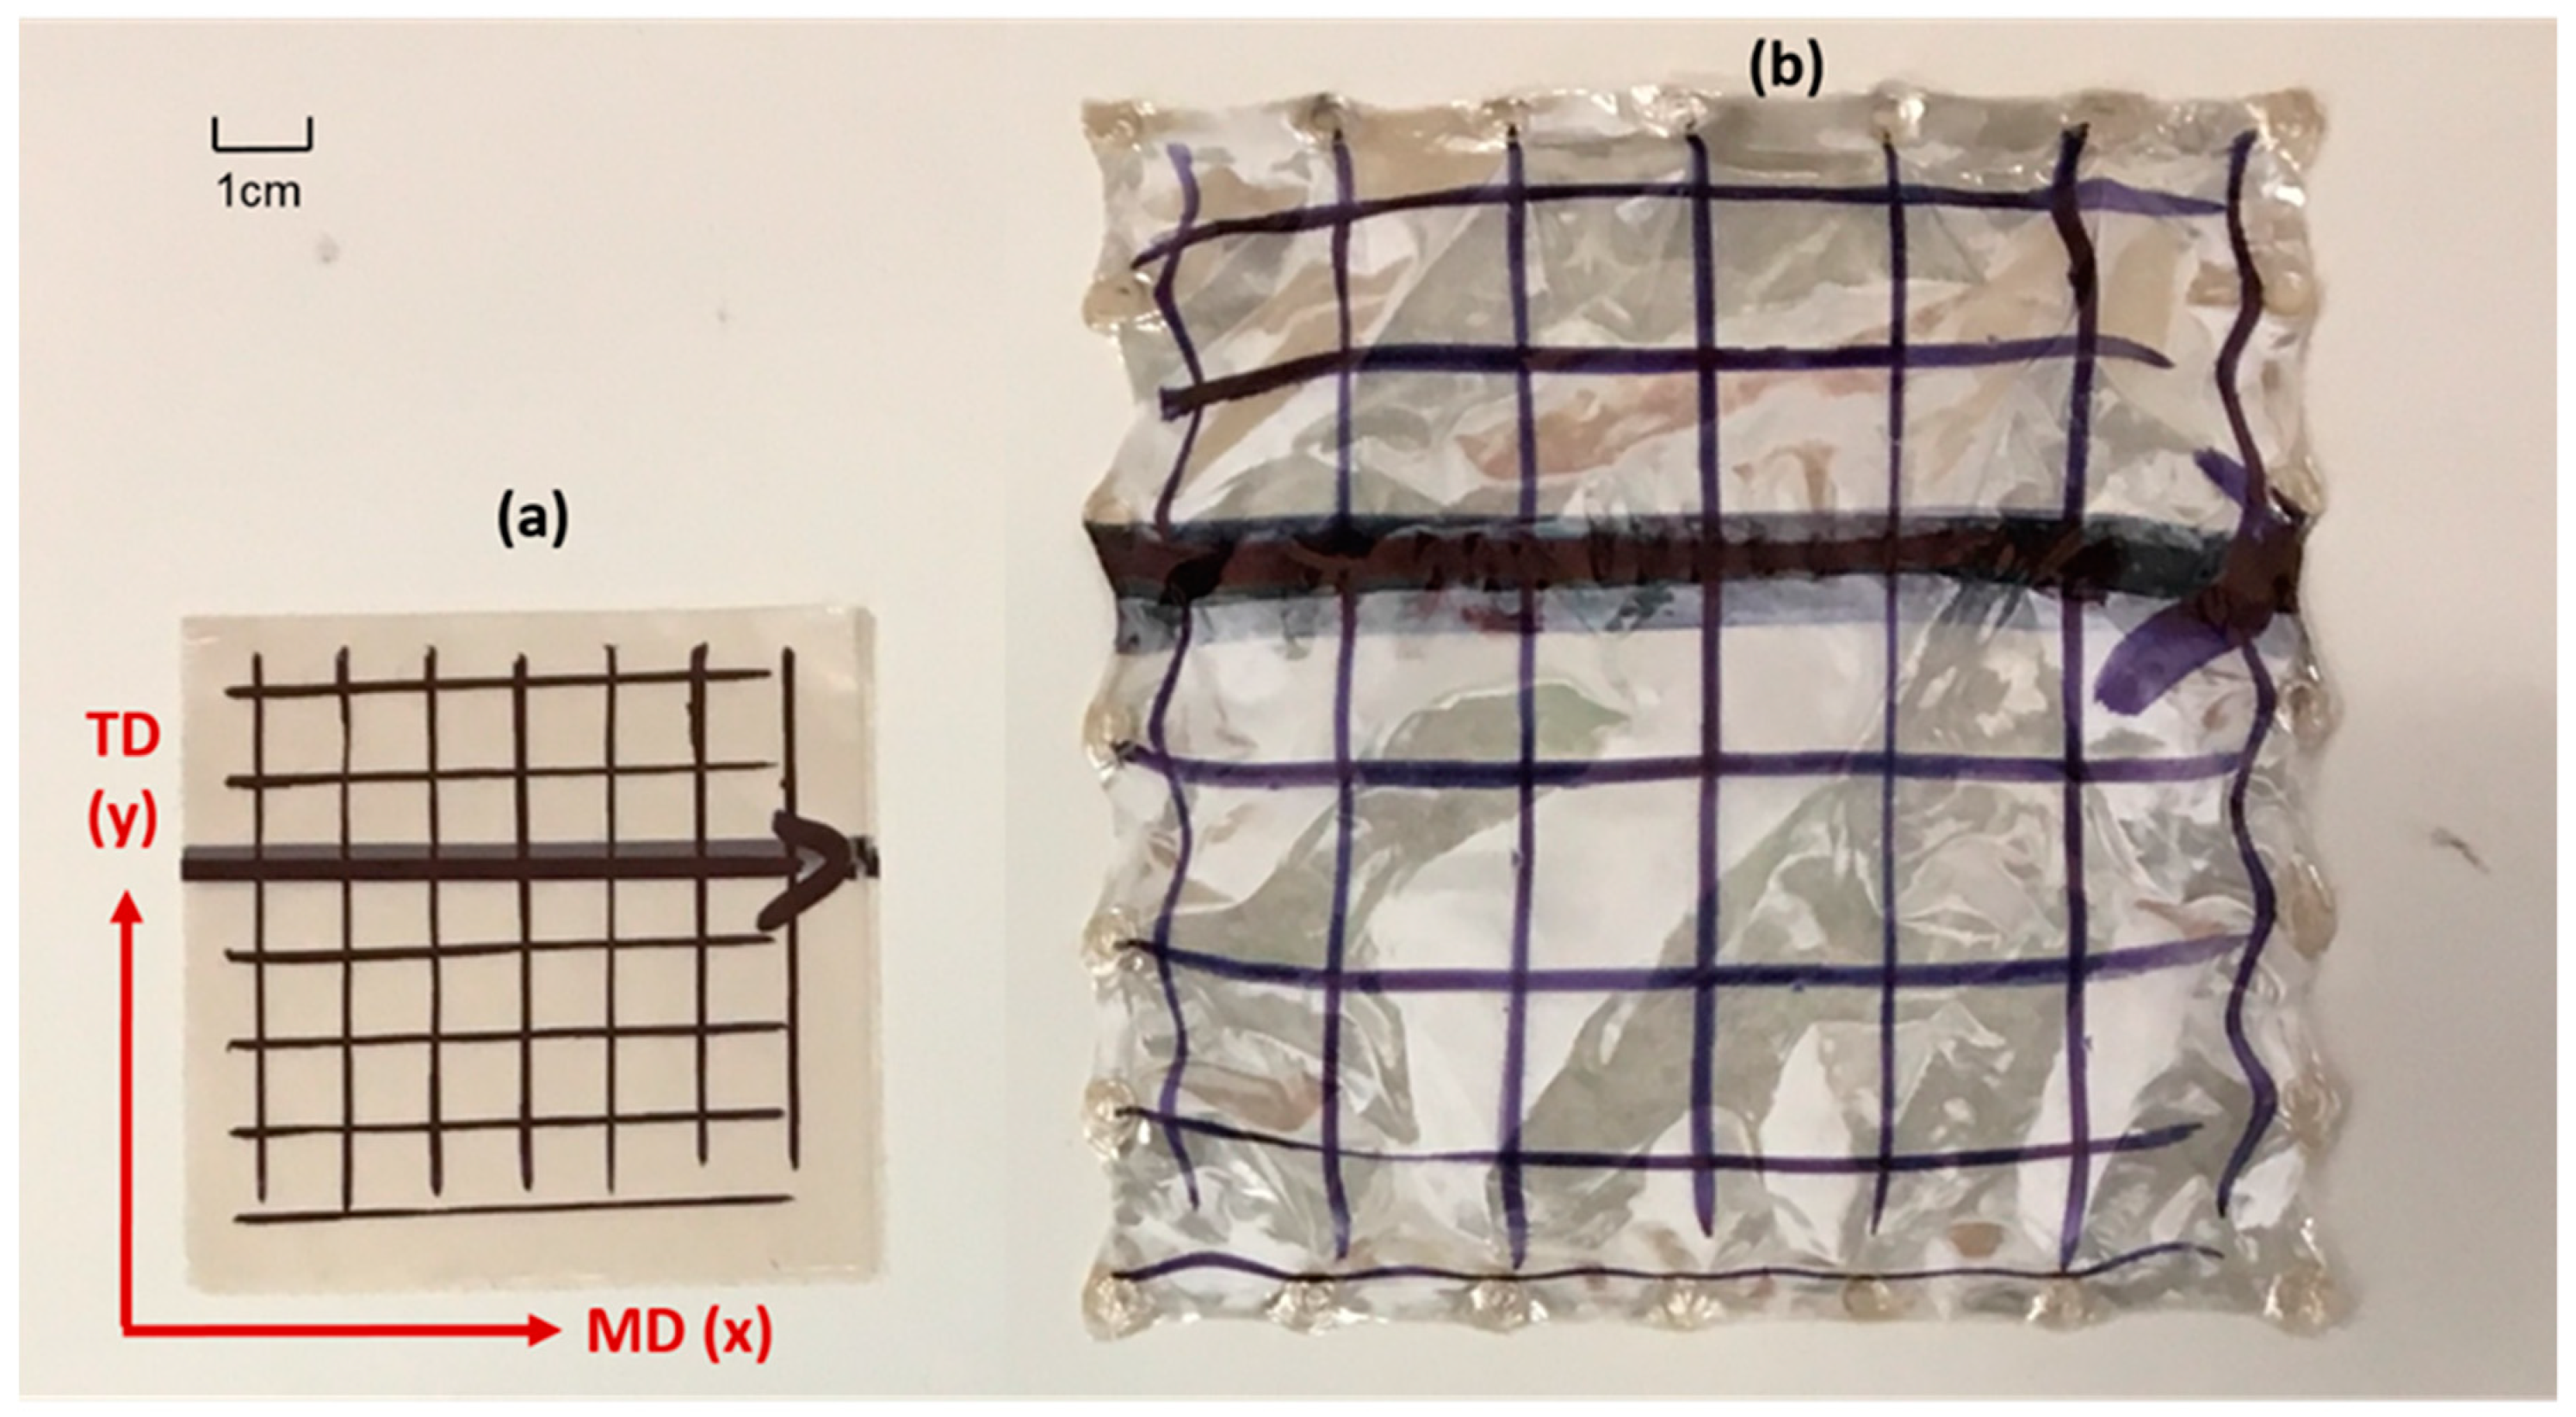
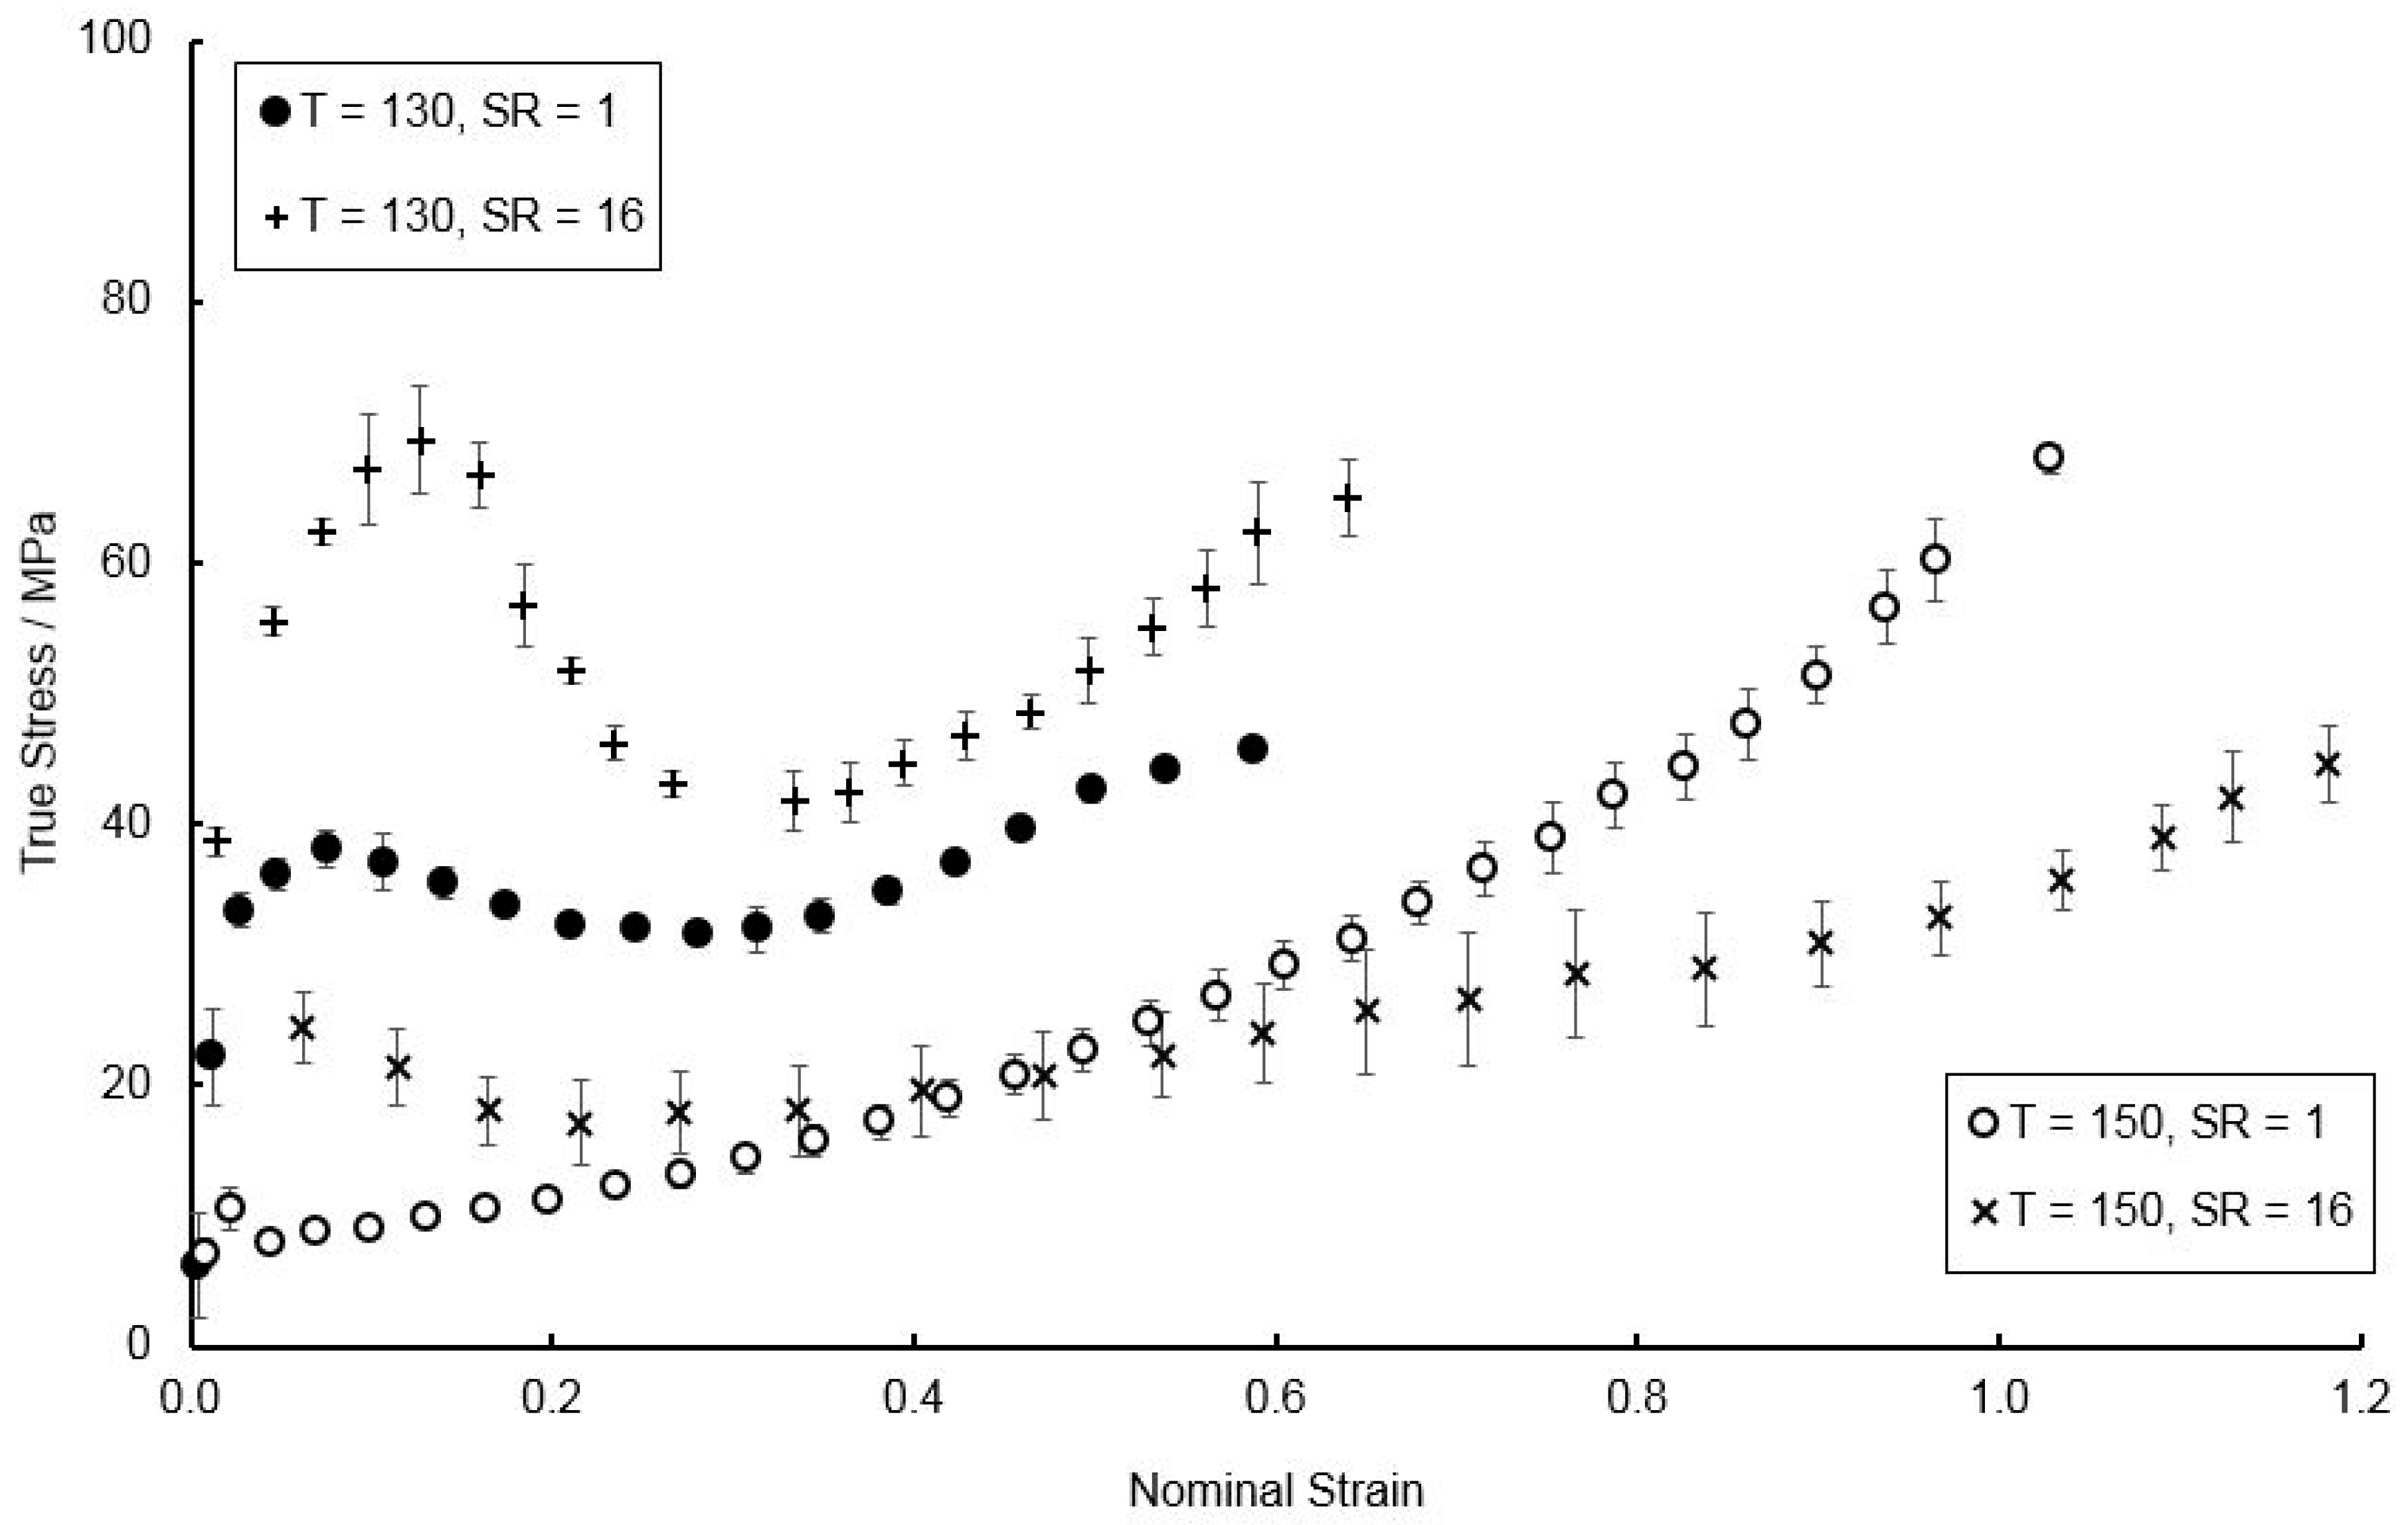
2.1. Material Testing
2.2. Buckley Material Model
2.3. Existing Capabilities of Buckley Material Model
2.4. Modification to the Material Model
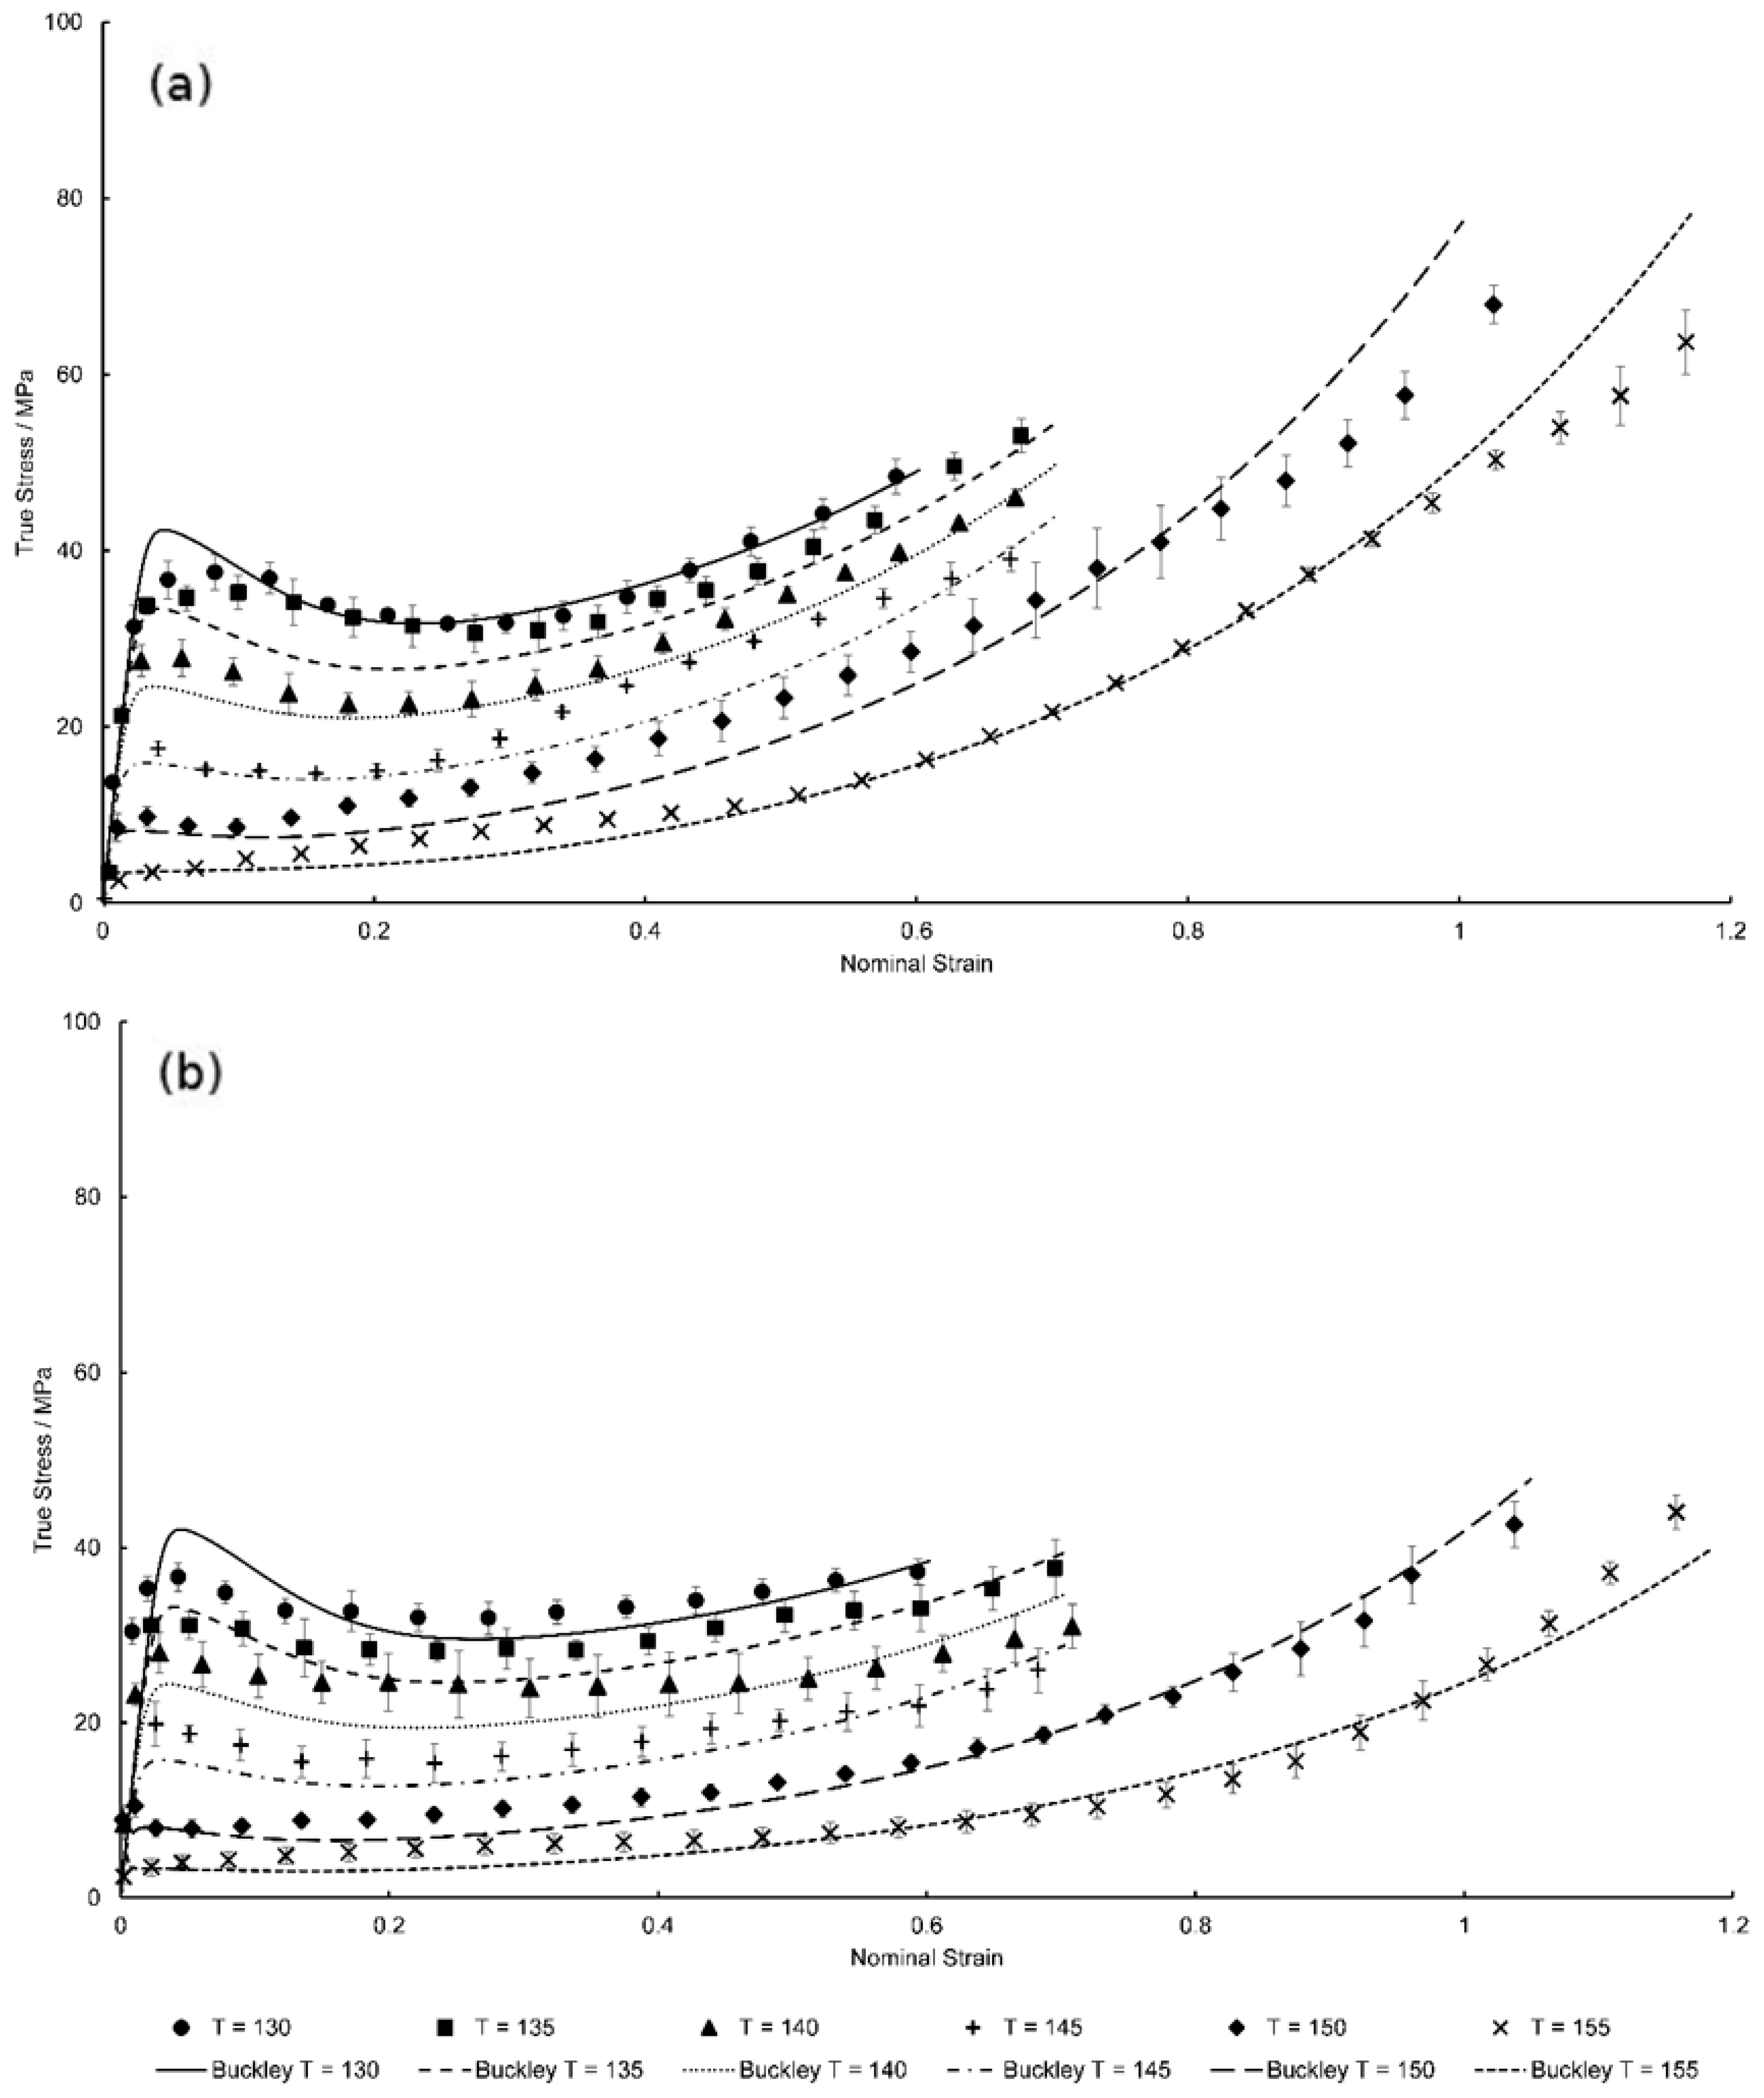
3. Fitting of Constitutive Model
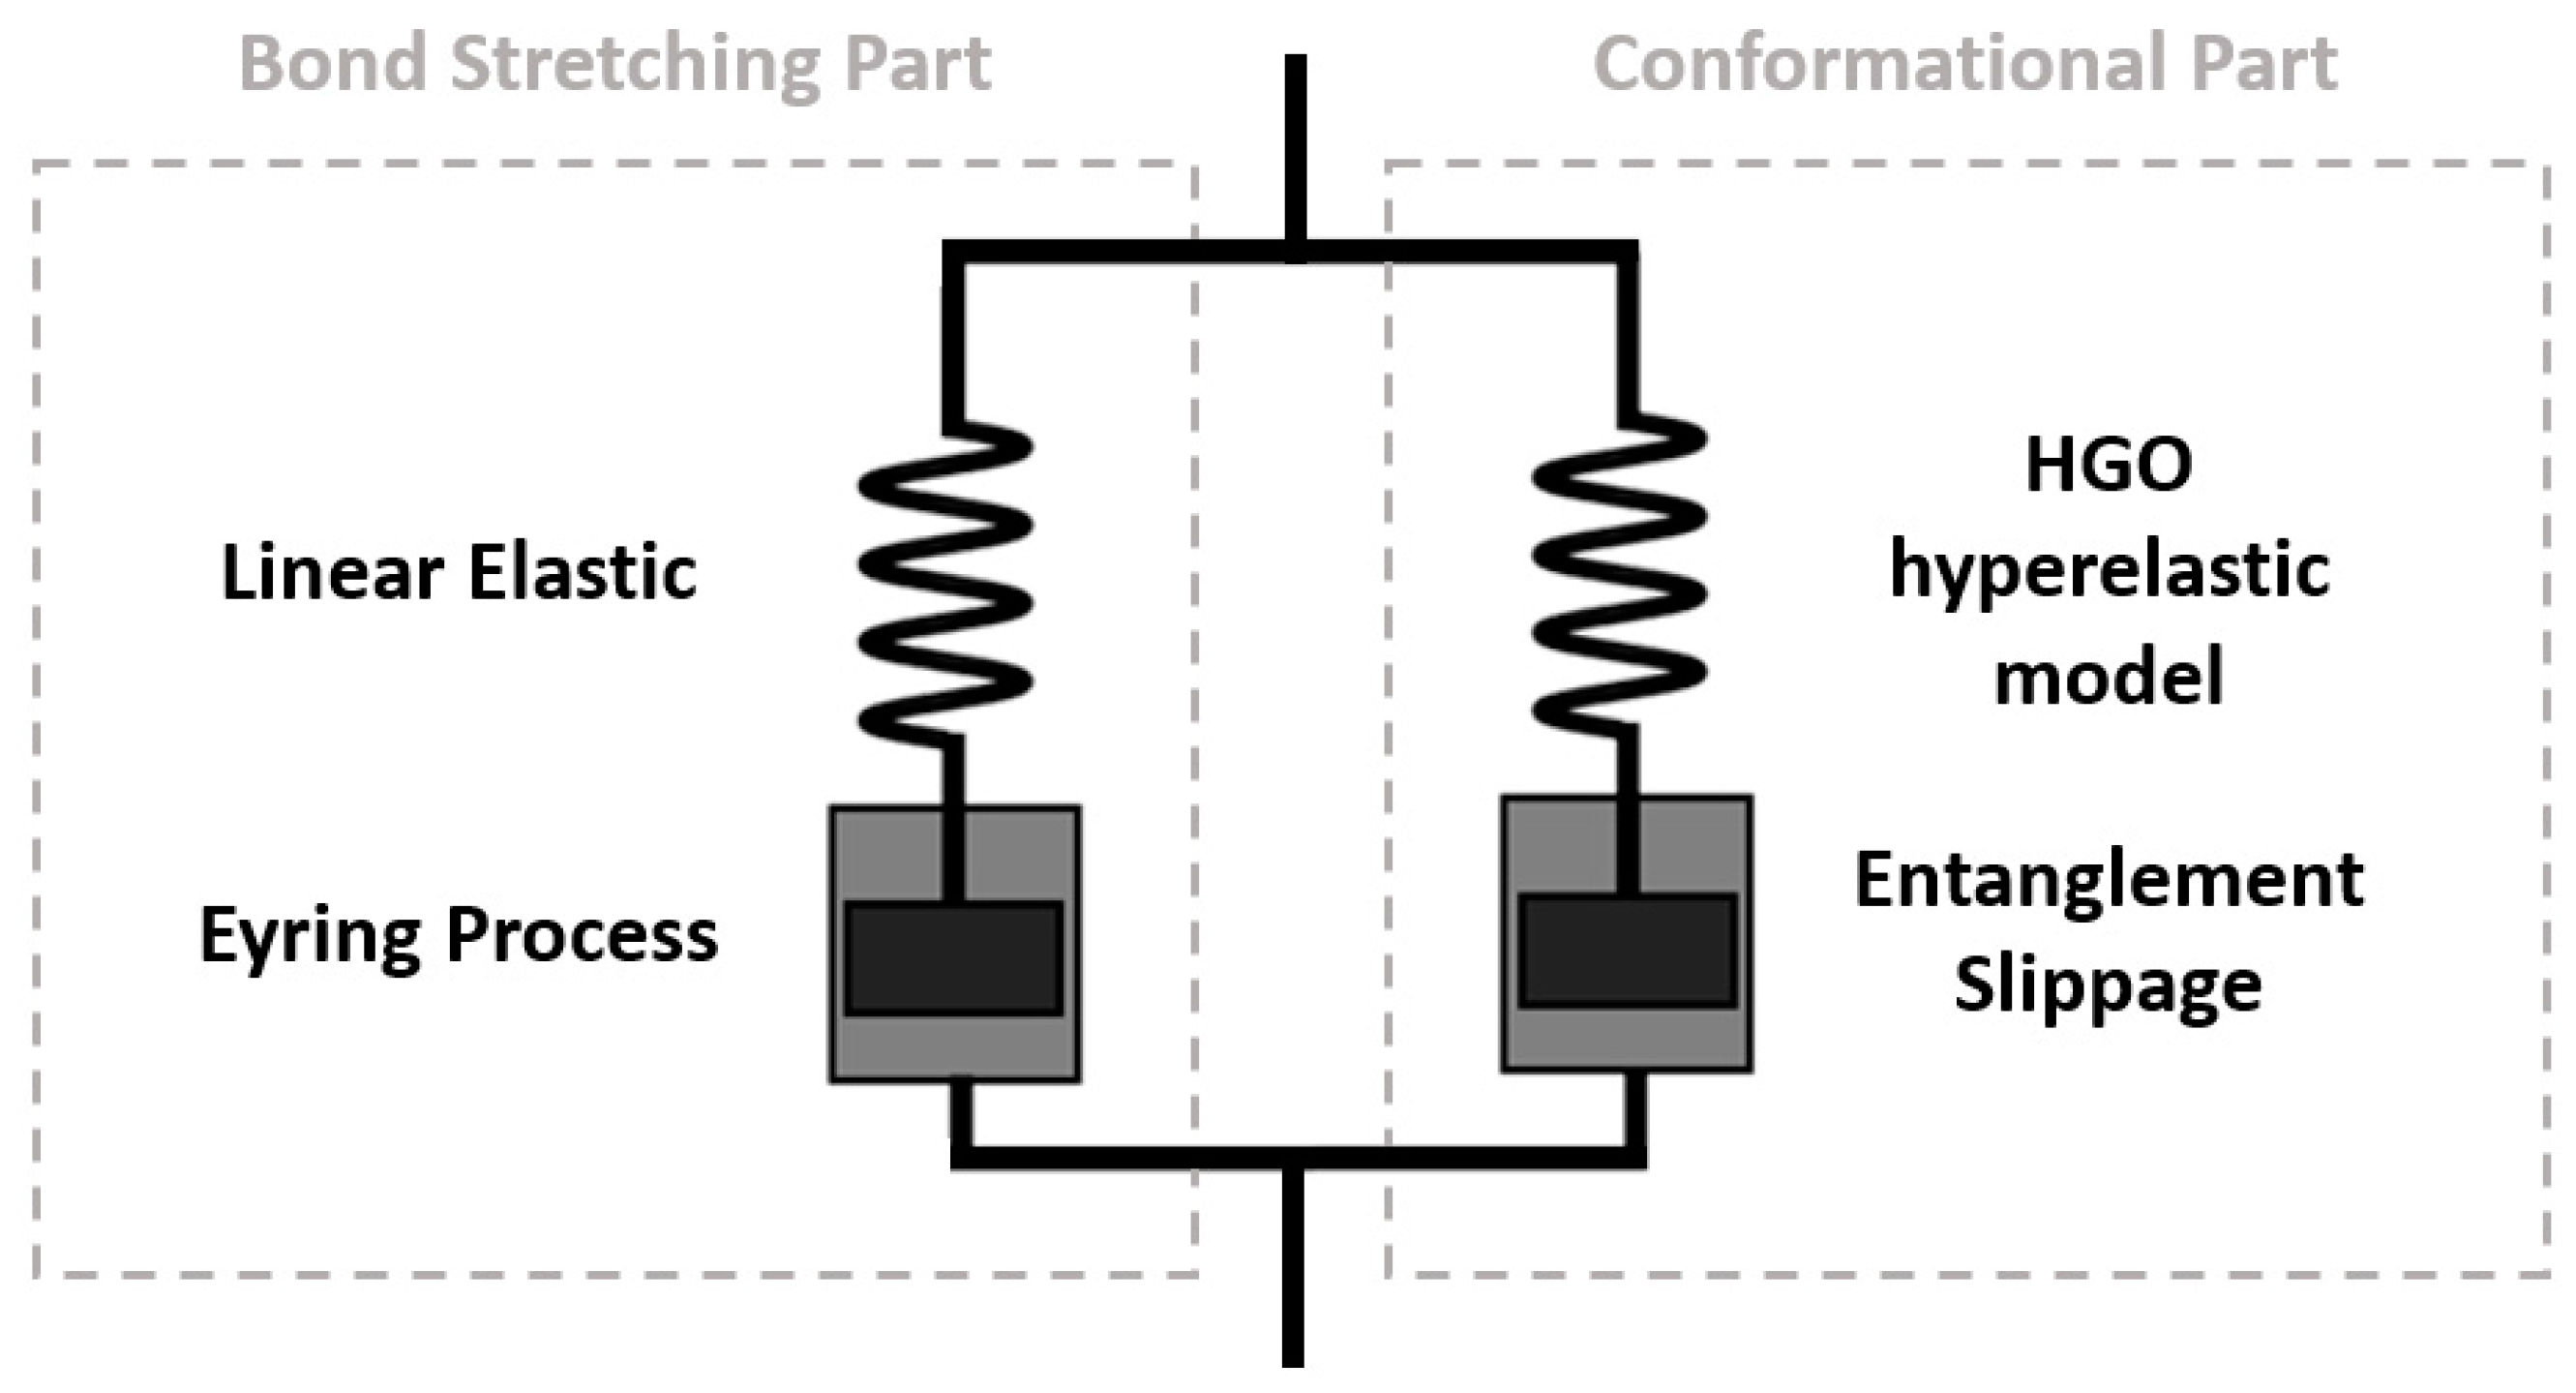
3.1. The Eyring Process in the Bond Stretching Component
3.2. Evolution of Fictive Temperature in the Bond Stretching Part
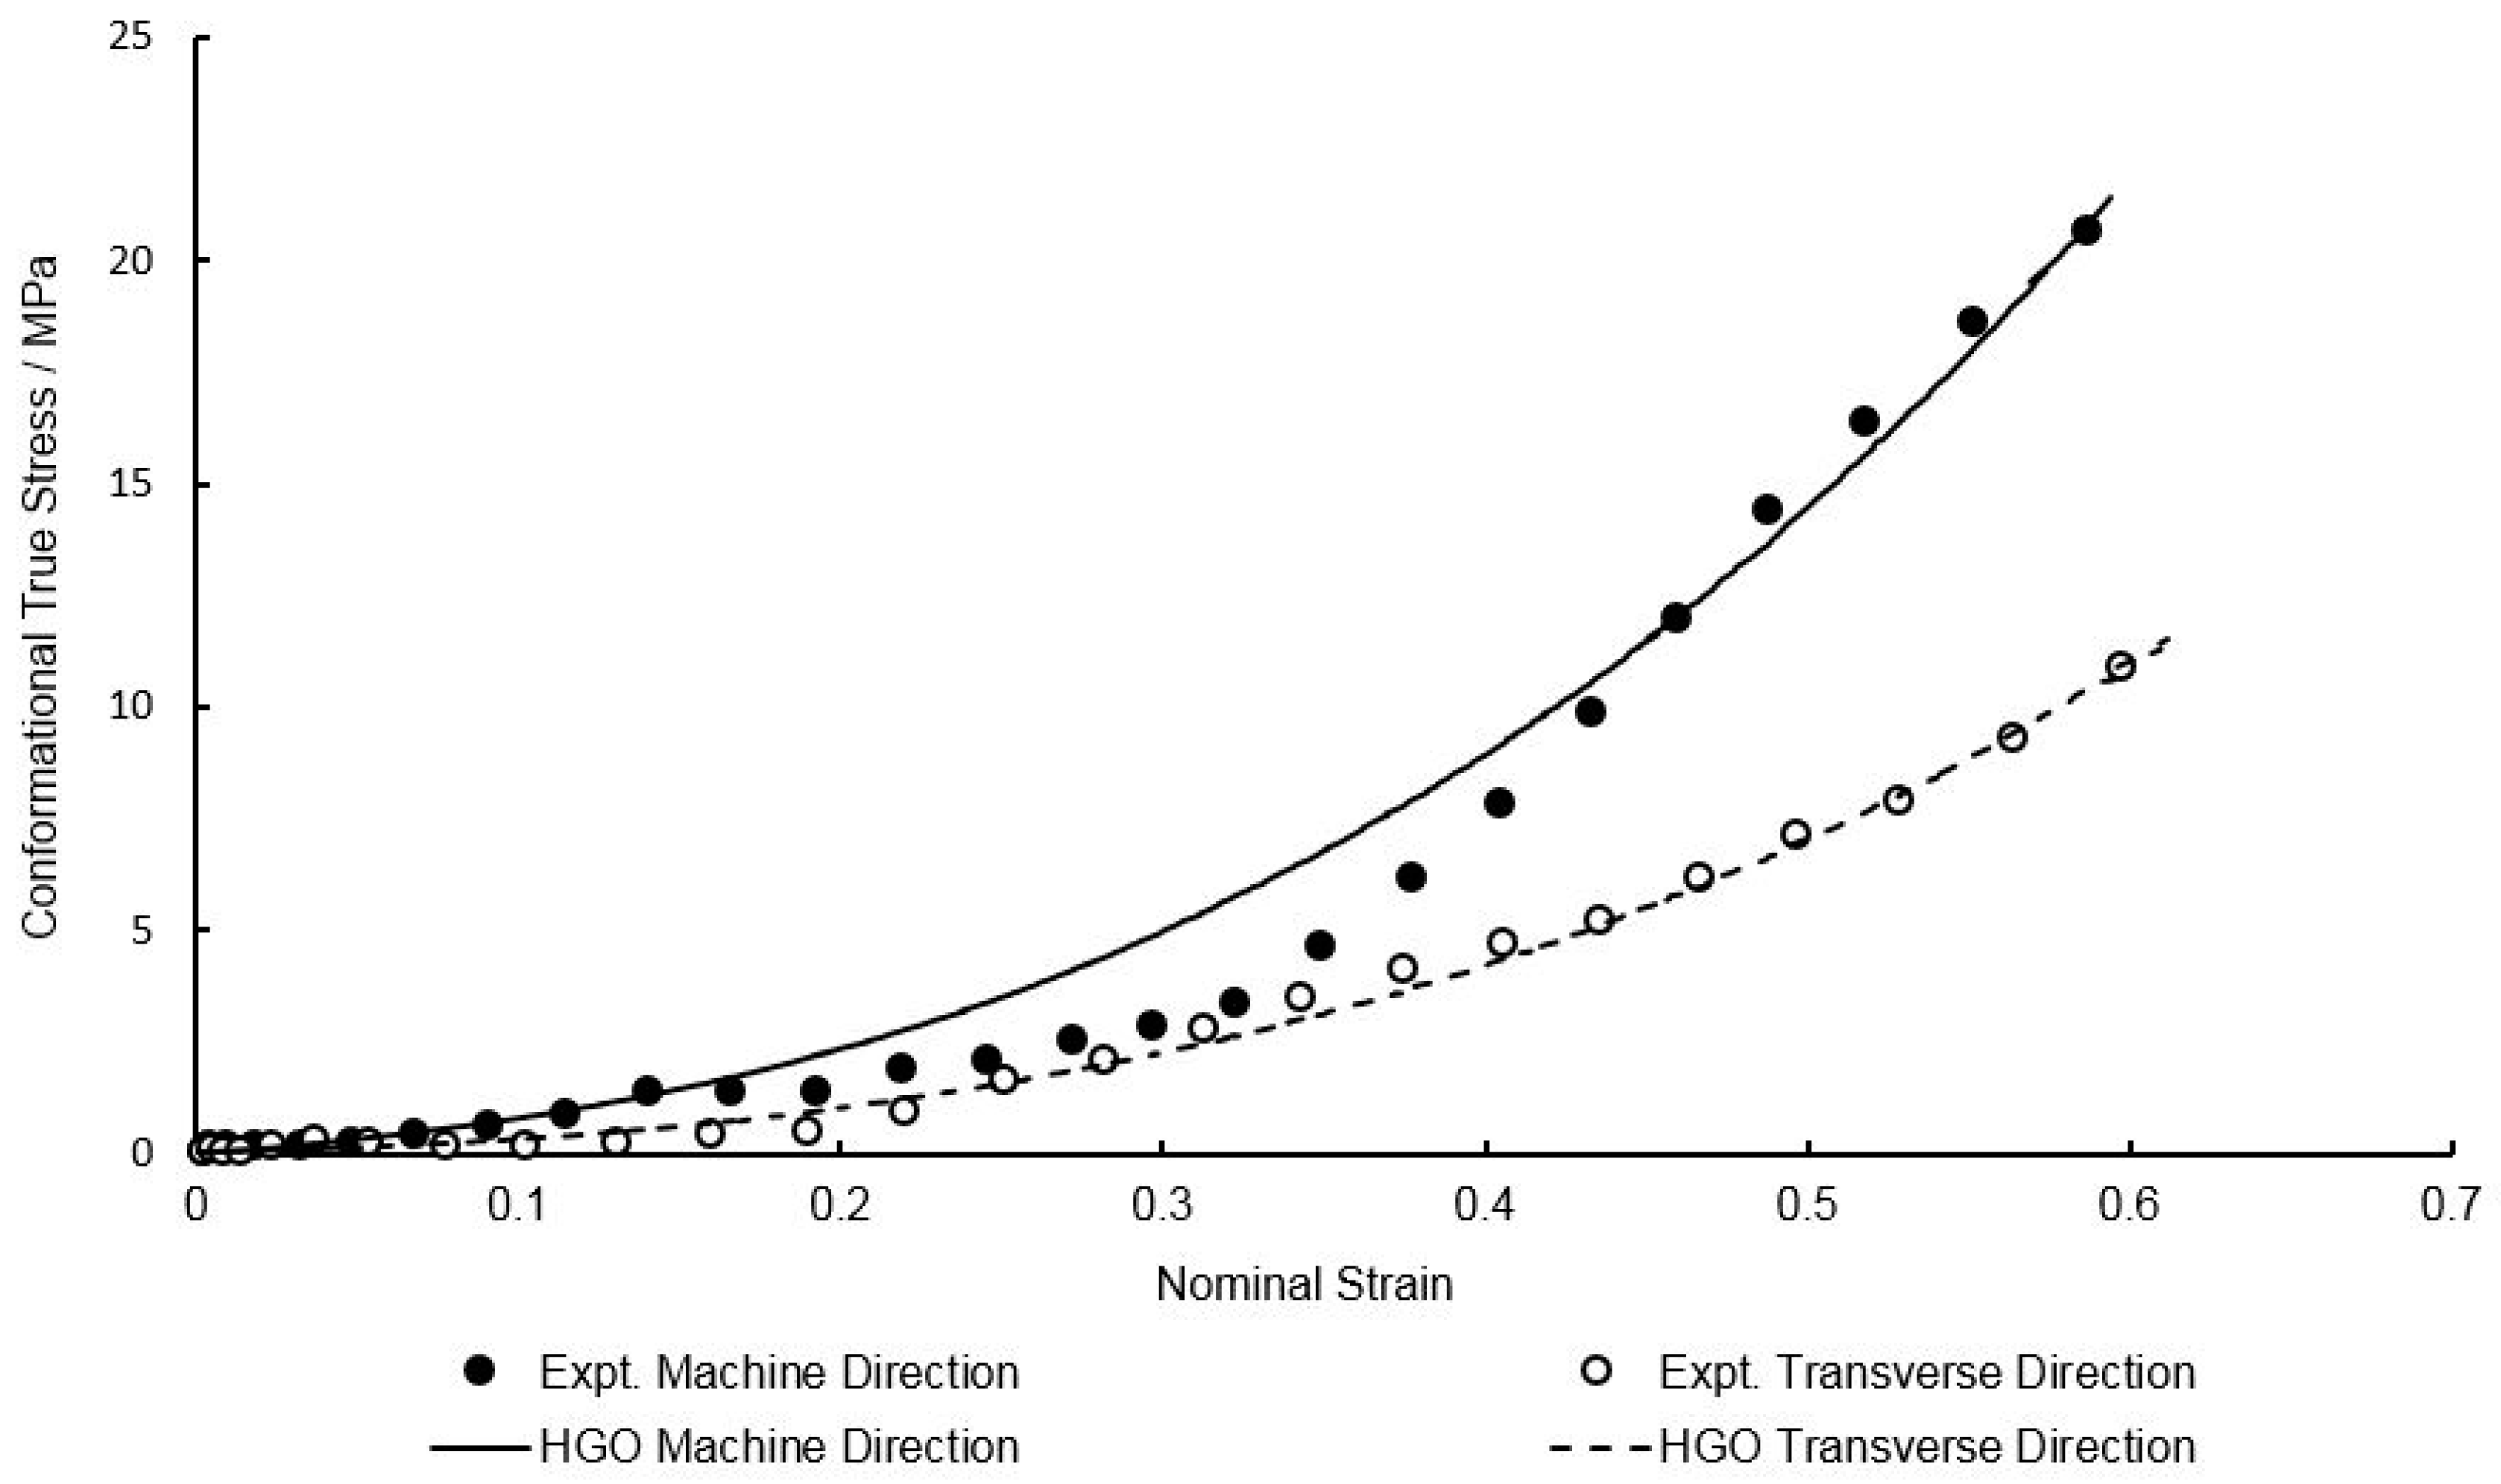
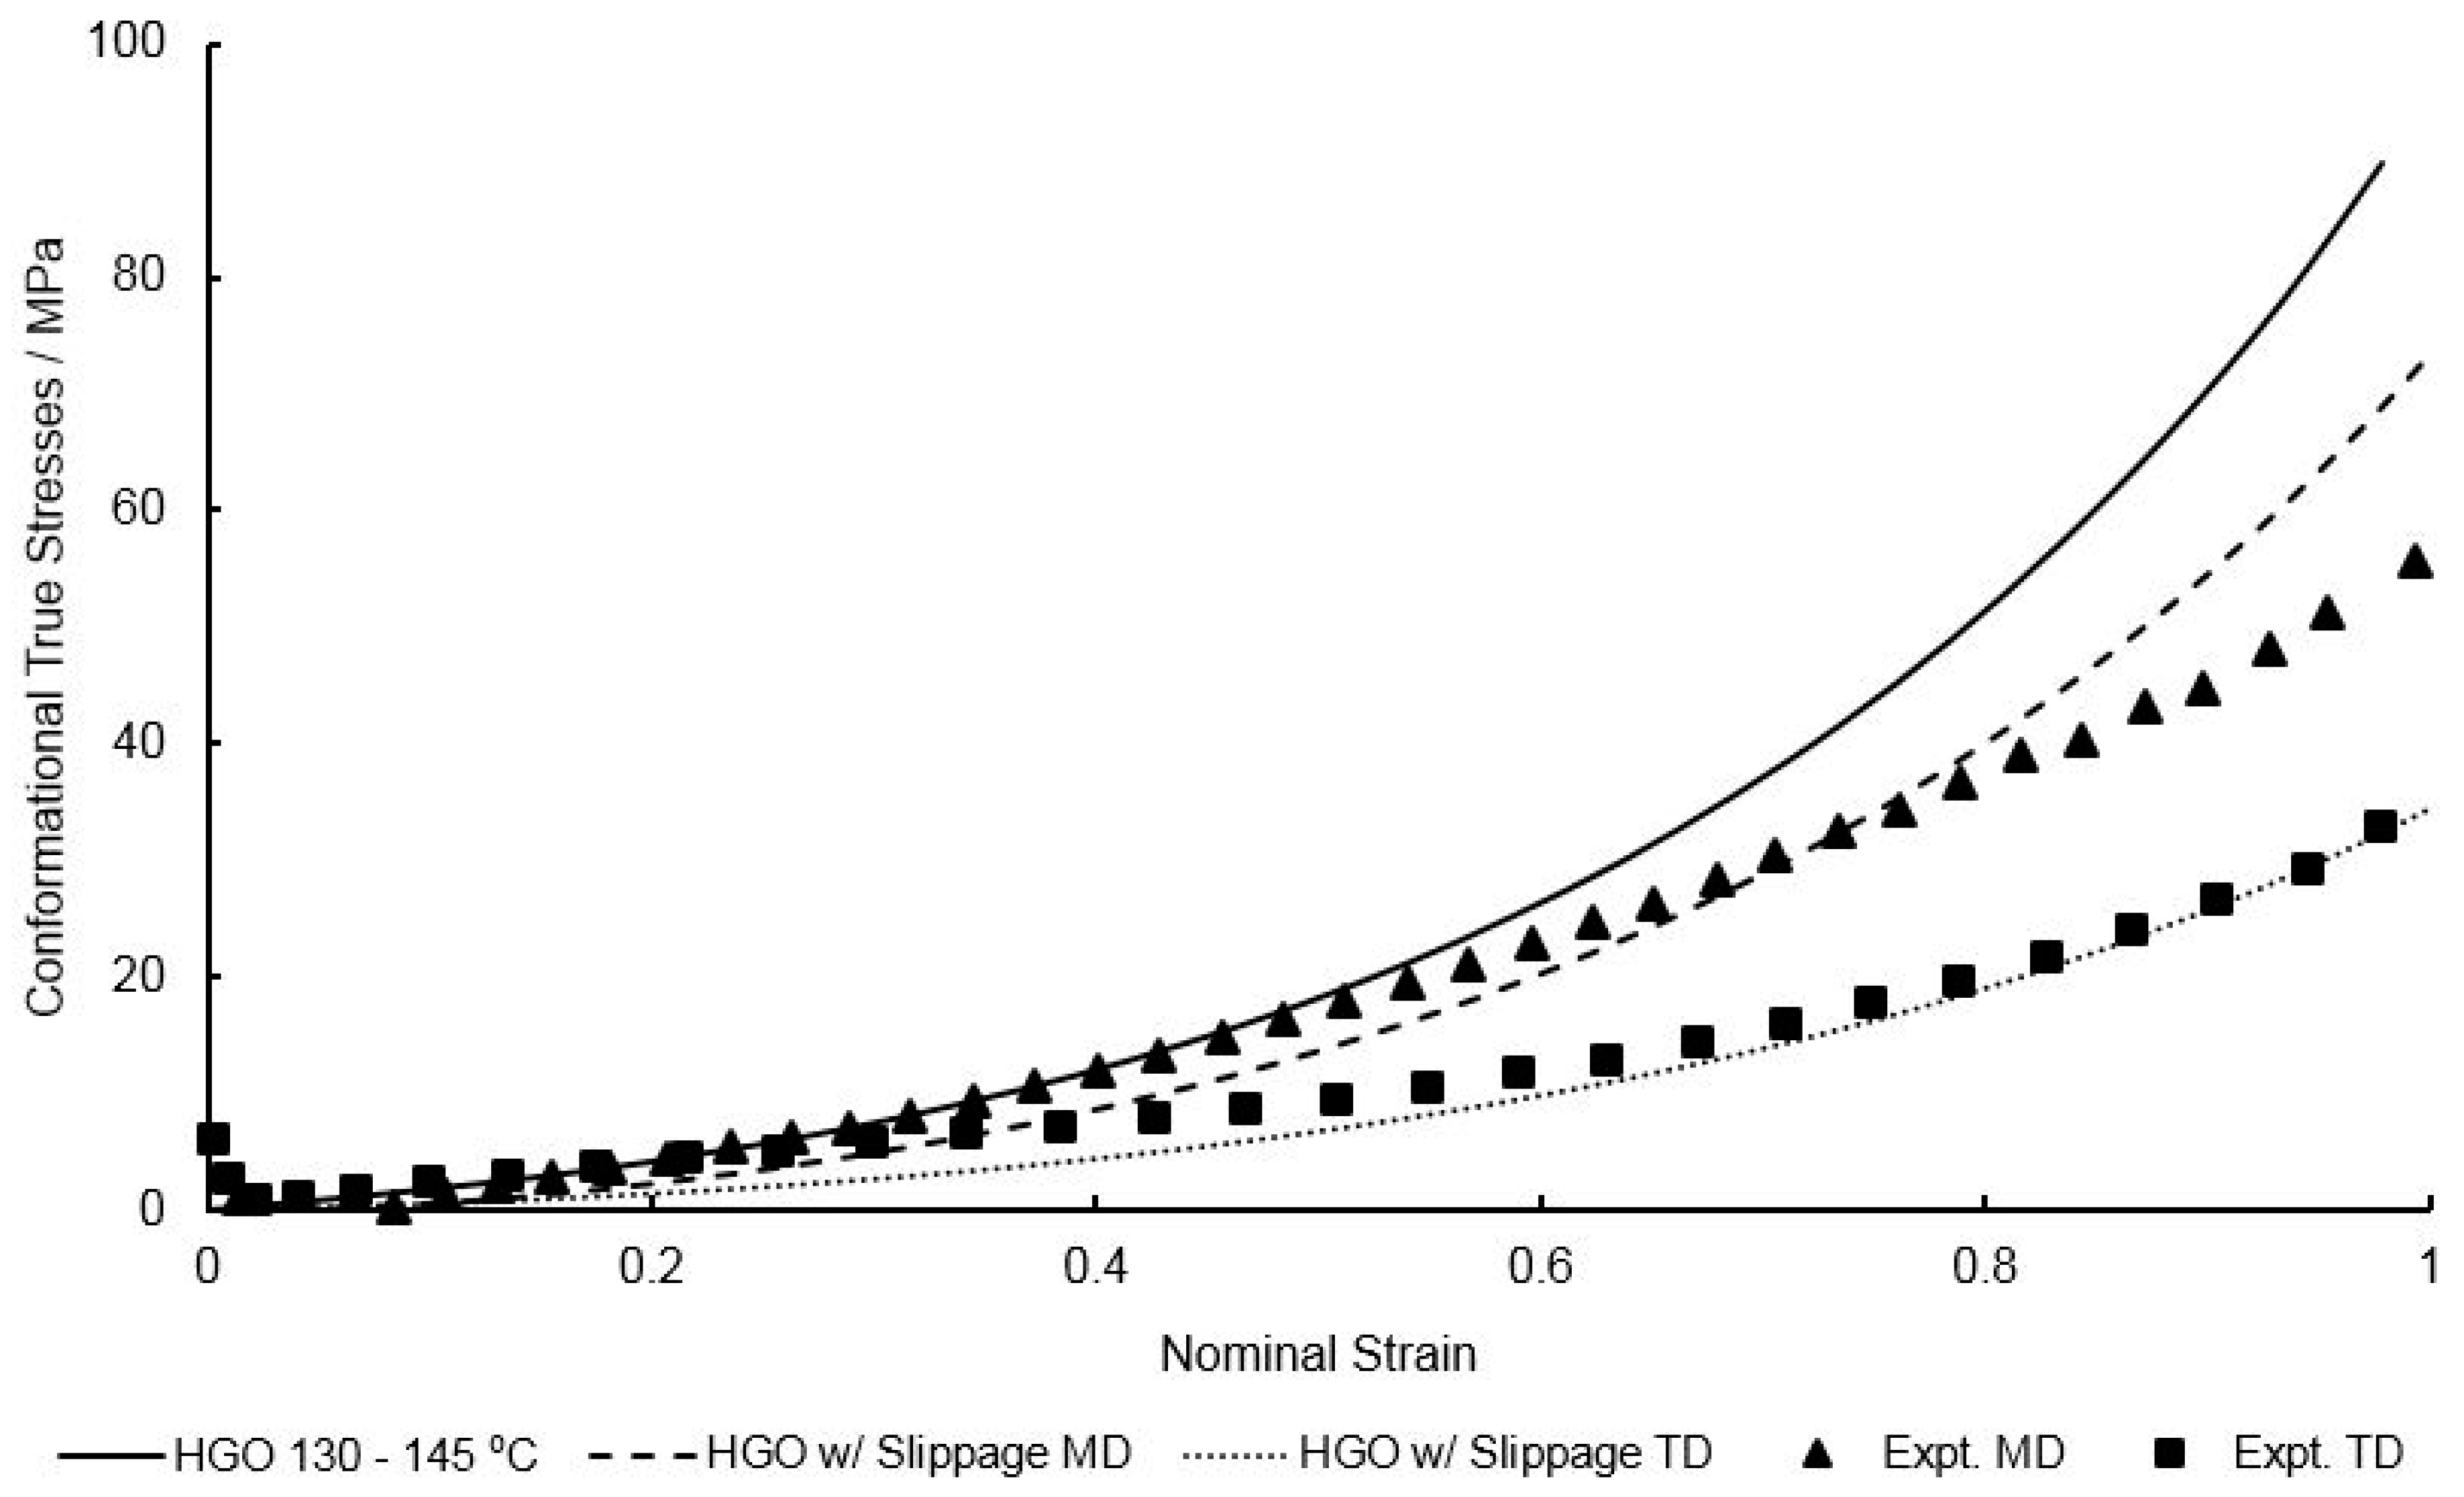
3.3. Calibration of HGO Model in the Conformational Part
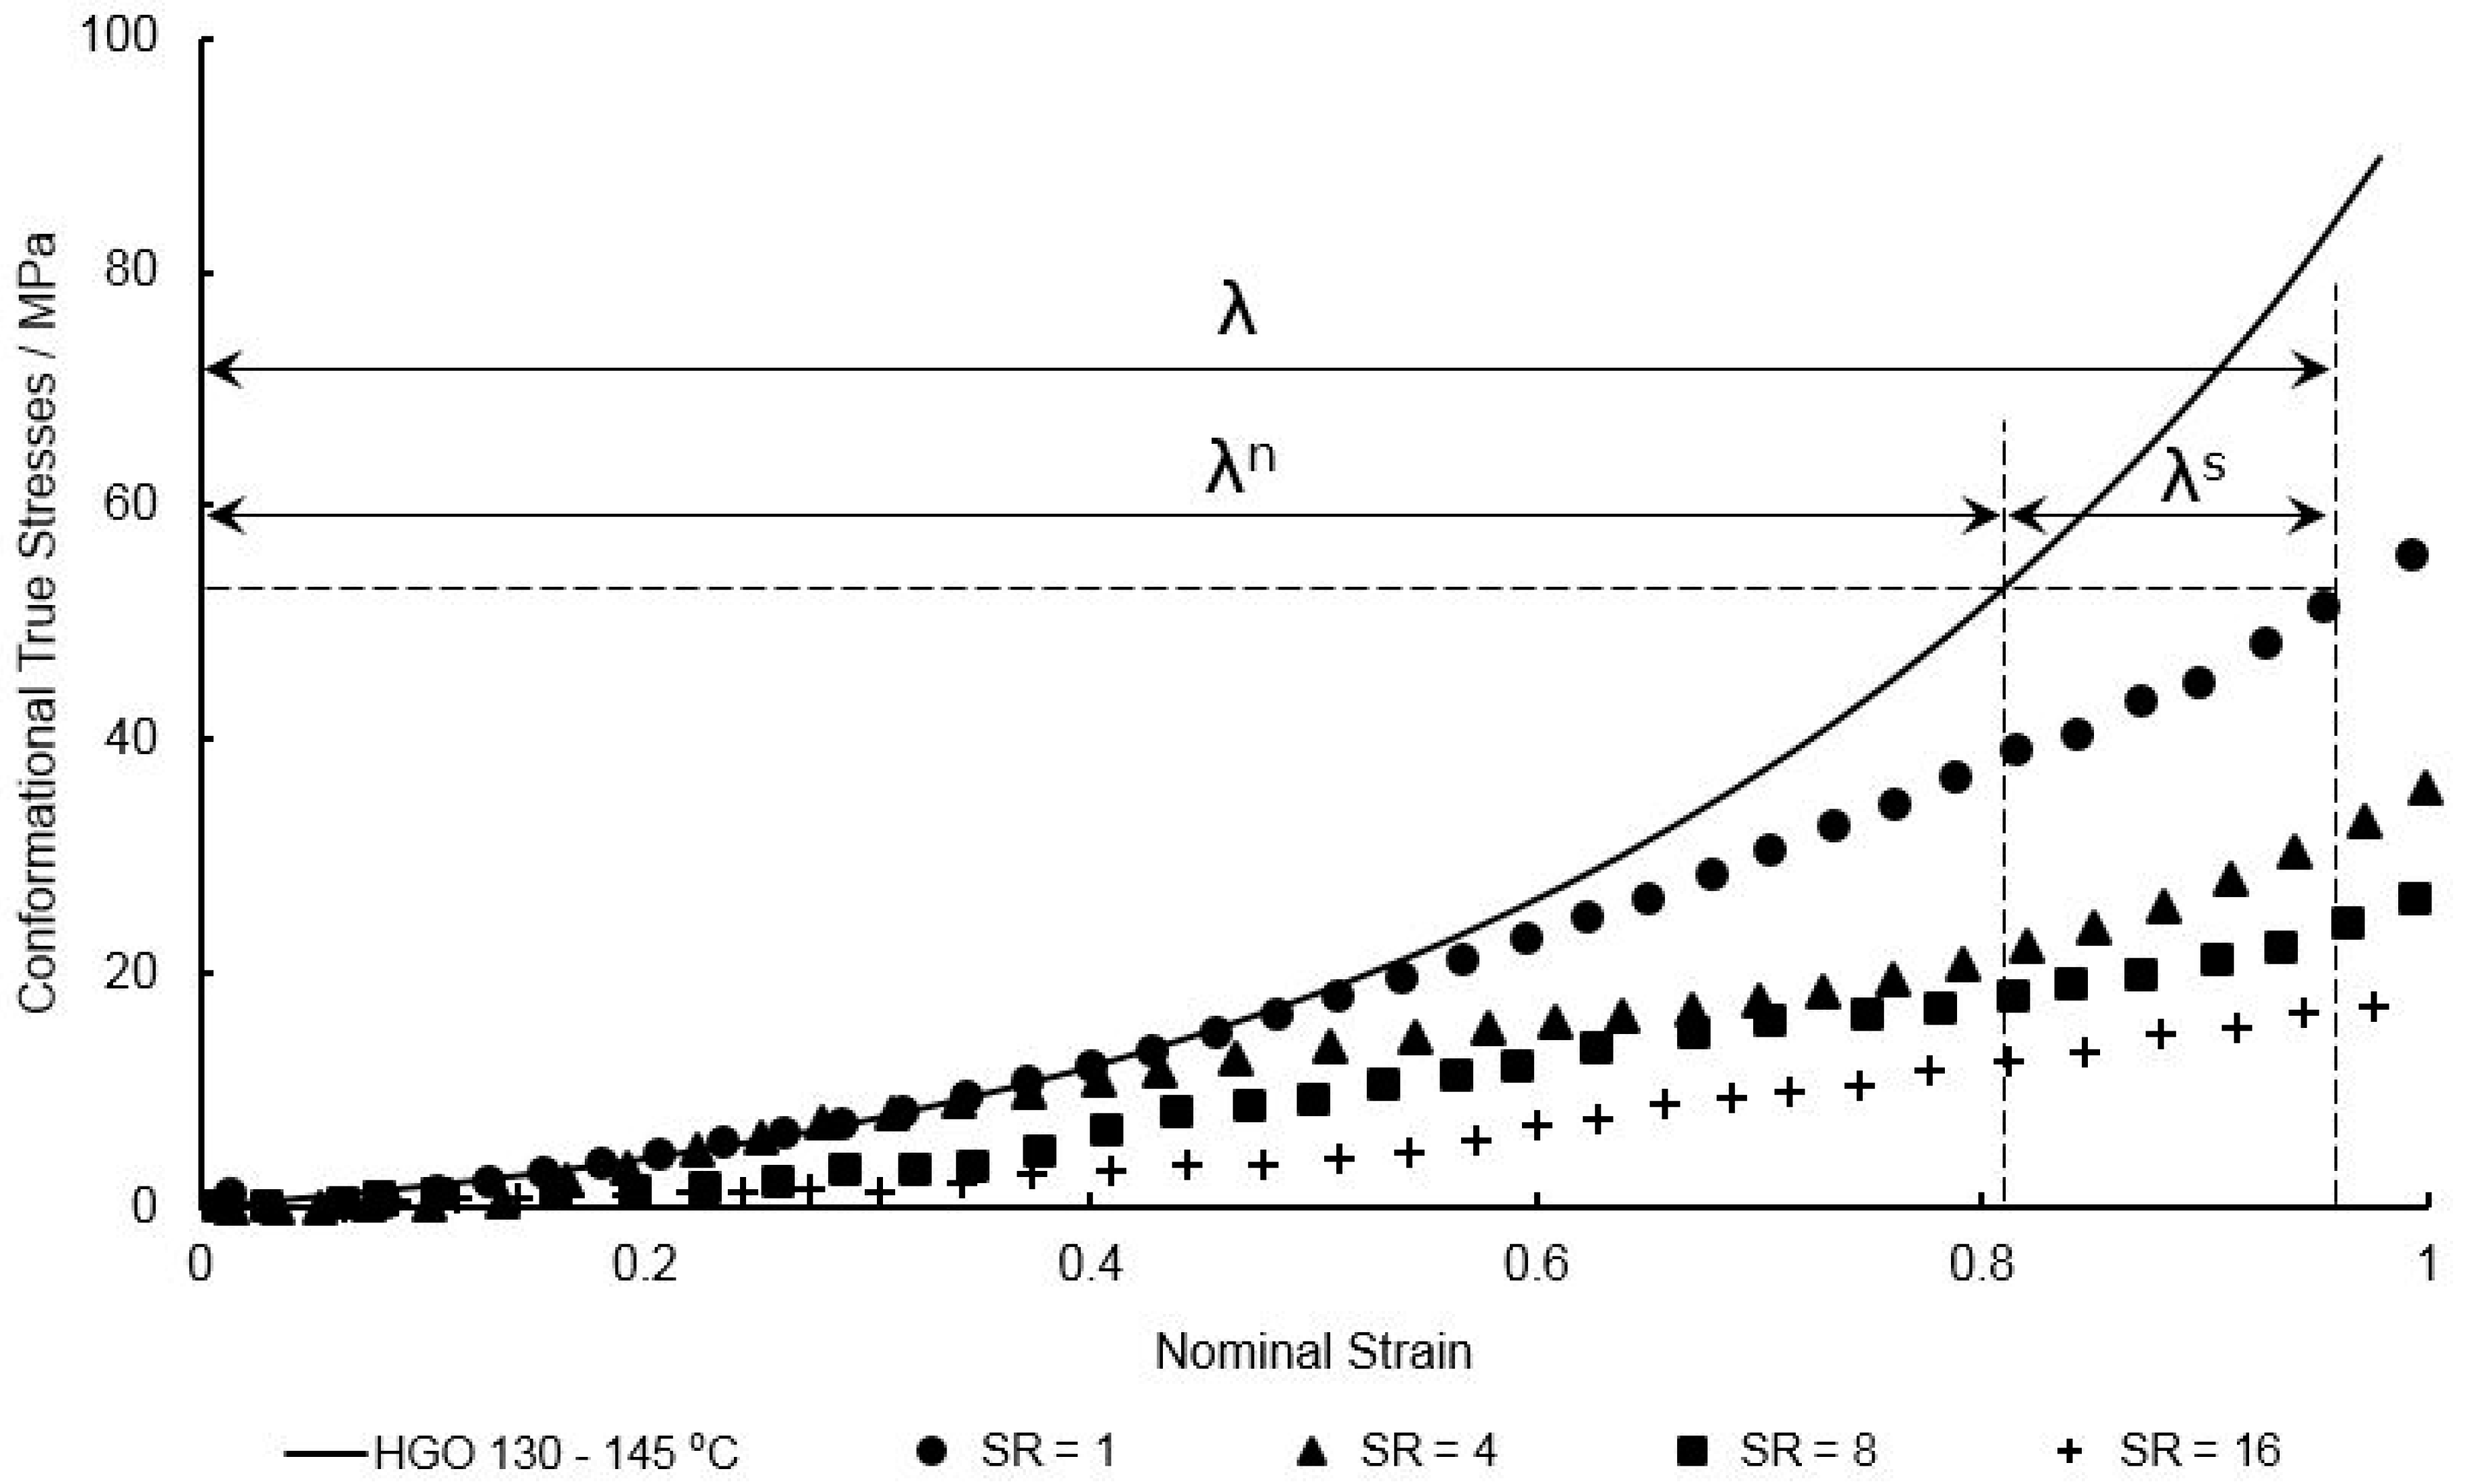
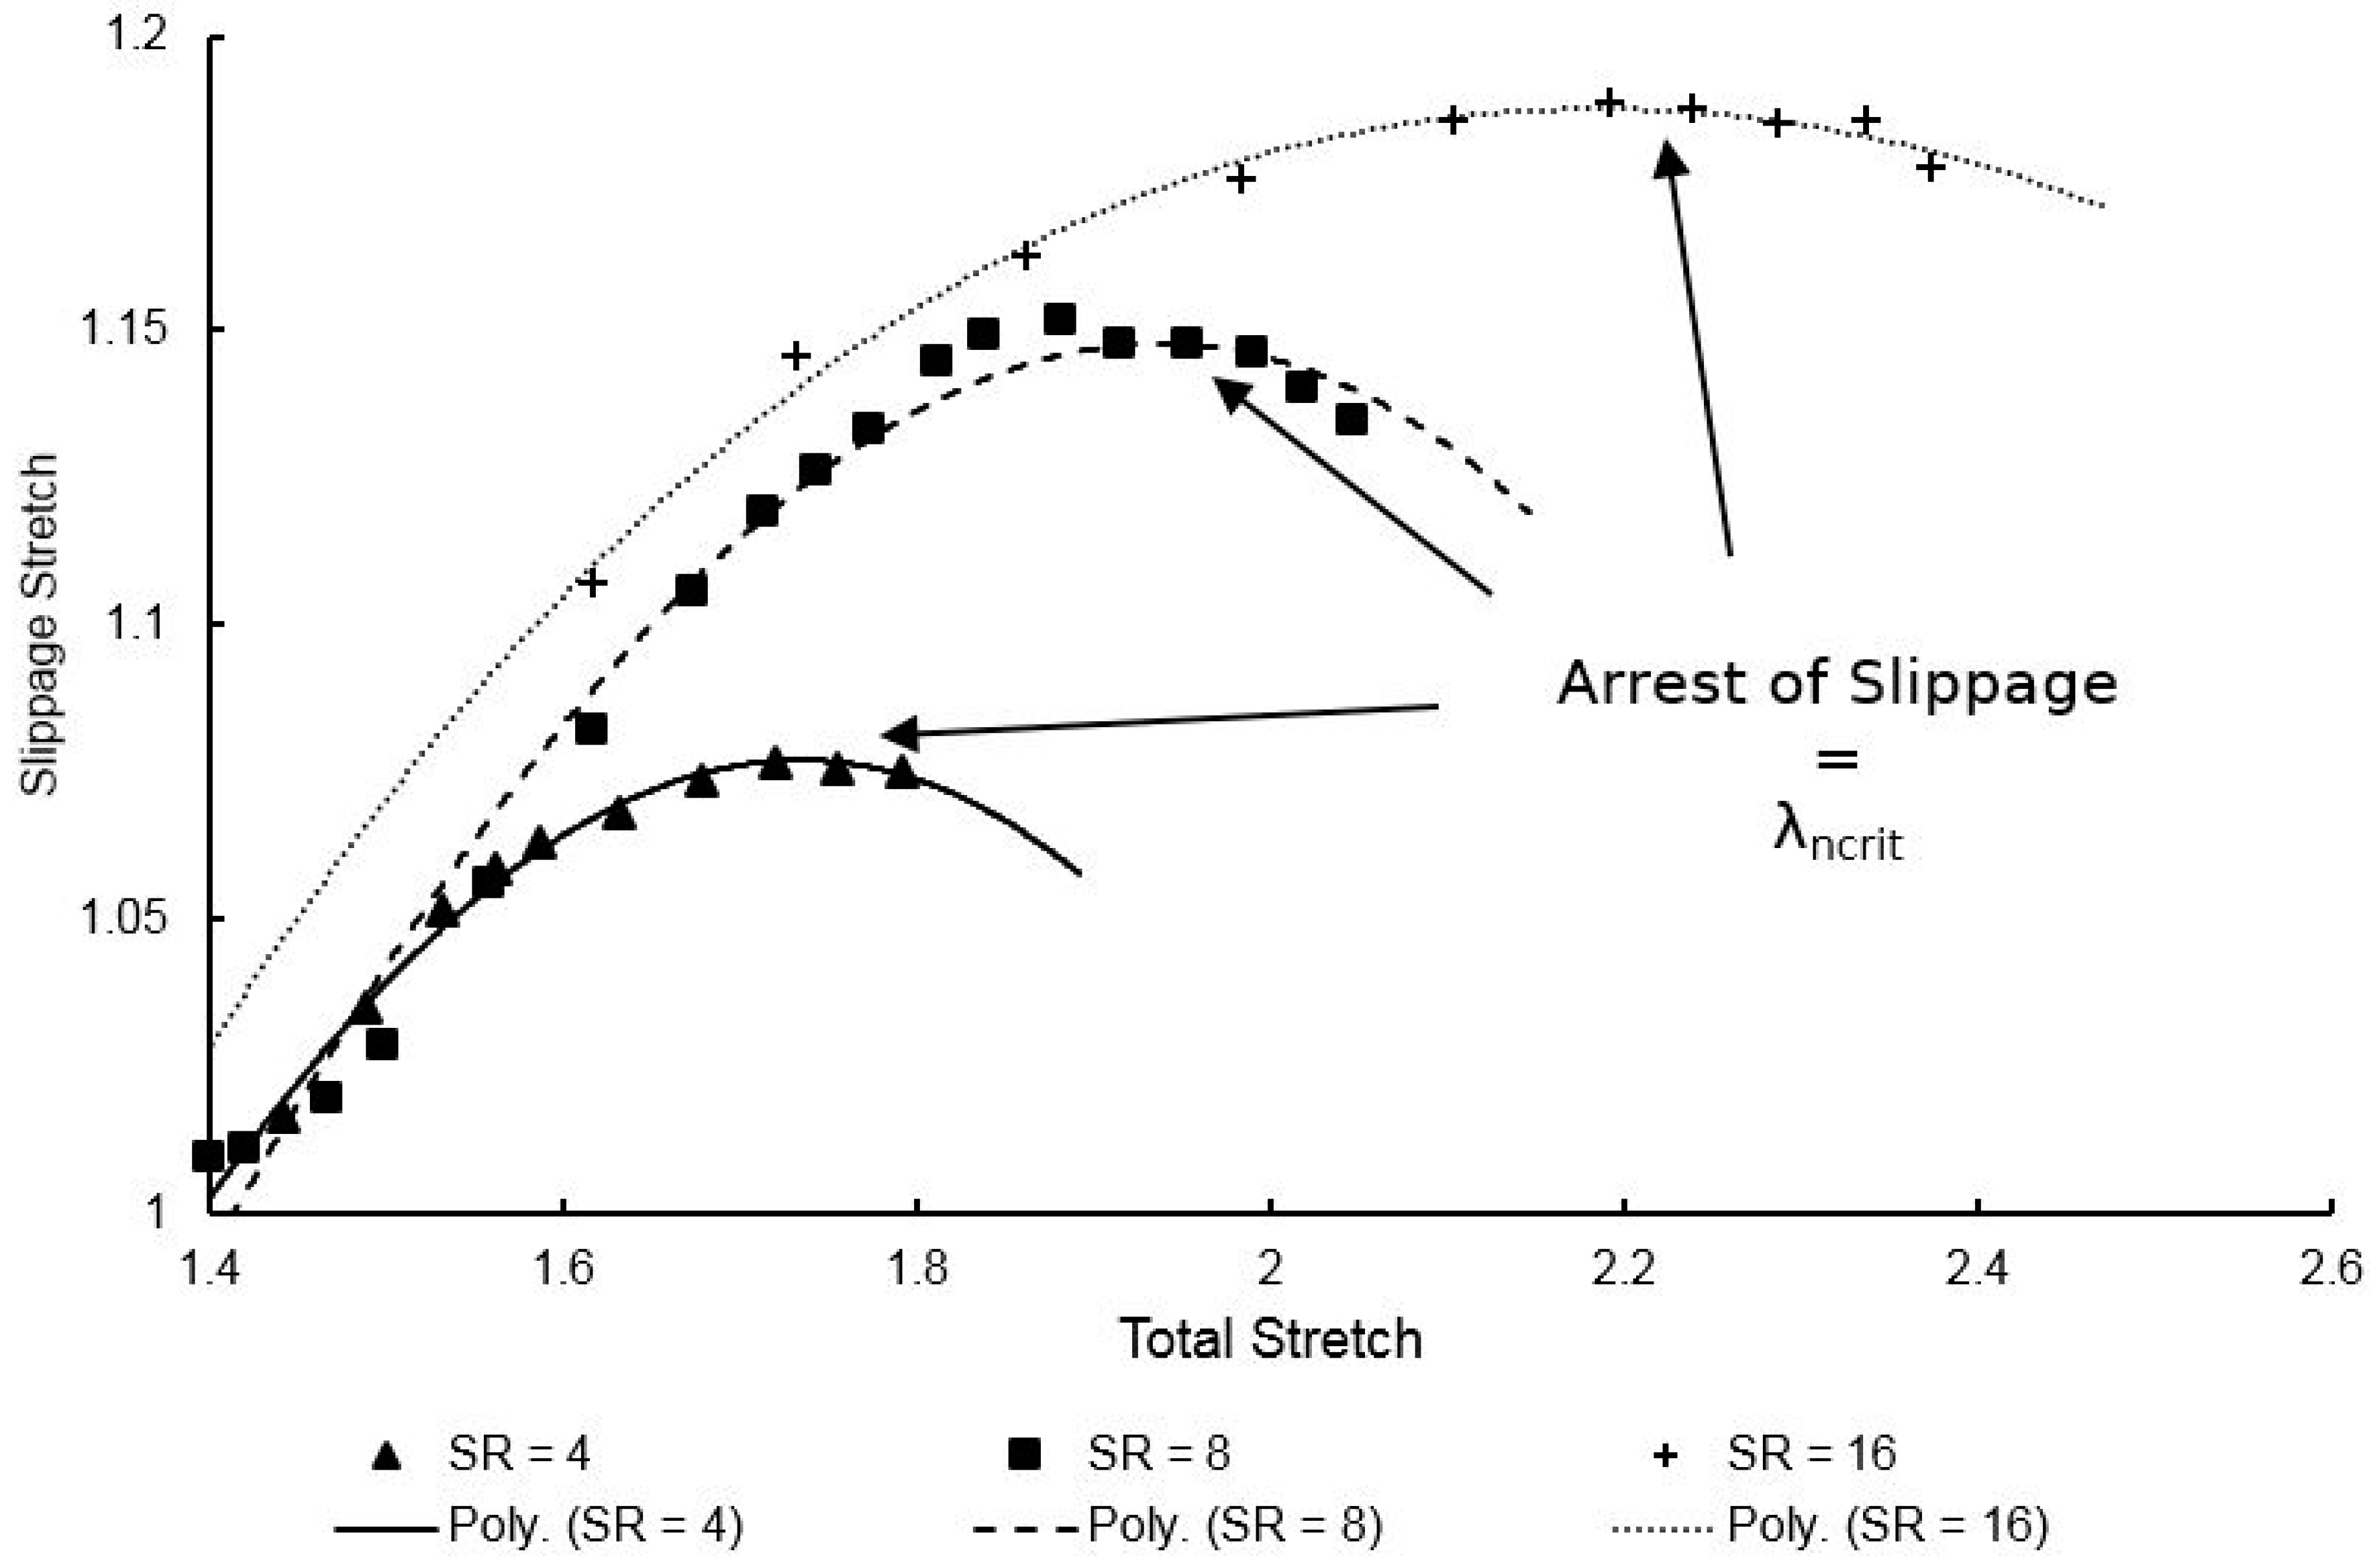
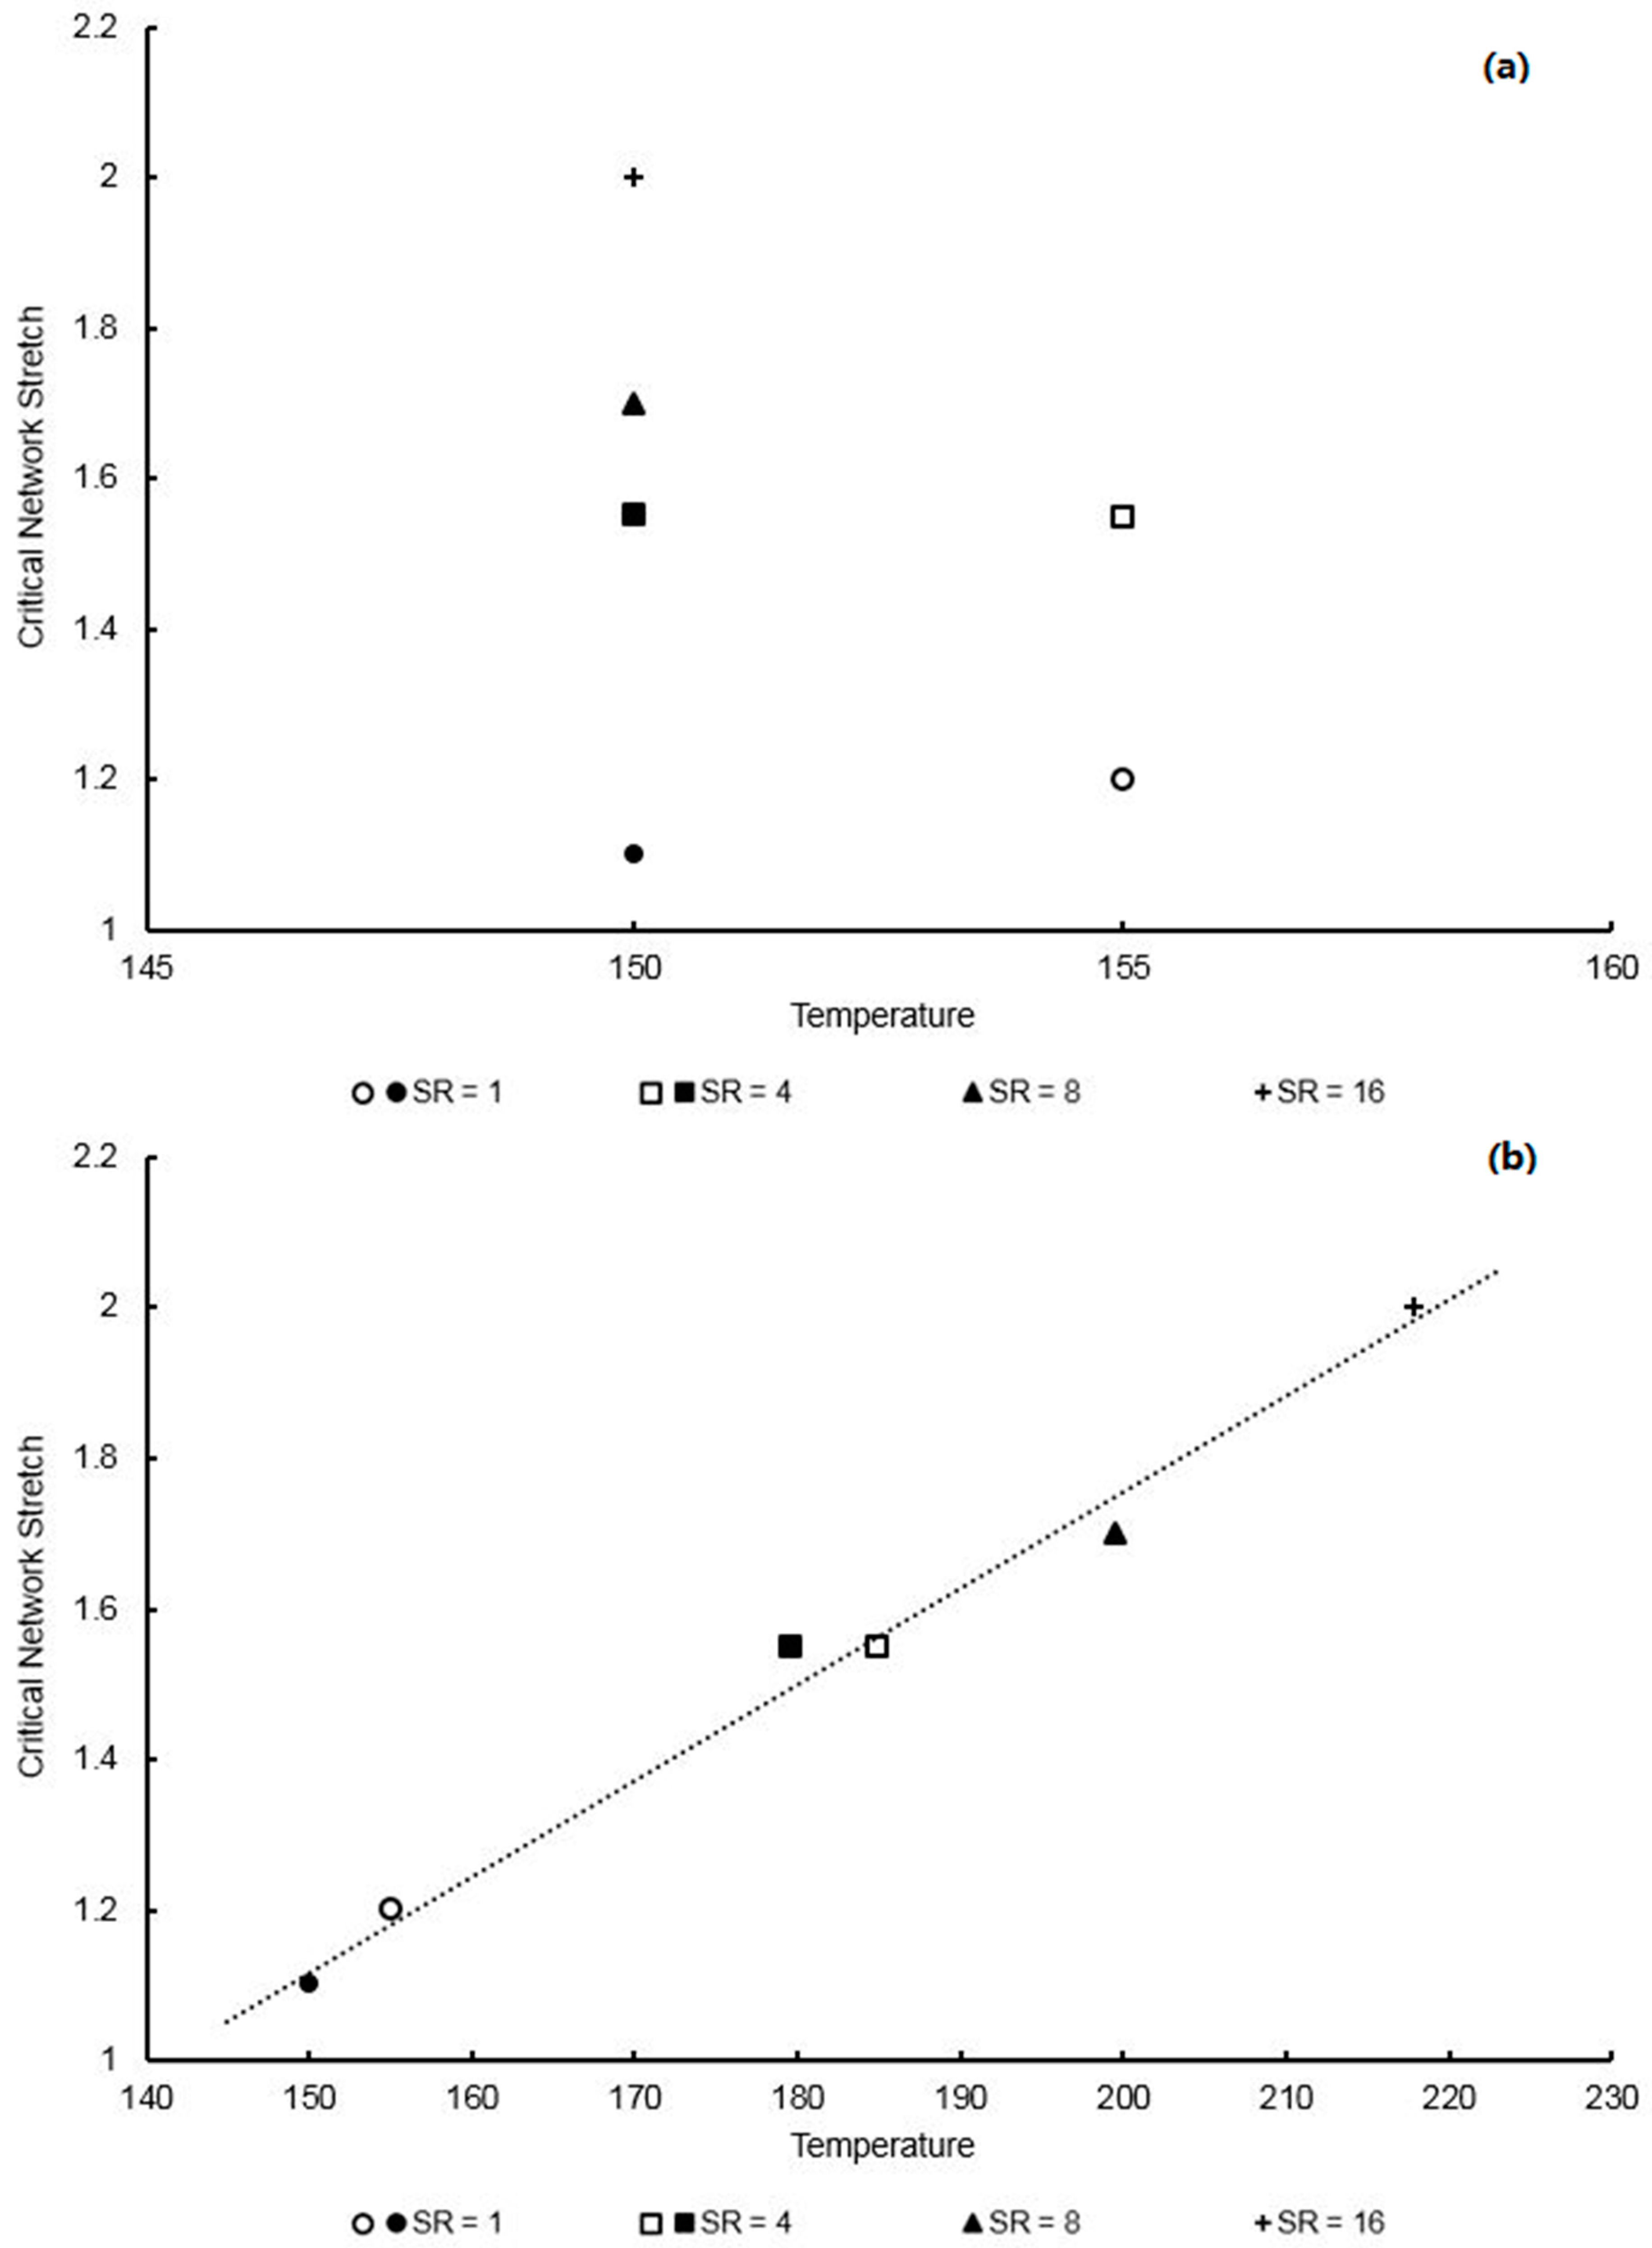
3.4. Modelling Entanglement Slippage in the Conformational Part
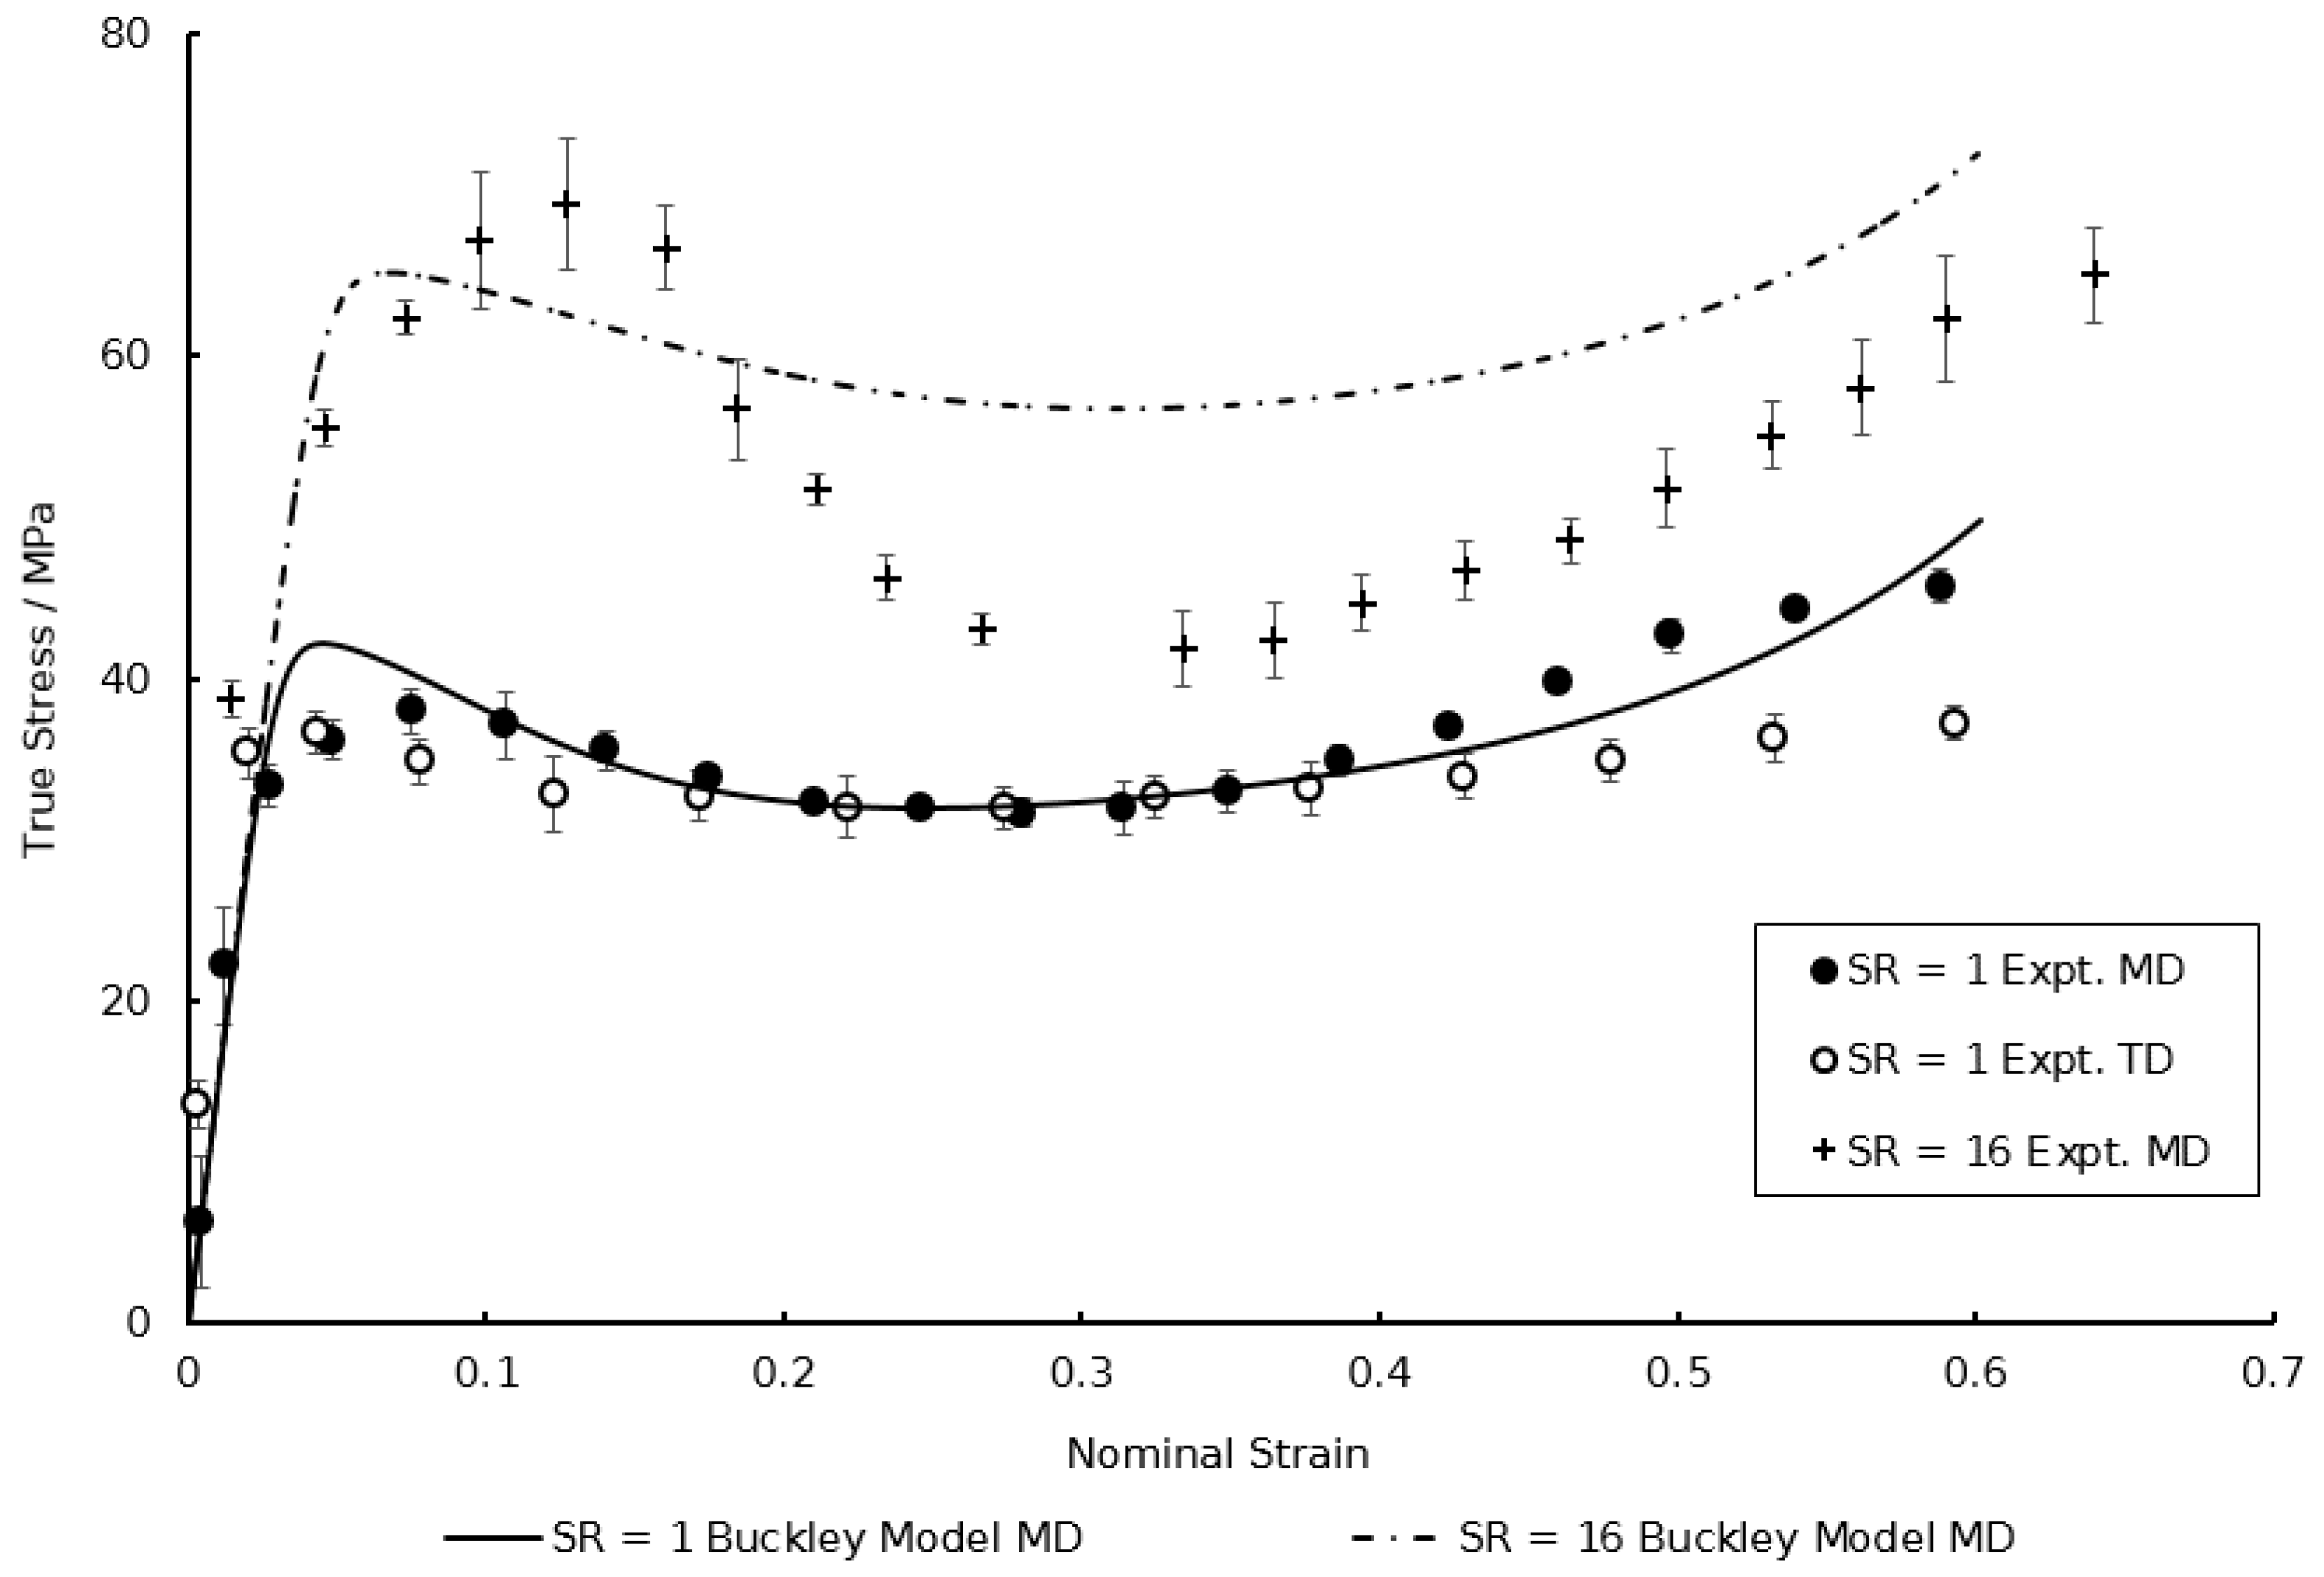
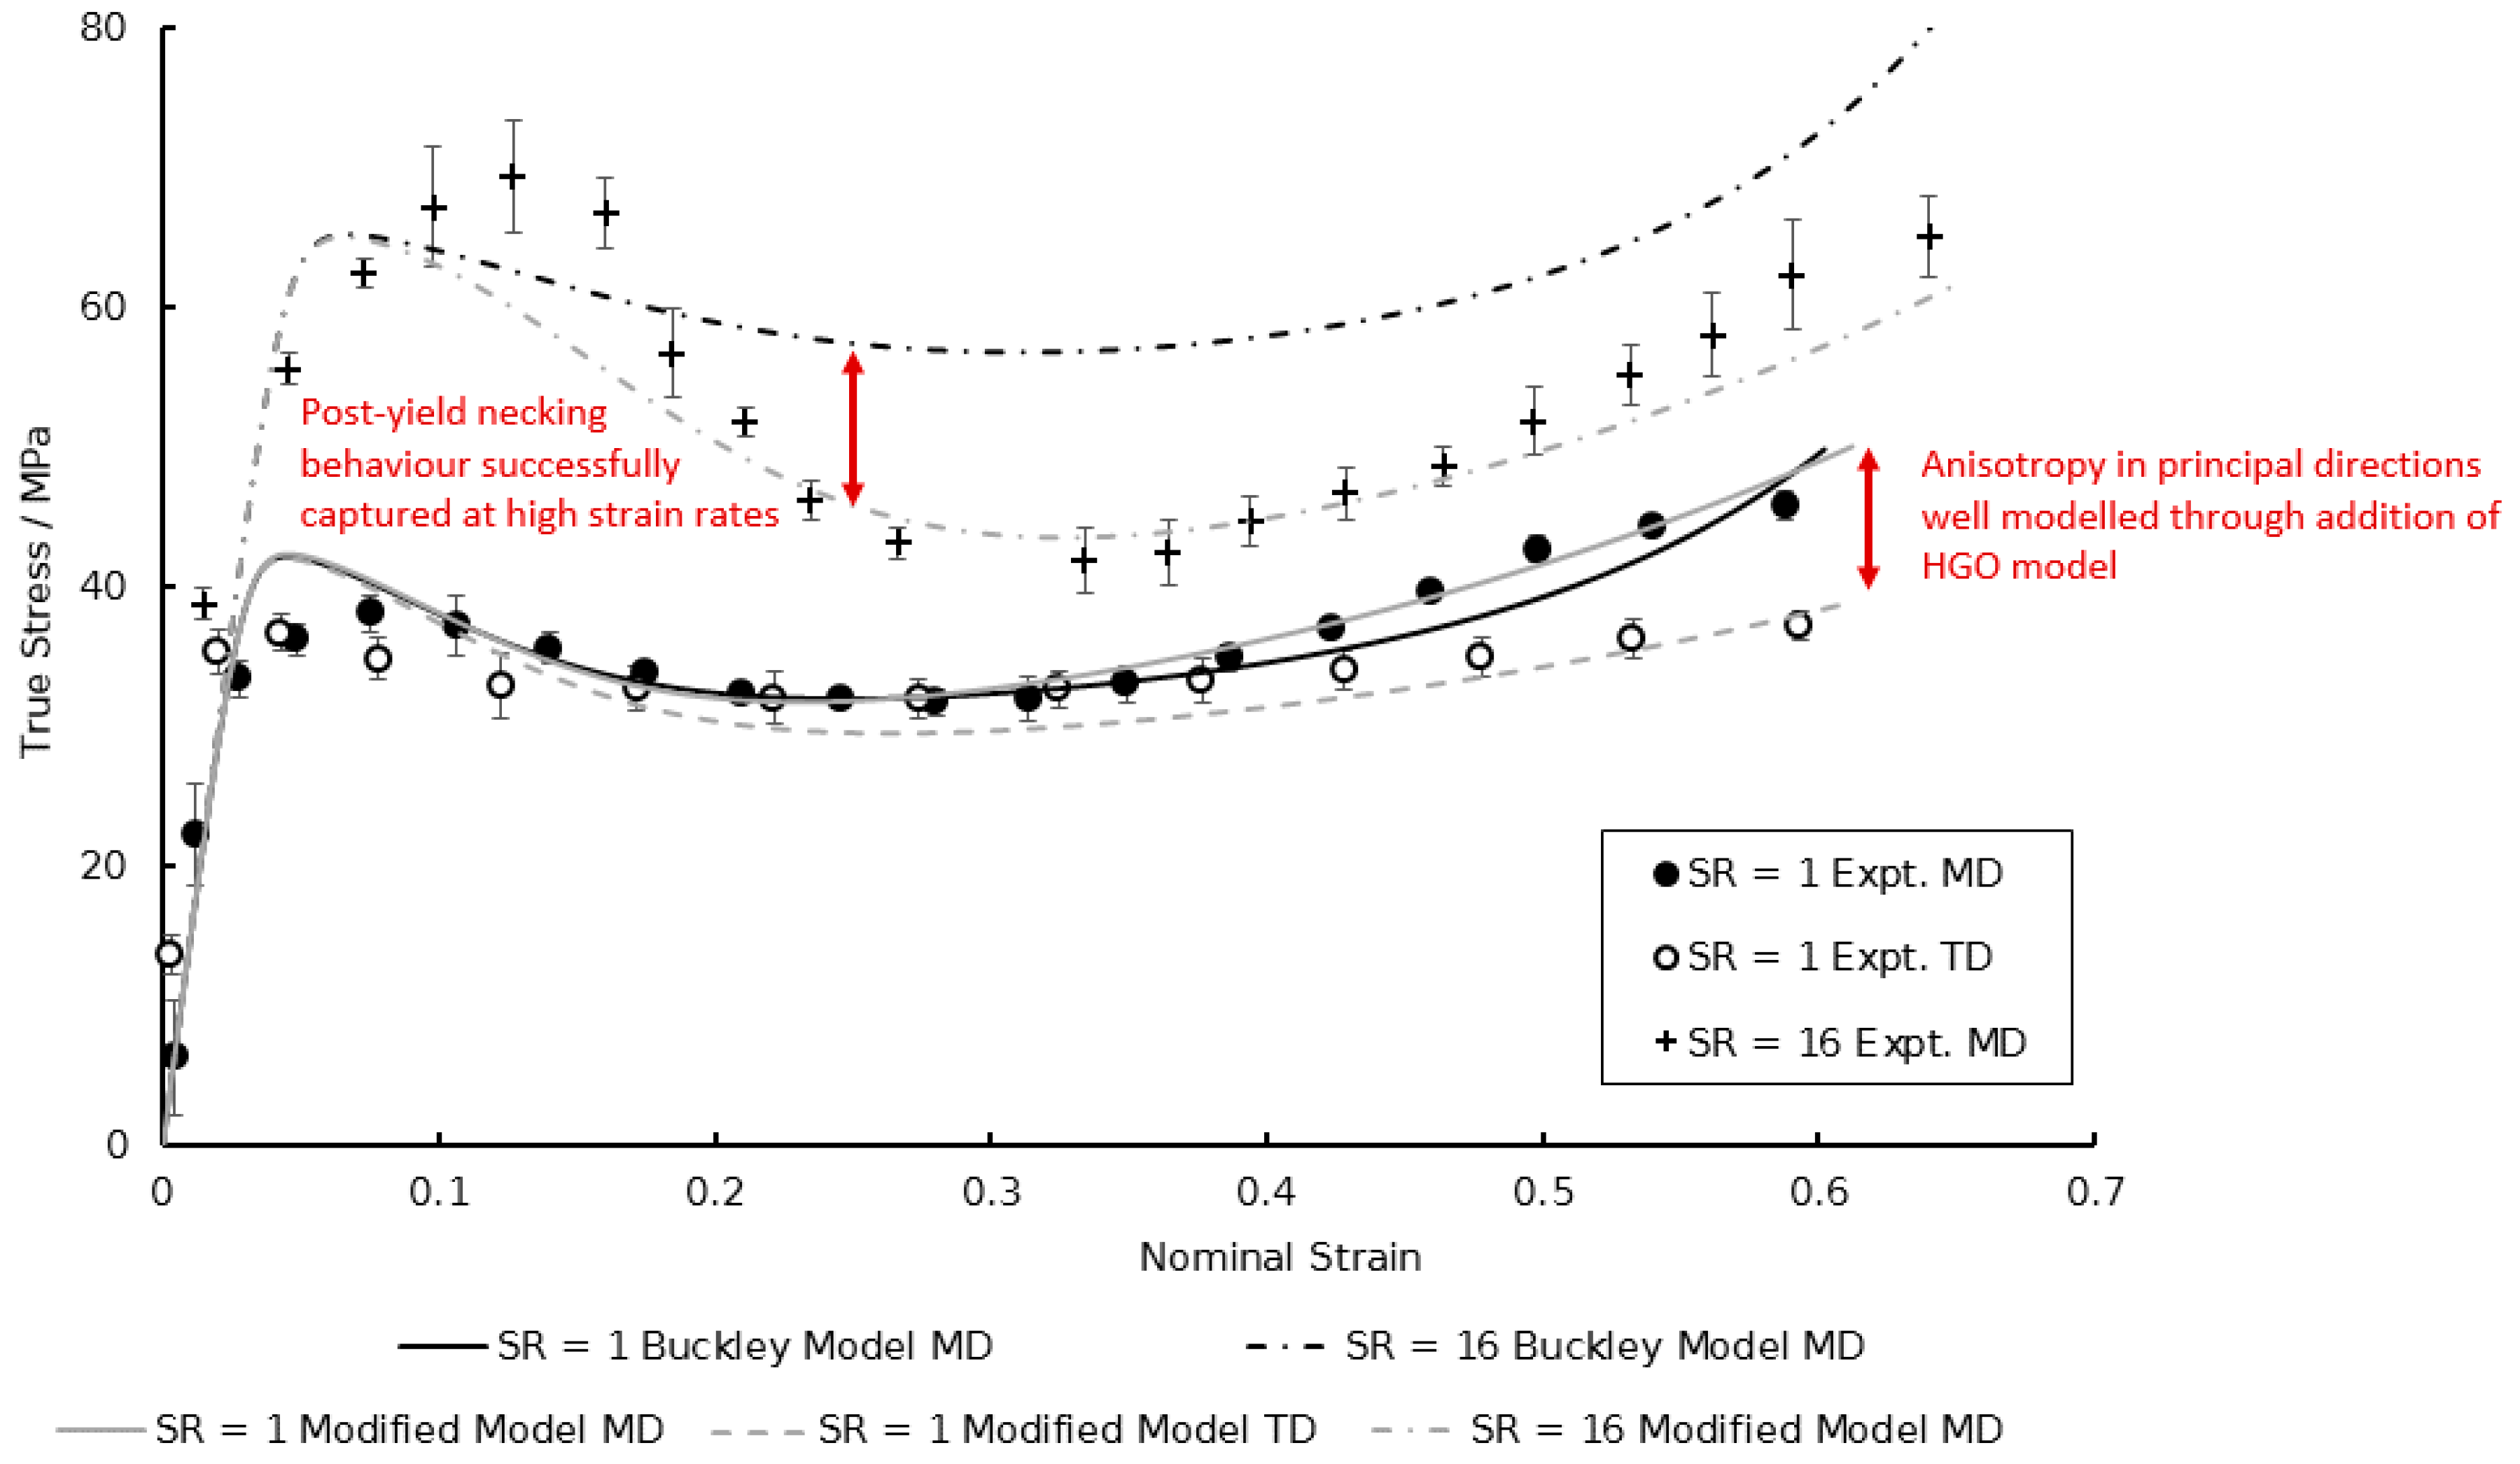
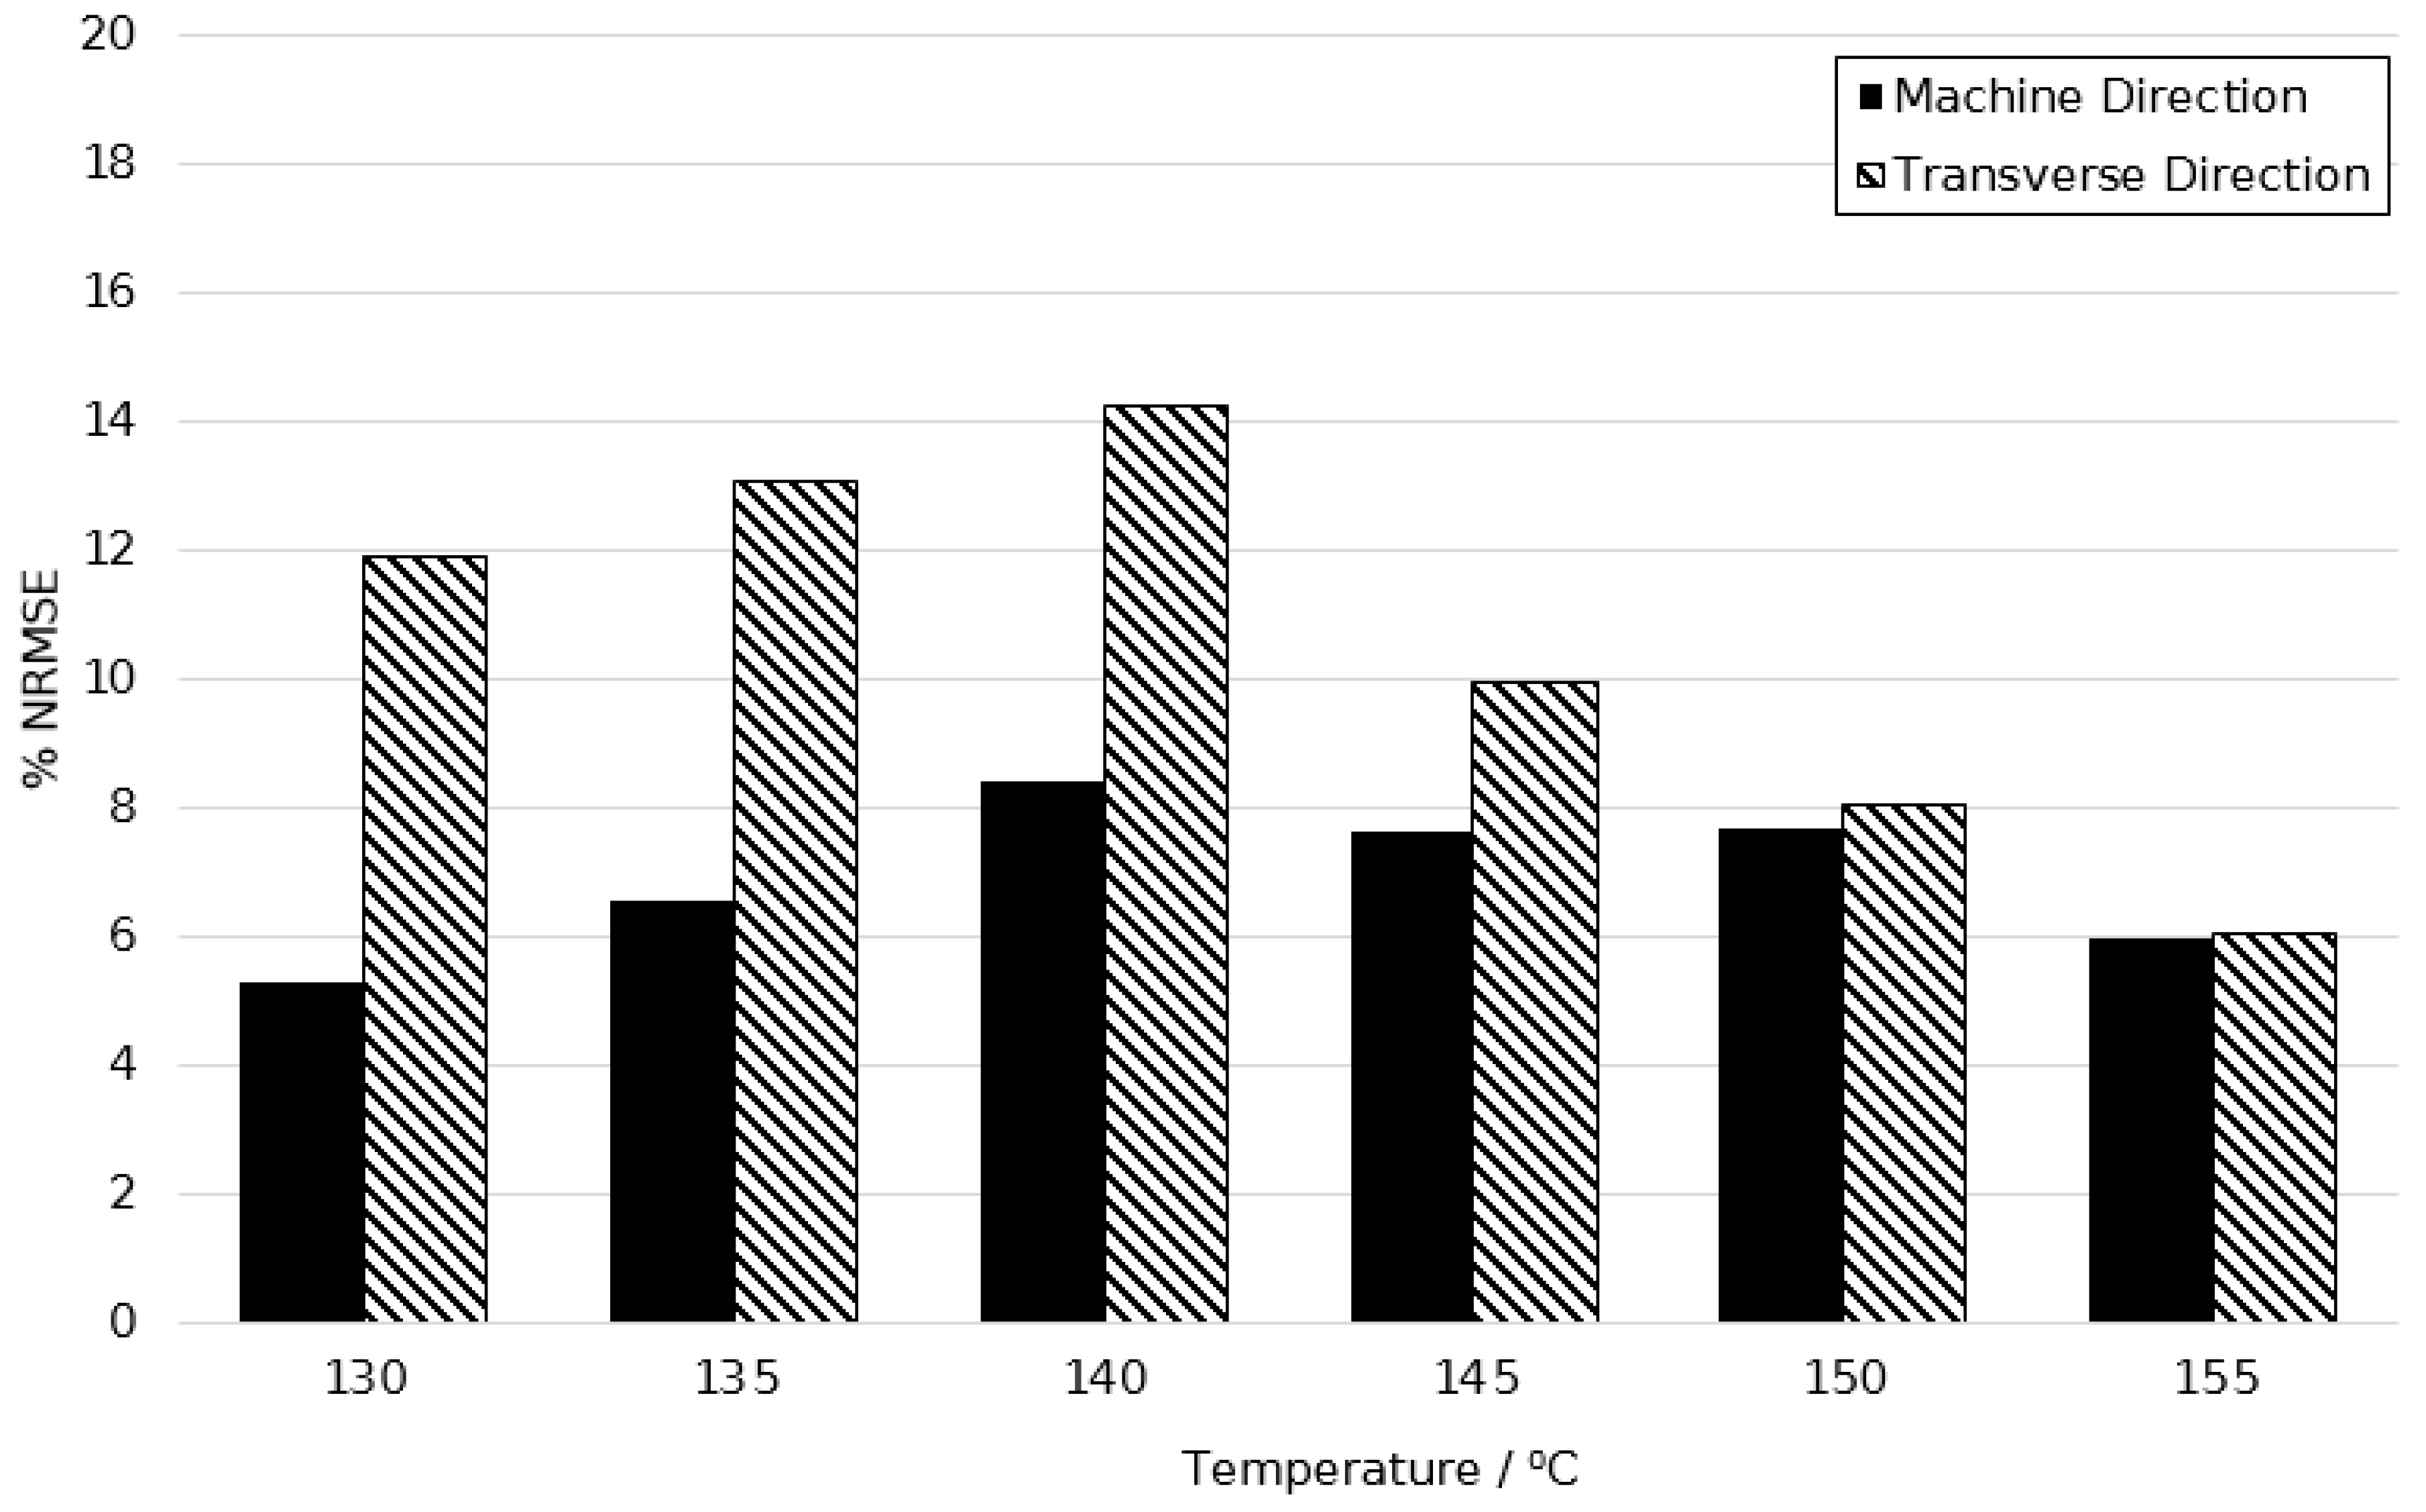
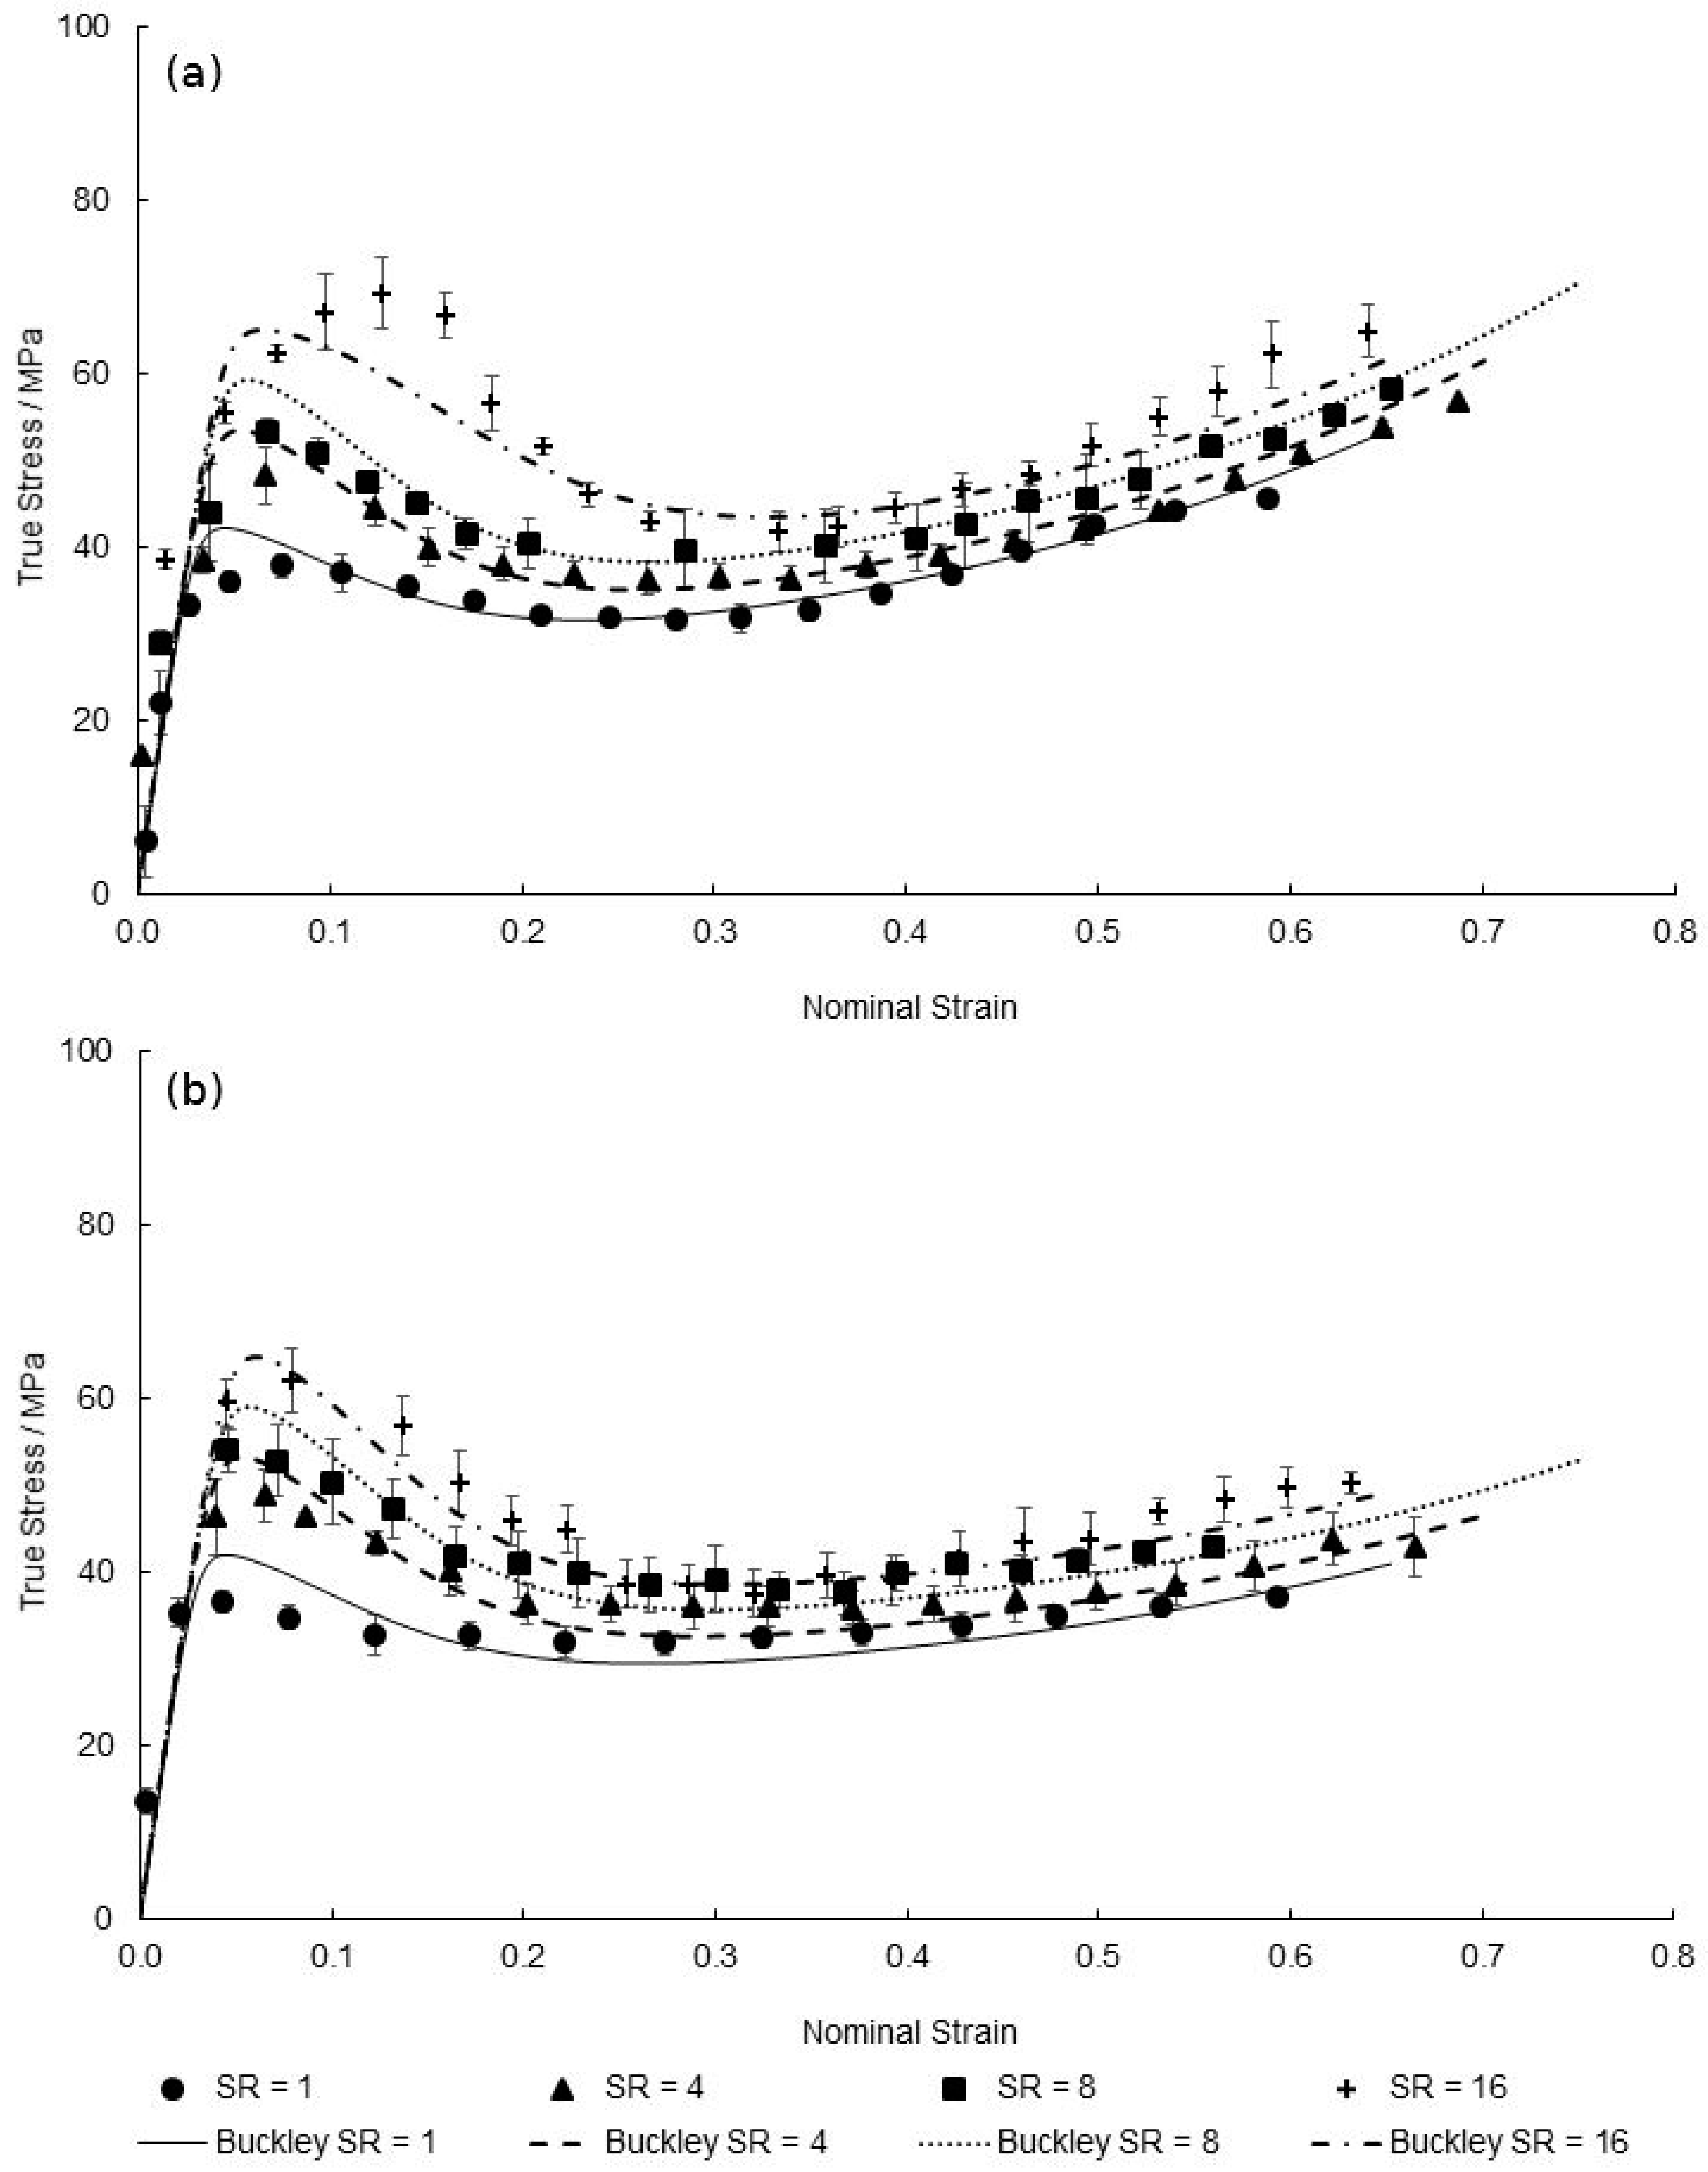
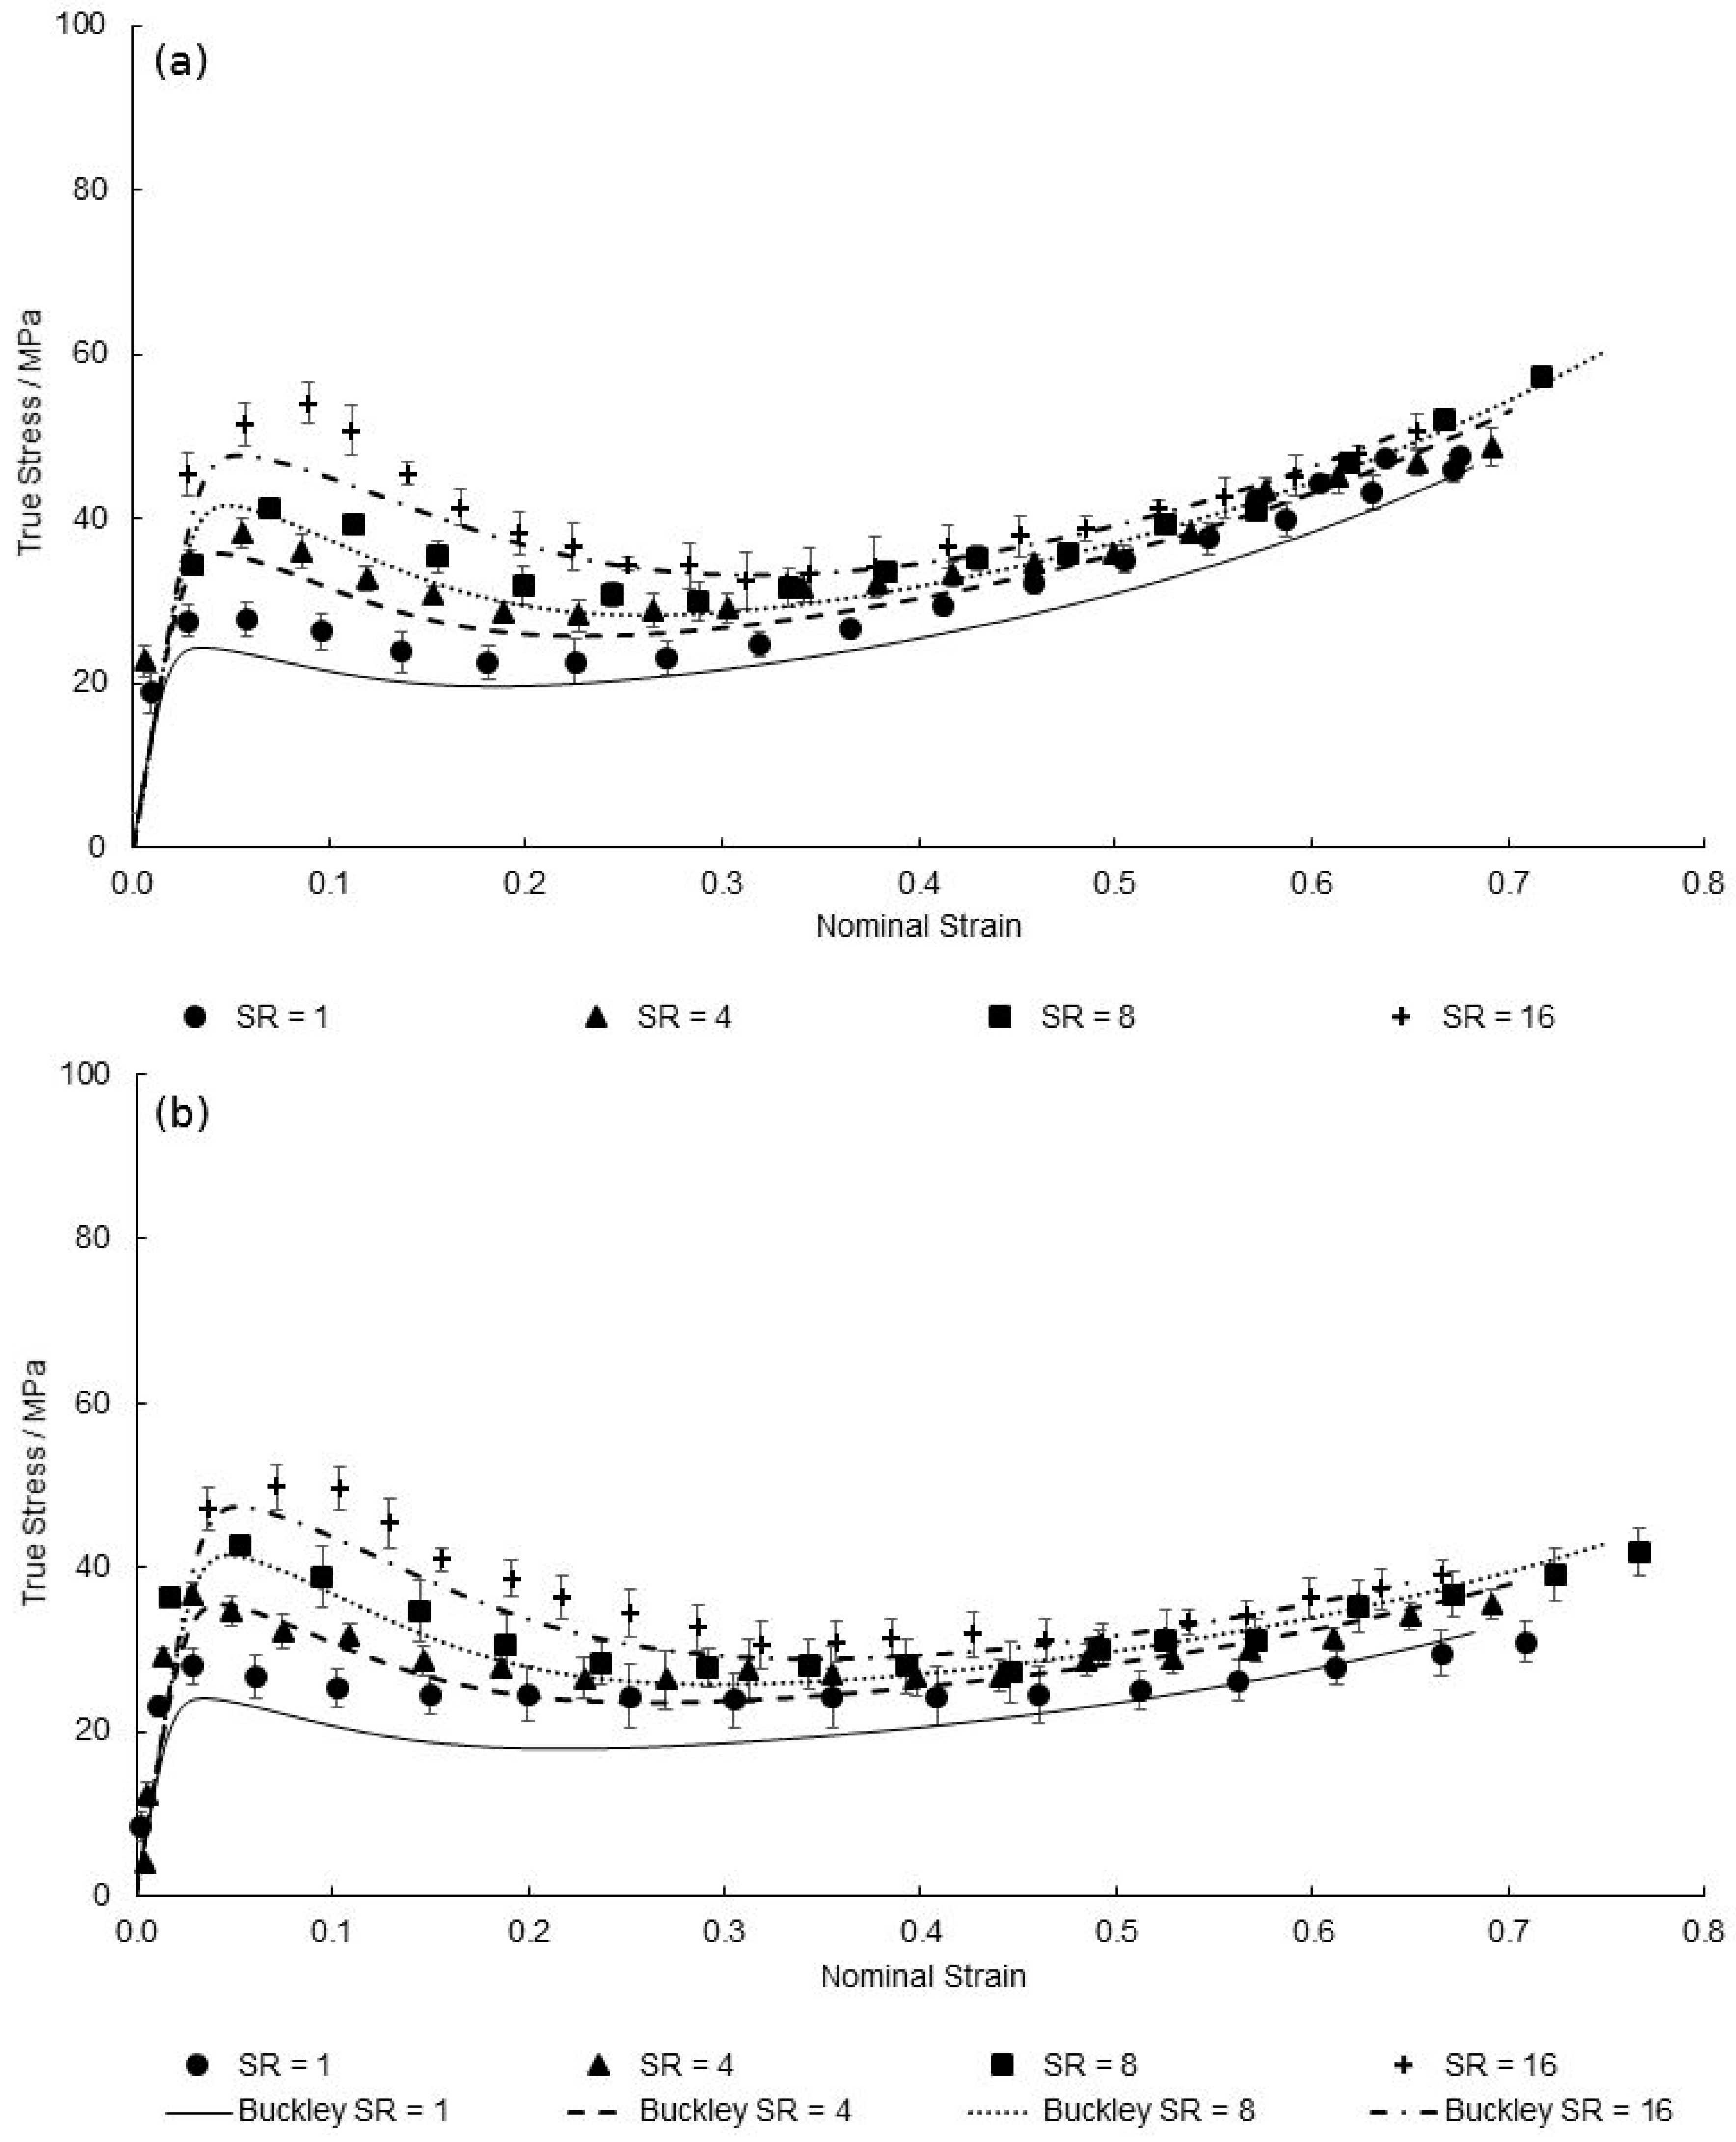
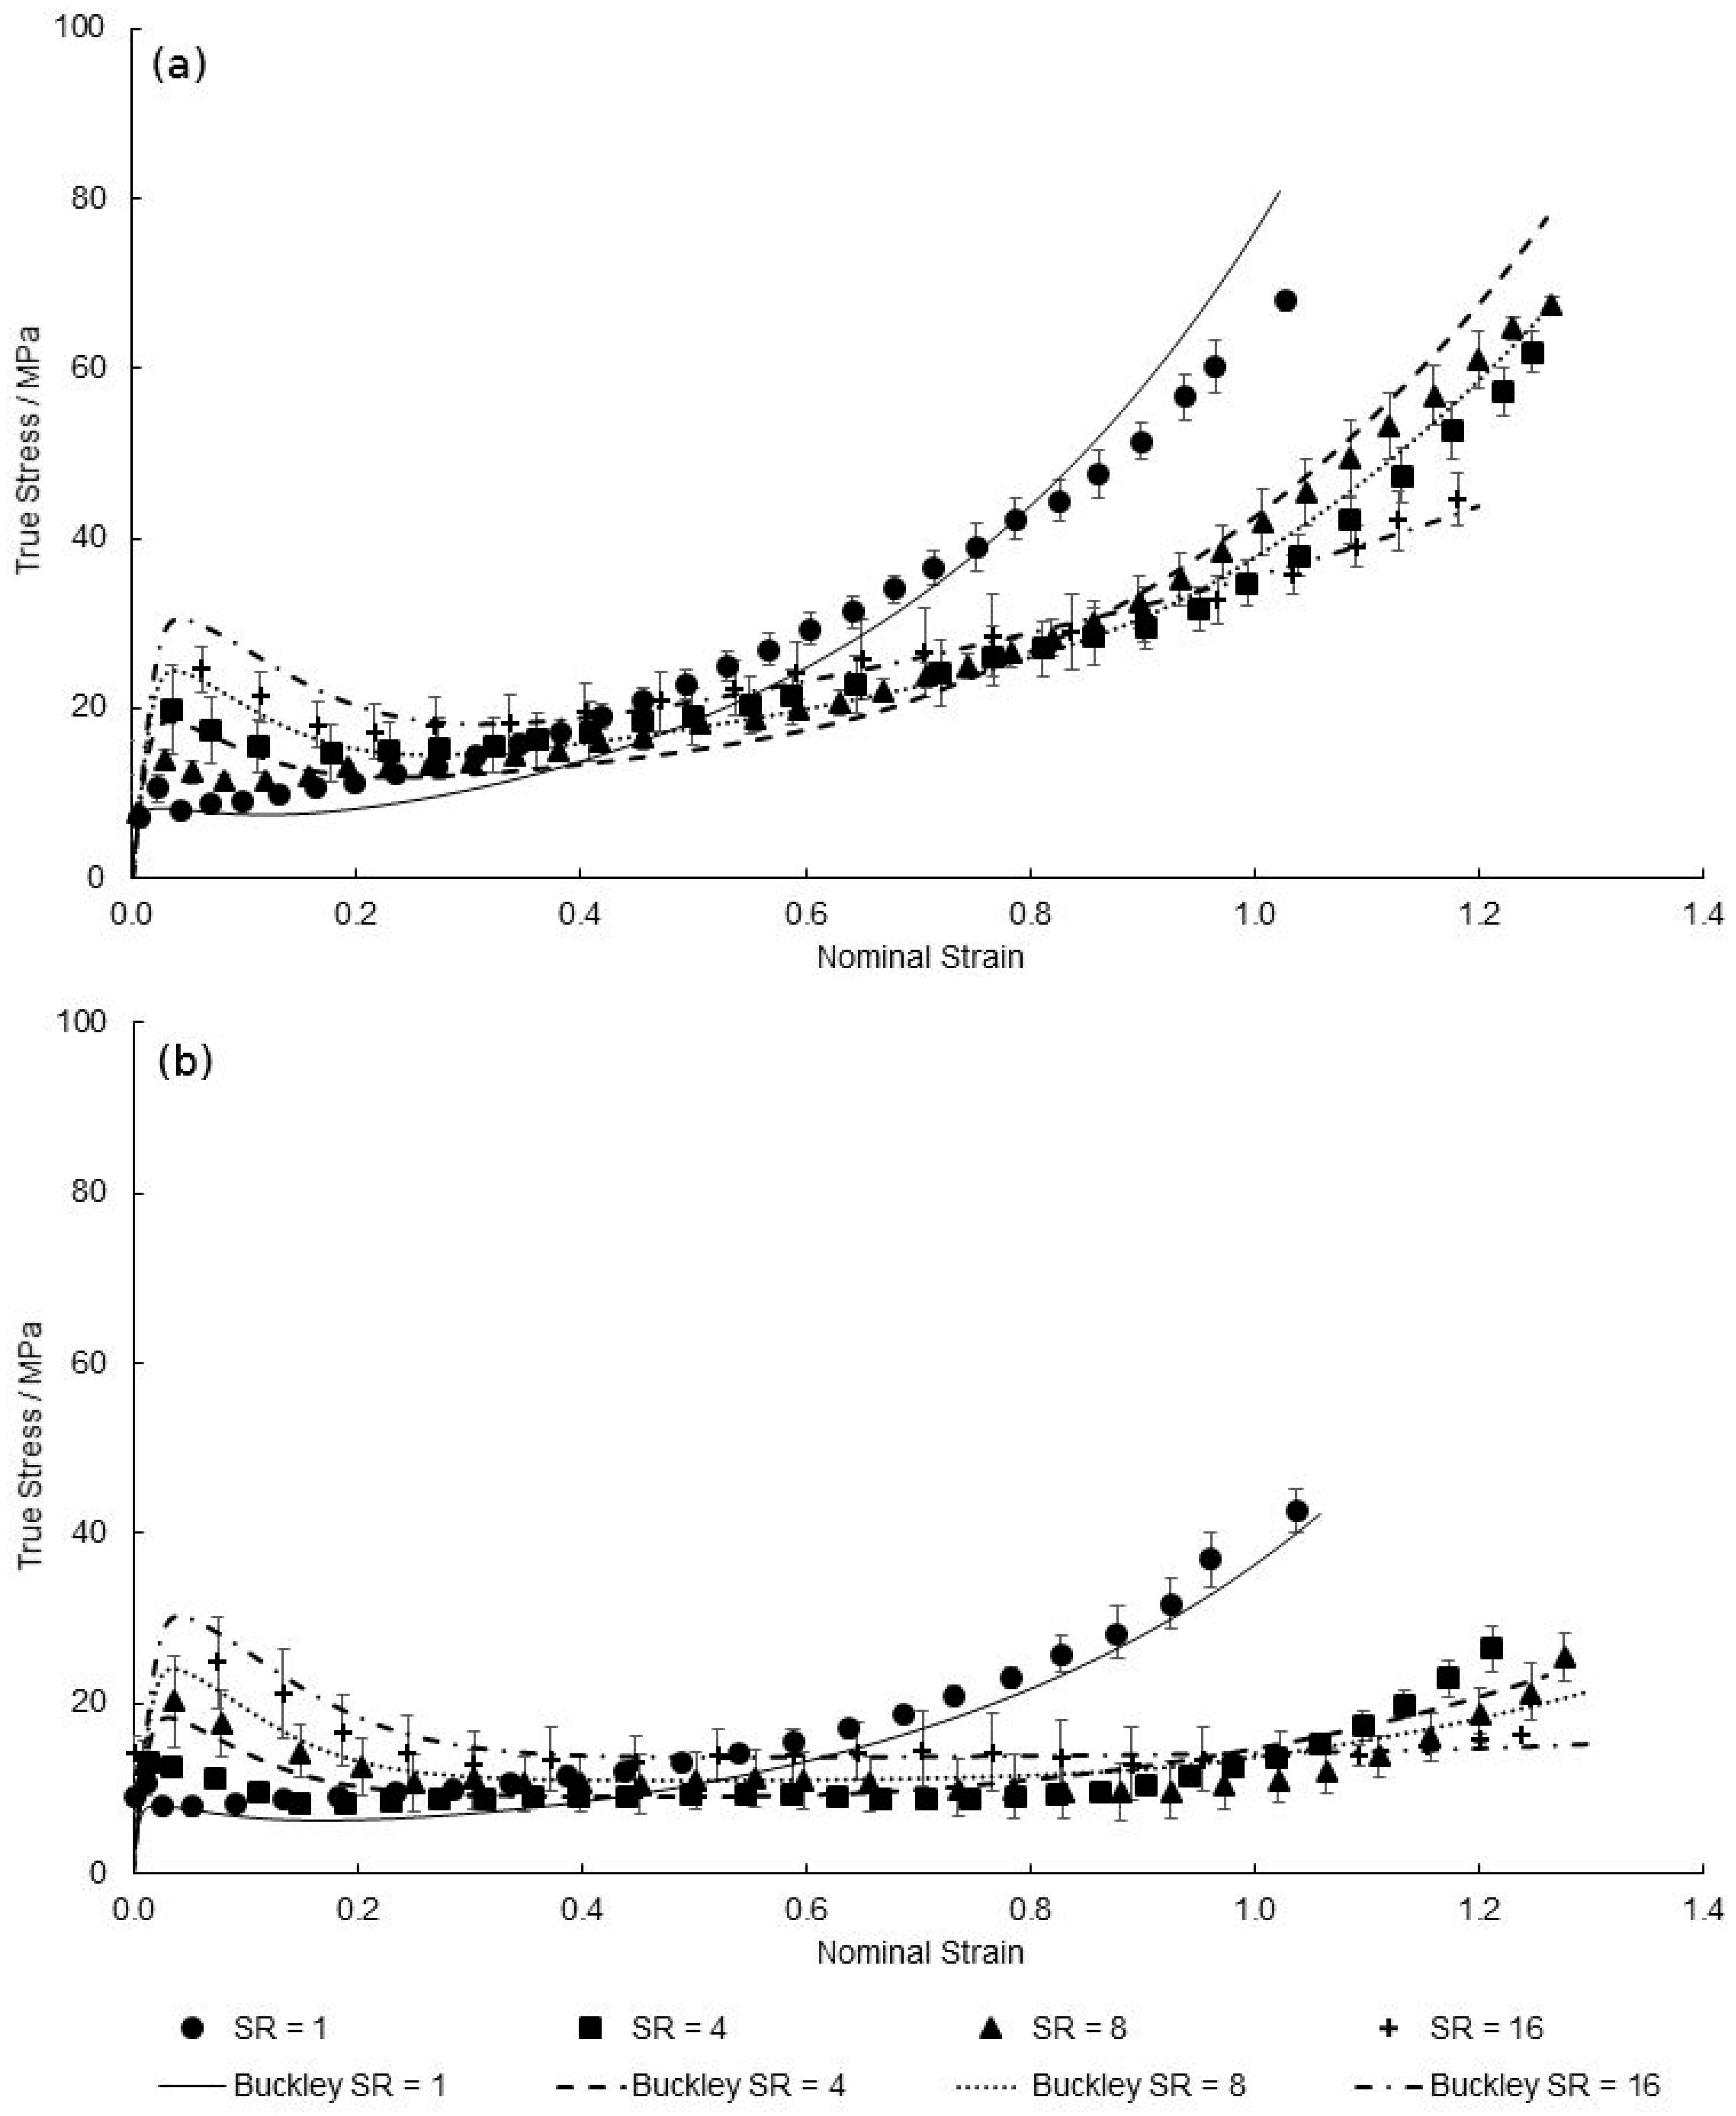
4. Modified Model Prediction and Discussion
5. Conclusions
Author Contributions
Funding
Conflicts of Interest
References
- Bourgin, P.; Cormeau, I.; Saint-Matin, T. A first step towards the modelling of the thermoforming of plastic sheets. J. Mater. Process. Tech. 1995, 54, 1–11. [Google Scholar] [CrossRef]
- Martin, P.J.; Tan, C.W.; Tshai, K.Y.; Menary, G.H.; Armstrong, C.G. Biaxial characterisation of materials for thermoforming and blow moulding. Plast. Rubber Compos. Macromol. Eng. 2005, 34, 276–282. [Google Scholar] [CrossRef]
- Menary, G.H.; Tan, C.W.; Harkin-Jones, E.M.A.; Armstrong, C.G.; Martin, P.J. Biaxial Deformation and Experimental Study of PET at Conditions Applicable to Stretch Blow Molding. Polym. Eng. Sci. 2012, 52, 671–688. [Google Scholar] [CrossRef]
- McKelvey, D.; Menary, G.H.; Martin, P.J.; Yan, S. Large Strain, High Rate Semi-Solid Deformation of High Density Polyethylene at Elevated Temperatures. Polym. Eng. Sci. 2018, 58, 1516–1522. [Google Scholar] [CrossRef]
- Gerlach, C.; Buckley, C.P.; Jones, D.P. Development of an Integrated Approach to Modelling of Polymer Film Orientation Processes. Chem. Eng. Res. Des. 1998, 76, 38–44. [Google Scholar] [CrossRef]
- O’Connor, C.P.J.; Martin, P.J.; Sweeney, J.; Menary, G.; Caton-Rose, P.; Spencer, P.E. Simulation of the plug-assisted thermoforming of polypropylene using a large strain thermally coupled constitutive model. J. Mater. Process. Technol. 2013, 213, 1588–1600. [Google Scholar] [CrossRef]
- Yan, S. Modelling the Constitutive Behaviour of Poly (ethylene terephthalate) for the Stretch Blow Moulding Process. Ph.D. Thesis, Queen’s University Belfast, Belfast, UK, 2014. [Google Scholar]
- Rae, P.J.; Brown, E.N.; Orler, E.B. The Mechanical Properties of Poly(ether-ether-ketone) (PEEK) with Emphasis on the Large Compressive Strain Response. Polymer 2007, 48, 598–615. [Google Scholar] [CrossRef]
- Cebe, P.; Chung, S.Y.; Hong, S.-D. Effect of Thermal History on Mechanical Properties of Polyetheretherketone Below the Glass Transition Temperature. J. Appl. Polym. Sci. 1987, 33, 487–503. [Google Scholar] [CrossRef]
- Alberola, N.D.; Mele, P.; Bas, C. Tensile Mechanical Properties of PEEK Films over a Wide Range of Strain Rates. II. J. Appl. Polym. Sci. 1997, 64, 1053–1059. [Google Scholar] [CrossRef]
- El-Qoubaa, Z.; Othman, R. Tensile Behavior of Polyetheretherketone over a Wide Range of Strain Rates. Int. J. Polym. Sci. 2015, 2015. [Google Scholar] [CrossRef]
- Chen, F.; Ou, H.; Gatea, S.; Long, H. Hot tensile fracture characteristics and constitutive modelling of polyether-ether-ketone (PEEK). Polym. Test. 2017, 63, 168–179. [Google Scholar] [CrossRef]
- Turner, J.A.; Menary, G.H.; Martin, P.J. Biaxial characterisation of poly(ether-ether-ketone) for thermoforming: A comparison between bulge and in—plane biaxial testing. Polym. Eng. Sci. 2019, in press. [Google Scholar]
- El Halabi, F.; Rodriguez, J.F.; Rebolledo, L.; Hurtós, E.; Doblaré, M. Mechanical characterization and numerical simulation of polyether-ether-ketone (PEEK) cranial implants. J. Mech. Behav. Biomed. Mater. 2011, 4, 1819–1832. [Google Scholar] [CrossRef] [PubMed]
- El-Qoubaa, Z.; Othman, R. Characterization and modeling of the strain rate sensitivity of polyetheretherketone’s compressive yield stress. Mater. Des. 2015, 66, 336–345. [Google Scholar] [CrossRef]
- El-Qoubaa, Z.; Othman, R. Strain rate sensitivity of polyetheretherketone’s compressive yield stress at low and high temperatures. Mech. Mater. 2016, 95, 15–27. [Google Scholar] [CrossRef]
- Chen, F.; Ou, H.; Lu, B.; Long, H. A constitutive model of polyether-ether-ketone (PEEK). J. Mech. Behav. Biomed. Mater. 2016, 53, 427–433. [Google Scholar] [CrossRef] [PubMed]
- Lin, Y.C.; Chen, X. A combined Johnson—Cook and Zerilli—Armstrong model for hot compressed typical high-strength alloy steel. Comput. Mater. Sci. 2010, 49, 628–633. [Google Scholar] [CrossRef]
- Buckley, C.P.; Jones, D.C. Glass-rubber constitutive model for amorphous polymers near the glass transition. Polymer 1995, 36, 3301–3312. [Google Scholar] [CrossRef]
- Buckley, C.P.; Jones, D.C.; Jones, D.P. Hot-Drawing of Poly(Ethylene Terephthalate ) under Biaxial Stress: Application of a Three-Dimensional Glass-Rubber Constitutive Model. Polymer 1996, 37, 2403–2414. [Google Scholar] [CrossRef]
- Dooling, P.J.; Buckley, C.P.; Rostami, S.; Zahlan, N. Hot-drawing of poly (methyl methacrylate) and simulation using a glass - rubber constitutive model. Polymer 2002, 43, 2451–2465. [Google Scholar] [CrossRef]
- Wu, J.J.; Buckley, C.P. Plastic Deformation of Glassy Polystyrene: A Unified Model of Yield and the Role of Chain Length. J. Polym. Sci. Part B Polym. Phys. 2004, 42, 2027–2040. [Google Scholar] [CrossRef]
- Nixon, J.; Menary, G.H.; Yan, S. Finite element simulations of stretch-blow moulding with experimental validation over a broad process window. Int. J. Mater. Form. 2017, 10, 793–809. [Google Scholar] [CrossRef]
- O’Connor, C. Development of Thermoforming Process Simulations and Constitutive Models of Polypropylenes. Ph.D. Thesis, Queen’s University Belfast, Belfast, UK, 2010. [Google Scholar]
- Halsey, G.; White, H.J.; Eyring, H. Mechanical Properties of Textiles, I. Text. Res. J. 1945, 15, 295–311. [Google Scholar] [CrossRef]
- Vogel, H. The law of the relationship between the viscosity of liquids and the temperature. Phys. Z 1921, 22, 645–646. [Google Scholar]
- Tammann, G.; Hesse, W. The dependence of the viscosity upon the temperature of supercooled liquids. Z. Anorg. Gen. Chem. 1926, 156, 245–257. [Google Scholar] [CrossRef]
- Fulcher, G.S. Analysis of recent measurements of the viscosity. J. Am. Ceram. Soc. 1925, 8, 339–355. [Google Scholar] [CrossRef]
- Arrhenius, S. On the reaction velocity of the inversion of cane sugar by acids. Z. Phys. Chem. 1889, 4, 226–248. [Google Scholar]
- Buckley, C.P.; Dooling, P.J.; Harding, J.; Ruiz, C. Deformation of thermosetting resins at impact rates of strain. Part 2: Constitutive model with rejuvenation. J. Mech. Phys. Solids 2004, 52, 2355–2377. [Google Scholar] [CrossRef]
- Edwards, S.F.; Vilgis, T. The effect of entanglements in rubber elasticity. Polymer 1986, 27, 483–492. [Google Scholar] [CrossRef]
- Adams, A.M.; Buckley, C.P.; Jones, D.P. Biaxial hot drawing of poly(ethylene terephthalate): Measurements and modelling of strain-stiffening. Polymer 2000, 41, 771–786. [Google Scholar] [CrossRef]
- Holzapfel, G.A.; Gasser, T.C.; Ogden, R.A.Y.W. A New Constitutive Framework for Arterial Wall Mechanics and a Comparative Study of Material Models. J. Elast. 2000, 61, 1–48. [Google Scholar] [CrossRef]
- Bauwens-Crowet, C. The compression yield behaviour of polymethyl methacrylate over a wide range of temperatures and strain-rates. J. Mater. Sci. 1973, 8, 968–979. [Google Scholar] [CrossRef]


| Temperature Range | 130–155 °C |
| Strain Rate Range | 1–16 s−1 |
| Mode of Deformation | Equal Biaxial (EB) |
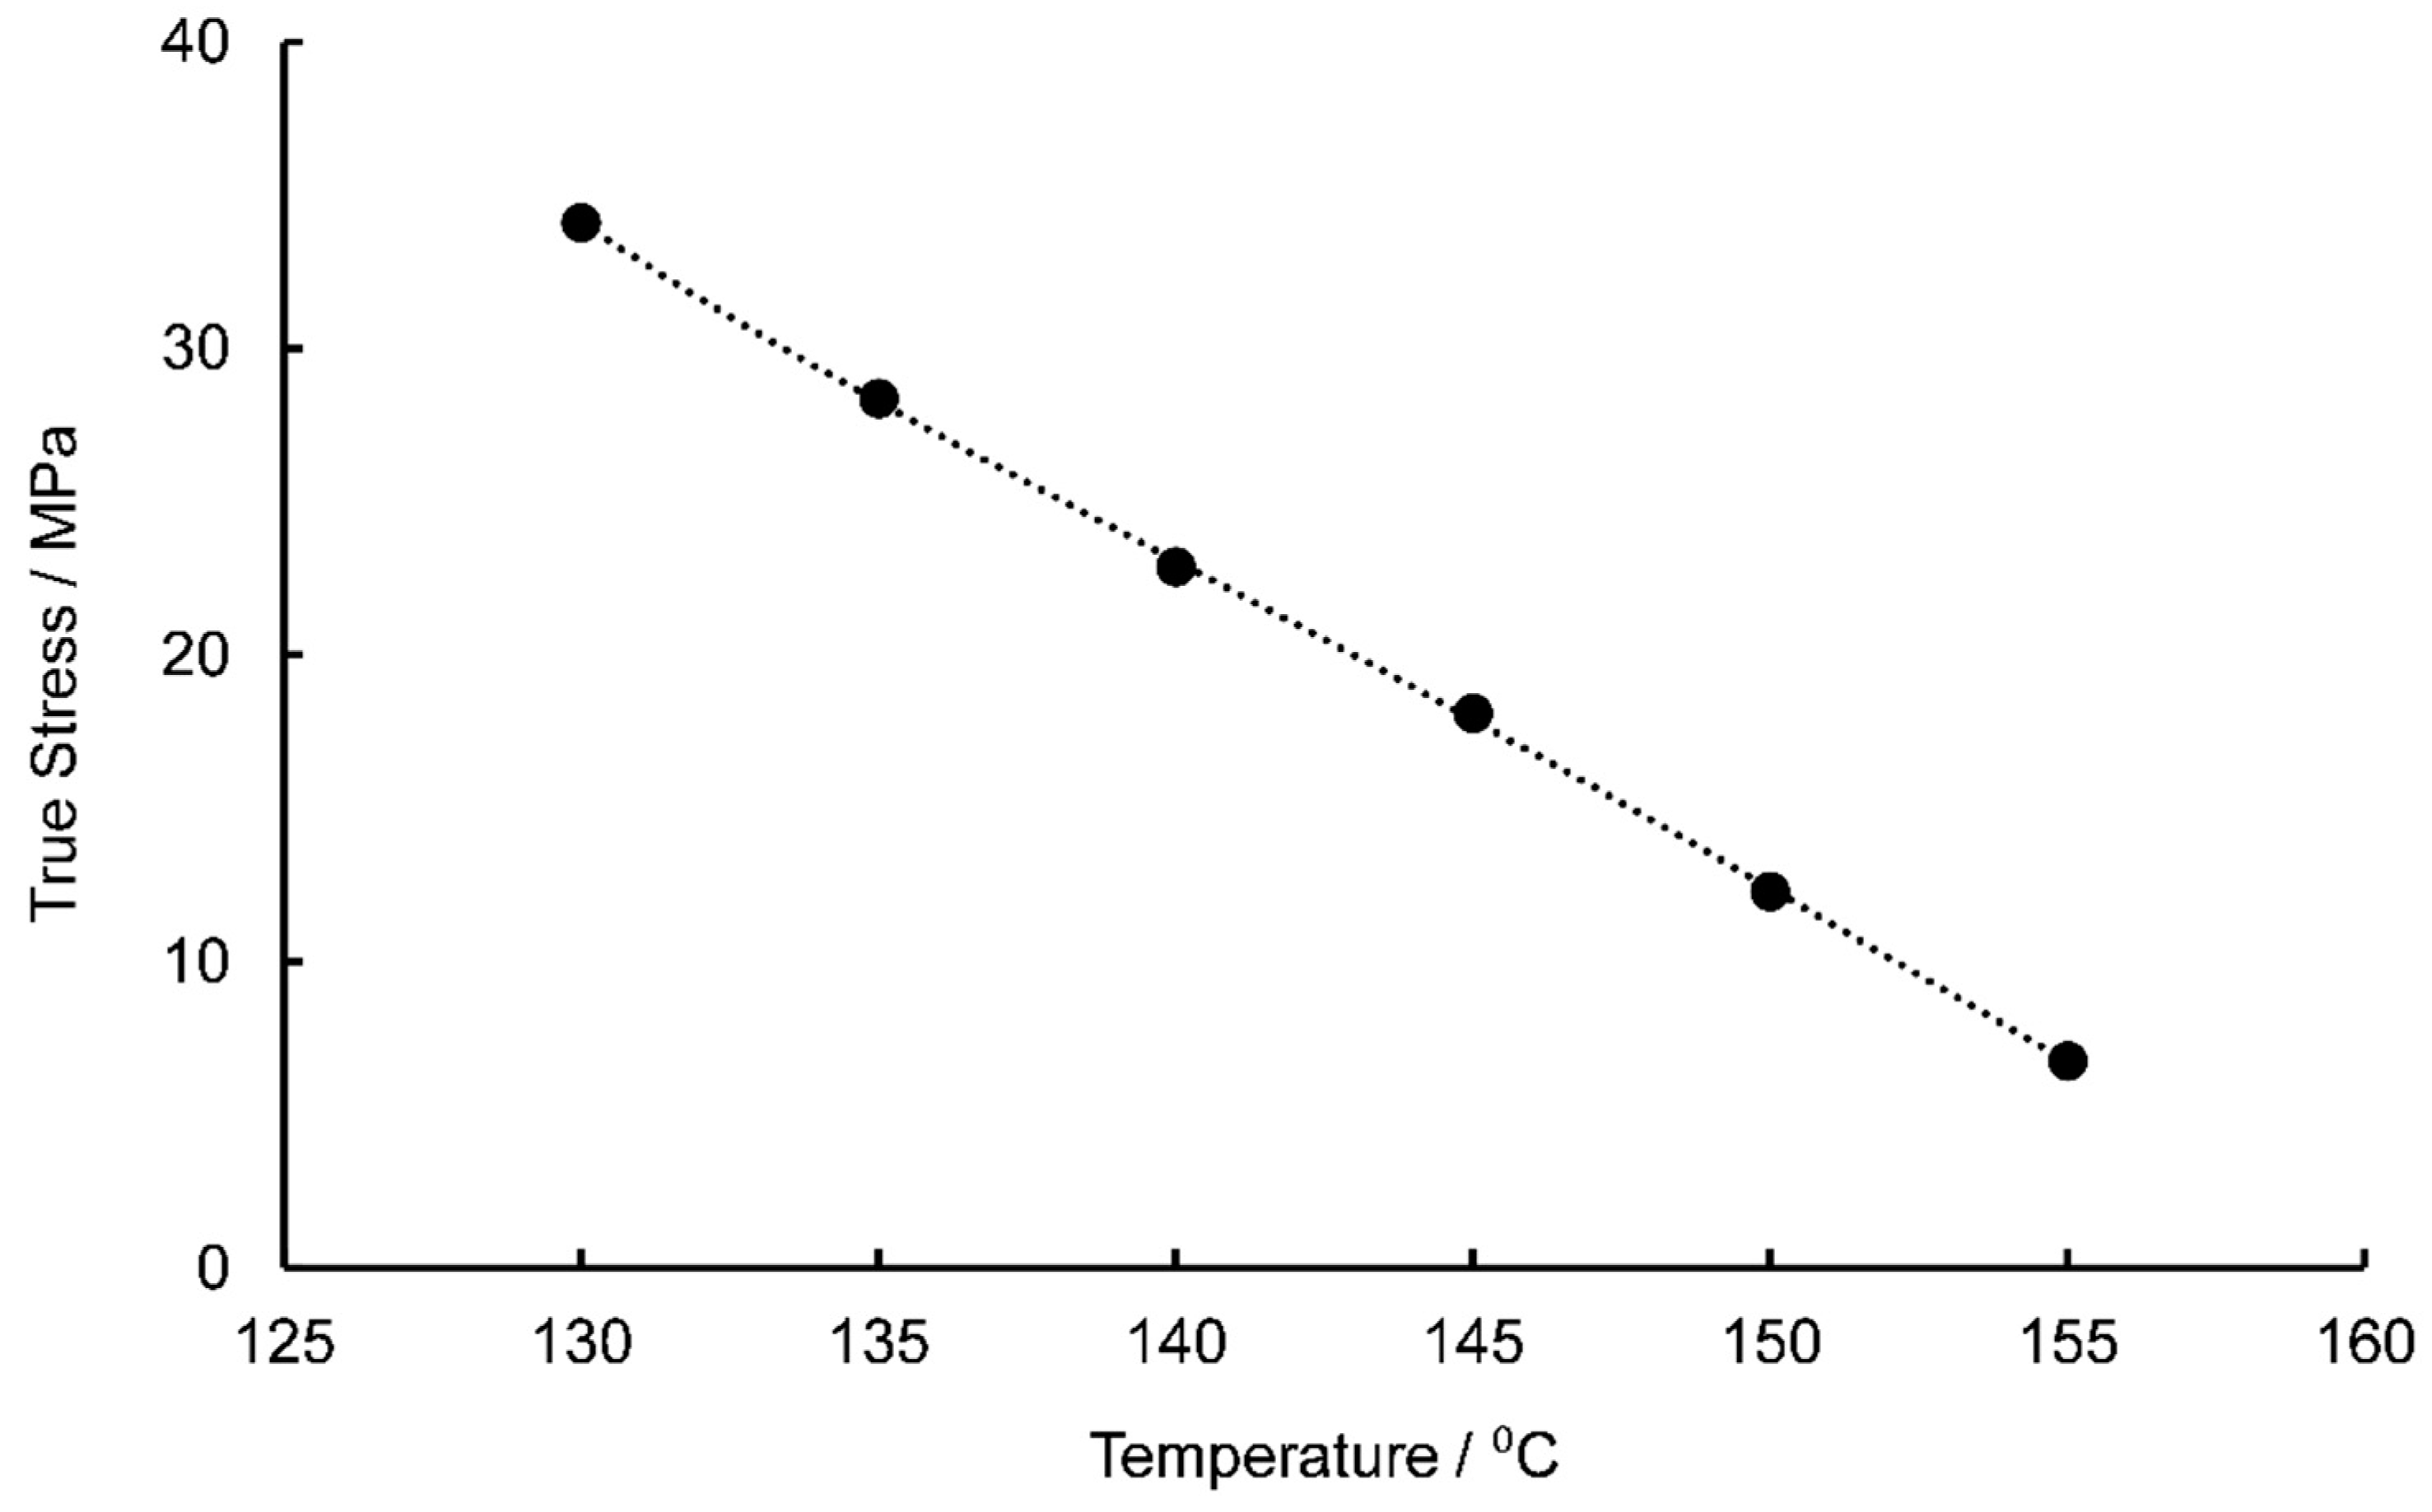
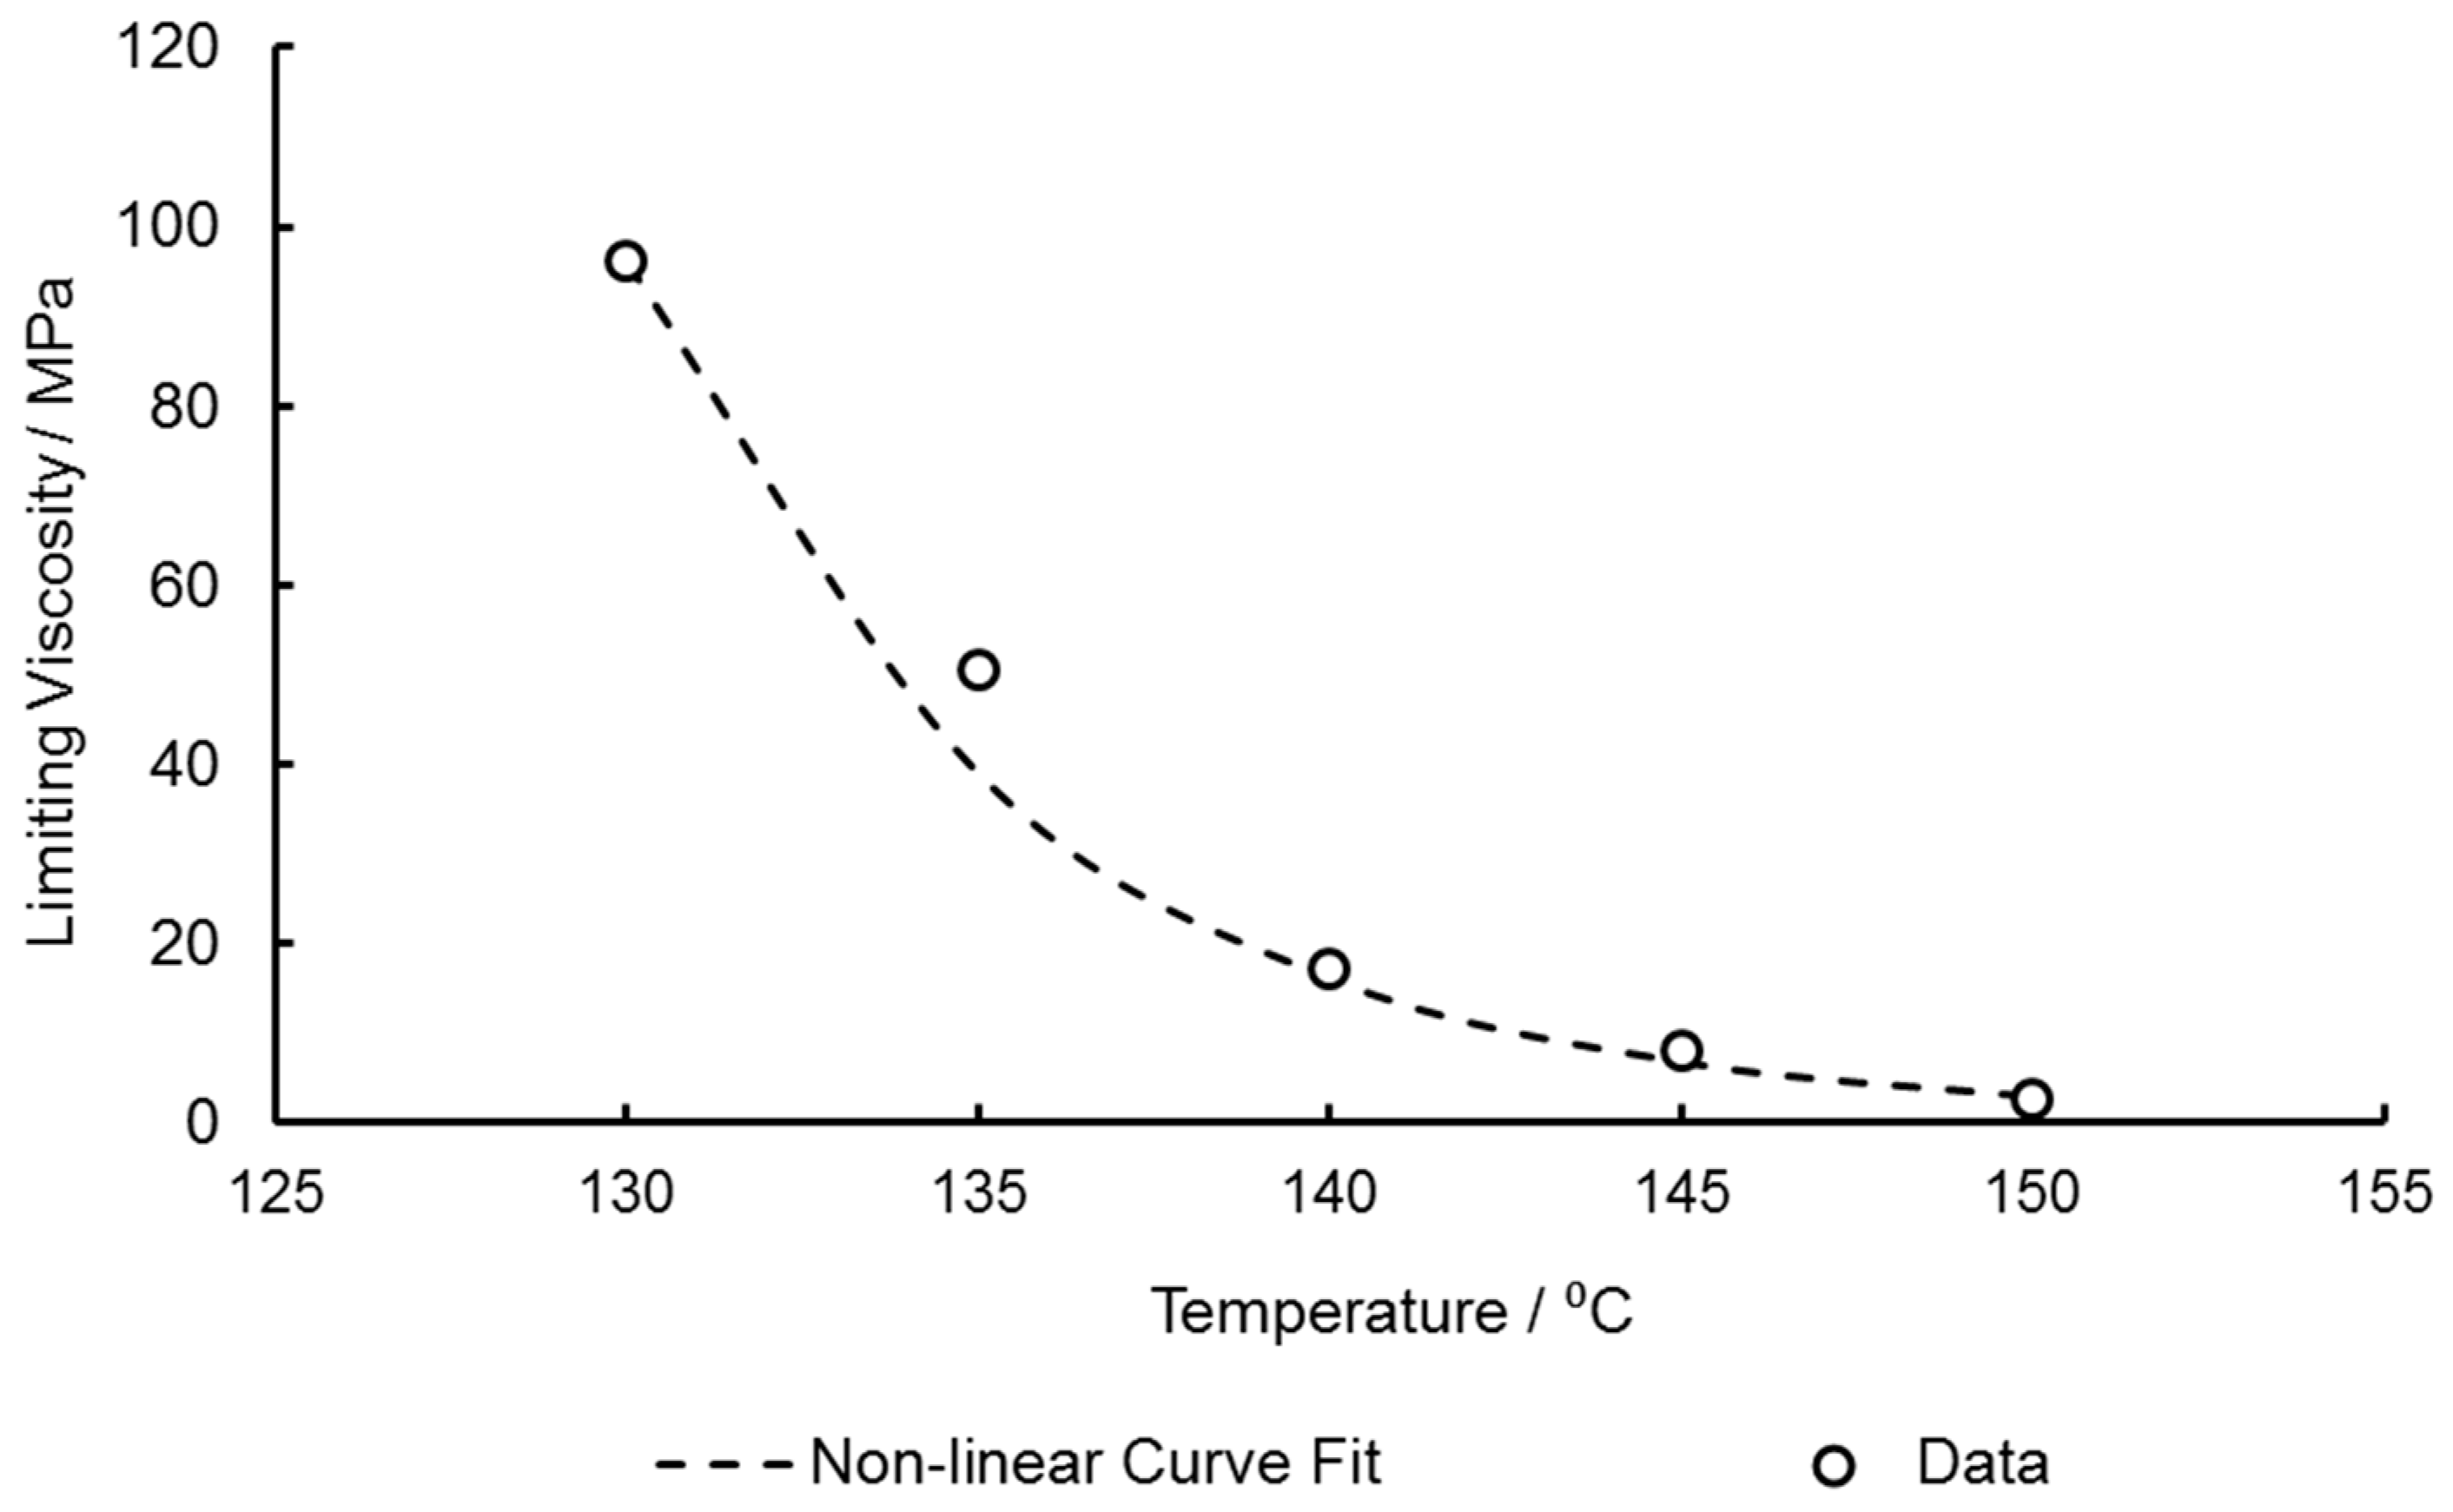
| Temperature, T (°C) | Total True Stress, σ (MPa) | Conformational Stress, (MPa) | Bond-Stretching Stress, (MPa) | Limiting Viscosity, (MPa) |
|---|---|---|---|---|
| 130 | 34.10 | 6.77 | 27.33 | 92.66 |
| 135 | 28.36 | 6.77 | 21.59 | 39.68 |
| 140 | 22.87 | 6.77 | 16.10 | 17.15 |
| 145 | 18.09 | 6.77 | 11.32 | 8.08 |
| 150 | 12.29 | 6.77 | 5.52 | 2.74 |
| 155 | 6.77 | 6.77 | 0 | 0 |
| Property | Value | Unit | |
|---|---|---|---|
| Bond Stretching Part | Shear Modulus, | 250 | MPa |
| Bulk Modulus, | 6250 | MPa | |
| Shear Activation Volume, | 1.74 × 10⁻³ | m3 mol−1 | |
| Pressure Activation Volume, | 1.41 × 10⁻⁴ | m3 mol−1 | |
| Reference Viscosity, | 92.7 | MPa | |
| Activation Enthalpy, | 301 | kJ mol−1 | |
| Limiting Temperature, | 465 | K | |
| Viscosity Constant, | 399 | K | |
| Initial Fictive Temp, | 419 | K | |
| Reference Fictive Temp, | 423 | K | |
| − | −0.0892 | ||
| − | 5.90 | ||
| Strain Induced Increase, | + 109 | K | |
| Rejuvenation Strain Range, | 0.0058 × SR + 0.181 | ||
| Fitting Parameter, | 1.60 | ||
| Conformational Part | 1.00 | MPa | |
| 2.16 | MPa | ||
| 0.0150 | |||
| 0.585 | |||
| 4.02 × 10⁻¹¹ | ⁰ | ||
| Reference Slippage Viscosity, | 1.68 0.20 | MPa (MD) MPa (TD) | |
| Limiting Temperature, | 5.94 | K | |
| Viscosity Constant, | 3296 | K | |
| − | 0.213 | ||
| − | 6.47 | ||
| Critical Network Stretch, | − 4.30 | K |
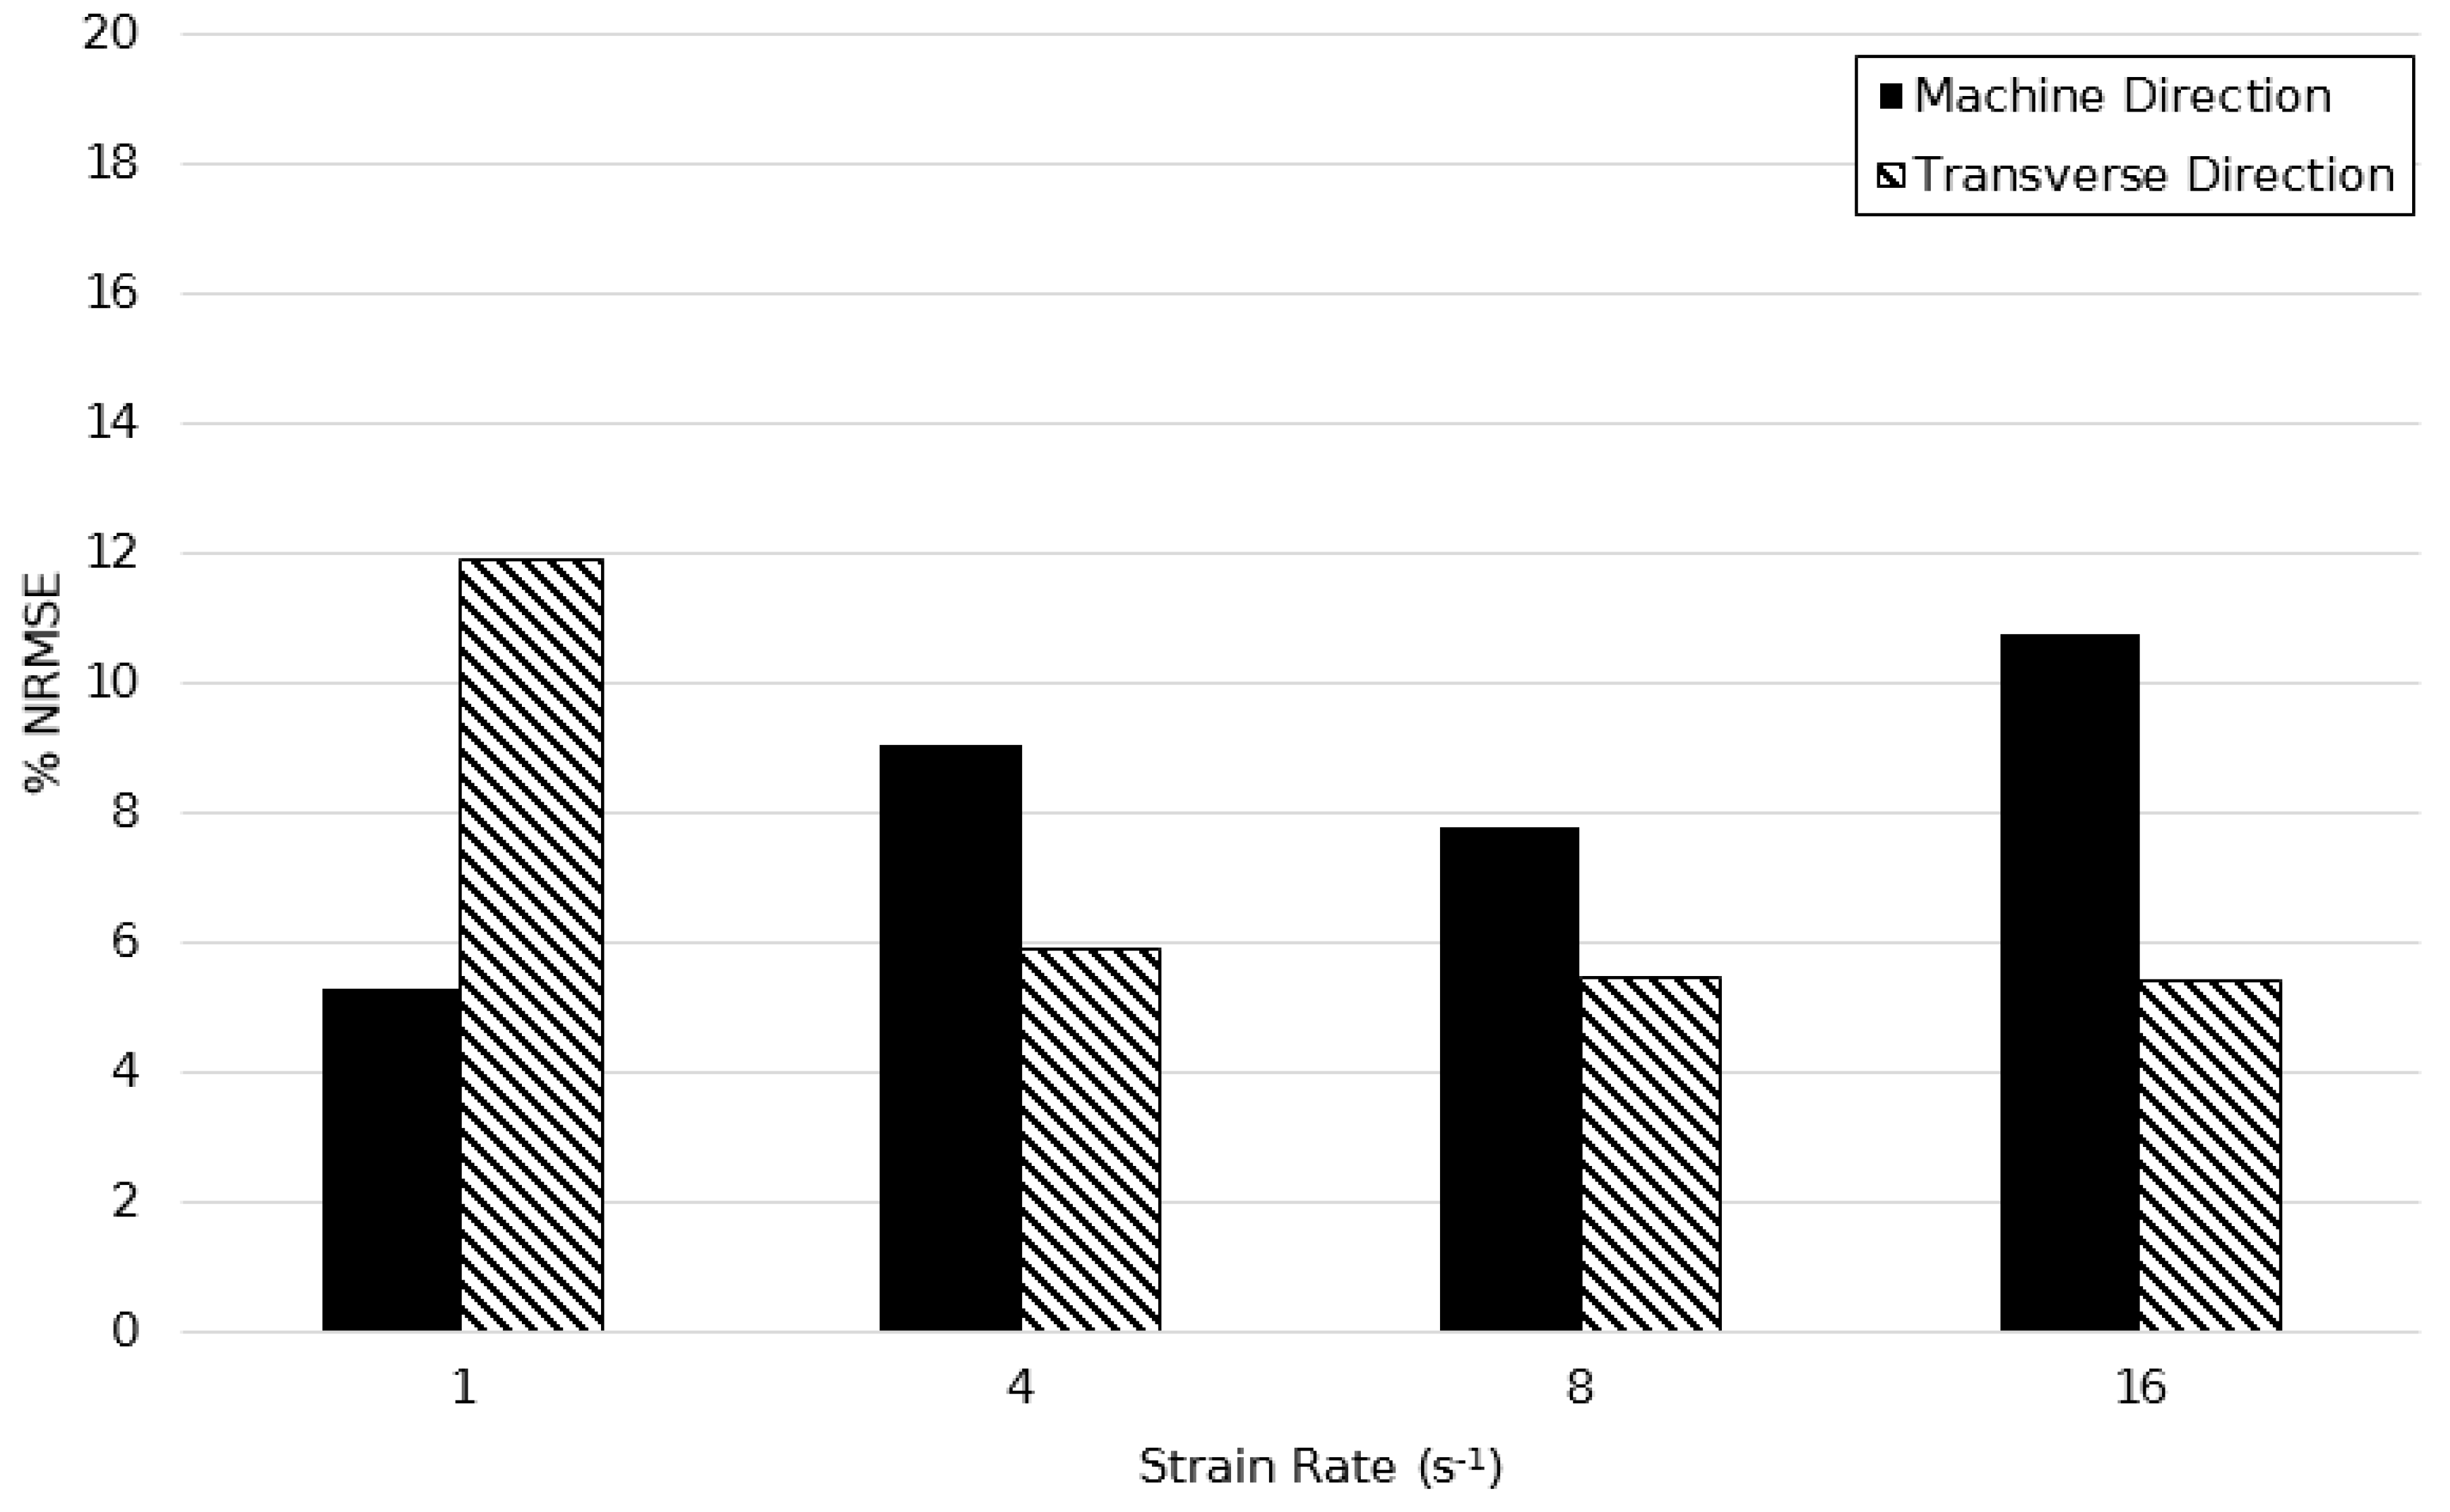
| Model | Machine Direction | Transverse Direction | ||
|---|---|---|---|---|
| Strain Rate (s−1) | Strain Rate (s−1) | |||
| 1 | 16 | 1 | 16 | |
| Original | 5.874% | 19.91% | 21.42% | 36.08% |
| Modified | 5.294% | 10.73% | 11.87% | 5.340% |
© 2019 by the authors. Licensee MDPI, Basel, Switzerland. This article is an open access article distributed under the terms and conditions of the Creative Commons Attribution (CC BY) license (http://creativecommons.org/licenses/by/4.0/).
Share and Cite
Turner, J.A.; Menary, G.H.; Martin, P.J.; Yan, S. Modelling the Temperature Dependent Biaxial Response of Poly(ether-ether-ketone) Above and Below the Glass Transition for Thermoforming Applications. Polymers 2019, 11, 1042. https://doi.org/10.3390/polym11061042
Turner JA, Menary GH, Martin PJ, Yan S. Modelling the Temperature Dependent Biaxial Response of Poly(ether-ether-ketone) Above and Below the Glass Transition for Thermoforming Applications. Polymers. 2019; 11(6):1042. https://doi.org/10.3390/polym11061042
Chicago/Turabian StyleTurner, Josh A., Gary H. Menary, Peter J. Martin, and Shiyong Yan. 2019. "Modelling the Temperature Dependent Biaxial Response of Poly(ether-ether-ketone) Above and Below the Glass Transition for Thermoforming Applications" Polymers 11, no. 6: 1042. https://doi.org/10.3390/polym11061042
APA StyleTurner, J. A., Menary, G. H., Martin, P. J., & Yan, S. (2019). Modelling the Temperature Dependent Biaxial Response of Poly(ether-ether-ketone) Above and Below the Glass Transition for Thermoforming Applications. Polymers, 11(6), 1042. https://doi.org/10.3390/polym11061042