An In Vitro Evaluation, on Polyurethane Foam Sheets, of the Insertion Torque (IT) Values, Pull-Out Torque Values, and Resonance Frequency Analysis (RFA) of NanoShort Dental Implants


Abstract
1. Introduction
2. Materials and Methods
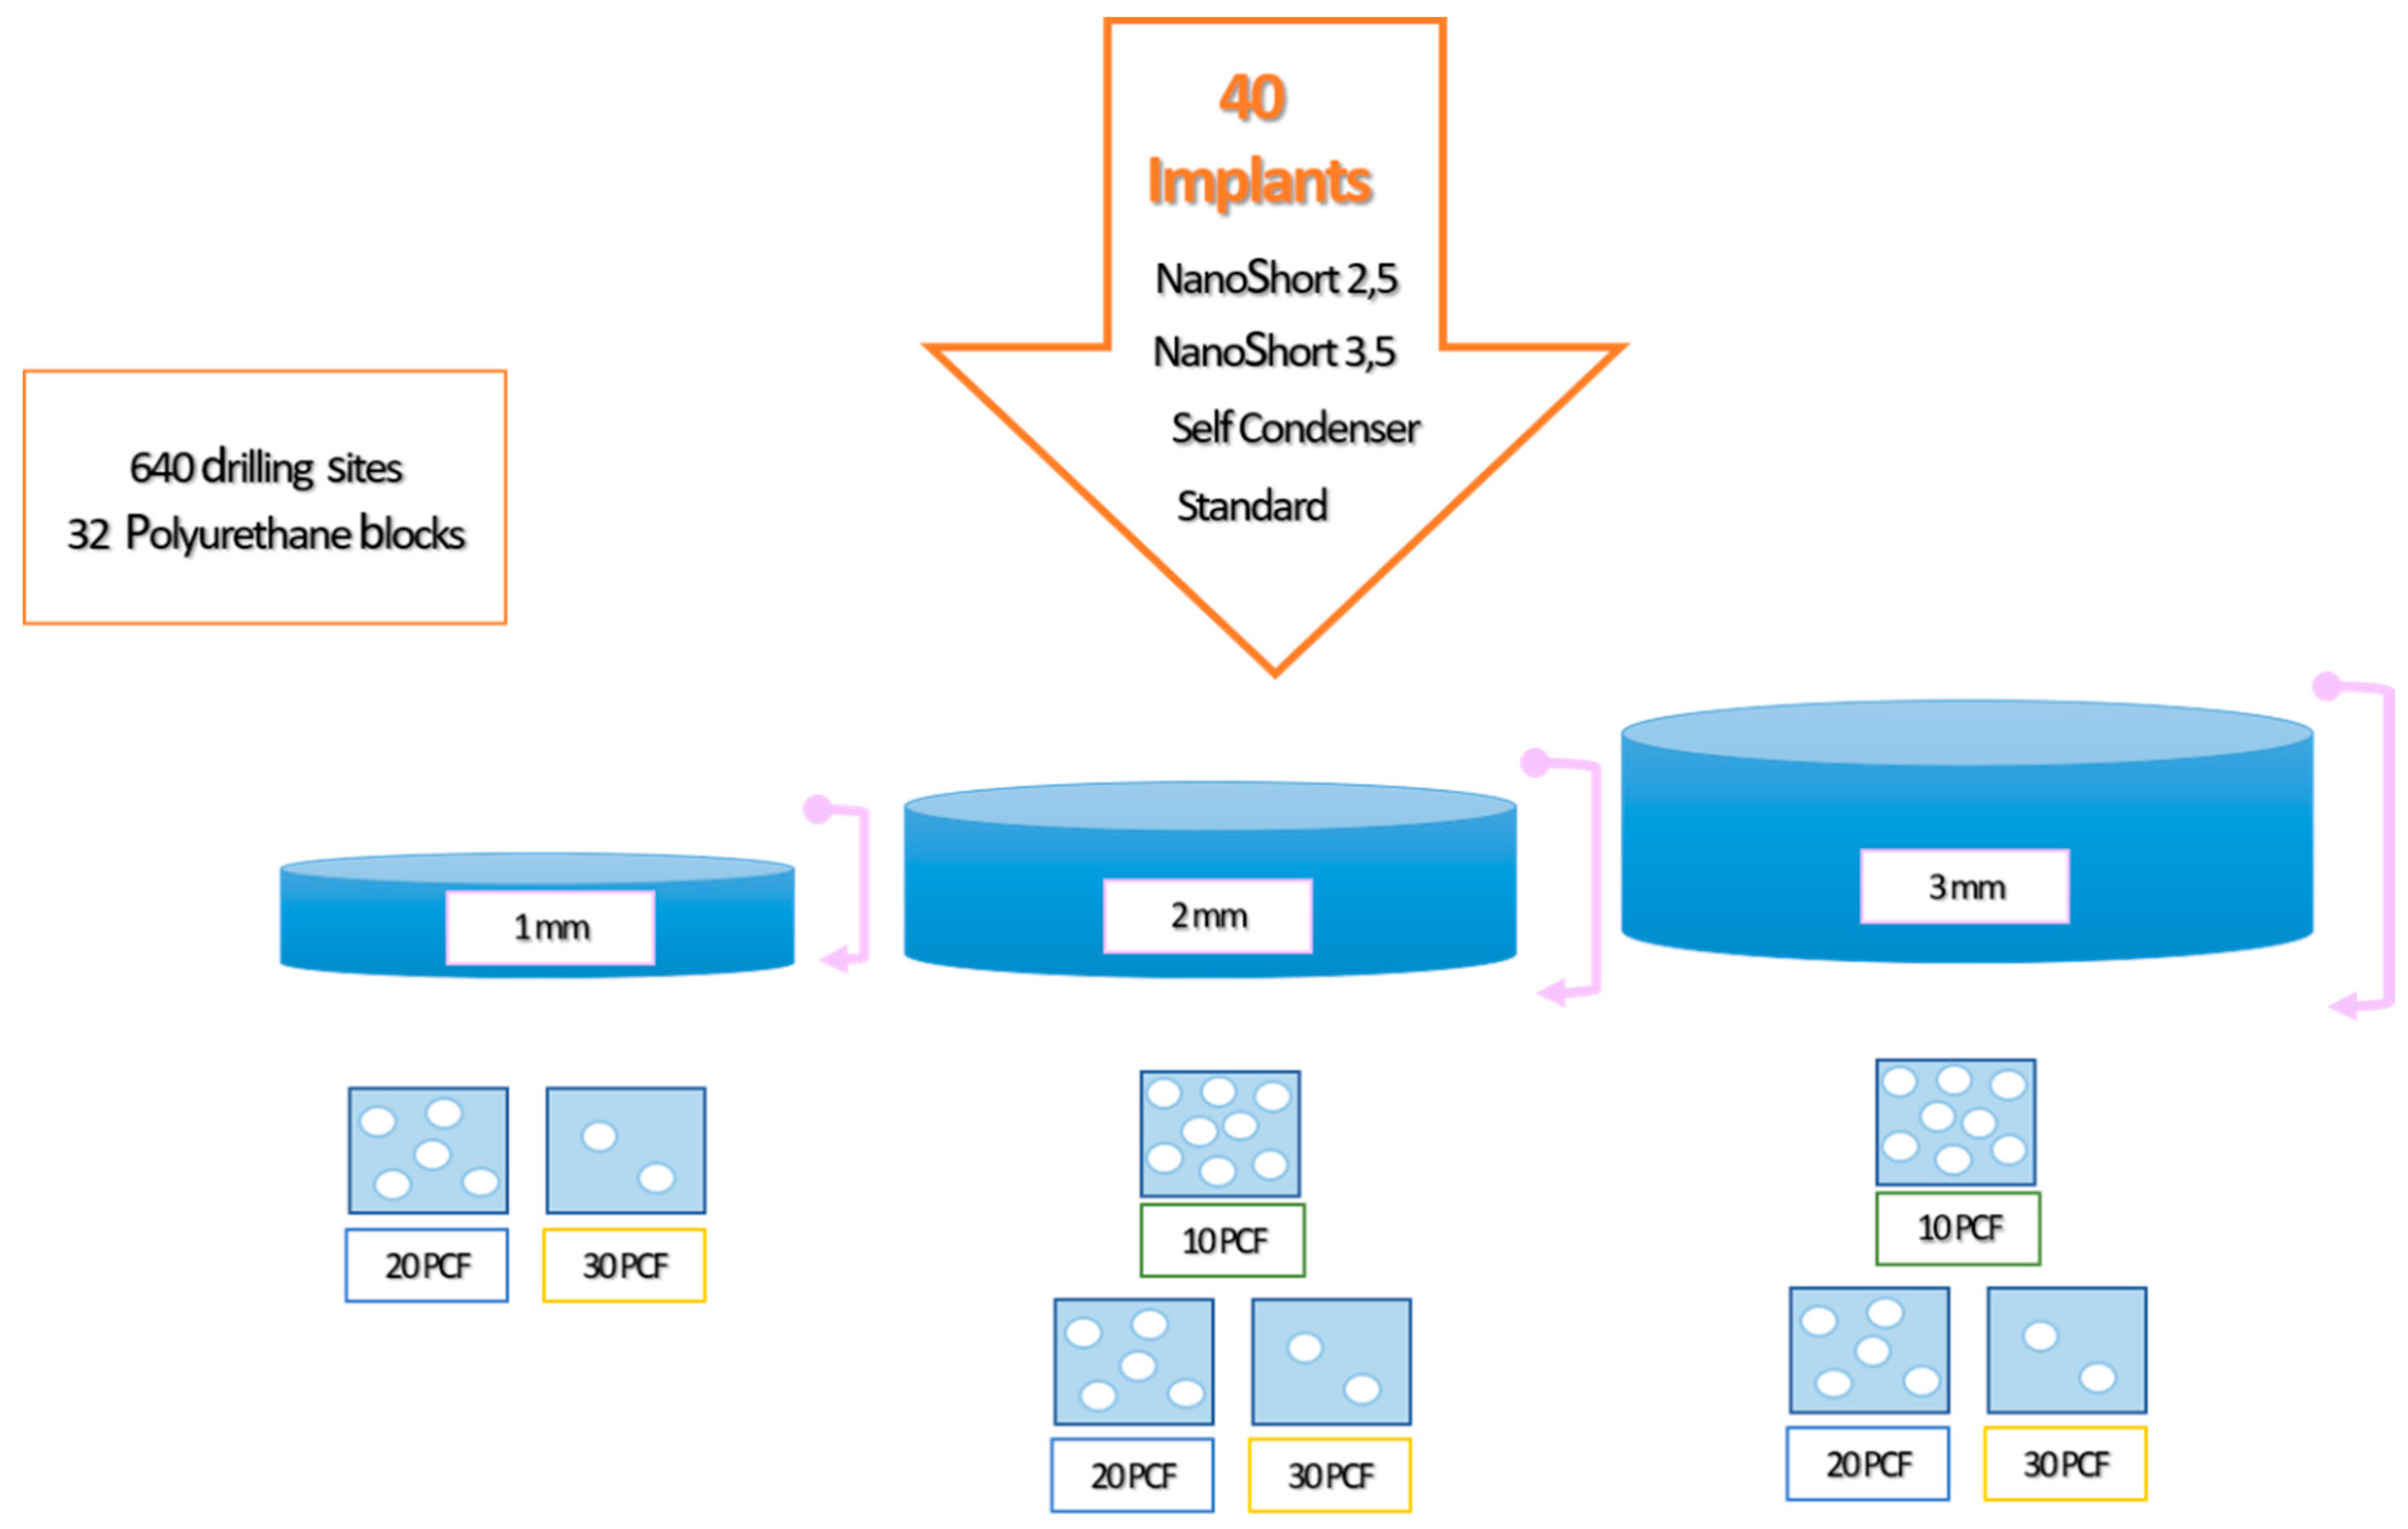
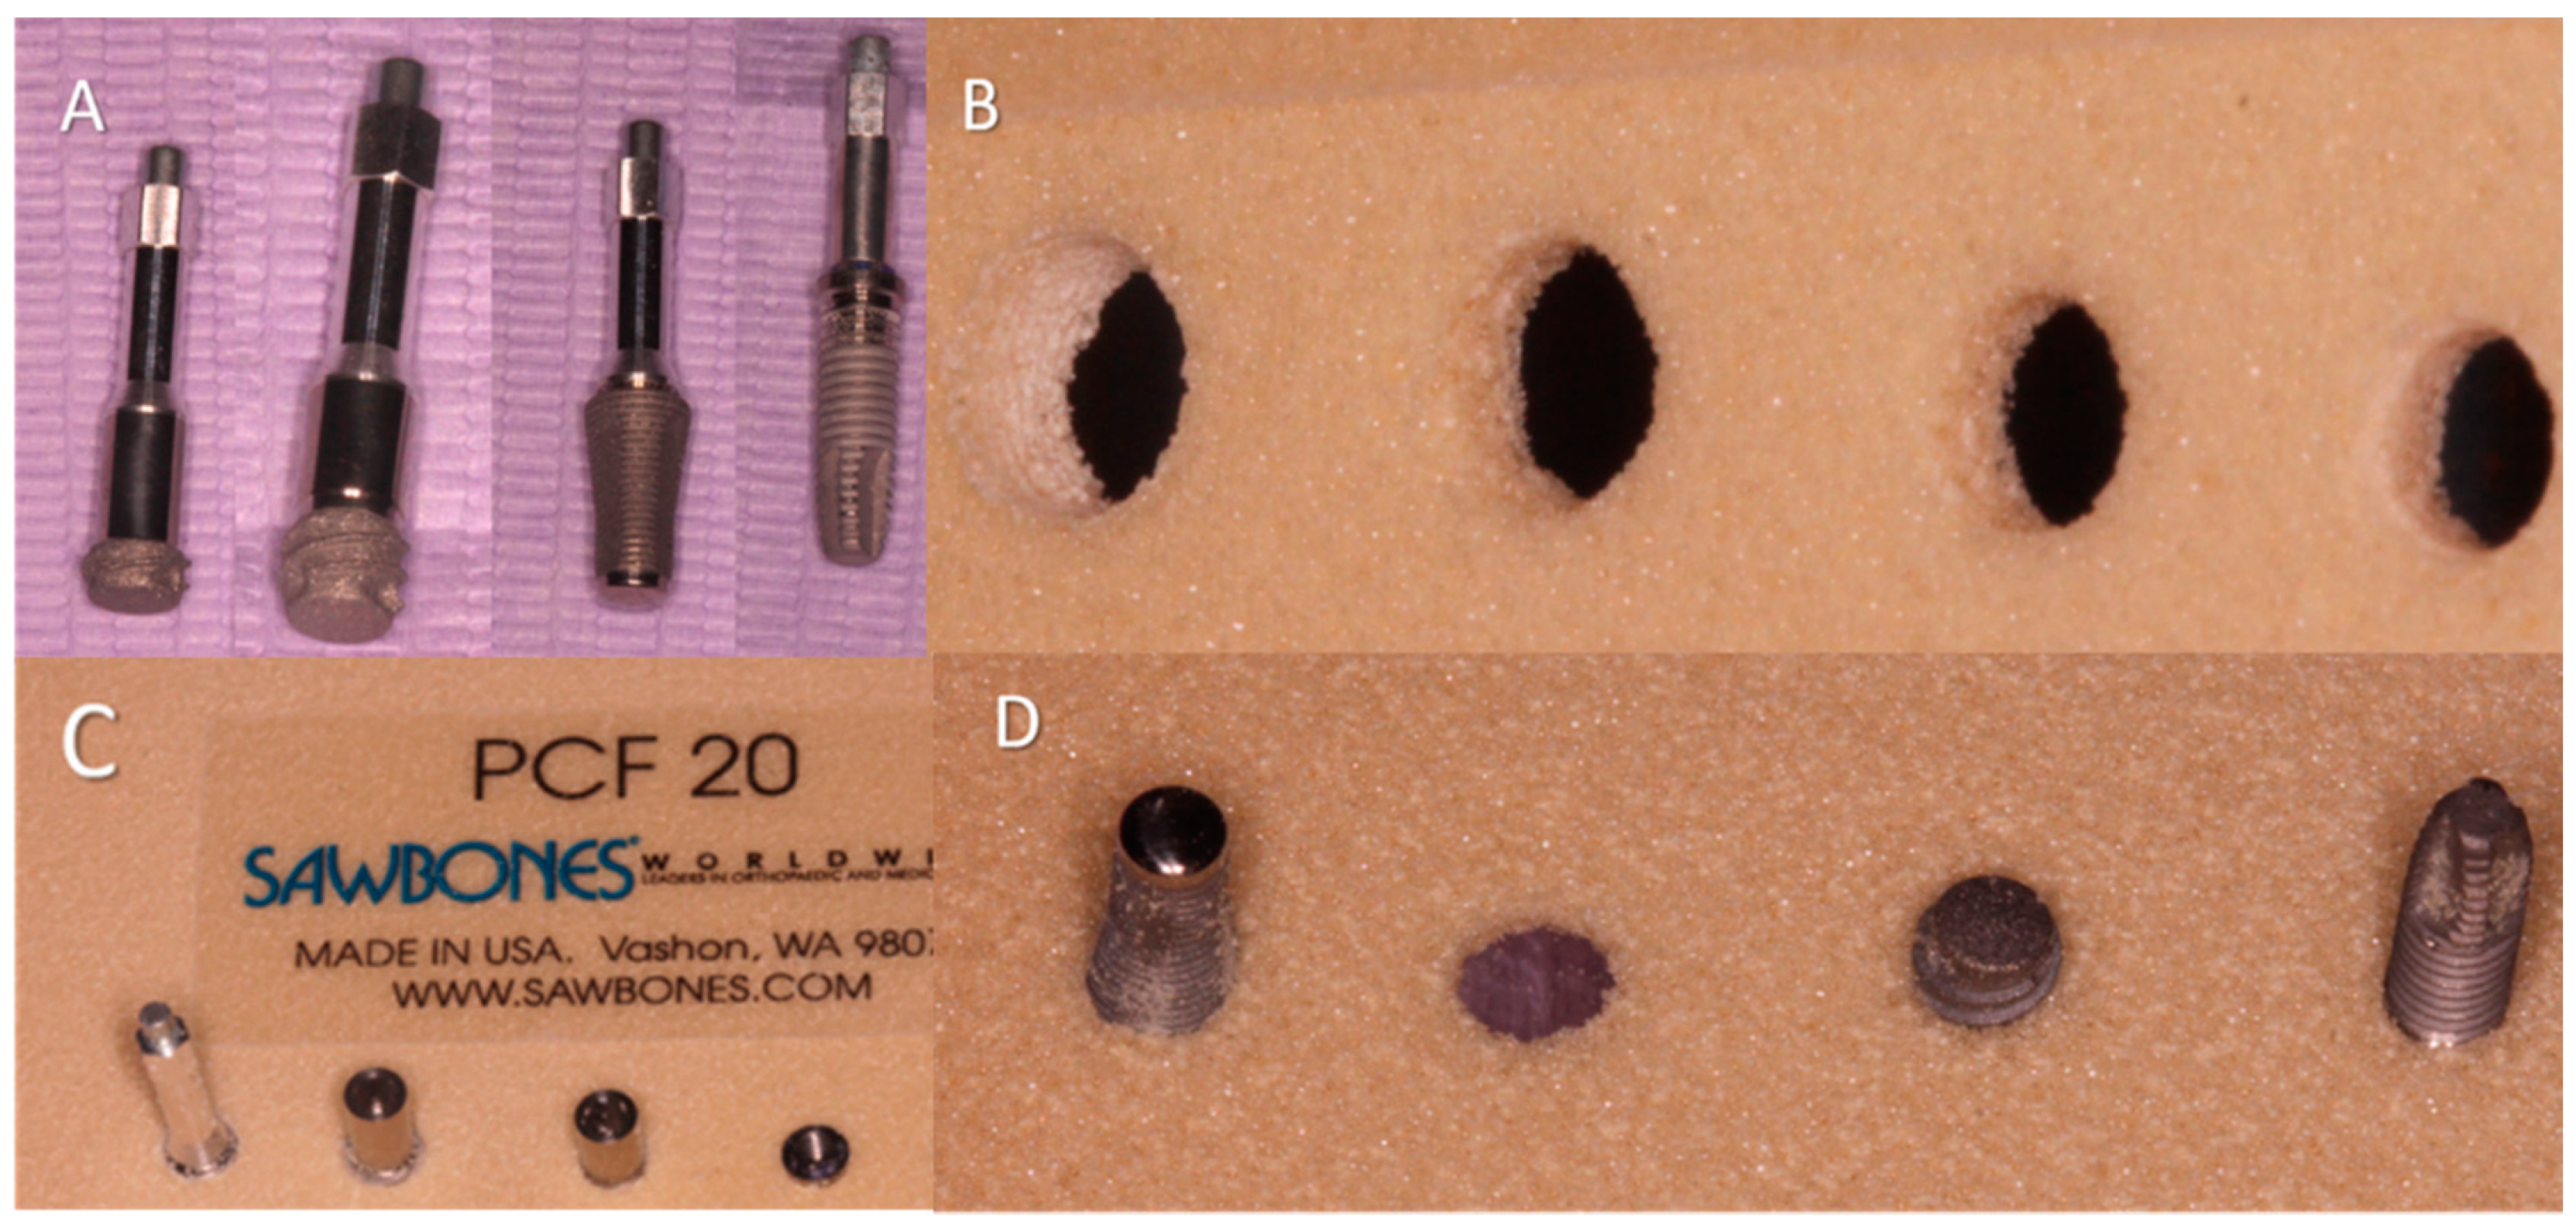
2.1. Implants
2.2. Polyurethane Foam Blocks
2.3. Experimental Design of the Study
2.4. Insertion Torque and Pull-Out Torque
2.5. Implant Drill
2.6. Resonance Frequency Analysis
2.7. Statistical Analysis
3. Results
4. Discussion
5. Conclusions
Author Contributions
Funding
Acknowledgments
Conflicts of Interest
References
- Di Stefano, D.A.; Arosio, P.; Gastaldi, G.; Gherlone, E. The insertion torque-depth curve integral as a measure of implant primary stability: An in vitro study on polyurethane foam blocks. J. Prosthet. Dent. 2018, 120, 706–714. [Google Scholar] [CrossRef] [PubMed]
- Falco, A.; Berardini, M.; Trisi, P. Correlation between implant geometry, implant surface, insertion torque, and primary stability: In vitro biomechanical analysis. Int. J. Oral Maxillofac. Implants 2018, 33, 824–830. [Google Scholar] [CrossRef] [PubMed]
- Yamaguchi, Y.; Shiota, M.; FuJii, M.; Sekiya, M.; Ozeki, M. Development and application of a direct method to observe the implant/bone interface using simulated bone. Springerplus 2016, 5, 494. [Google Scholar] [CrossRef] [PubMed]
- Tsolaki, I.N.; Tonsekar, P.P.; Najafi, B.; Drew, H.J.; Sullivan, A.J.; Petrov, S.D. Comparison of osteotome and conventional drilling techniques for primary implant stability: An in vitro study. J. Oral Implantol. 2016, 42, 321–325. [Google Scholar] [CrossRef] [PubMed]
- Gehrke, S.A.; Guirado, J.L.C.; Bettach, R.; Fabbro, M.D.; Martínez, C.P.-A.; Shibli, J.A. Evaluation of the insertion torque, implant stability quotient and drilled hole quality for different drill design: An in vitro Investigation. Clin. Oral Implants Res. 2018, 29, 656–662. [Google Scholar] [CrossRef]
- Romanos, G.E.; Delgado-Ruiz, R.A.; Sacks, D.; Calvo-Guirado, J.L. Influence of the implant diameter and bone quality on the primary stability of porous tantalum trabecular metal dental implants: An in vitro biomechanical study. Clin. Oral Implants Res. 2018, 29, 649–655. [Google Scholar] [CrossRef]
- De Oliveira, G.J.P.L.; Barros-Filho, L.A.B.; Barros, L.A.B.; Queiroz, T.P.; Marcantonio, E. In vitro evaluation of the primary stability of short and conventional implants. J. Oral Implantol. 2016, 42, 458–463. [Google Scholar] [CrossRef]
- Möhlhenrich, S.C.; Heussen, N.; Elvers, D.; Steiner, T.; Hölzle, F.; Modabber, A. Compensating for poor primary implant stability in different bone densities by varying implant geometry: A laboratory study. Int. J. Oral Maxillofac. Surg. 2015, 44, 1514–1520. [Google Scholar] [CrossRef]
- Lages, F.S.; Douglas-de Oliveira, D.W.; Costa, F.O. Relationship between implant stability measurements obtained by insertion torque and resonance frequency analysis: A systematic review. Clin. Implant. Dent. Relat. Res. 2018, 20, 26–33. [Google Scholar] [CrossRef]
- Chen, M.H.-M.; Lyons, K.M.; Tawse-Smith, A.; Ma, S. Clinical significance of the use of resonance frequency analysis in assessing implant stability: A systematic review. Int. J. Prosthodont. 2019, 32, 51–58. [Google Scholar] [CrossRef]
- Liu, L.; Gao, Y.; Zhao, J.; Yuan, L.; Li, C.; Liu, Z.; Hou, Z. A Mild method for surface-grafting PEG onto segmented poly (ester-urethane) film with high grafting density for biomedical purpose. Polymers 2018, 10, 1125. [Google Scholar] [CrossRef] [PubMed]
- Xu, W.; Xiao, M.; Yuan, L.; Zhang, J.; Hou, Z. Preparation, physicochemical properties and hemocompatibility of biodegradable chitooligosaccharide-based polyurethane. Polymers 2018, 10, 580. [Google Scholar] [CrossRef] [PubMed]
- Szperlich, P.; Toroń, B. An ultrasonic fabrication method for epoxy resin/SbSI nanowire composites, and their application in nanosensors and nanogenerators. Polymers 2019, 11, 479. [Google Scholar] [CrossRef] [PubMed]
- Misch, C.E. Bone density: A key determinant for clinical success. Contemp. Implant. Dent. 1999, 8, 109–118. [Google Scholar]
- Deporter, D.; Ogiso, B.; Sohn, D.-S.; Ruljancich, K.; Pharoah, M. Ultrashort sintered porous-surfaced dental implants used to replace posterior teeth. J. Periodontol. 2008, 79, 1280–1286. [Google Scholar] [CrossRef]
- Lombardo, G.; Pighi, J.; Marincola, M.; Corrocher, G.; Simancas-Pallares, M.; Nocini, P.F. Cumulative success rate of short and ultrashort implants supporting single crowns in the posterior maxilla: A 3-year retrospective study. Int. J. Dent. 2017, 2017, 8434281. [Google Scholar] [CrossRef]
- Markose, J.; Eshwar, S.; Srinivas, S.; Jain, V. Clinical outcomes of ultrashort sloping shoulder implant design: A survival analysis. Clin. Implant. Dent. Relat. Res. 2018, 20, 646–652. [Google Scholar] [CrossRef]
- Lemos, C.A.A.; Ferro-Alves, M.L.; Okamoto, R.; Mendonça, M.R.; Pellizzer, E.P. Short dental implants versus standard dental implants placed in the posterior jaws: A systematic review and meta-analysis. J. Dent. 2016, 47, 8–17. [Google Scholar] [CrossRef]
- Fan, T.; Li, Y.; Deng, W.-W.; Wu, T.; Zhang, W. Short implants (5 to 8 mm) versus longer implants (>8 mm) with sinus lifting in atrophic posterior maxilla: A meta-analysis of RCTs. Clin. Implant. Dent. Relat. Res. 2017, 19, 207–215. [Google Scholar] [CrossRef]
- Cruz, R.S.; Lemos, C.A.D.A.; Batista, V.E.D.S.; Gomes, J.M.D.L.; Pellizzer, E.P.; Verri, F.R. Short implants versus longer implants with maxillary sinus lift. A systematic review and meta-analysis. Braz. Oral Res. 2018, 32, e86. [Google Scholar] [CrossRef]
- Nielsen, H.B.; Schou, S.; Isidor, F.; Christensen, A.-E.; Starch-Jensen, T. Short implants (≤8 mm) compared to standard length implants (>8 mm) in conjunction with maxillary sinus floor augmentation: A systematic review and meta-analysis. Int. J. Oral Maxillofac. Surg. 2019, 48, 239–249. [Google Scholar] [CrossRef] [PubMed]
- Tolentino da Rosa de Souza, P.; Binhame Albini Martini, M.; Reis Azevedo-Alanis, L. Do short implants have similar survival rates compared to standard implants in posterior single crown? A systematic review and meta-analysis. Clin. Implant. Dent. Relat. Res. 2018, 20, 890–901. [Google Scholar] [CrossRef] [PubMed]
- Dias, F.D.; Pecorari, V.G.; Martins, C.B.; Del Fabbro, M.; Casati, M.Z. Short implants versus bone augmentation in combination with standard-length implants in posterior atrophic partially edentulous mandibles: Systematic review and meta-analysis with the Bayesian approach. Int. J. Oral Maxillofac. Surg. 2019, 48, 90–96. [Google Scholar]
- Urdaneta, R.A.; Daher, S.; Leary, J.; Emanuel, K.M.; Chuang, S.-K. The survival of ultrashort locking-taper implants. Int. J. Oral Maxillofac. Implants 2012, 27, 644–654. [Google Scholar] [PubMed]
- Piattelli, A.; Balice, P.; Scarano, A.; Perrotti, V. Short and Ultrashort Implants; Quintessence Publishing: Berlin, Germany, 2018; pp. 59–74. [Google Scholar]
- Sennerby, L.; Meredith, N. Implant stability measurements using resonance frequency analysis: Biological and biomechanical aspects and clinical implications. Periodontol. 2000 2008, 47, 51–66. [Google Scholar] [CrossRef] [PubMed]


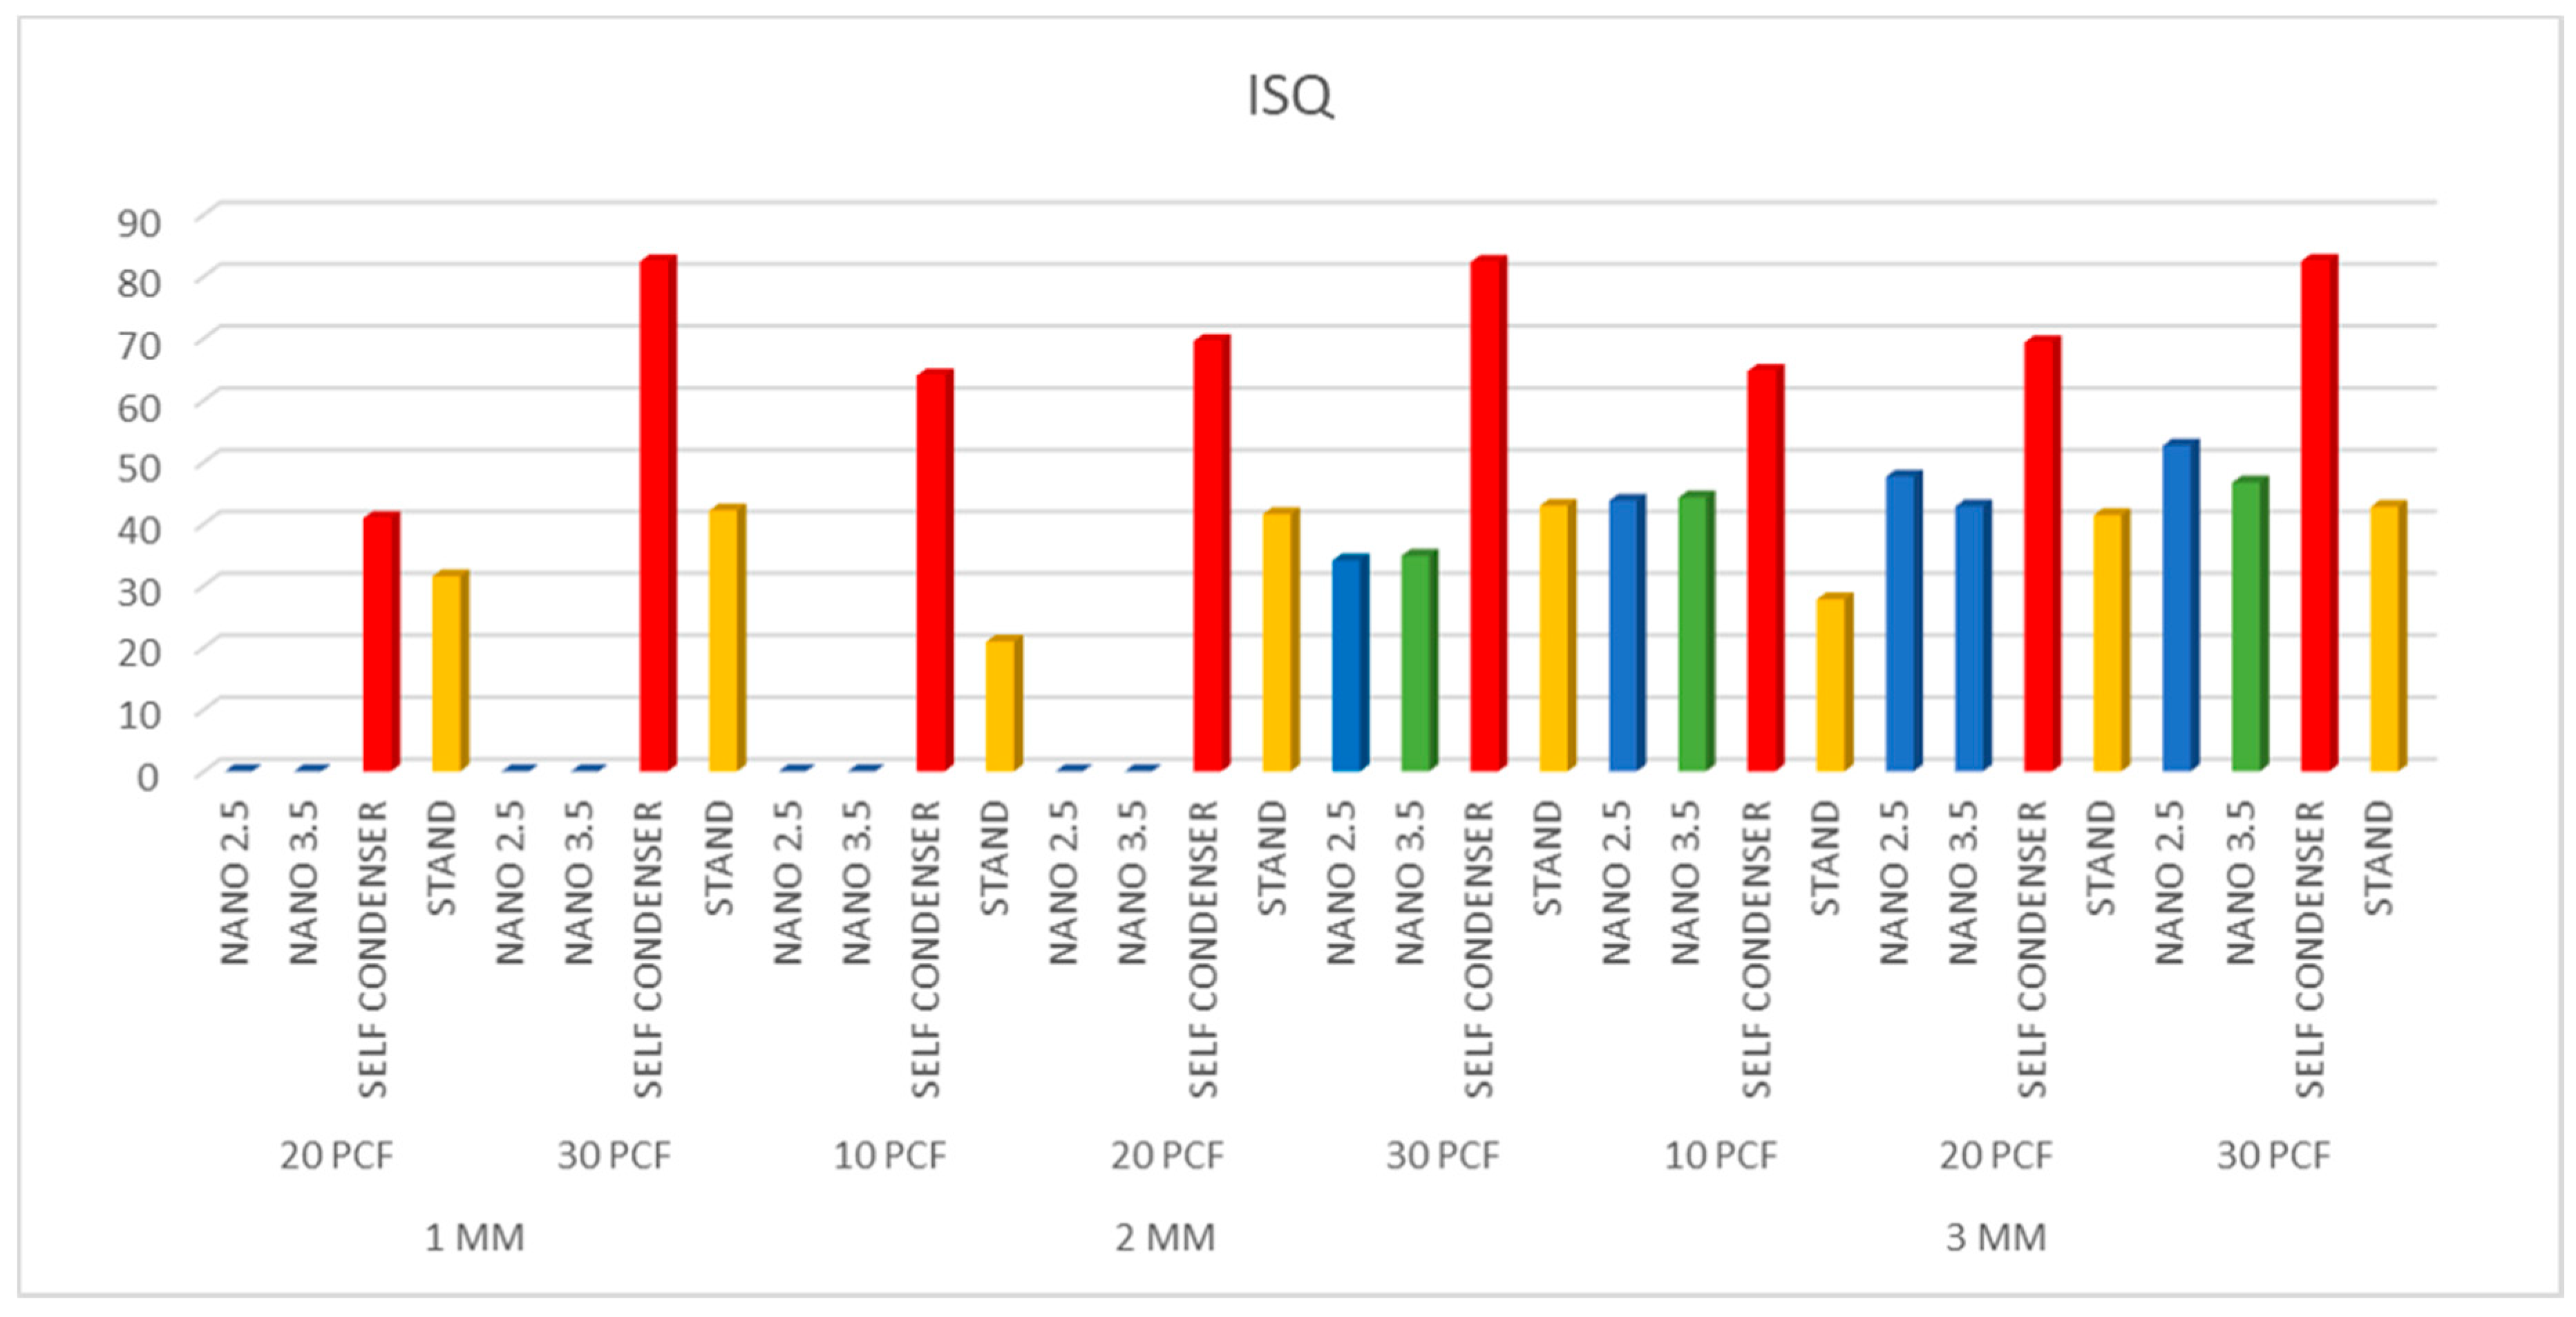
| INSERTION TORQUE | PULL OUT | RFA ANALYSIS | |||||||
|---|---|---|---|---|---|---|---|---|---|
| Groups | MEAN | SD | MEAN | SD | Pearson Correlation (r) | MEAN | SD | ||
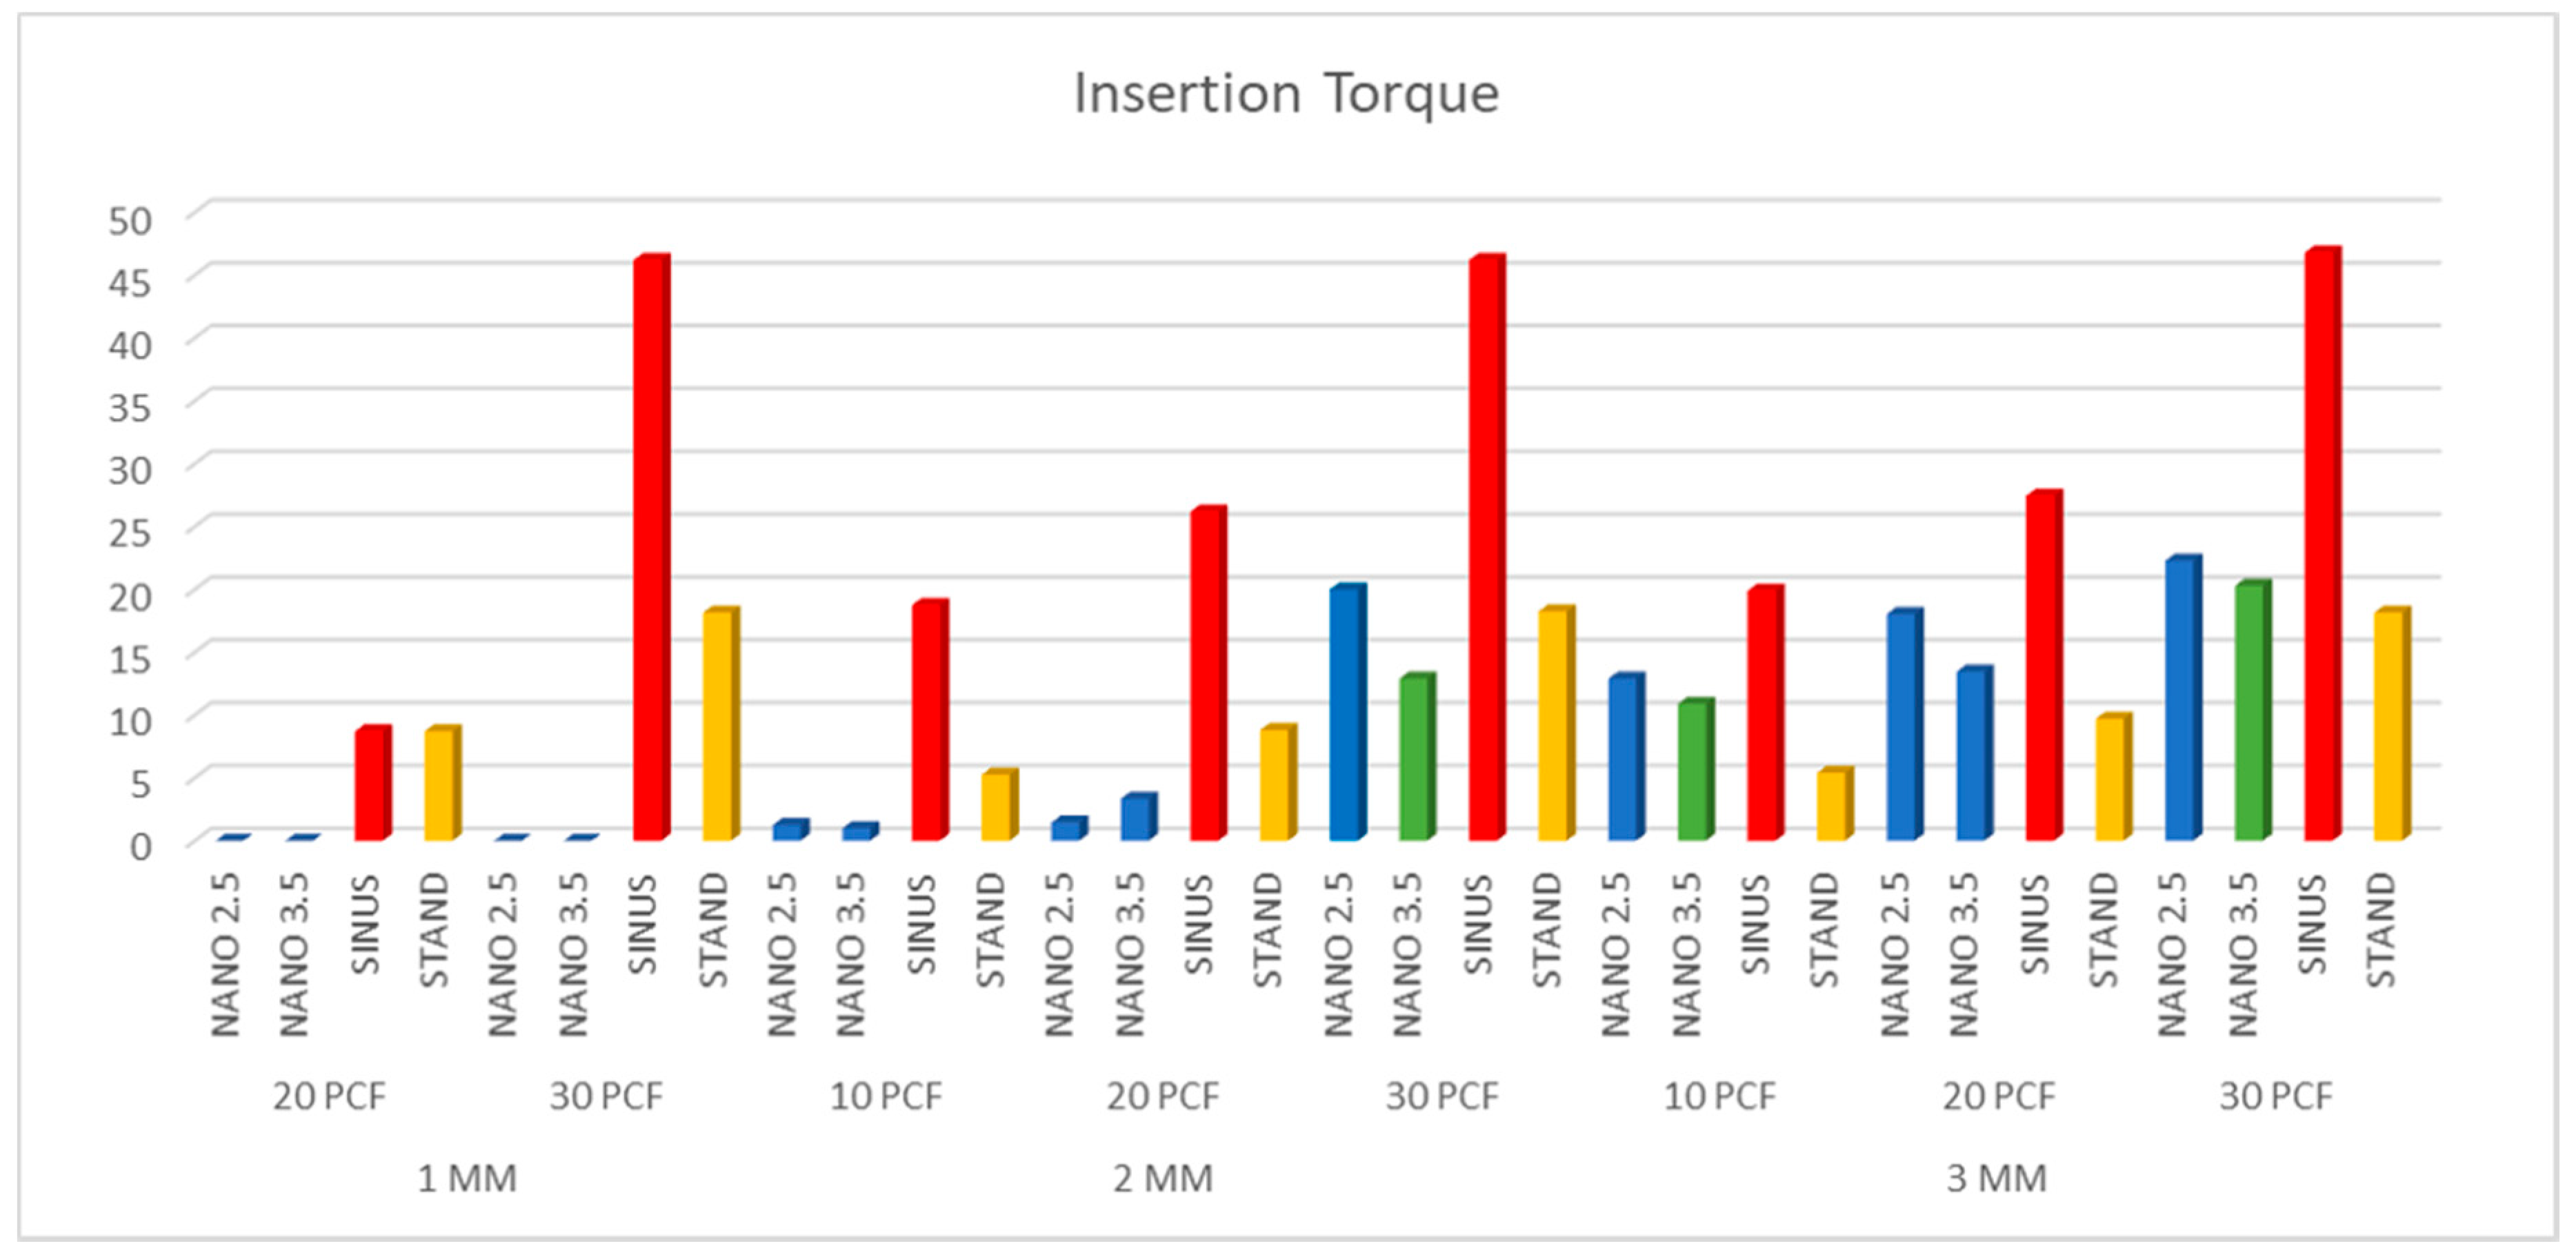
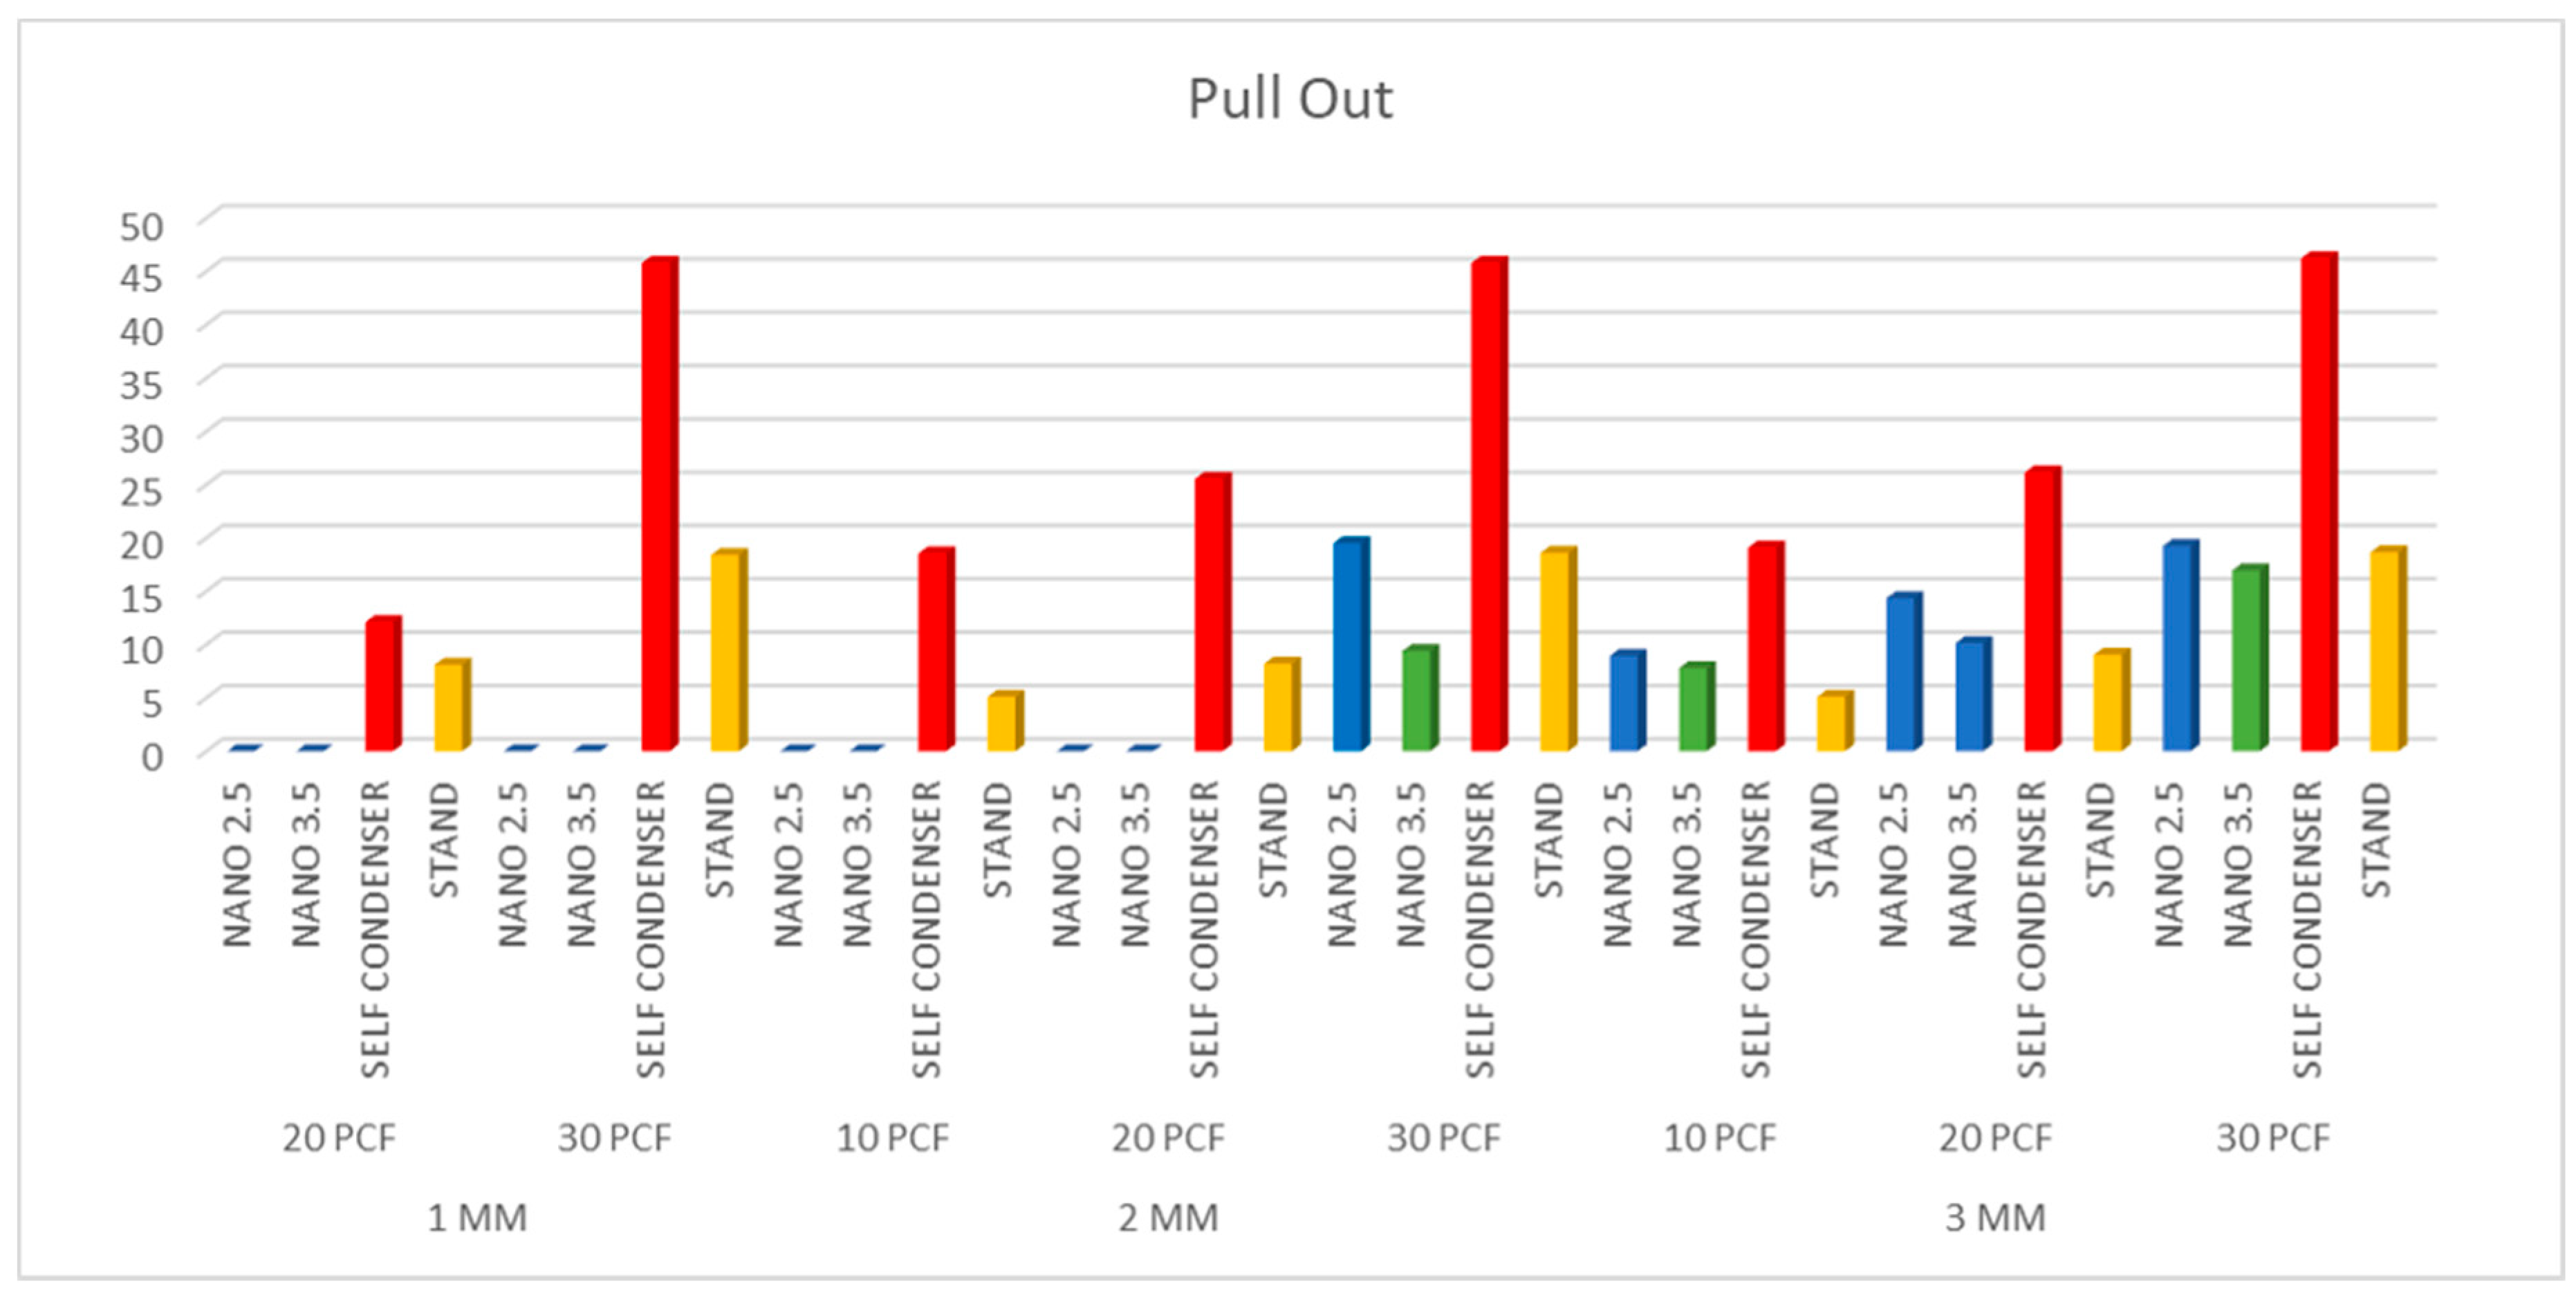
| 1 MM | 20 PCF | NANO 2.5 | 0 | 0 | 0 | 0 | 1.000 | 0 | 0 |
| NANO 3.5 | 0 | 0 | 0 | 0 | 1.000 | 0 | 0 | ||
| SELF CONDENSER | 14.14 | 2.049 | 12.1 | 1.723 | 0.69 | 40.9 | 1.107 | ||
| STAND | 10.7 | 1.625 | 8.1 | 1.518 | 0.76 | 31.5 | 1.721 | ||
| 30 PCF | NANO 2.5 | 0 | 0 | 0 | 0 | 1.000 | 0 | 0 | |
| NANO 3.5 | 0 | 0 | 0 | 0 | 1.000 | 0 | 0 | ||
| SELF CONDENSER | 46.2 | 1.704 | 45.8 | 1.508 | 0.56 | 82.43 | 1.173 | ||
| STAND | 19.15 | 1.755 | 18.4 | 1.142 | 0.72 | 42.15 | 1.065 | ||
| 2 MM | 10 PCF | NANO 2.5 | 1.25 | 2.221 | 0 | 0 | 1.000 | 0 | 0 |
| NANO 3.5 | 1 | 0.4588 | 0 | 0 | 1.000 | 0 | 0 | ||
| SELF CONDENSER | 19.75 | 2.049 | 18.55 | 1.905 | 0.75 | 64 | 1.564 | ||
| STAND | 5.25 | 0.9105 | 5.1 | 0.9119 | 0.34 | 20.93 | 2.38 | ||
| 20 PCF | NANO 2.5 | 1.45 | 2.114 | 0 | 0 | 1.000 | 0 | 0 | |
| NANO 3.5 | 3.35 | 0.7373 | 0 | 0 | 1.000 | 0 | 0 | ||
| SELF CONDENSER | 26.2 | 1.963 | 25.55 | 1.317 | 0.48 | 69.58 | 1.633 | ||
| STAND | 10.8 | 1.196 | 8.2 | 1.824 | 0.69 | 41.58 | 1.115 | ||
| 30 PCF | NANO 2.5 | 20 | 1.1 | 19.5 | 1.433 | 0.98 | 34.05 | 2.299 | |
| NANO 3.5 | 12.9 | 0.4224 | 9.4 | 2.529 | 0.61 | 34.85 | 2.529 | ||
| SELF CONDENSER | 46.2 | 1.704 | 45.8 | 1.508 | 0.36 | 82.33 | 1.321 | ||
| STAND | 19.25 | 1.803 | 18.6 | 1.667 | 0.80 | 42.93 | 1.29 | ||
| 3 MM | 10 PCF | NANO 2.5 | 12.9 | 2.222 | 8.95 | 1.986 | 0.73 | 43.75 | 2.505 |
| NANO 3.5 | 10.9 | 0.2283 | 7.8 | 1.262 | 0.61 | 44.25 | 1.262 | ||
| SELF CONDENSER | 20.9 | 1.651 | 19.1 | 1.518 | 0.56 | 64.7 | 1.712 | ||
| STAND | 8.4 | 1.353 | 5.1 | 1.373 | 0.60 | 27.78 | 2.835 | ||
| 20 PCF | NANO 2.5 | 18.05 | 2.012 | 14.35 | 2.498 | 0.60 | 47.65 | 2.72 | |
| NANO 3.5 | 13.45 | 0.3733 | 10.15 | 1.928 | 0.89 | 42.83 | 1.928 | ||
| SELF CONDENSER | 27.45 | 2.235 | 26.15 | 2.007 | 0.79 | 69.35 | 1.702 | ||
| STAND | 10.7 | 1.625 | 9.05 | 1.849 | 0.59 | 41.4 | 1.283 | ||
| 30 PCF | NANO 2.5 | 22.3 | 2.003 | 19.25 | 1.618 | 0.92 | 52.68 | 2.358 | |
| NANO 3.5 | 20.3 | 0.3332 | 16.95 | 2.047 | 0.80 | 46.68 | 2.047 | ||
| SELF CONDENSER | 46.8 | 2.042 | 46.25 | 1.832 | 0.45 | 82.5 | 1.225 | ||
| STAND | 19.15 | 1.981 | 18.65 | 1.814 | 0.80 | 42.75 | 1.323 | ||
© 2019 by the authors. Licensee MDPI, Basel, Switzerland. This article is an open access article distributed under the terms and conditions of the Creative Commons Attribution (CC BY) license (http://creativecommons.org/licenses/by/4.0/).
Share and Cite
Comuzzi, L.; Iezzi, G.; Piattelli, A.; Tumedei, M. An In Vitro Evaluation, on Polyurethane Foam Sheets, of the Insertion Torque (IT) Values, Pull-Out Torque Values, and Resonance Frequency Analysis (RFA) of NanoShort Dental Implants. Polymers 2019, 11, 1020. https://doi.org/10.3390/polym11061020
Comuzzi L, Iezzi G, Piattelli A, Tumedei M. An In Vitro Evaluation, on Polyurethane Foam Sheets, of the Insertion Torque (IT) Values, Pull-Out Torque Values, and Resonance Frequency Analysis (RFA) of NanoShort Dental Implants. Polymers. 2019; 11(6):1020. https://doi.org/10.3390/polym11061020
Chicago/Turabian StyleComuzzi, Luca, Giovanna Iezzi, Adriano Piattelli, and Margherita Tumedei. 2019. "An In Vitro Evaluation, on Polyurethane Foam Sheets, of the Insertion Torque (IT) Values, Pull-Out Torque Values, and Resonance Frequency Analysis (RFA) of NanoShort Dental Implants" Polymers 11, no. 6: 1020. https://doi.org/10.3390/polym11061020
APA StyleComuzzi, L., Iezzi, G., Piattelli, A., & Tumedei, M. (2019). An In Vitro Evaluation, on Polyurethane Foam Sheets, of the Insertion Torque (IT) Values, Pull-Out Torque Values, and Resonance Frequency Analysis (RFA) of NanoShort Dental Implants. Polymers, 11(6), 1020. https://doi.org/10.3390/polym11061020